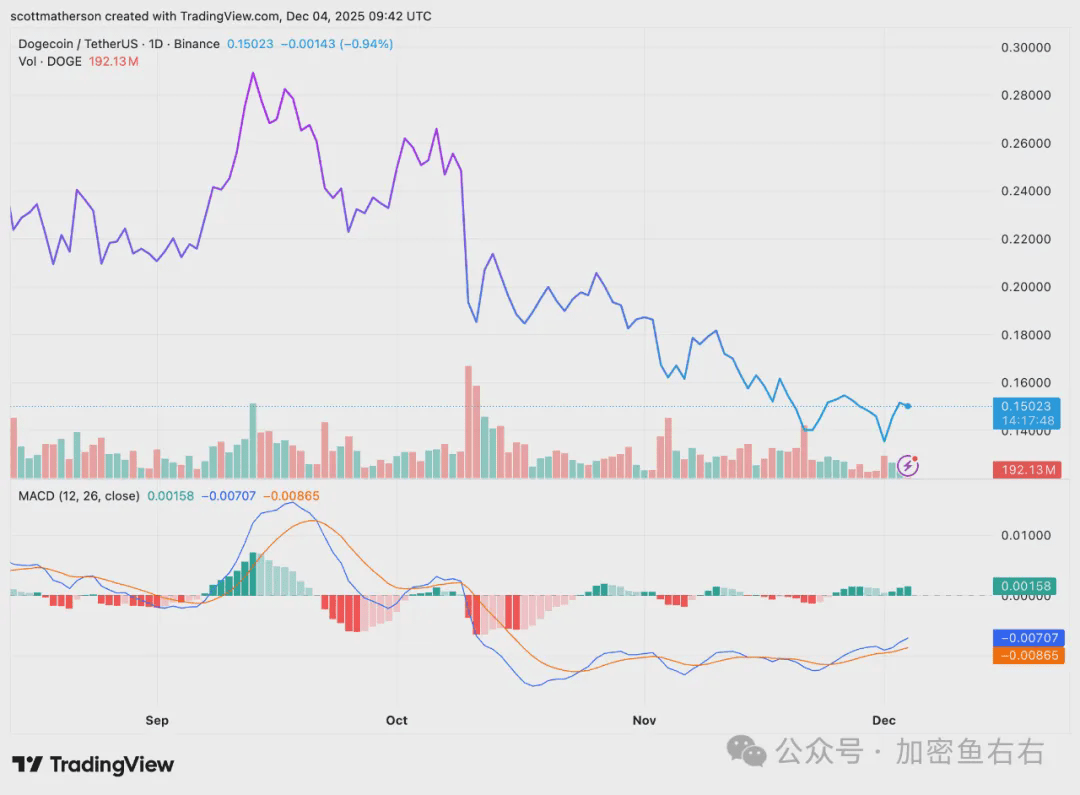
Dogecoin has formed a clear descending wedge pattern on its 12-hour chart after a continuous 30-day decline, and the price is gradually approaching the upper resistance line. This classic technical structure usually indicates a depletion of downward momentum, and if effectively broken, it may trigger a strong rebound of up to 96%. Although the overall trend has not reversed yet, the narrowing wedge and multiple attempts to test upward have released early signs of a trend reversal.
📊 Technical pattern analysis: Breakout logic of the descending wedge
Pattern characteristics:
Structure definition: Two downward converging trendlines form a price channel
Market meaning: Selling pressure gradually weakens, while buying quietly accumulates
Current Status: Price has tested the upper band multiple times, showing characteristics of accumulation before a breakout
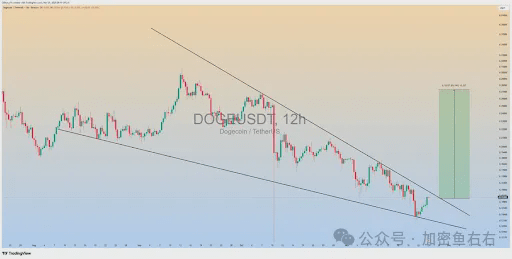
Key Price Behavior:
Recent Rebound: Recovered from a low of 0.135 USD, forming a series of green candlesticks
Resistance Test: Approaching the wedge's upper band, whether it breaks or not will determine the short-term direction
Time Window: Positive fluctuations have been observed in the past 48 hours
🎯 Breakthrough Conditions and Target Calculation
Key Factors for Successful Breakthrough:
Candlestick Confirmation: A strong breakthrough candlestick needs to appear
Volume Coordination: Increase trading volume to validate buyers' determination
Sustained Stability: After the breakout, it must maintain above the trend line
Target Price Projection:
Technical Objective: Breakthrough potential increase of 96%
Calculation Logic: Based on wedge vertical height projection
Risk Warning: If there is no momentum support, it may pull back to 0.13 USD support
⚖️ Bull-Bear Game and Market Environment
Positive Signal:
Wedge narrowing to the end, increasing probability of a trend change
Price has shown a willingness to rise
After a long-term decline, there is a demand for a rebound in the technical chart
Risk Factors:
Overall market sentiment remains cautious
Need to guard against rapid pullbacks after false breakouts
Bitcoin's trend significantly impacts the meme coin sector
Operational Strategy: It is recommended to adopt a 'breakout follow' strategy, engaging after breaking through the wedge's upper band with increased volume. Initial stop-loss set at the low of the breakout candlestick. If the breakout fails and falls back, pay attention to support performance around 0.13 USD, waiting for the next stabilization signal.
When the price oscillates repeatedly within a narrow channel, it often indicates that a big market move is brewing. The descending wedge is both a technical pattern and a reflection of market psychology— the deeper the current suppression, the more intense the subsequent release may be.
Market conditions change rapidly, specific entry and exit points should be determined in real time. Follow the trend after a breakout! No matter how confident you are, please strictly implement stop-loss strategies! That's all for today! Follow me, don't get lost!


