I have been trading cryptocurrencies for 10 years, a professional trader for 6 years, born in 1990, and I have reached a stage of doing as I please. I went from 500,000 to 75,540,000, all because I diligently followed these rules and practical tips!
What truly changed my destiny was a day four years ago! Since then, I have regained everything I lost!
At that time, I organized all the trading lists and looked at them carefully many times. My feelings were mixed; it left a deep impression. There were more than 1,000 trading records in total, among which nearly 700 were losses, and only about 300 were profitable. Overall, I lost a lot and made little, with over 200 of those being significant losses, so during those years, I was generally at a loss. In fact, looking at this trading record, there are significant problems. The first reaction is greed; when I see those big losses, I recall the situations at that time. I was reluctant to take profits when I had them and unwilling to cut losses when I was losing, which fundamentally caused the large losses in the end.
Some small losses are mainly due to unclear current thinking, lack of grasp, operating with luck, insufficient research, and blindly entering the market, resulting in many small losses; in the end, the total loss is significant, fundamentally due to unclear or unsteady entry points. Upon summarization, it becomes clear that the truly good entry points should be the initiation points of price increases. Some unclear entry points occur during range fluctuations when the situation is unclear, leading to an increase in small losses, like boiling a frog in warm water, and by the time you think about it, it's already too late.

Later, summarize, reflect, list problems, think a lot, really put all my thoughts into it, later I researched the technology and content carefully, summarized it into my own method, and now it is handy to use!
Today I also share with my fans, hoping it helps you. If you find it useful, remember to like and save it!#ETH走势分析
Because I have been through the rain, I want to hold an umbrella for everyone, heartfelt words ❤️
If I had to choose only one trading strategy, I would definitely choose market structure trading—this thing is really useful and is one of the most core and effective tools in technical analysis. But there is a premise: you must use it correctly; if misused, you will still suffer significant losses.
Today I will share with you all the two major market structure trading strategies I am using in practice, from the basics of identifying highs and lows to specific entry and exit, explained step by step, so that beginners can implement directly. Without further ado, let's get straight to the valuable content!
Basic premise
First learn to identify 'main highs and lows'
Two rules to avoid pitfalls
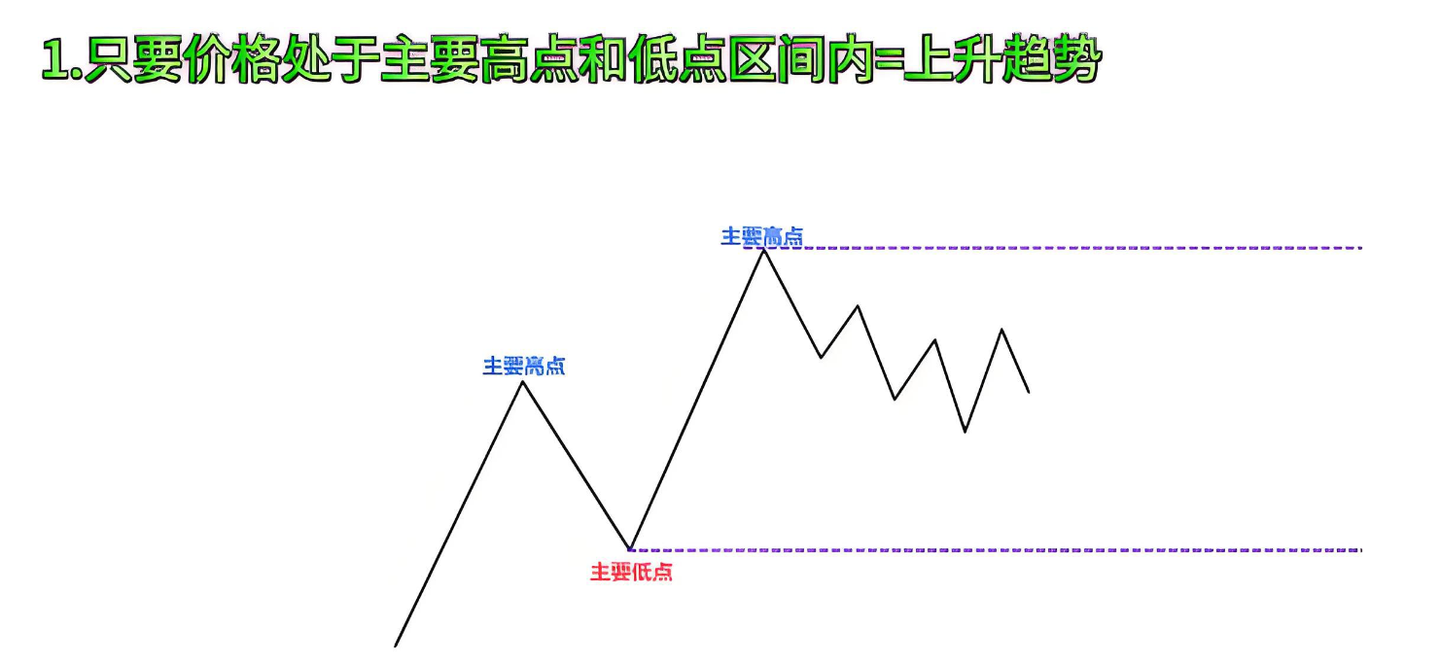
Using market structure trading, the first step is also the most critical step: you must be able to recognize the 'main highs' and 'main lows' of the price. First, let's look at a simplified diagram to help everyone establish basic understanding:
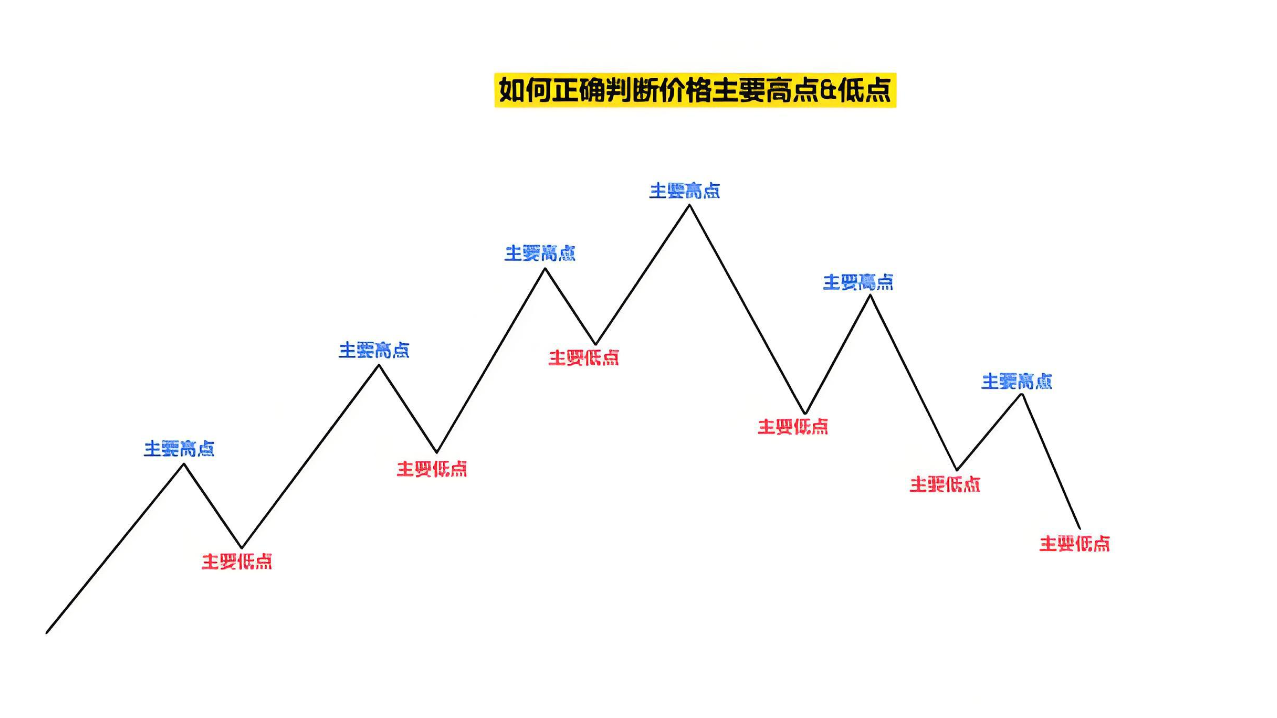
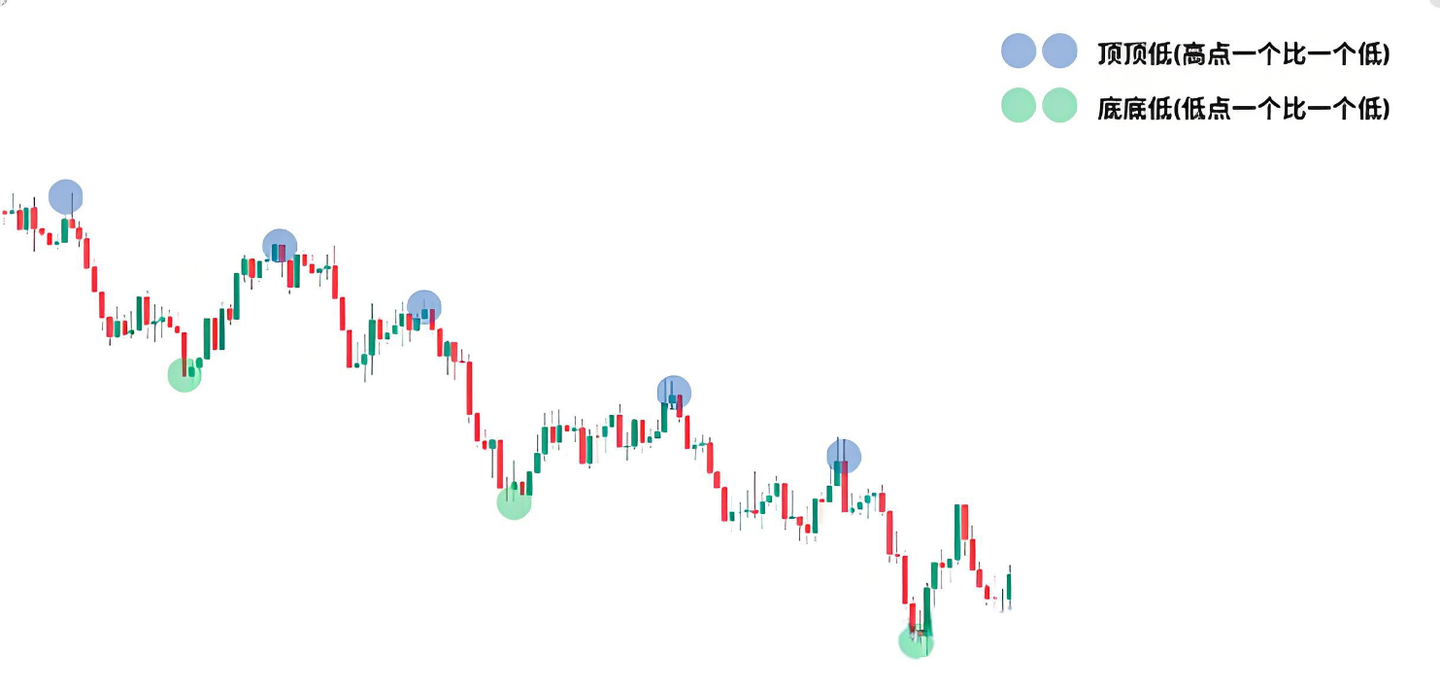
In an uptrend, the main lows are formed by each price pullback, and the main highs are formed after breaking the previous main high; thus, the structure of 'top top high, bottom bottom high' continues to appear repeatedly, and the uptrend continues. Until this structure is broken—when the price breaks below the previous main low, forming a 'bottom bottom low' structure, the uptrend ends and is likely to reverse into a downtrend.
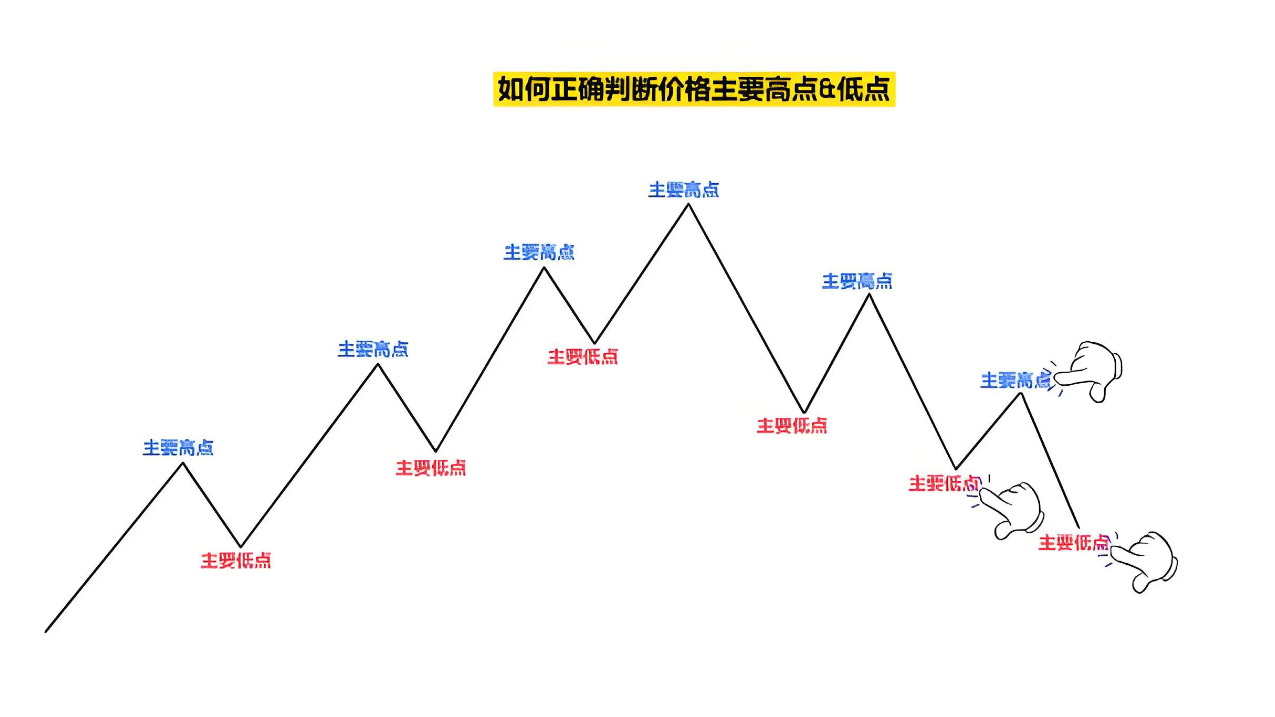
The downtrend is the same: prices rally and pull back to form main highs, then continue to break the previous main lows to form new main lows, and the structure of 'top top low, bottom bottom low' continues until it is broken and reversed.
Here I must remind you: the simplified chart I provided earlier does not reflect the actual market behavior, which is not a straight line rising or falling. For example, in an uptrend, prices may first have a small pullback and then break through; it won't be all bullish candles; similarly, downtrends will not be all bearish candles. Therefore, relying solely on intuition to identify highs and lows is definitely not enough; strict rules must be established to ensure consistency in analysis and trading.
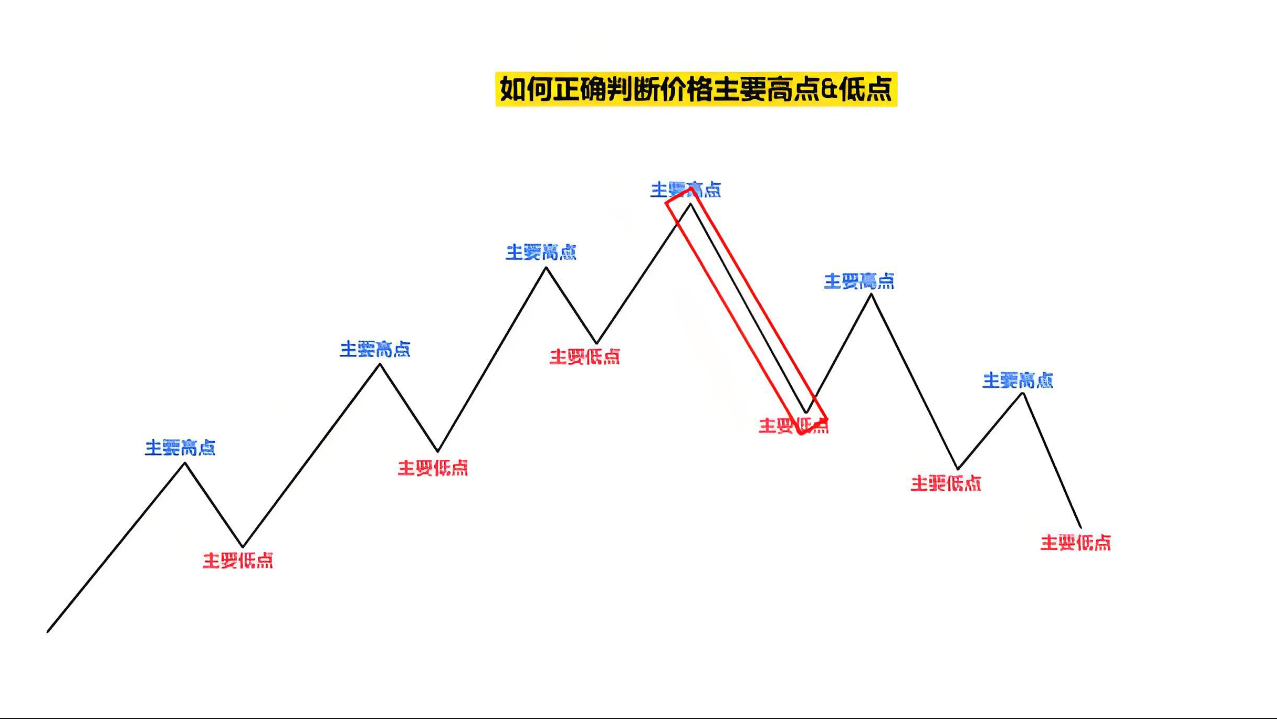
Rule 1: Before breaking the main low/high, all fluctuations are pullbacks.
When the price breaks through the previous main high and forms a new main high, as long as it does not break the main low of this wave, regardless of how much it fluctuates in between, all belong to the normal pullback of the current uptrend, and the trend does not change. This way you can avoid being confused by intermediate minor trend structures and misjudging the trend direction.
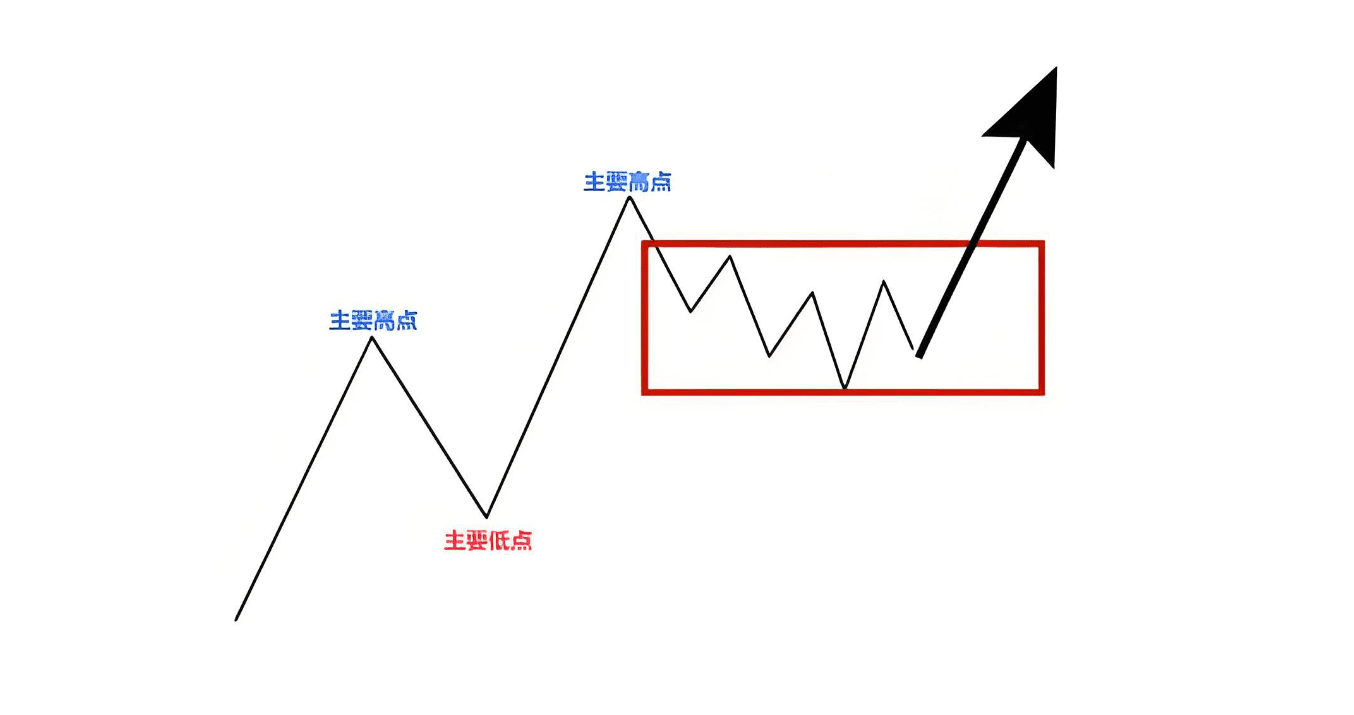
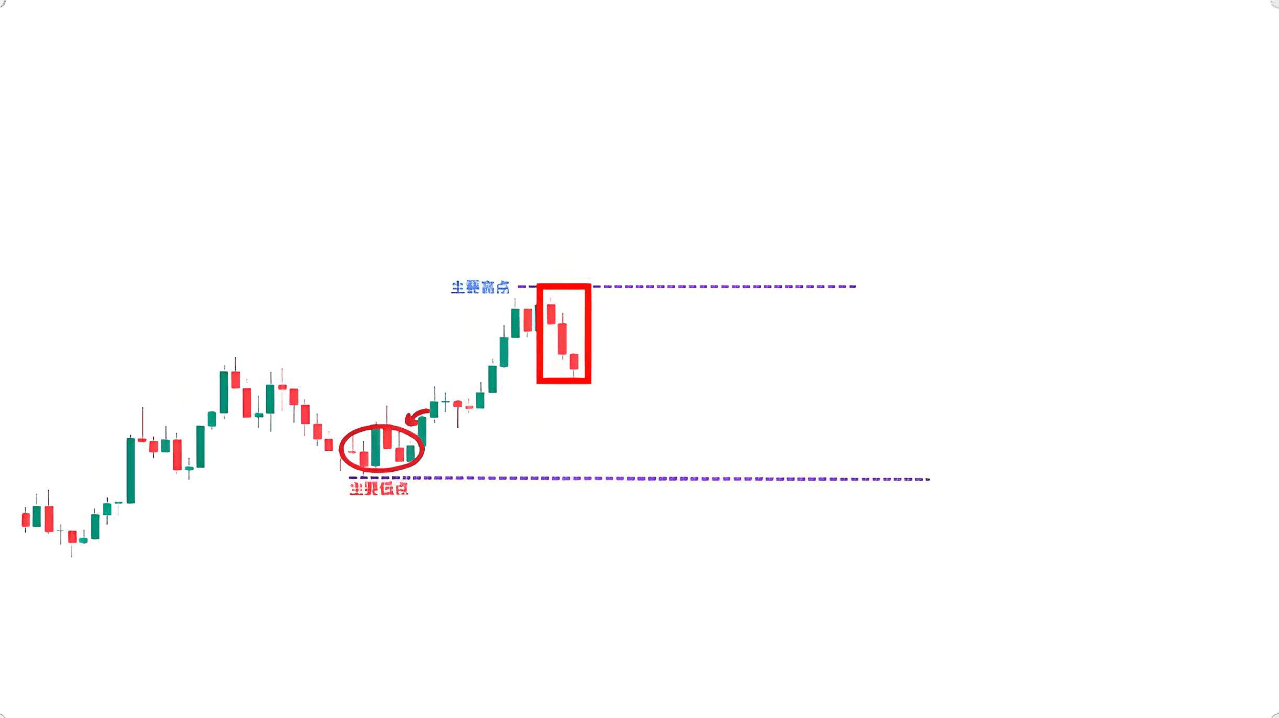
Rule 2: A callback must have at least 3 candles to be considered a valid callback (to define the main highs and lows)
In real market situations, prices will have many small pullbacks after a breakout, but not all pullbacks can be considered 'valid pullbacks', and they cannot be used to determine the main highs and lows. My rule is: at least 3 candles of pullback are required to be considered a valid pullback, which can form new main highs and lows.
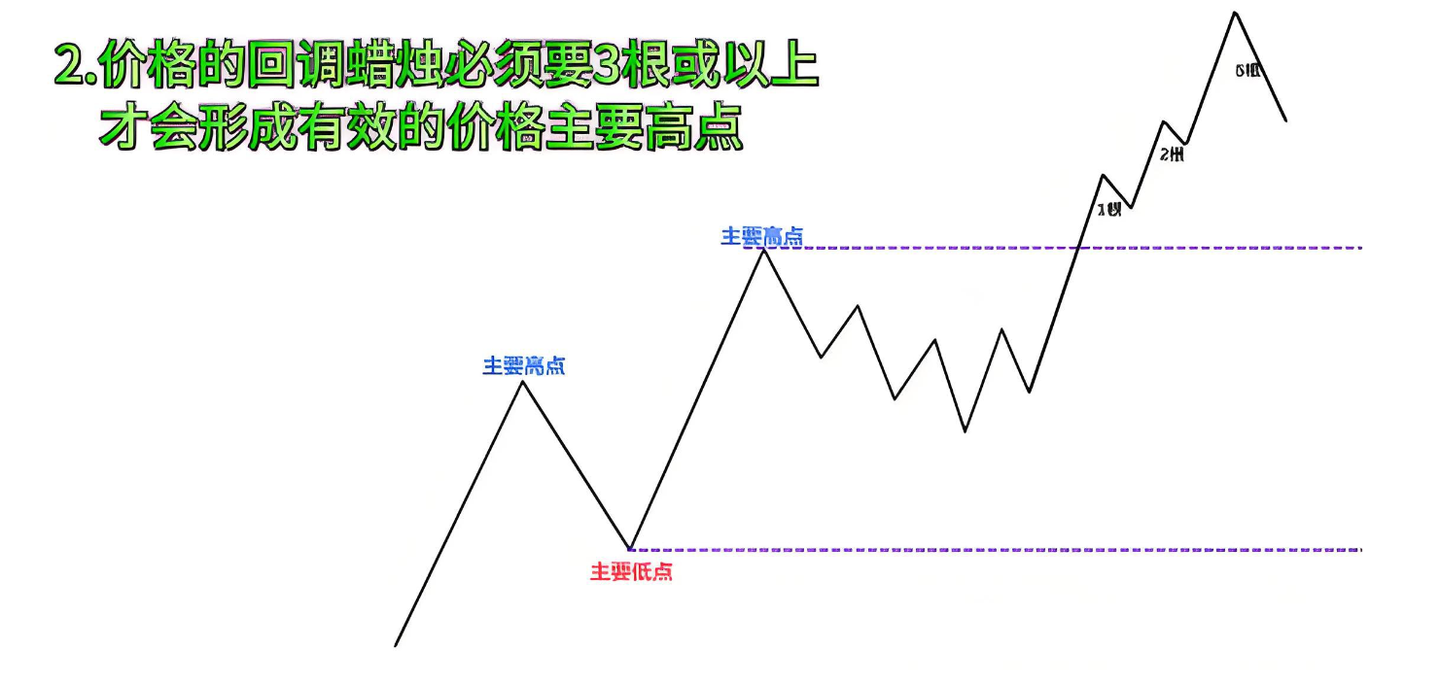
For example, in the small pullback shown in the chart: pullbacks of 1 or 2 candles do not count; only when a pullback of 5 candles occurs does the high point formed count as the main high; correspondingly, the starting low of this wave of rally is the main low. As long as the price fluctuates between these two main highs and lows, it is a normal pullback of the uptrend.

The core function of this rule: to prevent you from being confused by small fluctuations and minor structures within the trend, leading to incorrect trading decisions.
Let's verify with a downtrend:
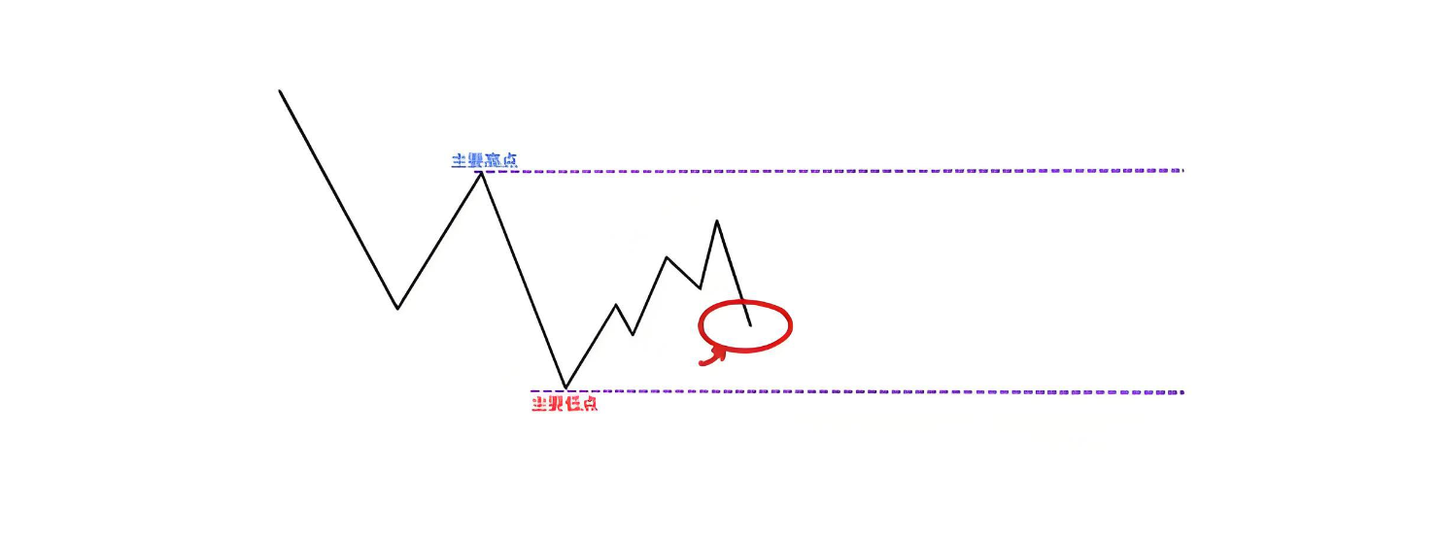
How to determine whether a certain low point is an effective main low? Look at the preceding rally pullback; it must have 3 or more candles. Once the main low and main high are determined, as long as the price fluctuates within this range, it is a normal pullback of the downtrend. Until the price breaks below the main low, the new main high is set at the starting point of this wave of decline; subsequent pullbacks must have at least 3 candles, and the formed low point is the new main low.
Strategy 1
Trend structure reversal strategy
Capture the first wave of trend reversal
The core logic of this strategy: enter the market as soon as the price trend clearly reverses, capturing the main wave of the trend after the reversal, maximizing profit potential. Let's look at practical cases directly:
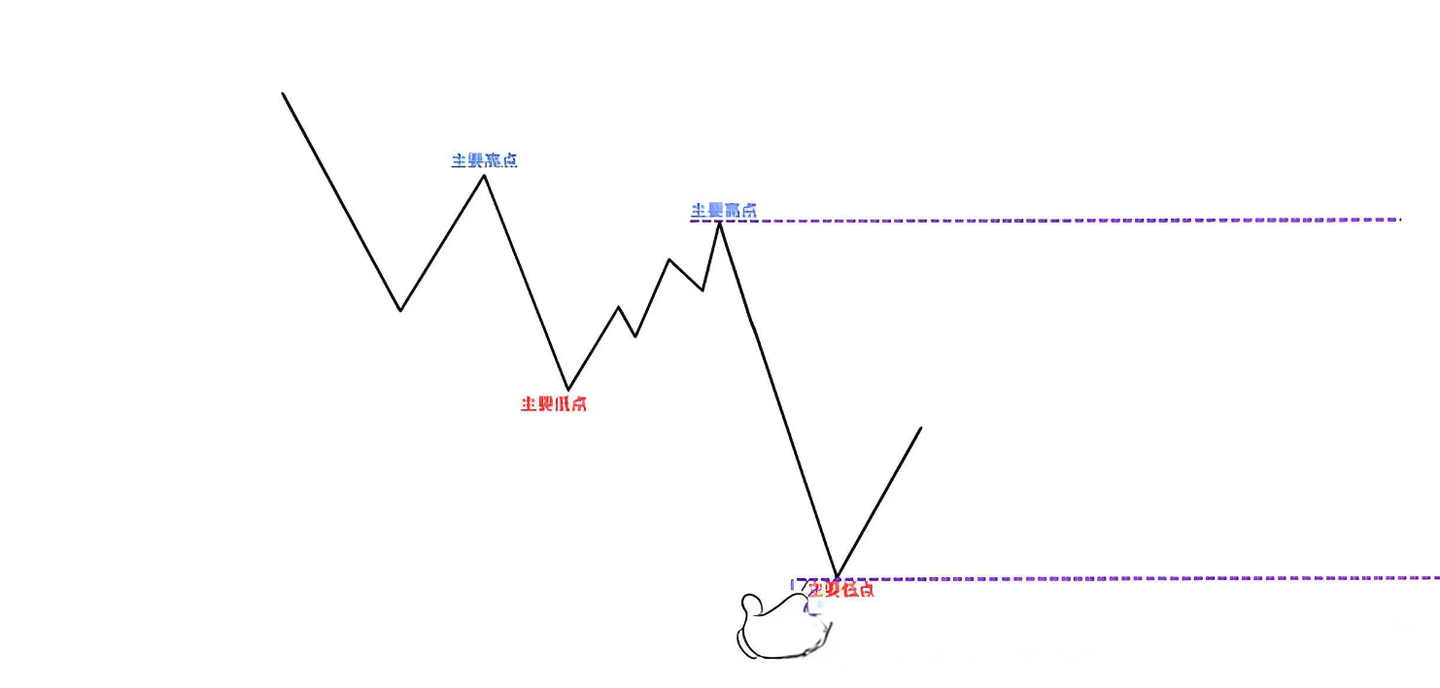
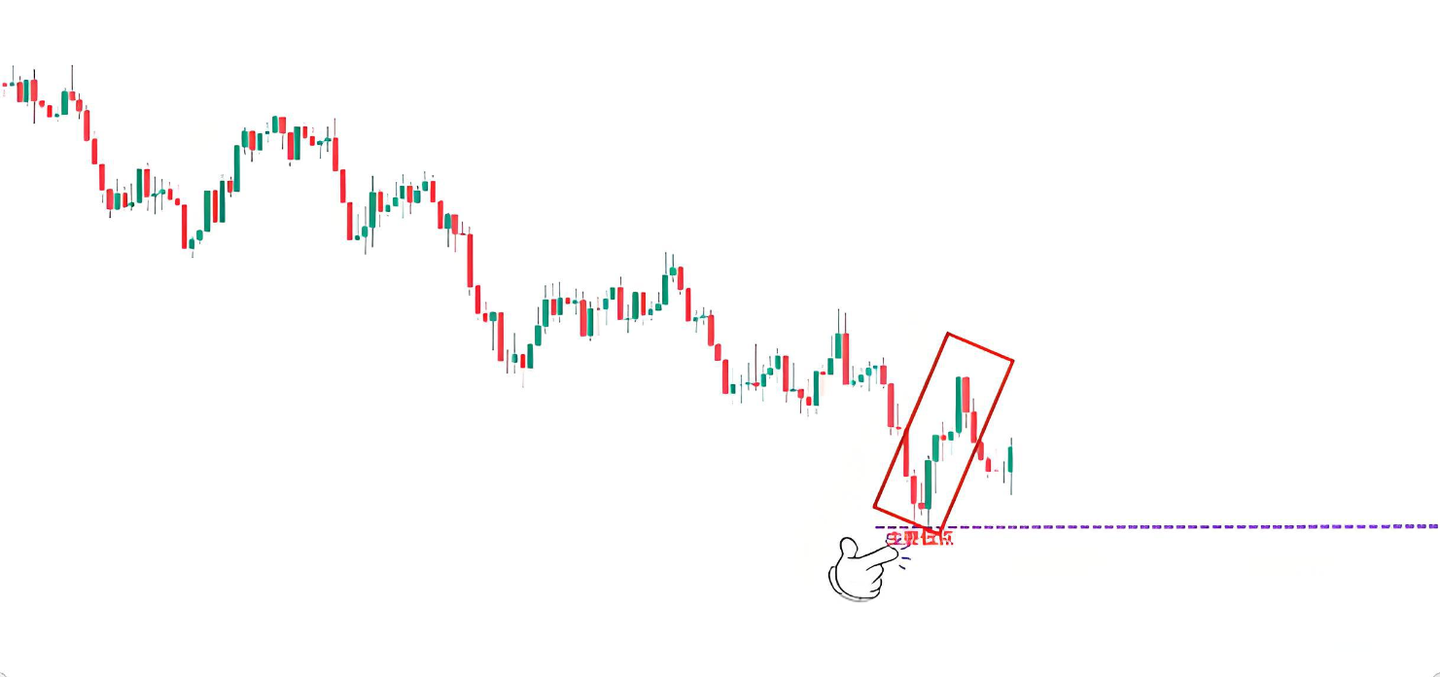
Step 1: First judge the current trend + find the main highs and lows. In the chart, the price is clearly in a downtrend, and the structure of 'top top low, bottom bottom high' is very clear. First, find the main low: look at the number of pullback candles, this pullback exceeds 3 candles, so this low is the main low; the main high is the starting point of this wave of decline creating a new low.
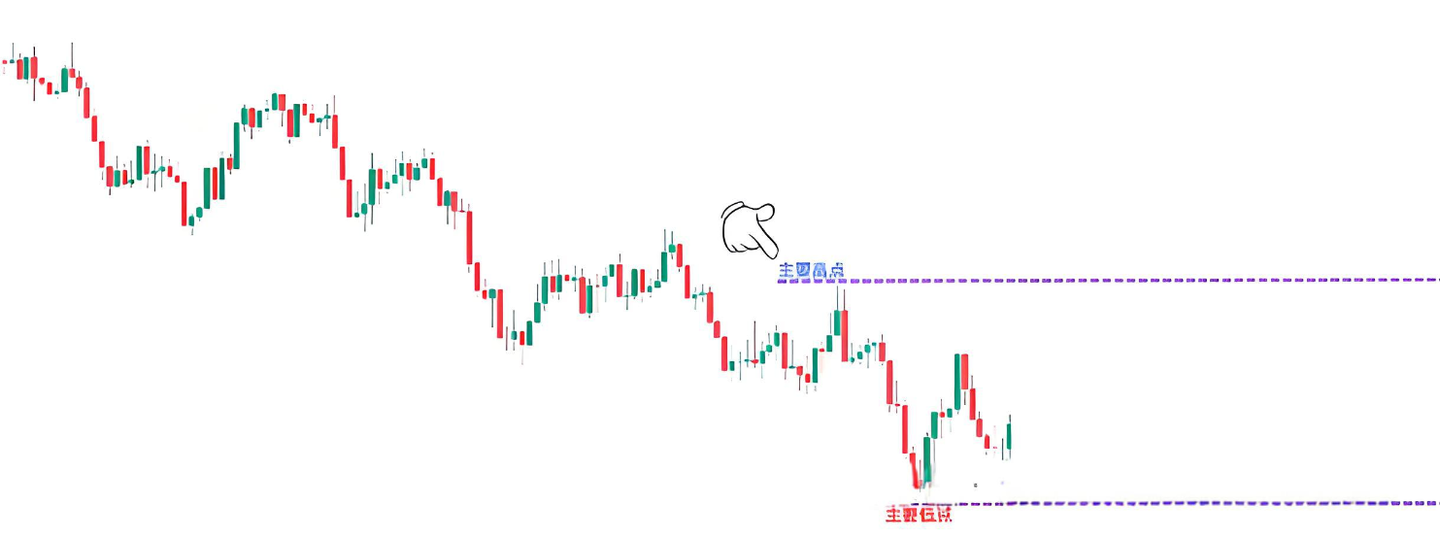
Step 2: Identify trend reversal signals. As long as the price fluctuates within the main highs and lows interval, regardless of how it consolidates.
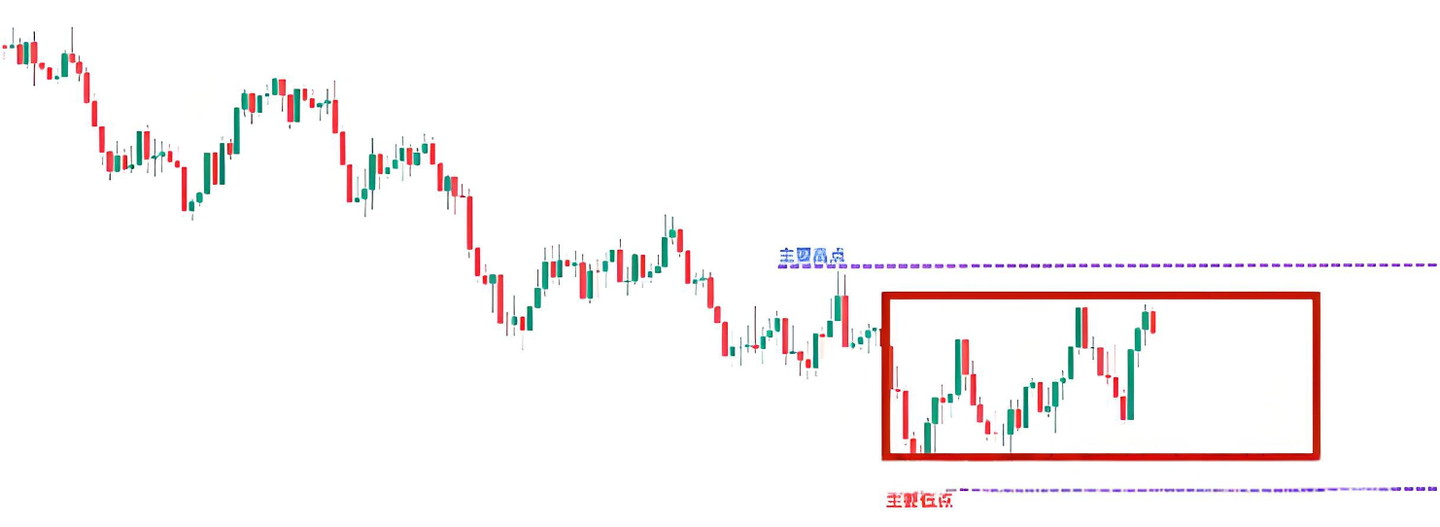
They are just pullbacks of the downtrend. Until the price breaks above the previous main high.
Forming a 'top top high' structure—this indicates that the downtrend is likely to end and reverse into an uptrend.

Step 3: Find the key price level + wait for confirmation signals to enter. After the trend reversal, do not enter blindly; look for key price levels. The most secure position is at the 'previous main high that has broken through and turned into a support level'. Wait for the price to pull back to this support level and then wait for the bullish candlestick signal confirmation—here a bullish engulfing pattern appears, with the bullish candle completely covering the previous bearish candle, indicating strong bullish momentum, and the price is likely to rebound at this position.

Step 4: Set the stop loss. Set the stop loss below the key price level and recent low, plus 1 ATR value. Using ATR is to allow enough room for price fluctuations, avoiding being stopped out by false breakdowns.
Let's look at another example of an uptrend turning into a downtrend:
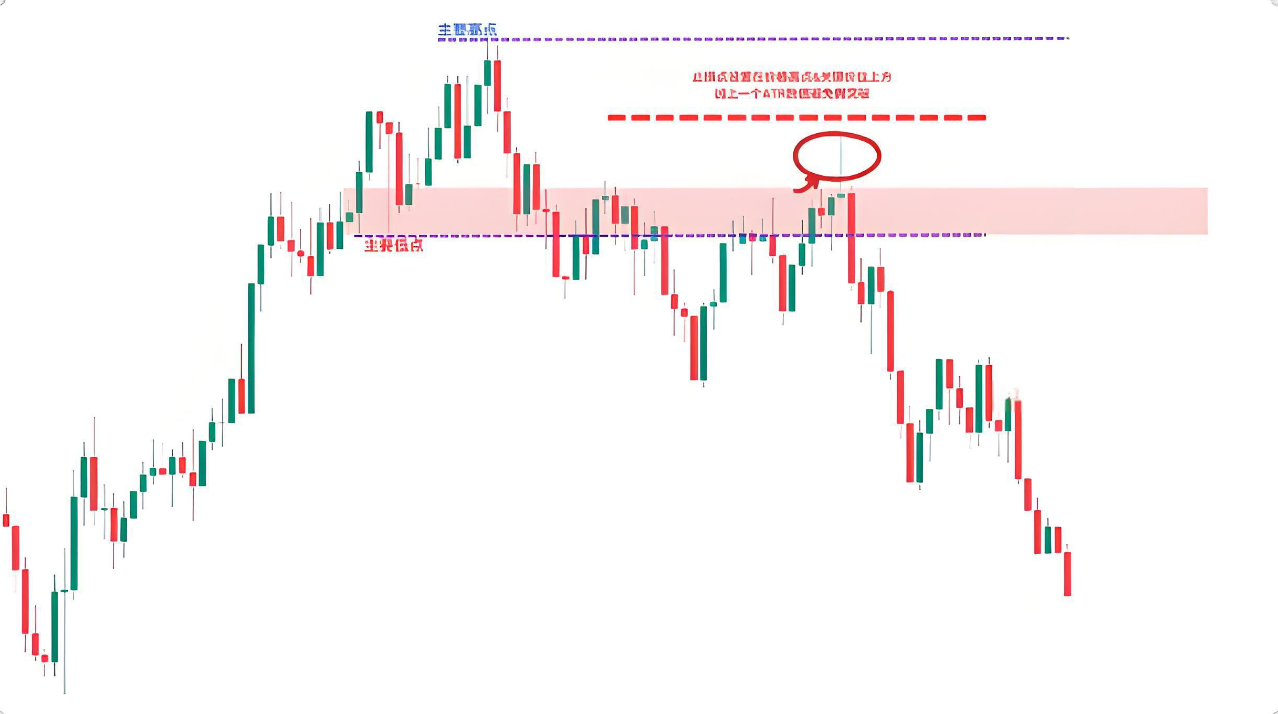
Currently, it is an uptrend, and the 'top top high, bottom bottom high' structure is clear. The main high is formed by this pullback exceeding 3 candles, and the main low is the starting point of this rally. When the price breaks below the main low, forming a 'bottom bottom low' structure, the uptrend ends and reverses into a downtrend.
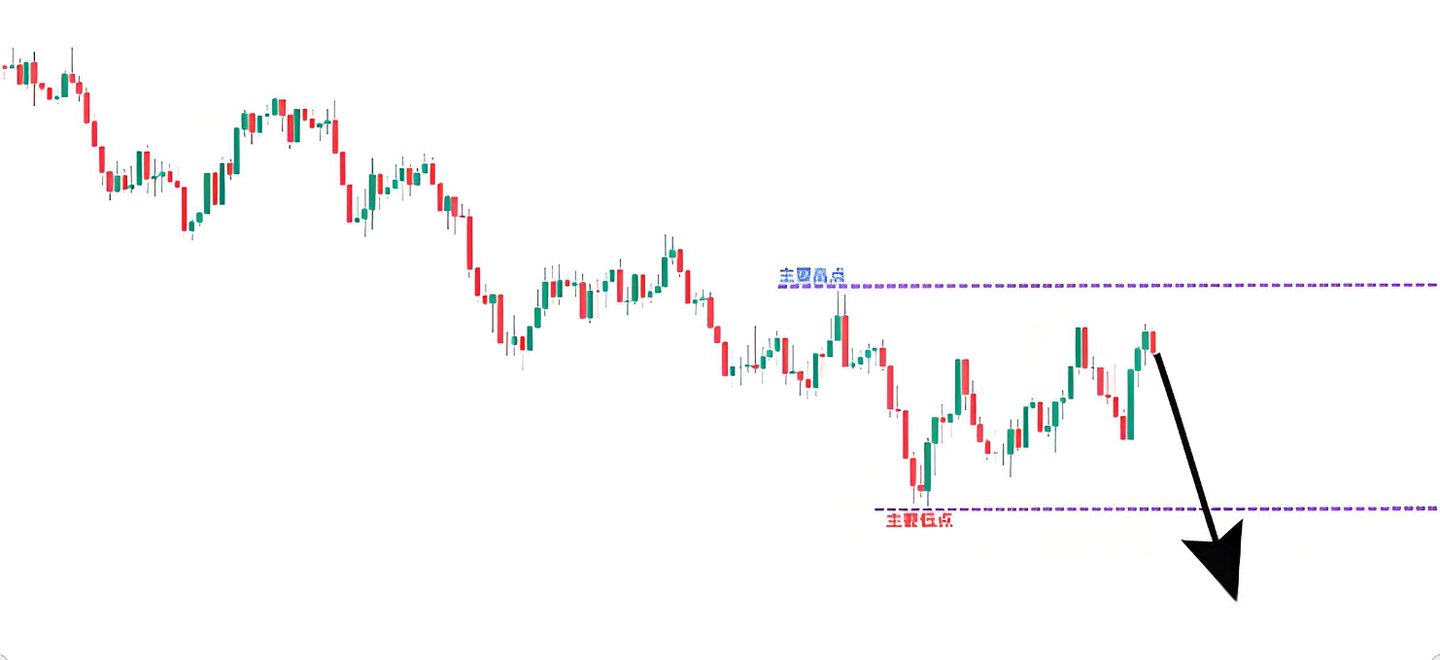
The entry logic is the same: wait for the price to pull back to the 'previous main low that has been broken and turned into a resistance level', then wait for the bearish signal to confirm—two bearish signals appear in the chart: a long upper shadow + bearish engulfing, indicating strong bearish momentum. Short entry is made after the large bearish candle is fully formed, with the stop loss set above the resistance level and the recent high + 1 ATR value.
I would like to add that the benefits of using ATR to set stop losses are very clear; even if a false breakout occurs later (like this long upper shadow), it will not trigger the stop loss, helping us maintain our position and improve the success rate of trading.
Strategy 2
Trend-following structure trading strategy
Follow the trend, with a higher win rate and more stability.
If the reversal strategy is 'grabbing turning points', then the trend-following strategy is 'following the trend', with a higher win rate, more stable, suitable for most traders. Let's look at a case directly:
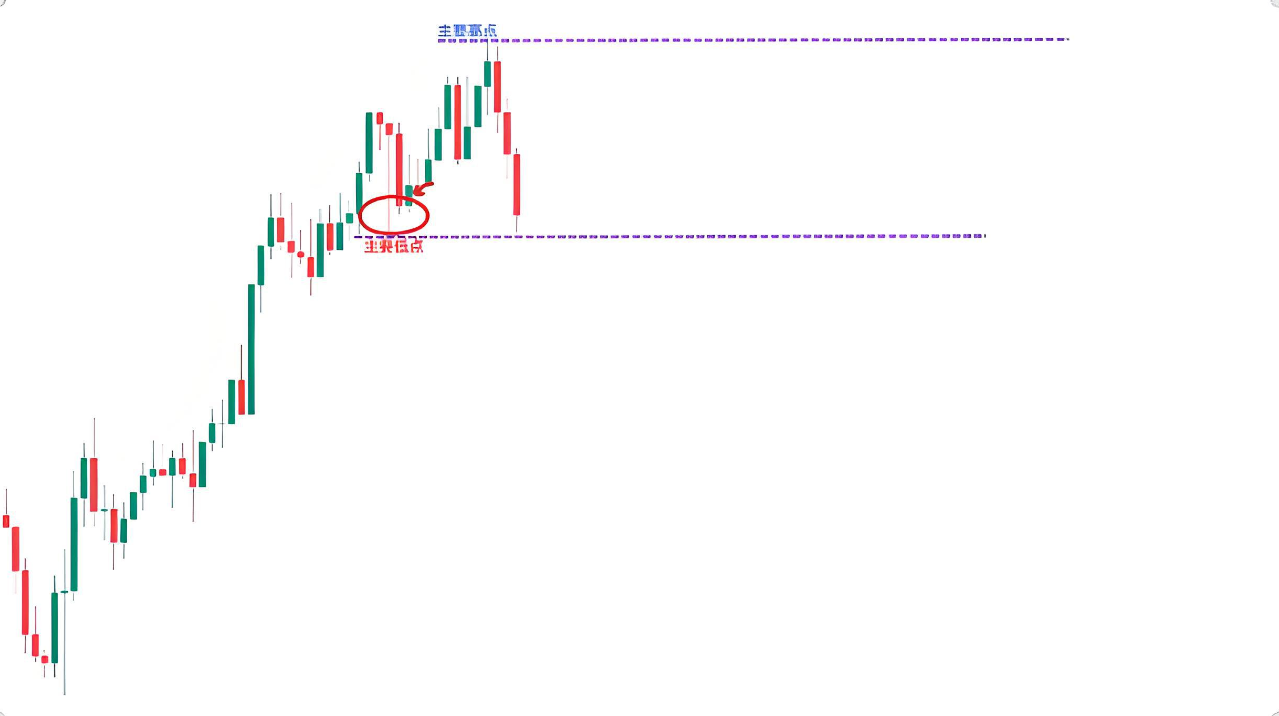
Step 1: Judging the trend + determining the main highs and lows. Currently, it is an uptrend, and the 'top top high, bottom bottom high' structure is clear. The main high is formed by pullbacks exceeding 3 candles, and the main low is the starting point of this rally. As long as the price fluctuates between these two points, it belongs to the normal pullback of the uptrend, and we only look for long opportunities.
Step 2: Find key price levels within the range. In the interval of the main highs and lows, there are two core key price levels: one is 'the previous main high has broken through and turned into a support level', and the other is 'the support level formed by the price lows'. Where to enter specifically depends on the signal given by the price.

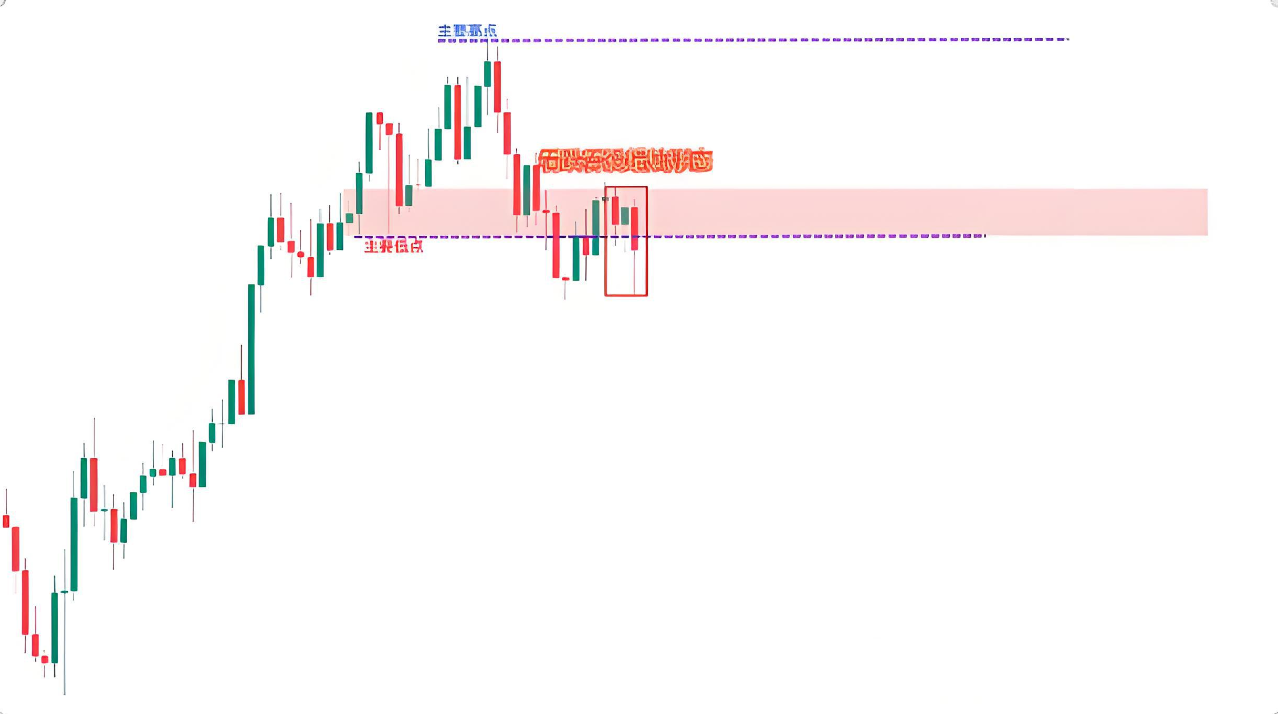
Step 3: Wait for the signal to enter + set the stop loss. After the price pulls back to the first key price level (previous high turned support level), a bullish engulfing pattern appears, confirming bullish momentum, at this time you can enter long. The stop loss is set below this support level + 1 ATR value to avoid false breakdowns.
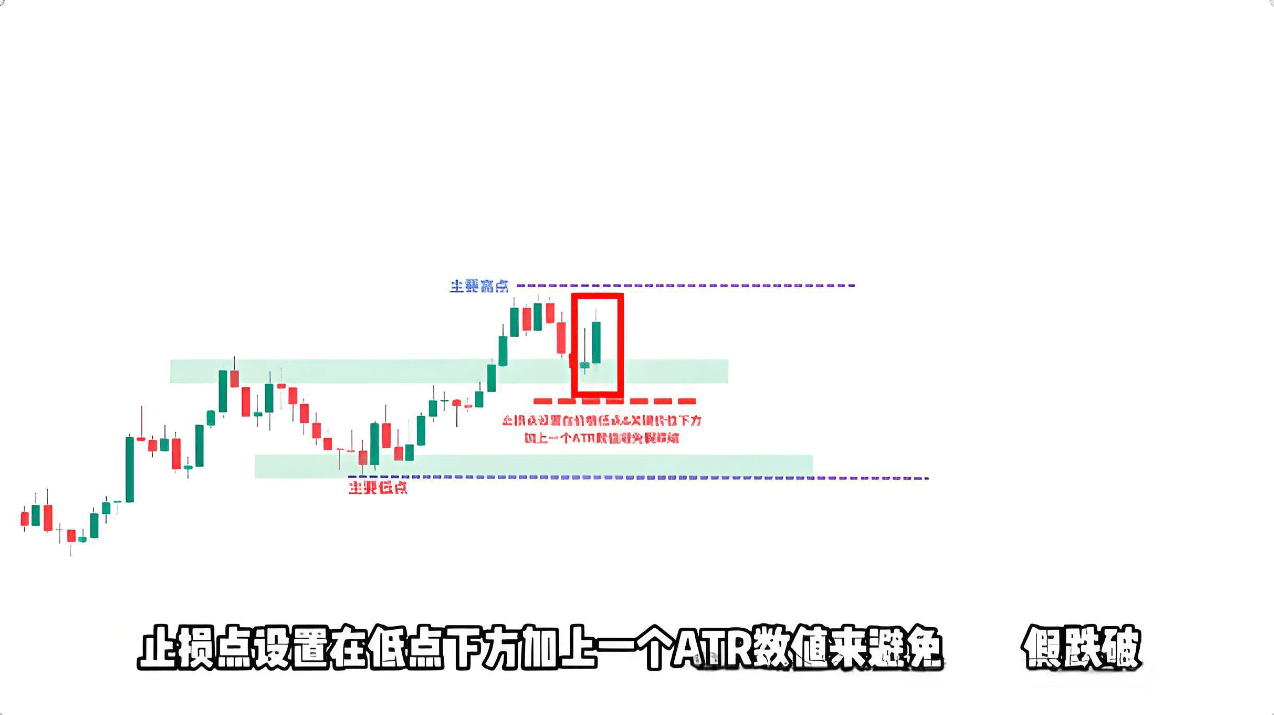
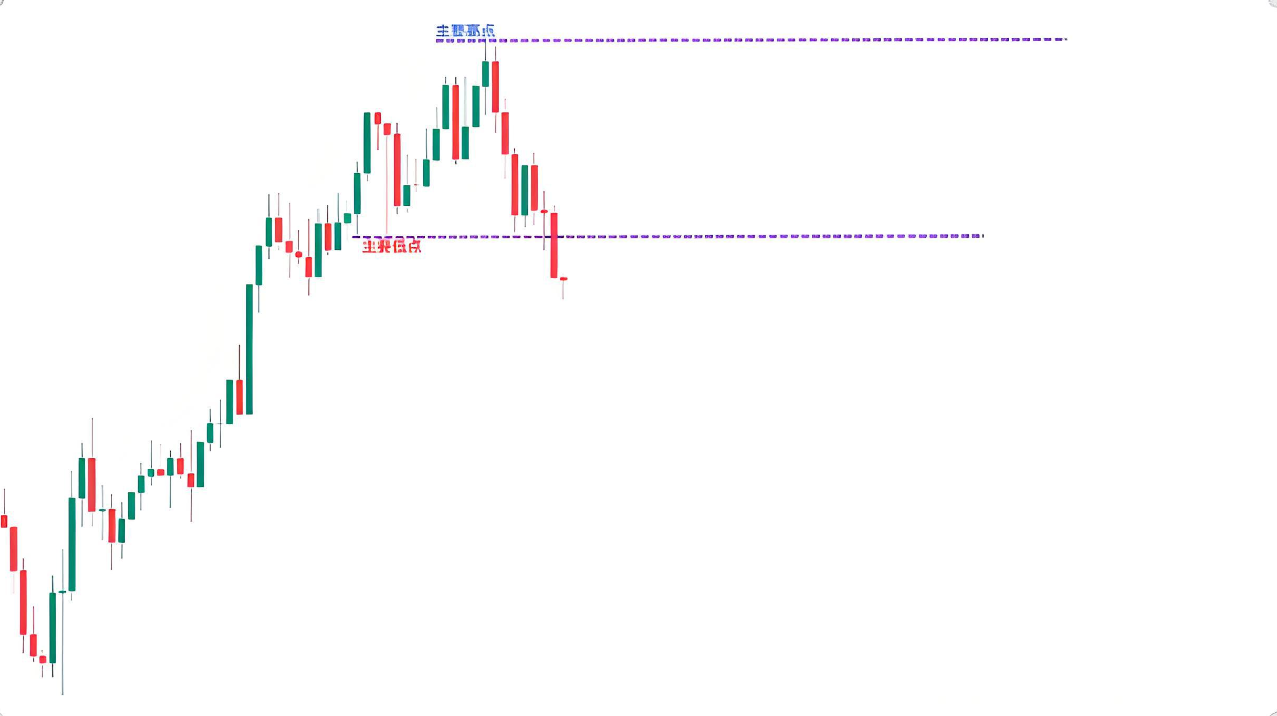
To add some logic for response: If the price does not signal at the first key price level and instead breaks down, wait for the second support level; if the second support level is also broken, and even the main low is breached, forming a 'bottom bottom low' structure, it indicates the end of the uptrend, and no more long opportunities should be sought, exit and observe in time.
Final summary
The core of market structure trading is to 'go with the trend', whether it is a reversal strategy or a trend-following strategy, it relies on two fundamentals: first, accurately identify the main highs and lows using 2 rules, and second, wait for key price levels + candlestick signal confirmation before entering, along with setting stop losses using ATR.
These two strategies each have their focus: the reversal strategy captures turning points, with large profit potential; the trend-following strategy follows the trend, with a higher and more stable win rate. Everyone can choose based on their trading style, or they can be used in combination. Remember: the core of market structure is 'structure determines trend'; as long as the structure is recognized correctly, the trend will not be misjudged, and the overall direction of trading will not be wrong.
This is the trading experience that Yan An shared with everyone today. Many times, you lose many money-making opportunities because of your doubts; if you do not dare to try boldly, to touch, to understand, how can you know the pros and cons? You only know how to proceed to the next step after taking the first step. A cup of warm tea, a piece of advice, I am both a teacher and a good friend you can talk to.
Meeting is fate, knowing is parting. I firmly believe that fate can bring us together despite thousands of miles, while parting is destiny. The journey of investment is long; momentary gains and losses are merely the tip of the iceberg. One must know that even the wisest can overlook something, and even the unwise can achieve success. Regardless of emotions, time will not stand still for you. Put aside your worries and stand up again to move forward.
The martial arts secrets have been given to you all; whether you can become famous in the world depends on yourselves.
Everyone must save these methods and watch them again. Friends who find them useful can share them with more people trading cryptocurrencies around them, follow me, and learn more valuable content in the crypto space. Having been rained on, I am willing to hold an umbrella for the leeks! Follow me, and let's move forward together in the crypto space!