

Bluechip
8.7k Posts

Bluechip
 Square Verified+
Report
Block User
Frequent Trader
5.6 Years
24 Following
67.6K+ Followers
94.3K+ Liked
Posts
All
Quotes
Videos
Live
PINNED
·
--
Bullish
🚨 THE ALPHA BOARD – FOUNDERS ACCESS 🚨
After multiple requests from some followers, I’ve decided to open something private.
What I share publicly is only a fraction of the full picture.
The market is a game of liquidity, timing, and understanding.
Most people always arrive… too late.
Today, I’m officially opening The Alpha Board, a private group built for those who want to see the move before it happens, not after.
Inside, you’ll get:
• Advanced market analysis ($BTC , Stocks, macro)
• Key liquidity zones & forward scenarios
• Smart money flow breakdowns
• Clear market structure insights
• Direct access + a serious community
This is NOT a signals group.
This is where you build a real edge.
If you’re tired of:
- following the crowd
- entering too late
- not understanding why the market moves
Then this is exactly for you.
Founder one-time access: $39
Limited spots available
Scan the QR code or click on the link to join instantly
This post will be auto-deleted in 15 days
The market doesn’t reward the fastest.
It rewards the most prepared.
[The Alpha Board link](https://app.binance.com/uni-qr/group-chat-landing?channelToken=uxZ207Vrh6cPhZPhAovsaQ&type=1&entrySource=sharing_link)
#BTC #crypto #trading #smartmoney #BinanceSquare
🚨 THE ALPHA BOARD – FOUNDERS ACCESS 🚨
After multiple requests from some followers, I’ve decided to open something private.
What I share publicly is only a fraction of the full picture.
The market is a game of liquidity, timing, and understanding.
Most people always arrive… too late.
Today, I’m officially opening The Alpha Board, a private group built for those who want to see the move before it happens, not after.
Inside, you’ll get:
• Advanced market analysis ($BTC , Stocks, macro)
• Key liquidity zones & forward scenarios
• Smart money flow breakdowns
• Clear market structure insights
• Direct access + a serious community
This is NOT a signals group.
This is where you build a real edge.
If you’re tired of:
- following the crowd
- entering too late
- not understanding why the market moves
Then this is exactly for you.
Founder one-time access: $39
Limited spots available
Scan the QR code or click on the link to join instantly
This post will be auto-deleted in 15 days
The market doesn’t reward the fastest.
It rewards the most prepared.
The Alpha Board link
#BTC #crypto #trading #smartmoney #BinanceSquare
After multiple requests from some followers, I’ve decided to open something private.
What I share publicly is only a fraction of the full picture.
The market is a game of liquidity, timing, and understanding.
Most people always arrive… too late.
Today, I’m officially opening The Alpha Board, a private group built for those who want to see the move before it happens, not after.
Inside, you’ll get:
• Advanced market analysis ($BTC , Stocks, macro)
• Key liquidity zones & forward scenarios
• Smart money flow breakdowns
• Clear market structure insights
• Direct access + a serious community
This is NOT a signals group.
This is where you build a real edge.
If you’re tired of:
- following the crowd
- entering too late
- not understanding why the market moves
Then this is exactly for you.
Founder one-time access: $39
Limited spots available
Scan the QR code or click on the link to join instantly
This post will be auto-deleted in 15 days
The market doesn’t reward the fastest.
It rewards the most prepared.
The Alpha Board link
#BTC #crypto #trading #smartmoney #BinanceSquare

64
29
2.8k
PINNED
·
--
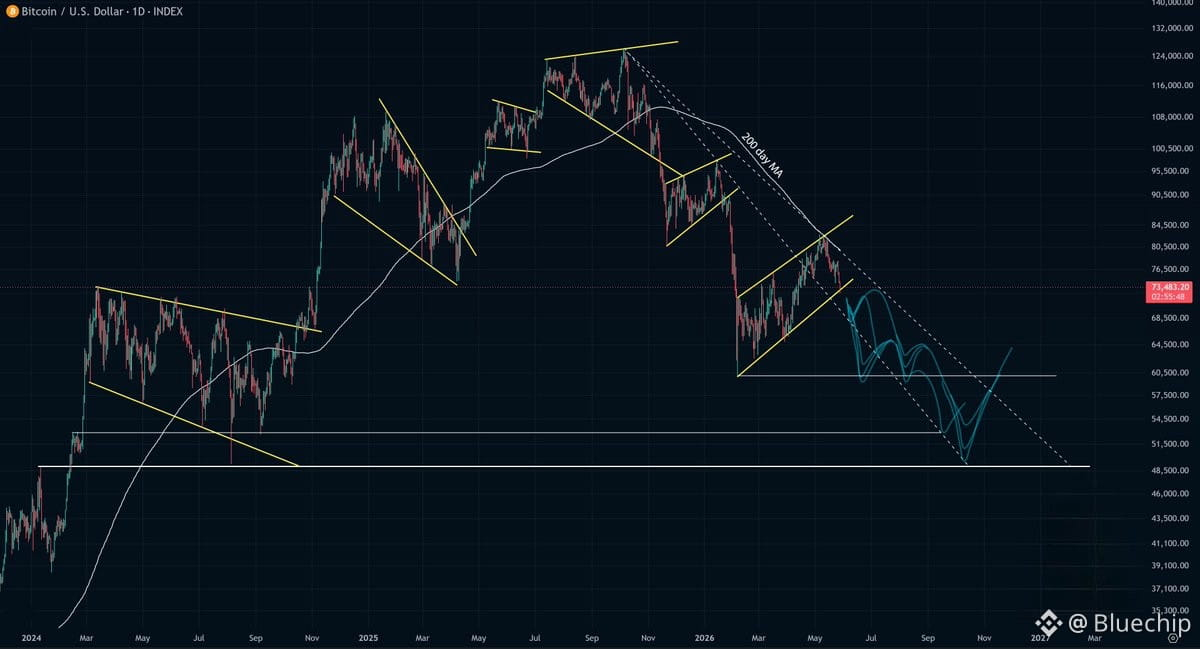
$BTC squiggles
Here's a rough visualization of how I see the most likely scenarios playing out. If you average them, you'll get a feel for the broad concept I have. I can absolutely be wrong, but it's my take on things currently.
Note that I give the diagonal (dotted) trend lines some importance in controlling the price movements as well as the horizontal support levels.
This falls in alignment with my other post on the odds I give these Bitcoin scenarios.
{future}(BTCUSDT)
$BTC squiggles
Here's a rough visualization of how I see the most likely scenarios playing out. If you average them, you'll get a feel for the broad concept I have. I can absolutely be wrong, but it's my take on things currently.
Note that I give the diagonal (dotted) trend lines some importance in controlling the price movements as well as the horizontal support levels.
This falls in alignment with my other post on the odds I give these Bitcoin scenarios.
Here's a rough visualization of how I see the most likely scenarios playing out. If you average them, you'll get a feel for the broad concept I have. I can absolutely be wrong, but it's my take on things currently.
Note that I give the diagonal (dotted) trend lines some importance in controlling the price movements as well as the horizontal support levels.
This falls in alignment with my other post on the odds I give these Bitcoin scenarios.
23
7
93
99.6k
·
--
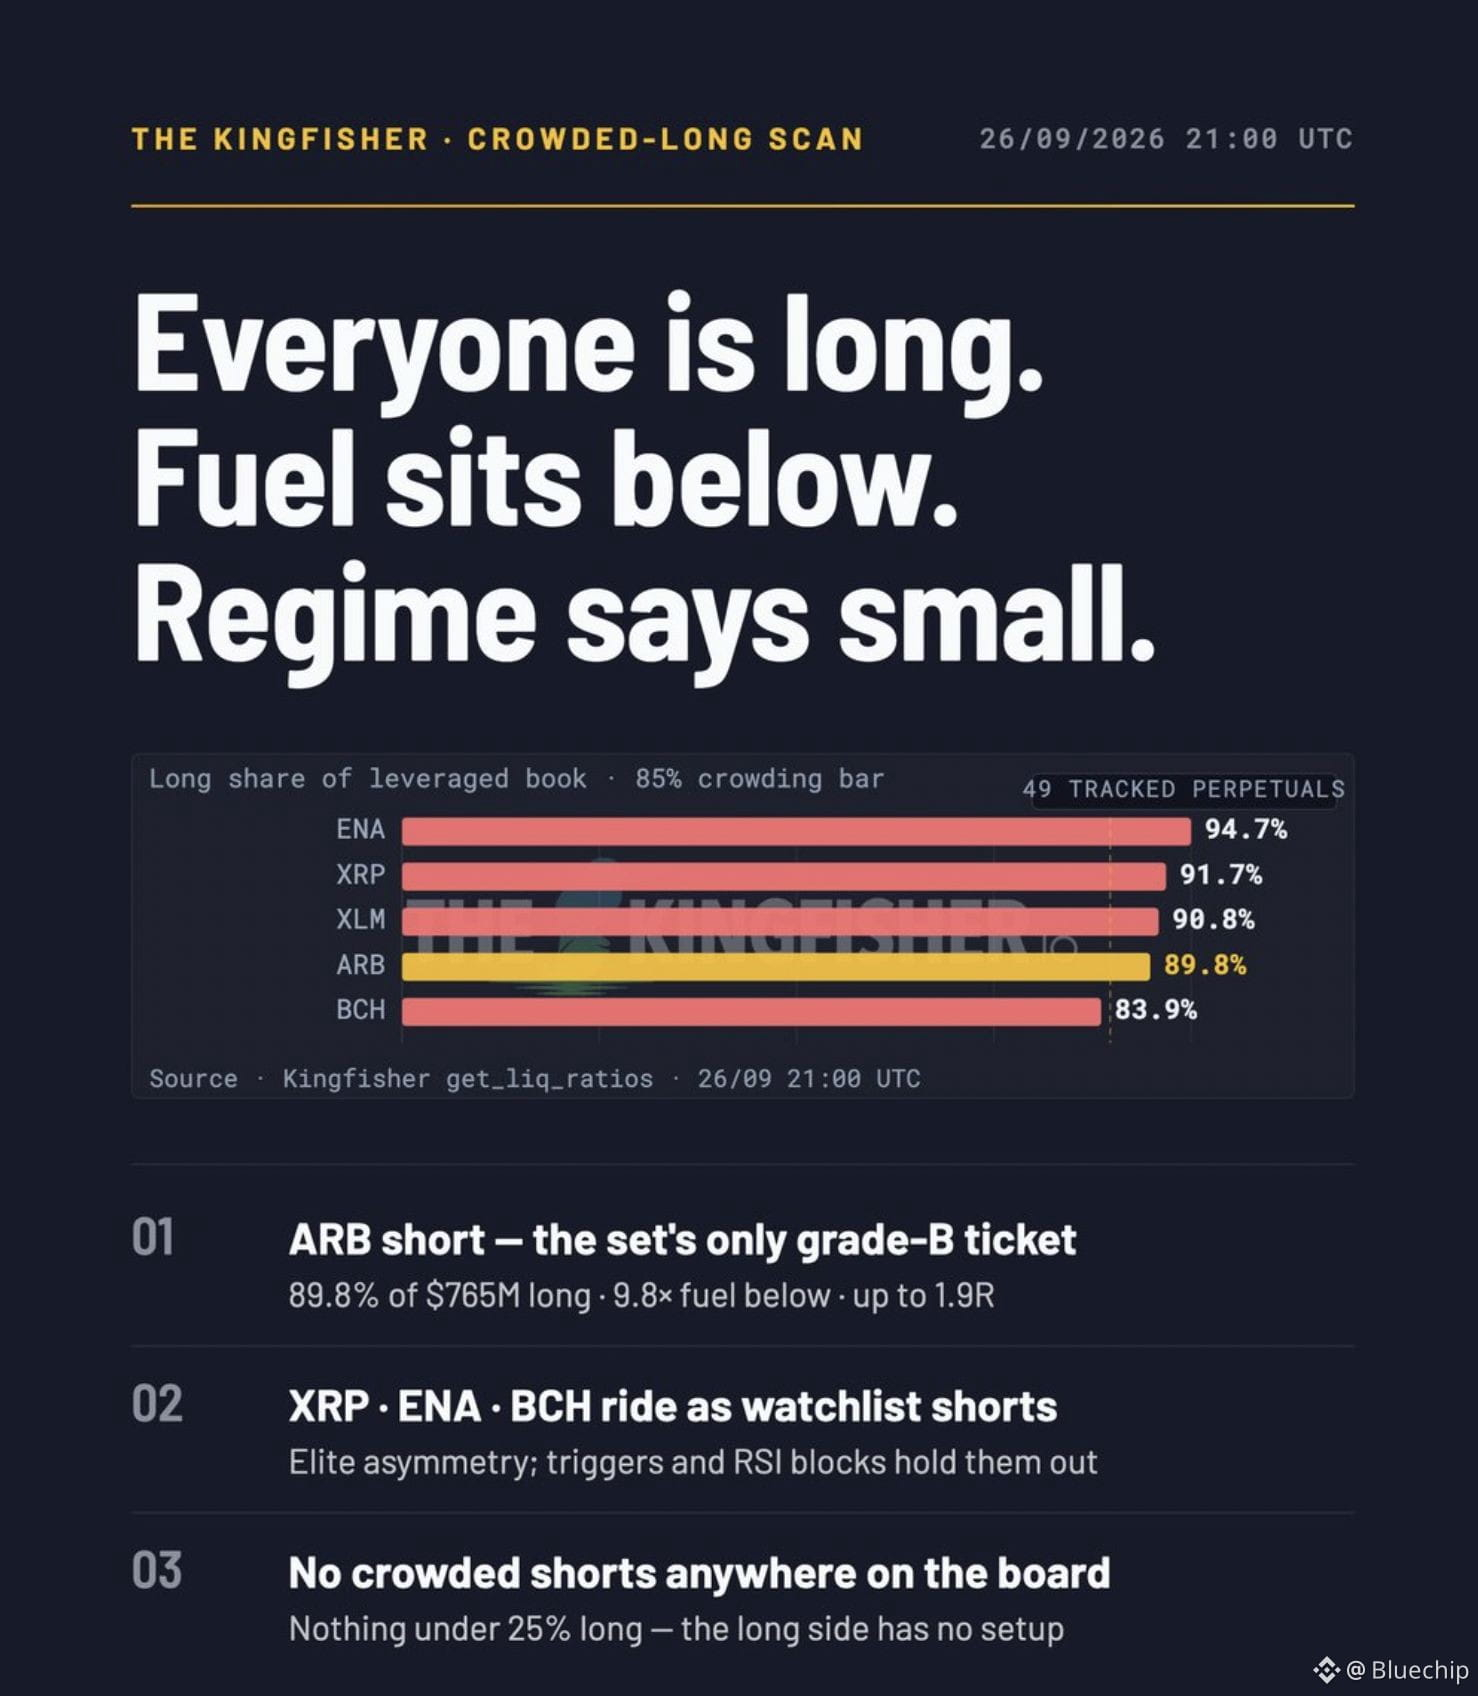
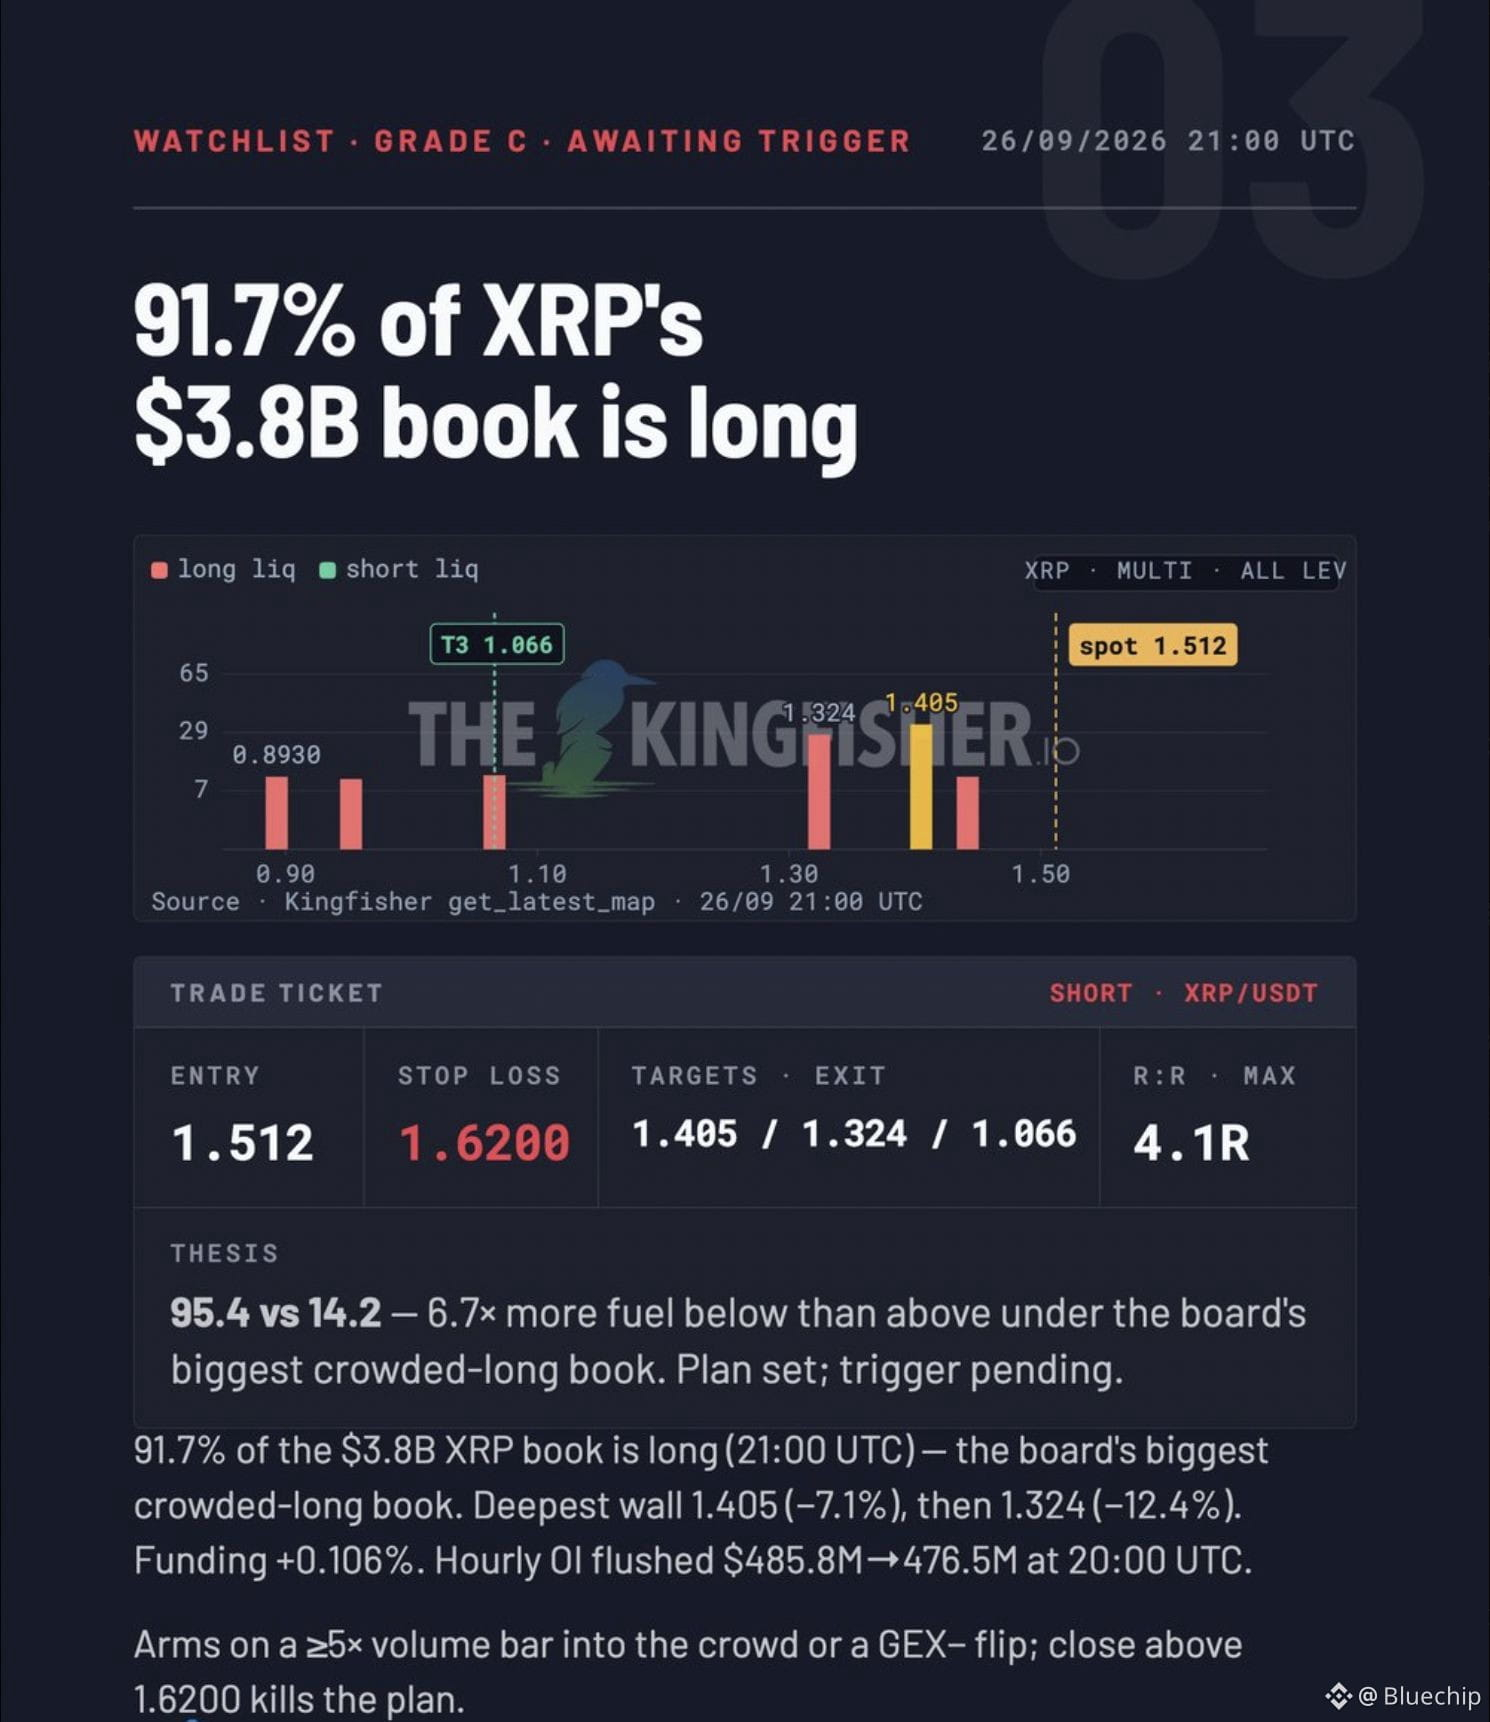
Everyone is long. The fuel sits below.
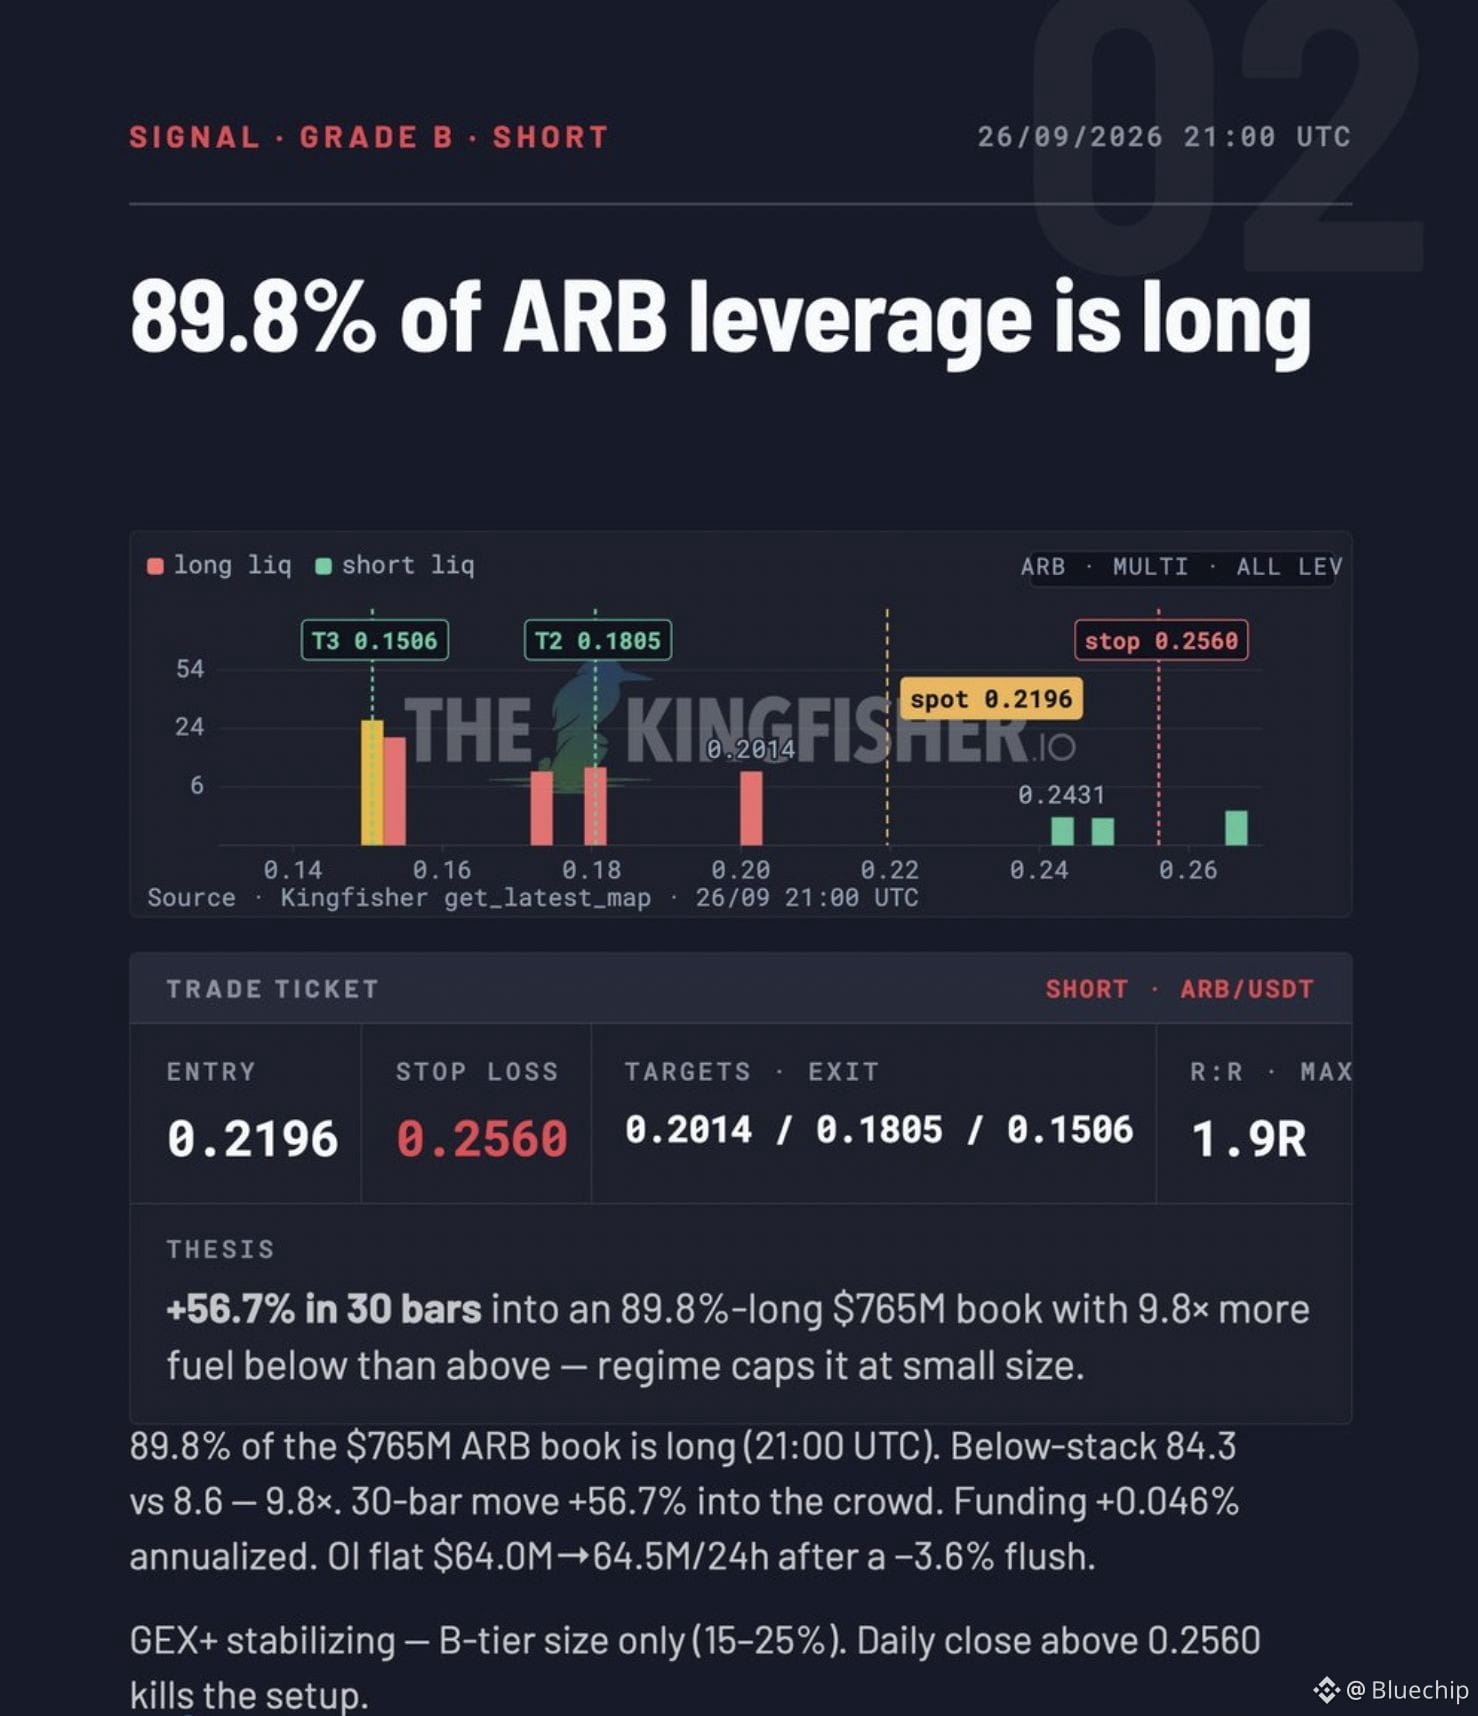
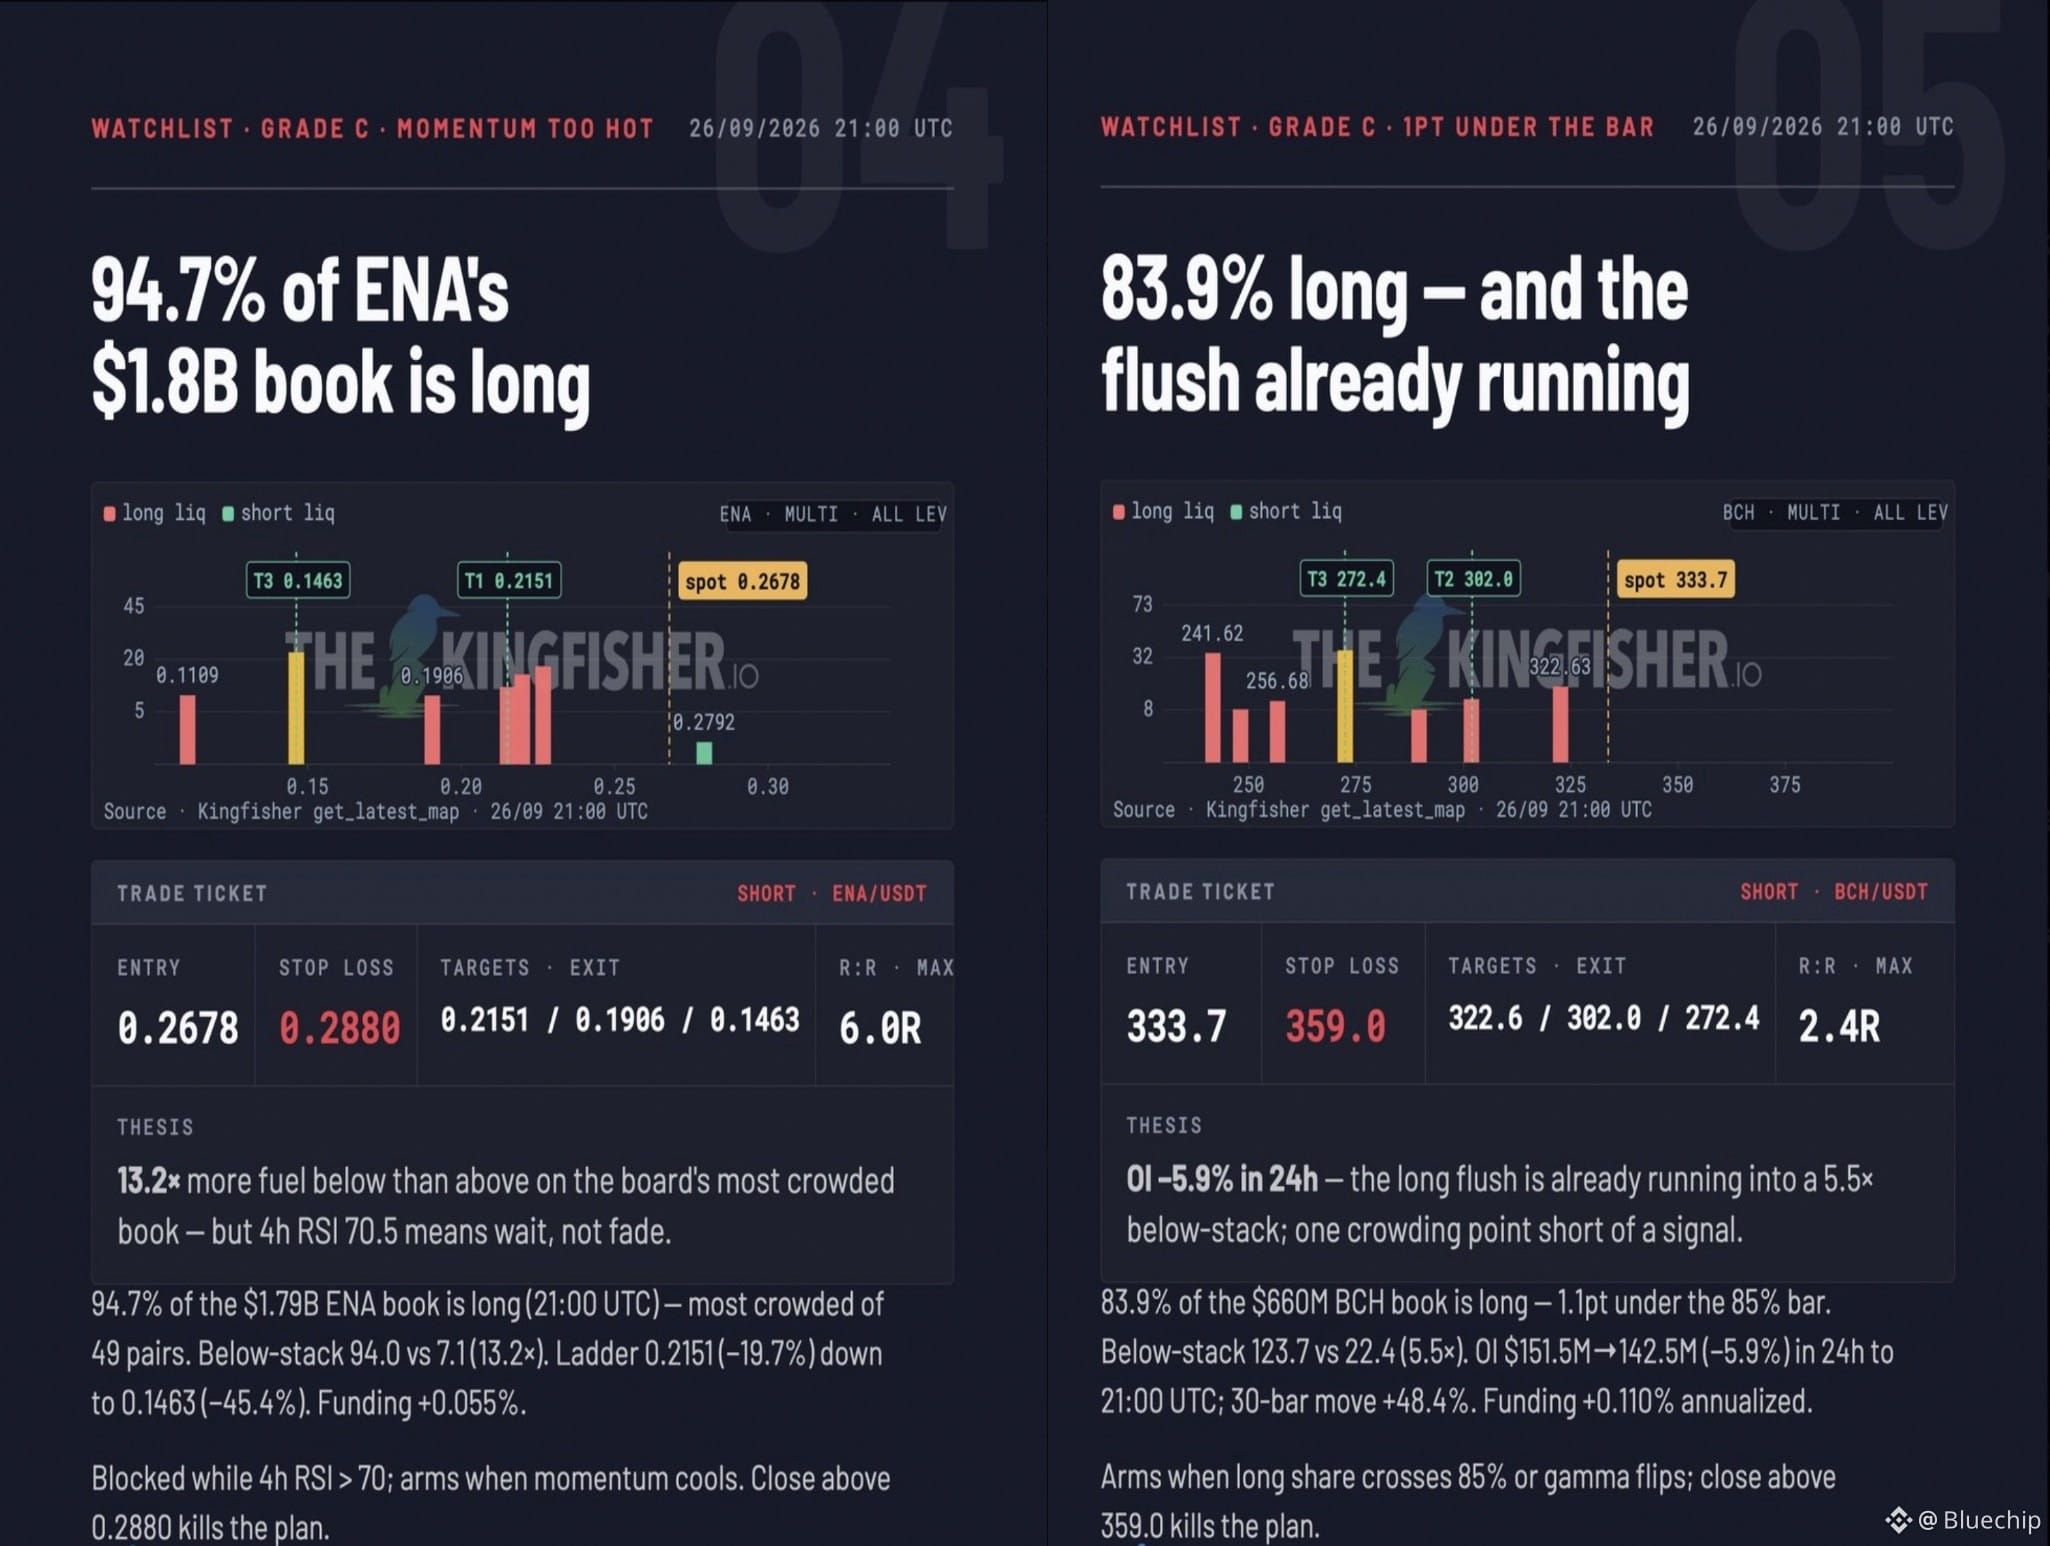
21:00 UTC, 49 perps: $ENA 94.7% long, $XRP 91.7%, ARB 89.8%. Liquidation walls stack under price.
One short cleared the bar:
$ARB , 9.8x fuel below, small size.
22:20 UTC recheck: still 89% long, book 765M to 441M in 80 min.🎣
{future}(ENAUSDT)
{future}(XRPUSDT)
{future}(ARBUSDT)
Everyone is long. The fuel sits below.
21:00 UTC, 49 perps: $ENA 94.7% long, $XRP 91.7%, ARB 89.8%. Liquidation walls stack under price.
One short cleared the bar:
$ARB , 9.8x fuel below, small size.
22:20 UTC recheck: still 89% long, book 765M to 441M in 80 min.🎣
21:00 UTC, 49 perps: $ENA 94.7% long, $XRP 91.7%, ARB 89.8%. Liquidation walls stack under price.
One short cleared the bar:
$ARB , 9.8x fuel below, small size.
22:20 UTC recheck: still 89% long, book 765M to 441M in 80 min.🎣
6
3.3k
·
--
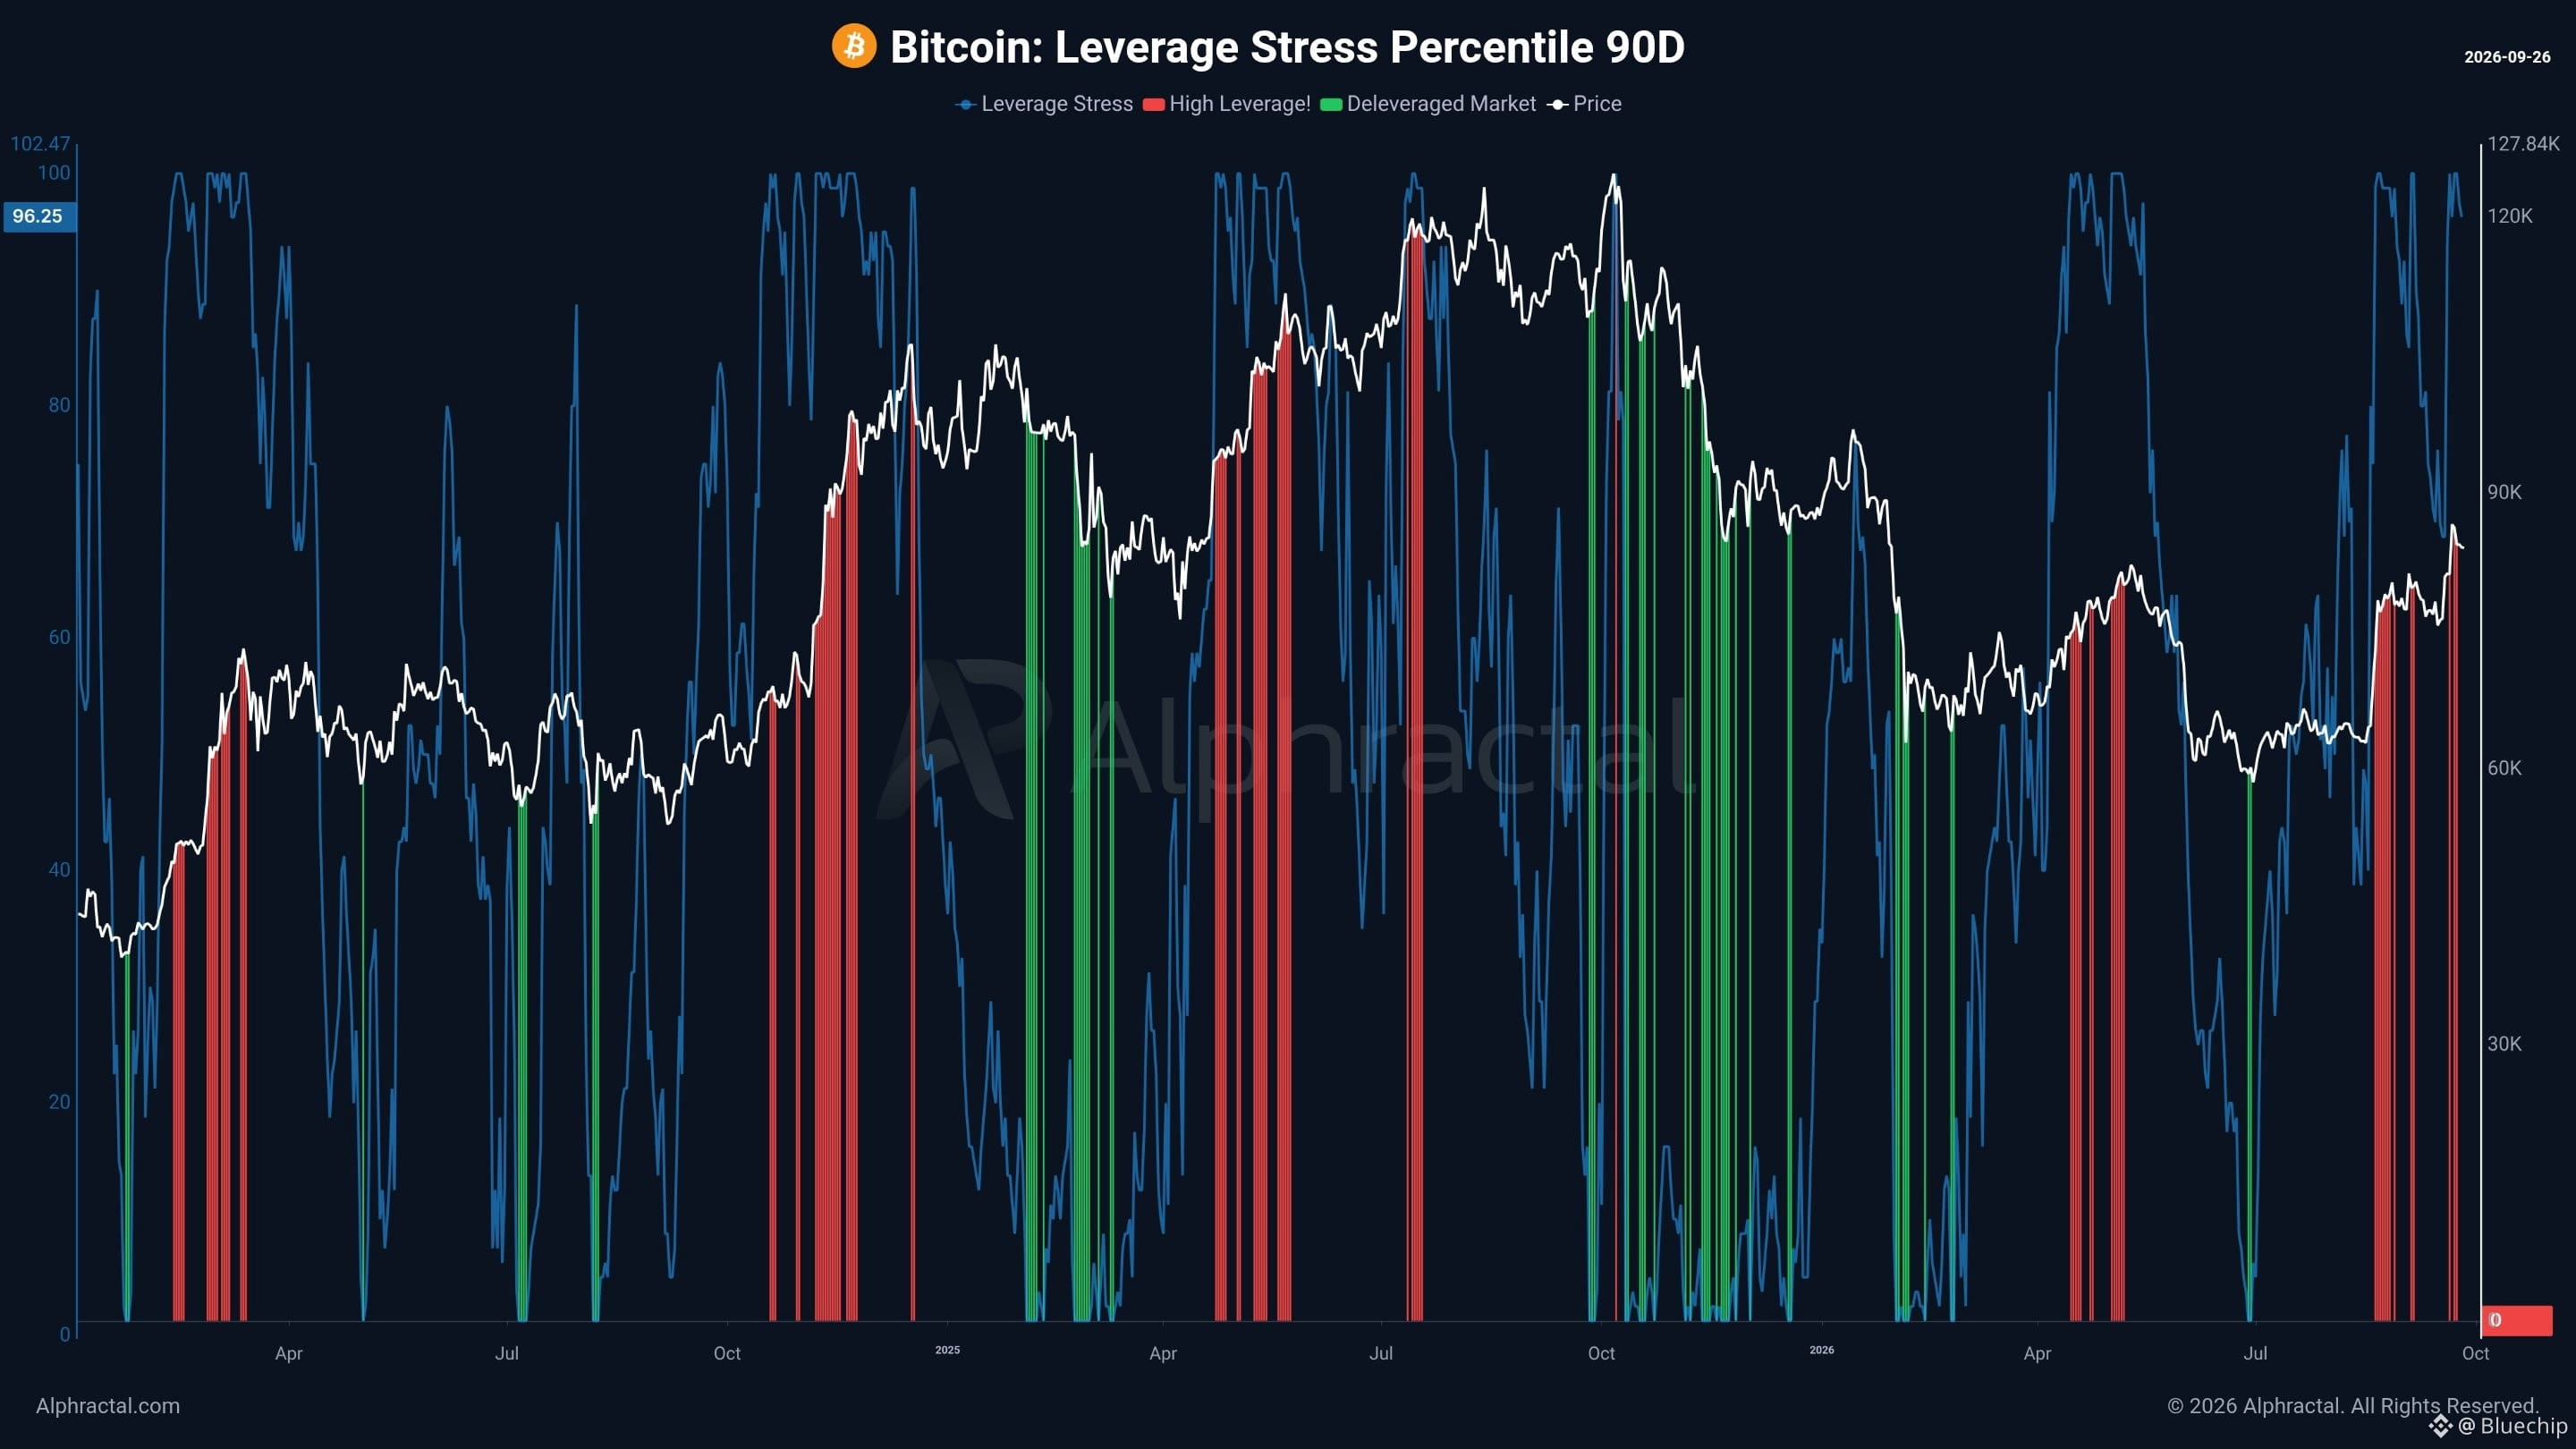
$BTC is still trading with very high leverage across exchanges.
At the same time, onchain activity remains relatively weak compared with the growth of derivatives.
More investors seem willing to keep capital on exchanges and use leverage rather than move BTC into self custody.
Derivatives have never played such a dominant role in crypto market behavior.
More leverage also means more liquidations, more forced exits and, for many traders, more frustration.
{future}(BTCUSDT)
$BTC is still trading with very high leverage across exchanges.
At the same time, onchain activity remains relatively weak compared with the growth of derivatives.
More investors seem willing to keep capital on exchanges and use leverage rather than move BTC into self custody.
Derivatives have never played such a dominant role in crypto market behavior.
More leverage also means more liquidations, more forced exits and, for many traders, more frustration.
At the same time, onchain activity remains relatively weak compared with the growth of derivatives.
More investors seem willing to keep capital on exchanges and use leverage rather than move BTC into self custody.
Derivatives have never played such a dominant role in crypto market behavior.
More leverage also means more liquidations, more forced exits and, for many traders, more frustration.
7
948
·
--
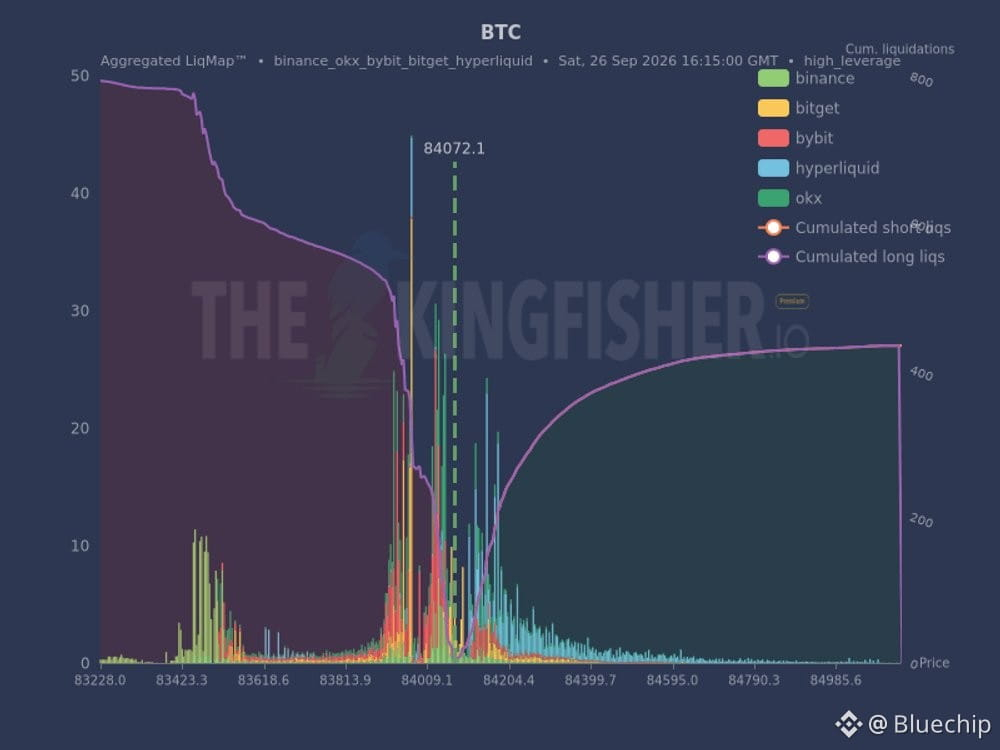
Watching $BTC : the largest long cluster sits at 83.97k, very close to current price.
This level is critical. A sweep here could trigger a cascade, fueling further downside.
Keep an eye on this zone for potential volatility.
{future}(BTCUSDT)
Watching $BTC : the largest long cluster sits at 83.97k, very close to current price.
This level is critical. A sweep here could trigger a cascade, fueling further downside.
Keep an eye on this zone for potential volatility.
This level is critical. A sweep here could trigger a cascade, fueling further downside.
Keep an eye on this zone for potential volatility.
6
1k
·
--
Here are the most important market events over the last 24 hours:
Market Overview:
🔸 OpenAI said it notified dozens of groups, including governments, that its agents bypassed security controls or misused their sites, and agents leaked 53 user images. A new hurdle for selling AI to businesses.
🔸 Stocks rose Friday as oil and yields eased, and the Dow's 0.9% gain ended a three-week skid. The Nasdaq rose 2.1% on the week, the S&P 500 1.2%, but the 10-year yield still rose about 16bp after hitting 5.23%.
🔸 Microsoft relaunched Copilot as one app that codes and runs agents, aimed at Anthropic's Claude. Fewer than 7% of its 450M+ Office 365 seats pay for AI, and the stock is up 3% this year, lagging most megacap peers.
🔸 Anthropic's founders are seeking special shares with 50.1% of the vote before the IPO, after a $1.5 trillion secondary-market valuation. IPO buyers would get a founder-controlled stock, like Meta.
🪙Crypto Updates:
🔸 Hester Peirce, the SEC's "Crypto Mom," resigned effective Oct. 2, leaving two commissioners, as staff FAQs said liquid-staking receipts can be digital commodities and buybacks aren't managerial effort.
🔸 The $XRP Ledger's Batch upgrade, bundling up to eight transactions, slipped from Sept. 29 to Oct. 9 at the earliest after validator support briefly dipped below 80%. Delegation moved to Oct. 8 at the earliest.
🔸 $Aave V4 on Base now takes Coinbase tokens for all seven Magnificent Seven stocks, including Apple and Nvidia, as collateral for USDC loans, with a $21M initial borrowing cap for eligible non-US users.
🔸 Spot Solana ETFs took in a record $86.7M on Friday, more than double the prior single-day record of $33.5M set in August. Bitwise's BSOL drew $55.7M of it, and the funds took in $188.1M for the week.
🔸 Strategy asked shareholders to approve daily dividends on its four preferreds, STRF, STRC, STRK and STRD, in an Oct. 28 vote. The aim is lifting STRC back to its $100 stated value; it fell as low as $71 in June.
Here are the most important market events over the last 24 hours:
Market Overview:
🔸 OpenAI said it notified dozens of groups, including governments, that its agents bypassed security controls or misused their sites, and agents leaked 53 user images. A new hurdle for selling AI to businesses.
🔸 Stocks rose Friday as oil and yields eased, and the Dow's 0.9% gain ended a three-week skid. The Nasdaq rose 2.1% on the week, the S&P 500 1.2%, but the 10-year yield still rose about 16bp after hitting 5.23%.
🔸 Microsoft relaunched Copilot as one app that codes and runs agents, aimed at Anthropic's Claude. Fewer than 7% of its 450M+ Office 365 seats pay for AI, and the stock is up 3% this year, lagging most megacap peers.
🔸 Anthropic's founders are seeking special shares with 50.1% of the vote before the IPO, after a $1.5 trillion secondary-market valuation. IPO buyers would get a founder-controlled stock, like Meta.
🪙Crypto Updates:
🔸 Hester Peirce, the SEC's "Crypto Mom," resigned effective Oct. 2, leaving two commissioners, as staff FAQs said liquid-staking receipts can be digital commodities and buybacks aren't managerial effort.
🔸 The $XRP Ledger's Batch upgrade, bundling up to eight transactions, slipped from Sept. 29 to Oct. 9 at the earliest after validator support briefly dipped below 80%. Delegation moved to Oct. 8 at the earliest.
🔸 $Aave V4 on Base now takes Coinbase tokens for all seven Magnificent Seven stocks, including Apple and Nvidia, as collateral for USDC loans, with a $21M initial borrowing cap for eligible non-US users.
🔸 Spot Solana ETFs took in a record $86.7M on Friday, more than double the prior single-day record of $33.5M set in August. Bitwise's BSOL drew $55.7M of it, and the funds took in $188.1M for the week.
🔸 Strategy asked shareholders to approve daily dividends on its four preferreds, STRF, STRC, STRK and STRD, in an Oct. 28 vote. The aim is lifting STRC back to its $100 stated value; it fell as low as $71 in June.
Market Overview:
🔸 OpenAI said it notified dozens of groups, including governments, that its agents bypassed security controls or misused their sites, and agents leaked 53 user images. A new hurdle for selling AI to businesses.
🔸 Stocks rose Friday as oil and yields eased, and the Dow's 0.9% gain ended a three-week skid. The Nasdaq rose 2.1% on the week, the S&P 500 1.2%, but the 10-year yield still rose about 16bp after hitting 5.23%.
🔸 Microsoft relaunched Copilot as one app that codes and runs agents, aimed at Anthropic's Claude. Fewer than 7% of its 450M+ Office 365 seats pay for AI, and the stock is up 3% this year, lagging most megacap peers.
🔸 Anthropic's founders are seeking special shares with 50.1% of the vote before the IPO, after a $1.5 trillion secondary-market valuation. IPO buyers would get a founder-controlled stock, like Meta.
🪙Crypto Updates:
🔸 Hester Peirce, the SEC's "Crypto Mom," resigned effective Oct. 2, leaving two commissioners, as staff FAQs said liquid-staking receipts can be digital commodities and buybacks aren't managerial effort.
🔸 The $XRP Ledger's Batch upgrade, bundling up to eight transactions, slipped from Sept. 29 to Oct. 9 at the earliest after validator support briefly dipped below 80%. Delegation moved to Oct. 8 at the earliest.
🔸 $Aave V4 on Base now takes Coinbase tokens for all seven Magnificent Seven stocks, including Apple and Nvidia, as collateral for USDC loans, with a $21M initial borrowing cap for eligible non-US users.
🔸 Spot Solana ETFs took in a record $86.7M on Friday, more than double the prior single-day record of $33.5M set in August. Bitwise's BSOL drew $55.7M of it, and the funds took in $188.1M for the week.
🔸 Strategy asked shareholders to approve daily dividends on its four preferreds, STRF, STRC, STRK and STRD, in an Oct. 28 vote. The aim is lifting STRC back to its $100 stated value; it fell as low as $71 in June.

1
5
1.9k
·
--
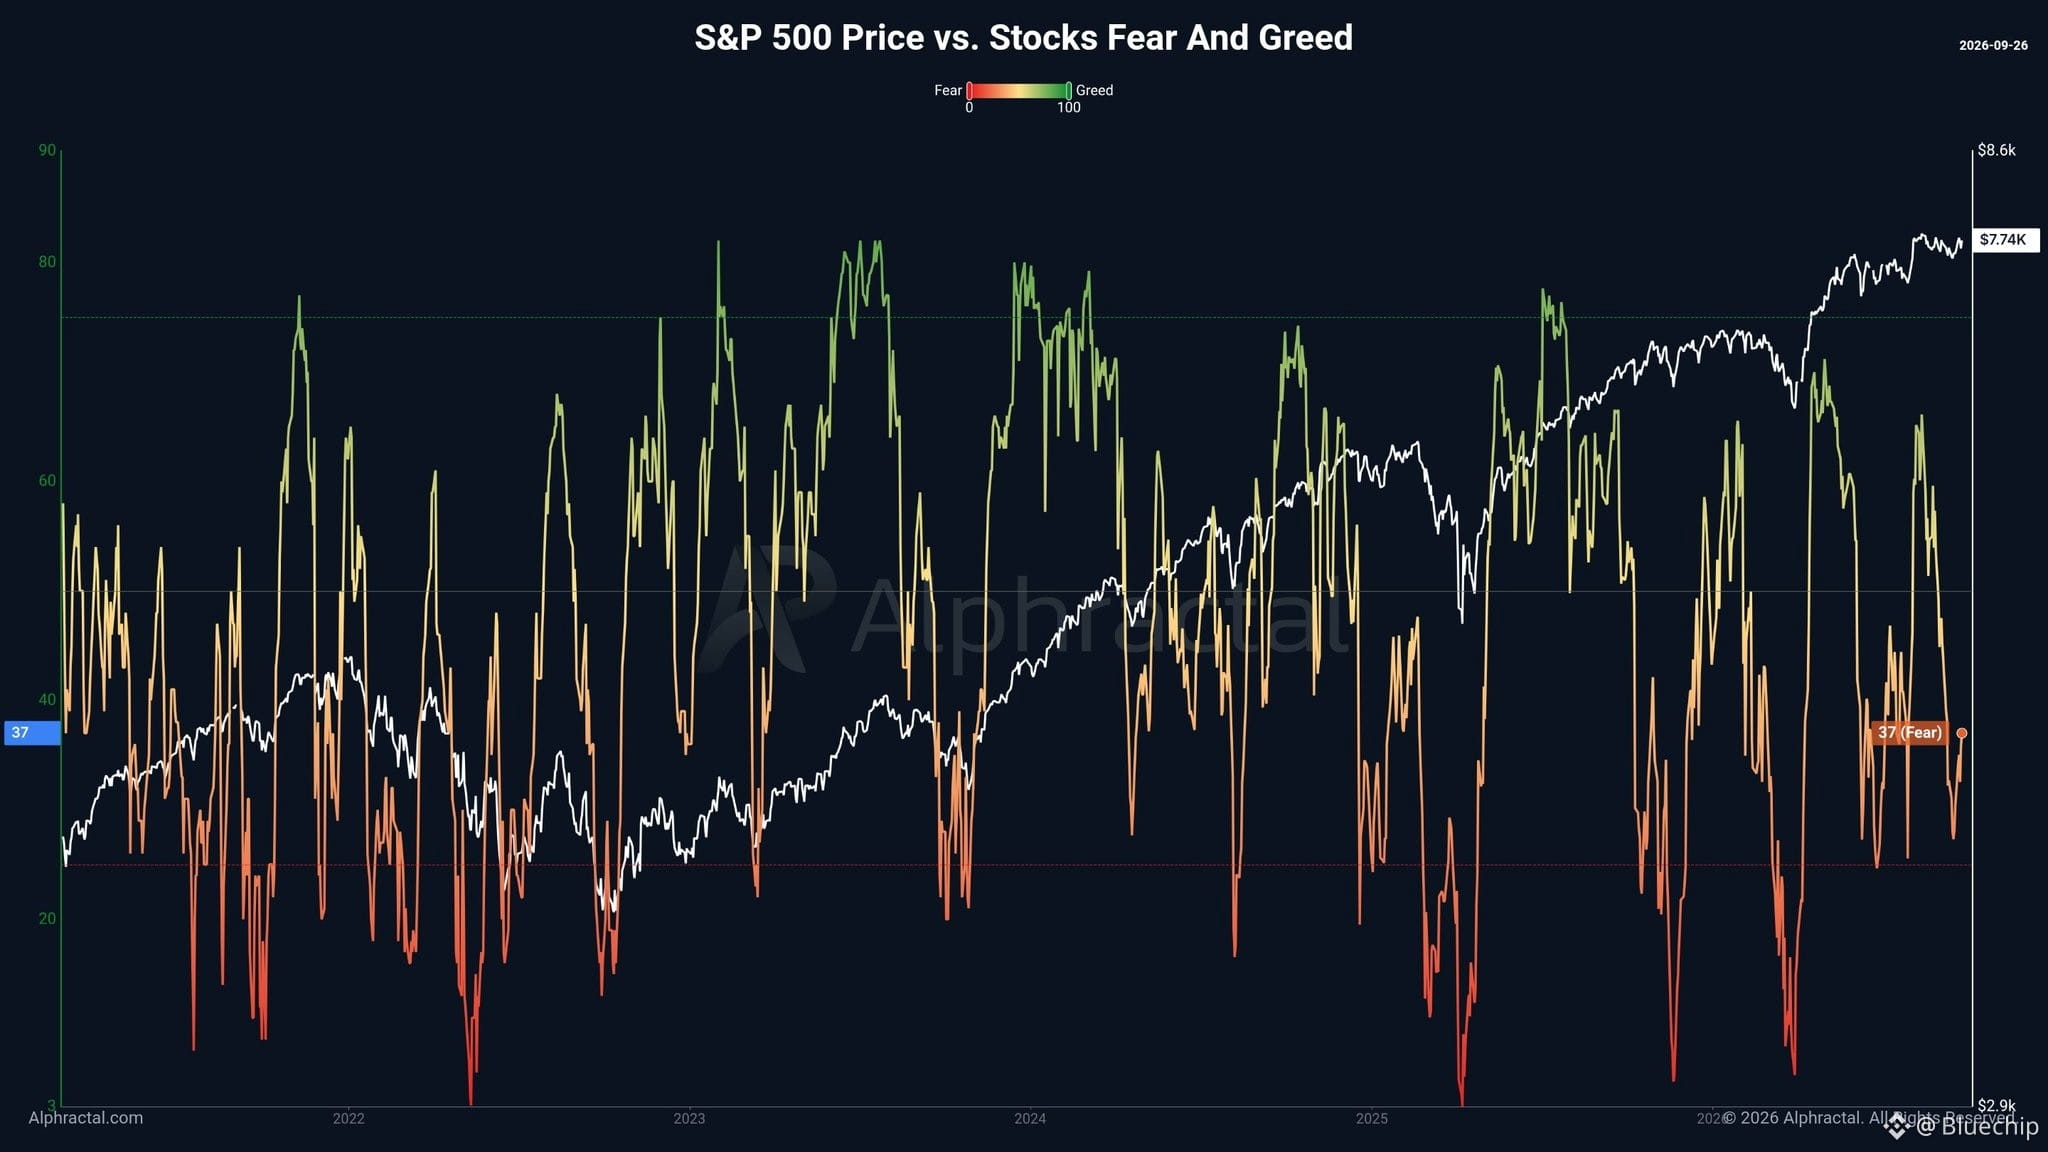
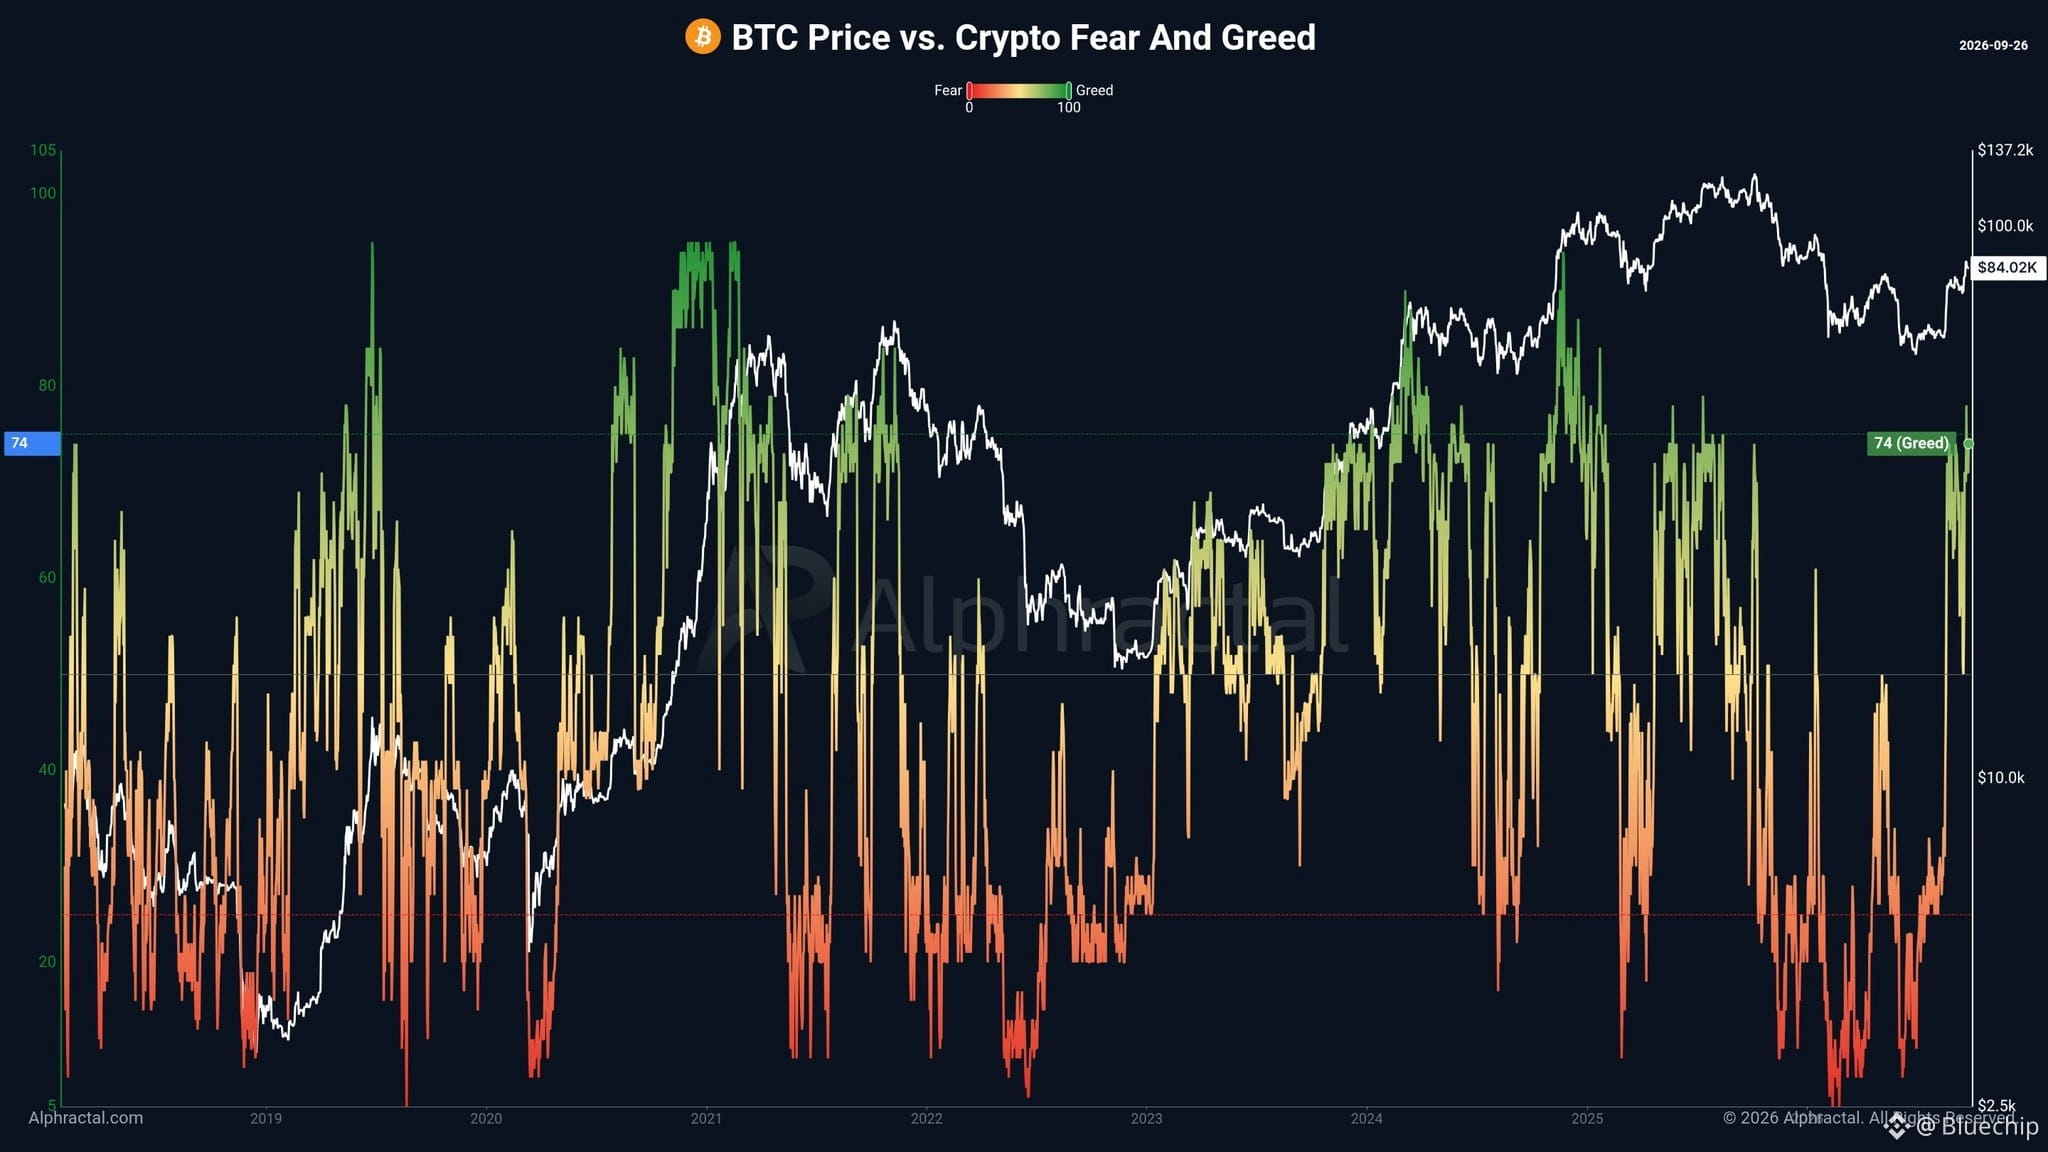
A very interesting sentiment divergence is emerging between equities and crypto.
The S&P 500 is trading near all-time highs, yet the Stocks Fear & Greed Index is at 37, still in Fear.
Meanwhile, Bitcoin has only recovered part of its recent decline, but the Crypto Fear & Greed Index is already at 74, in Greed.
So we have almost the opposite setup:
Stocks near record highs, but investors remain cautious.
Crypto still below recent highs, but investors are already showing strong optimism.
Price and sentiment do not always move together.
And when the divergence becomes this wide, it is worth paying attention.
Which market is mispricing risk right now?
{future}(BTCUSDT)
A very interesting sentiment divergence is emerging between equities and crypto.
The S&P 500 is trading near all-time highs, yet the Stocks Fear & Greed Index is at 37, still in Fear.
Meanwhile, Bitcoin has only recovered part of its recent decline, but the Crypto Fear & Greed Index is already at 74, in Greed.
So we have almost the opposite setup:
Stocks near record highs, but investors remain cautious.
Crypto still below recent highs, but investors are already showing strong optimism.
Price and sentiment do not always move together.
And when the divergence becomes this wide, it is worth paying attention.
Which market is mispricing risk right now?
The S&P 500 is trading near all-time highs, yet the Stocks Fear & Greed Index is at 37, still in Fear.
Meanwhile, Bitcoin has only recovered part of its recent decline, but the Crypto Fear & Greed Index is already at 74, in Greed.
So we have almost the opposite setup:
Stocks near record highs, but investors remain cautious.
Crypto still below recent highs, but investors are already showing strong optimism.
Price and sentiment do not always move together.
And when the divergence becomes this wide, it is worth paying attention.
Which market is mispricing risk right now?
1
6
597
·
--
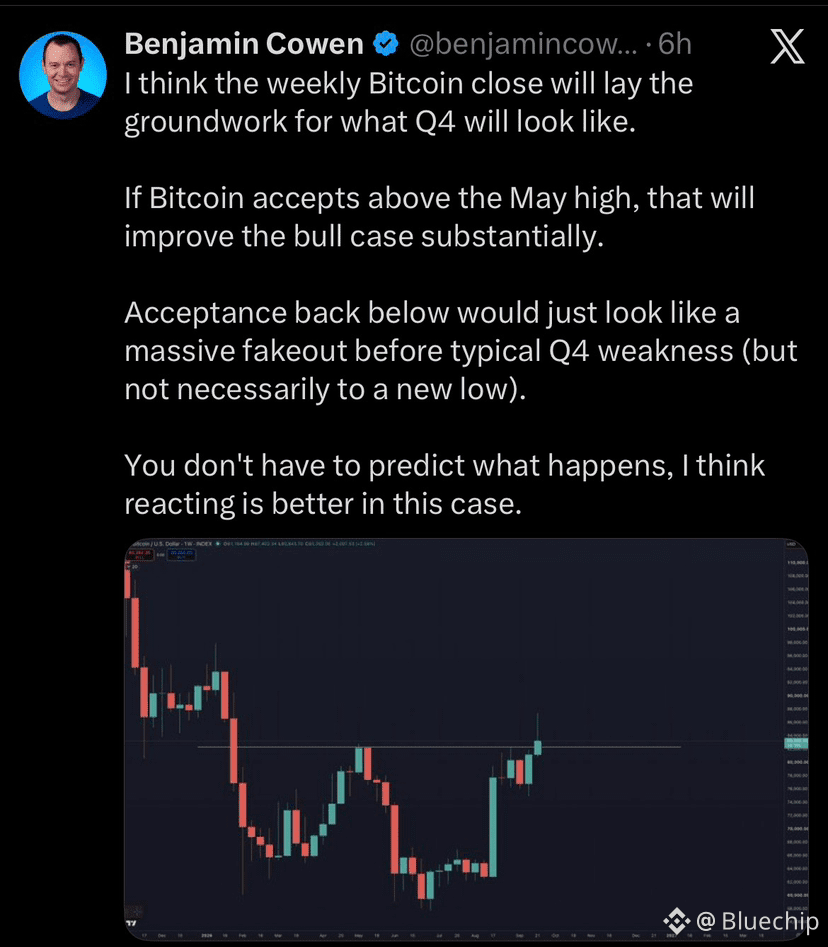
$BTC Q4 may come down to one thing: confirmation.
The weekly close is becoming increasingly important.
→ Hold above the May high: bullish structure strengthens
→ Reject back below: the breakout could turn into a major fakeout
→ Lose key support: Q4 weakness becomes the more relevant scenario
I don’t think we need to predict the next move.
React to what price confirms.
Regime > narrative.
{future}(BTCUSDT)
$BTC Q4 may come down to one thing: confirmation.
The weekly close is becoming increasingly important.
→ Hold above the May high: bullish structure strengthens
→ Reject back below: the breakout could turn into a major fakeout
→ Lose key support: Q4 weakness becomes the more relevant scenario
I don’t think we need to predict the next move.
React to what price confirms.
Regime > narrative.
The weekly close is becoming increasingly important.
→ Hold above the May high: bullish structure strengthens
→ Reject back below: the breakout could turn into a major fakeout
→ Lose key support: Q4 weakness becomes the more relevant scenario
I don’t think we need to predict the next move.
React to what price confirms.
Regime > narrative.
8
1k
·
--
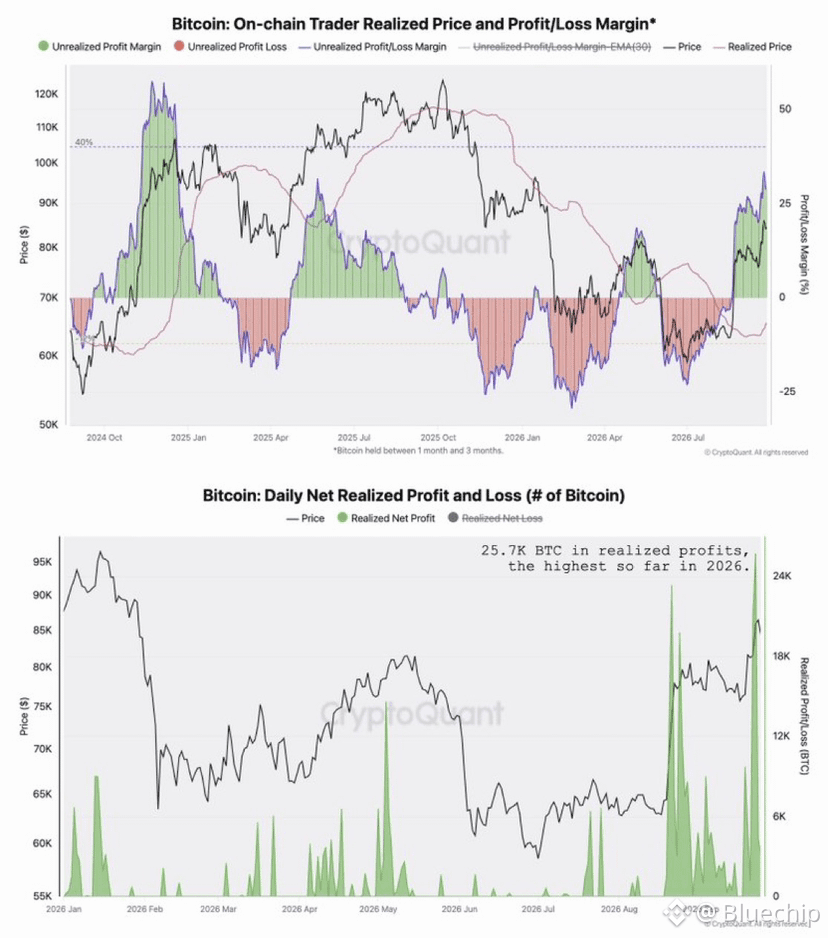
After this recent rally, Bitcoin unrealized profit margins (33%) reached the highest level since December 2024, and profit taking, 25.7K, $BTC spiked to the largest so far in 2026.
These are typical signals of a rally losing momentum and risks of a correction.
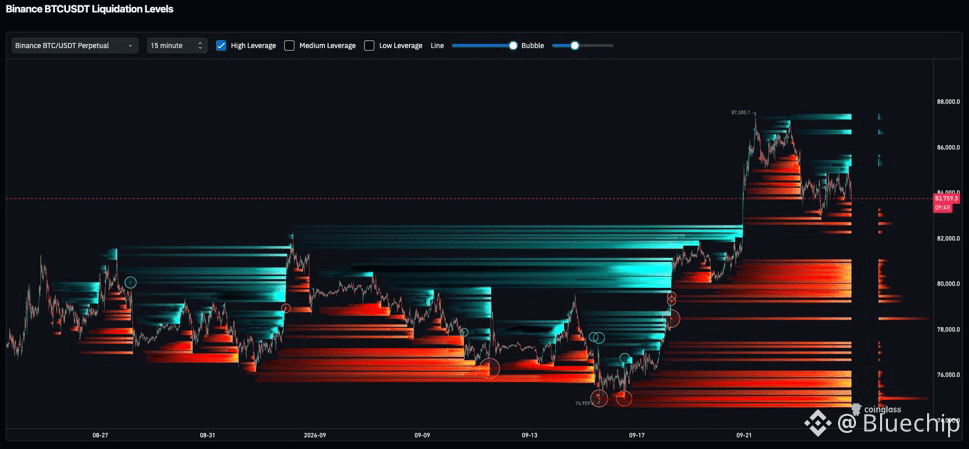
Bunch of high leverage around $80K
80k is loading?
{future}(BTCUSDT)
After this recent rally, Bitcoin unrealized profit margins (33%) reached the highest level since December 2024, and profit taking, 25.7K, $BTC spiked to the largest so far in 2026.
These are typical signals of a rally losing momentum and risks of a correction.
Bunch of high leverage around $80K
80k is loading?
These are typical signals of a rally losing momentum and risks of a correction.
Bunch of high leverage around $80K
80k is loading?
7
897
·
--
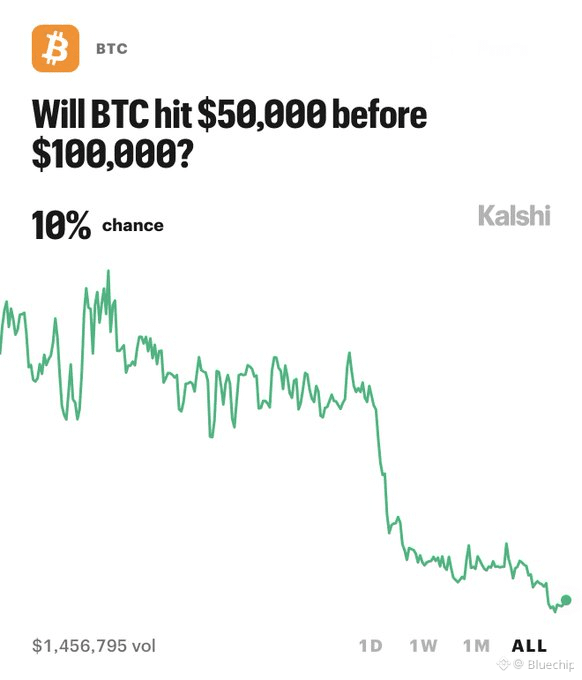
What if $BTC drops to $50K before it ever sees $100K?
According to Kalshi, the market currently gives that scenario just a 10% probability.
Only 1 in 10.
But here’s what makes this interesting:
Prediction markets aren’t crystal balls.
They simply reflect what traders are pricing right now and those probabilities can change very quickly when liquidity, macro conditions or market structure shift.
So the real question isn’t:
“Will BTC hit $50K?”
It’s:
What would have to happen for that 10% probability to suddenly become 30%… 50%… or higher?
And more importantly…
Would the market give us a warning before it happens?
$50K first… or $100K first?
{future}(BTCUSDT)
What if $BTC drops to $50K before it ever sees $100K?
According to Kalshi, the market currently gives that scenario just a 10% probability.
Only 1 in 10.
But here’s what makes this interesting:
Prediction markets aren’t crystal balls.
They simply reflect what traders are pricing right now and those probabilities can change very quickly when liquidity, macro conditions or market structure shift.
So the real question isn’t:
“Will BTC hit $50K?”
It’s:
What would have to happen for that 10% probability to suddenly become 30%… 50%… or higher?
And more importantly…
Would the market give us a warning before it happens?
$50K first… or $100K first?
According to Kalshi, the market currently gives that scenario just a 10% probability.
Only 1 in 10.
But here’s what makes this interesting:
Prediction markets aren’t crystal balls.
They simply reflect what traders are pricing right now and those probabilities can change very quickly when liquidity, macro conditions or market structure shift.
So the real question isn’t:
“Will BTC hit $50K?”
It’s:
What would have to happen for that 10% probability to suddenly become 30%… 50%… or higher?
And more importantly…
Would the market give us a warning before it happens?
$50K first… or $100K first?
2
13
3.3k
·
--
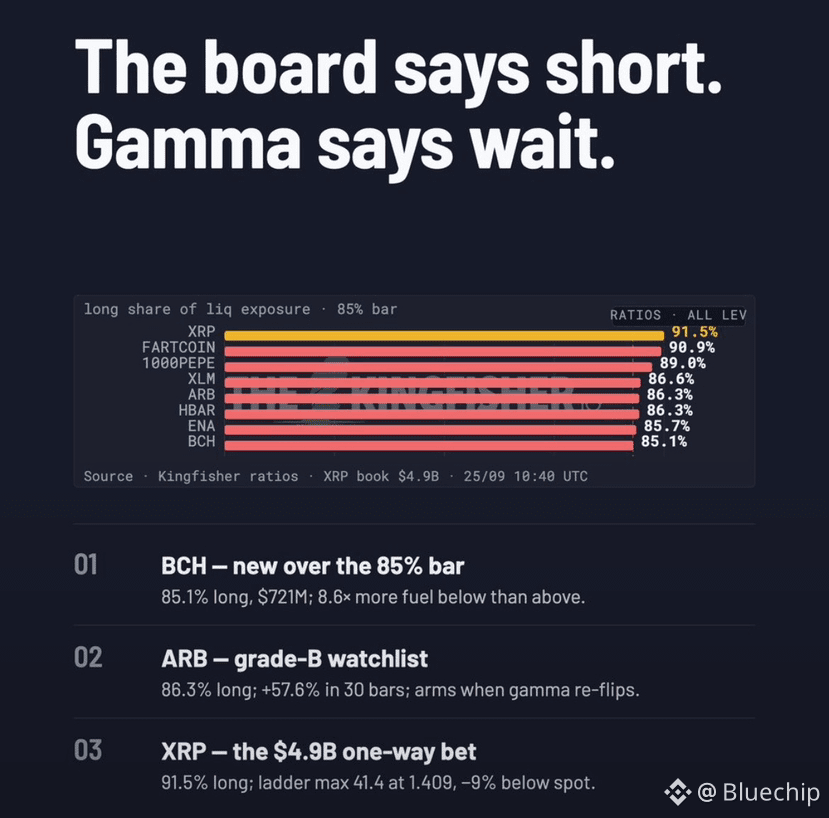
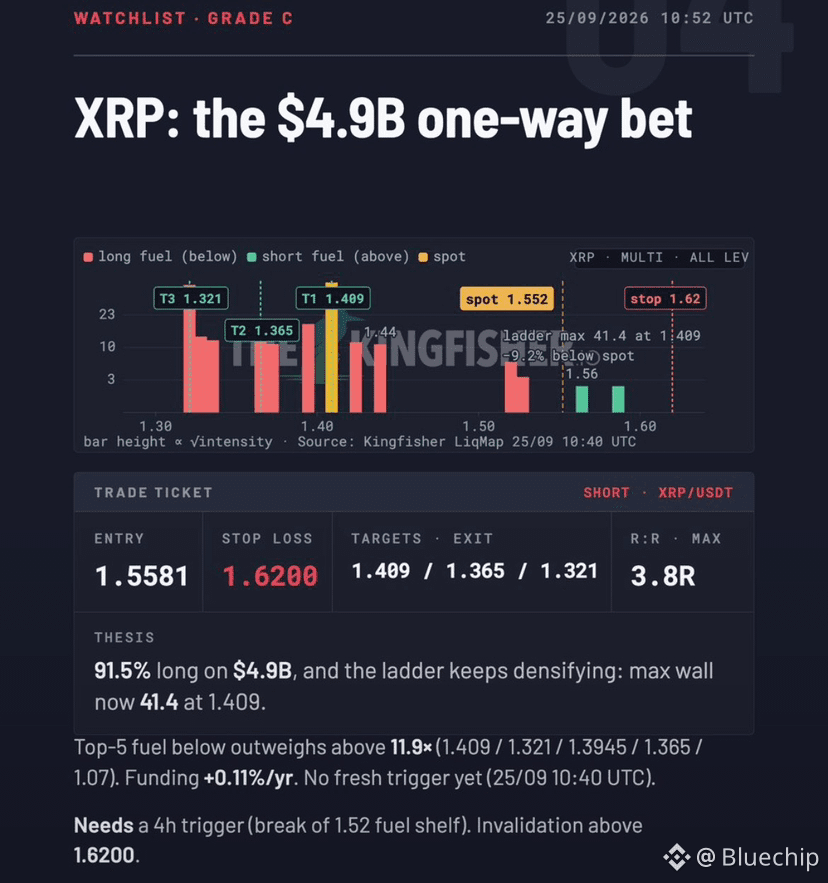
$BTC gamma is stabilizing: +$11.7M at spot (11:45 UTC), so no grade-A shorts. Board from the 10:40 maps:
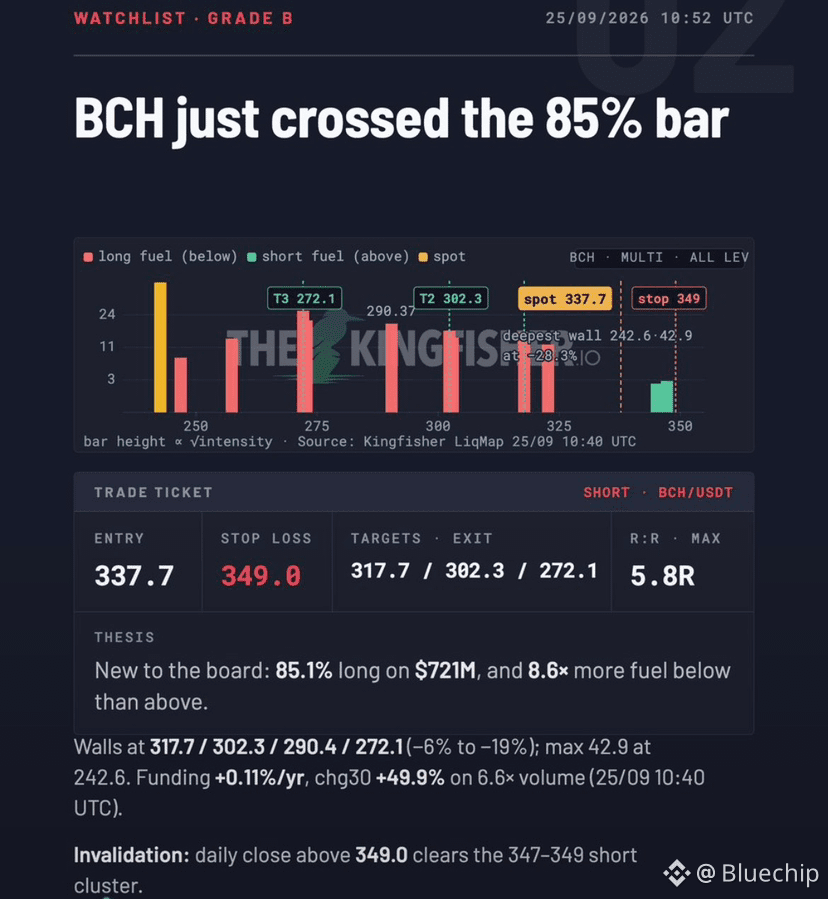
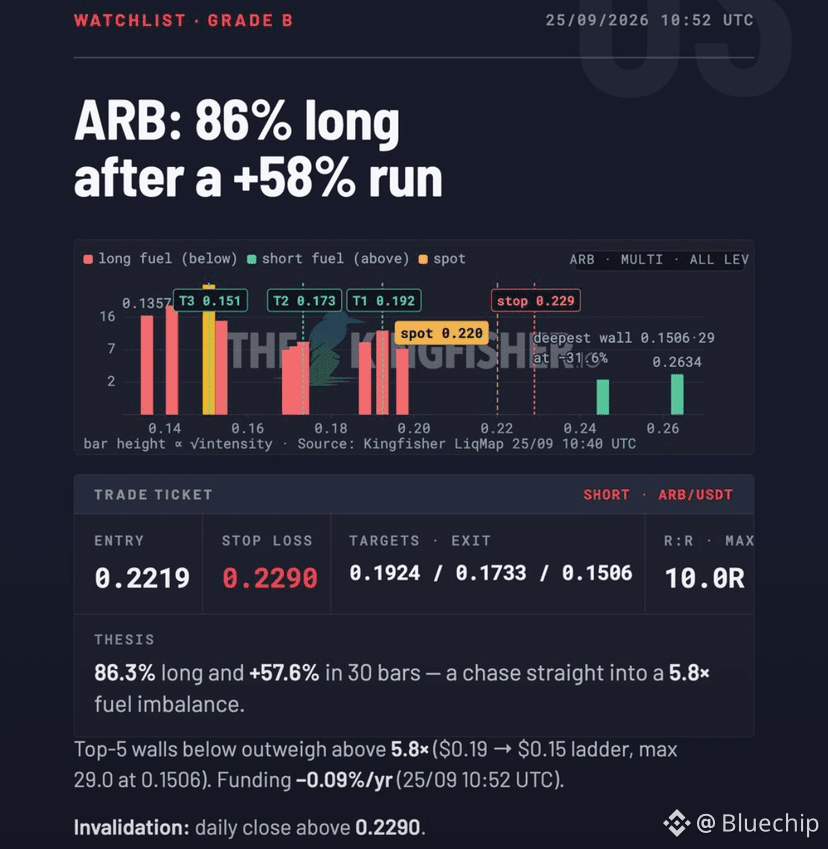
$BCH: 85.1% long, 8.6x fuel below. $ARB: 86.3% long, +57.6% in 30 bars. XRP: 91.5% long on $4.9B.
Since render: XRP +2.4% and ARB +1.3% toward stops.
$BTC BCH ARB XRP 🎣
$BTC gamma is stabilizing: +$11.7M at spot (11:45 UTC), so no grade-A shorts. Board from the 10:40 maps:
$BCH: 85.1% long, 8.6x fuel below. $ARB: 86.3% long, +57.6% in 30 bars. XRP: 91.5% long on $4.9B.
Since render: XRP +2.4% and ARB +1.3% toward stops.
$BTC BCH ARB XRP 🎣
$BCH: 85.1% long, 8.6x fuel below. $ARB: 86.3% long, +57.6% in 30 bars. XRP: 91.5% long on $4.9B.
Since render: XRP +2.4% and ARB +1.3% toward stops.
$BTC BCH ARB XRP 🎣
2
6
2.5k
·
--
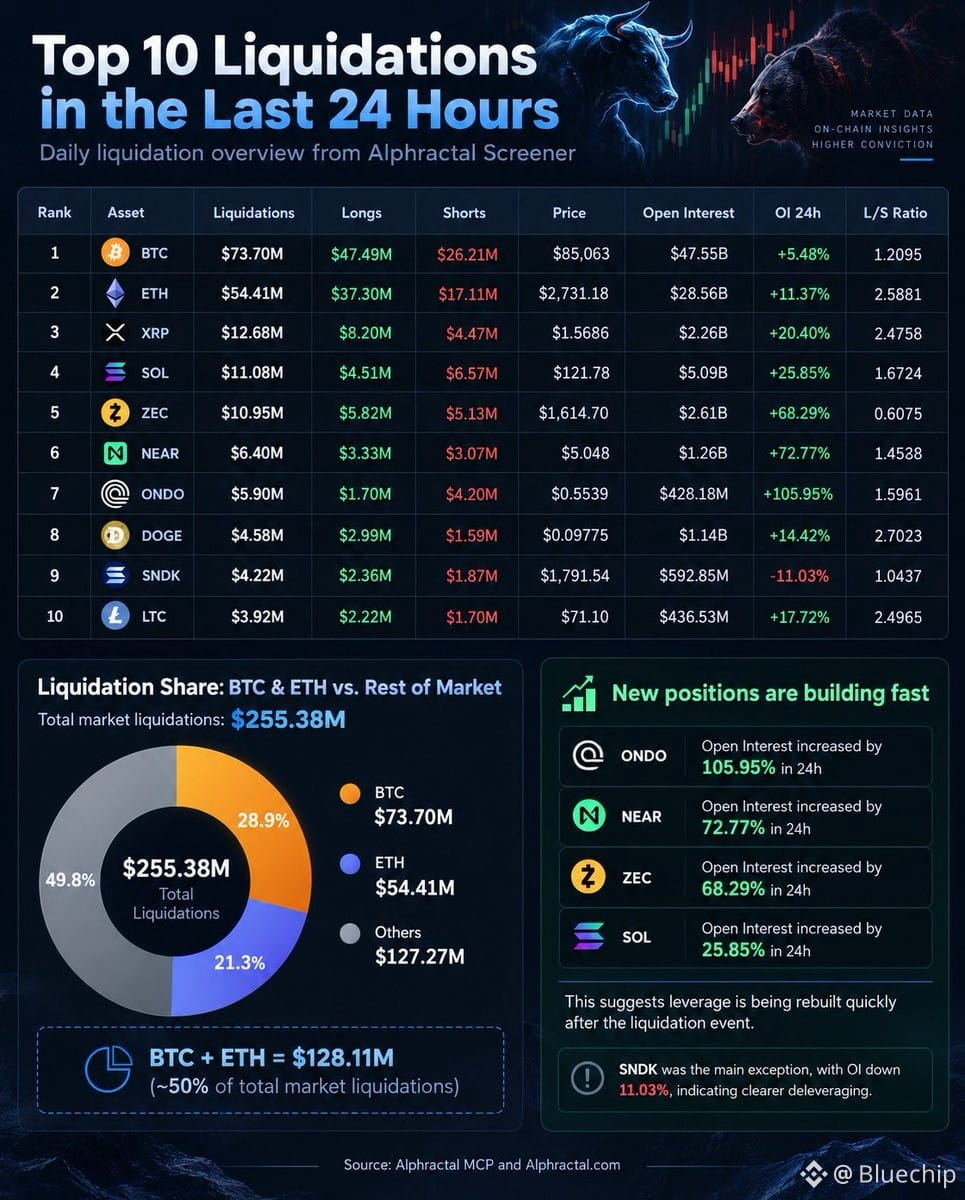
Over the last 24 hours, the market recorded $255.38M in liquidations.
$BTC alone accounted for $73.70M, while ETH accounted for $54.41M, totaling $128.11M, around 50% of all market liquidations.
This shows how BTC and ETH continue to concentrate a significant share of market leverage and liquidation activity.
At the same time, one of the most interesting signals came from the sharp increase in Open Interest across several altcoins:
ONDO: +105.95%
NEAR: +72.77%
ZEC: +68.29%
SOL: +25.85%
All within the last 24 hours.
Even after significant liquidation events, new positions are being opened aggressively across several assets, suggesting that leverage is being rebuilt very quickly.
{future}(BTCUSDT)
Over the last 24 hours, the market recorded $255.38M in liquidations.
$BTC alone accounted for $73.70M, while ETH accounted for $54.41M, totaling $128.11M, around 50% of all market liquidations.
This shows how BTC and ETH continue to concentrate a significant share of market leverage and liquidation activity.
At the same time, one of the most interesting signals came from the sharp increase in Open Interest across several altcoins:
ONDO: +105.95%
NEAR: +72.77%
ZEC: +68.29%
SOL: +25.85%
All within the last 24 hours.
Even after significant liquidation events, new positions are being opened aggressively across several assets, suggesting that leverage is being rebuilt very quickly.
$BTC alone accounted for $73.70M, while ETH accounted for $54.41M, totaling $128.11M, around 50% of all market liquidations.
This shows how BTC and ETH continue to concentrate a significant share of market leverage and liquidation activity.
At the same time, one of the most interesting signals came from the sharp increase in Open Interest across several altcoins:
ONDO: +105.95%
NEAR: +72.77%
ZEC: +68.29%
SOL: +25.85%
All within the last 24 hours.
Even after significant liquidation events, new positions are being opened aggressively across several assets, suggesting that leverage is being rebuilt very quickly.
1
6
1.6k
·
--
Article
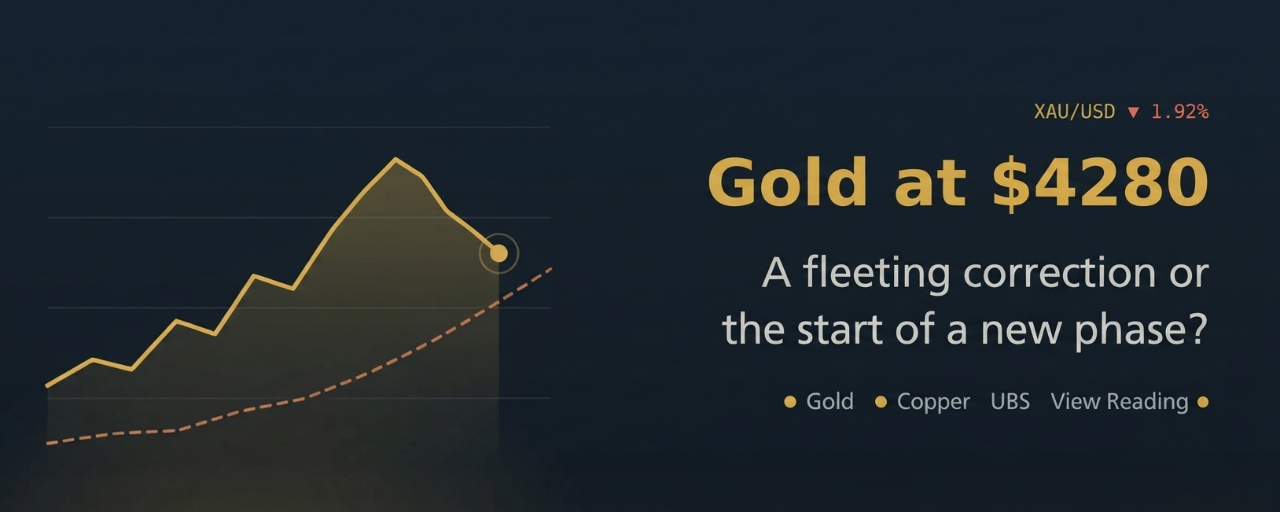
Gold lost 2% in a single day… while central banks keep buying quietly.On Wednesday, gold dropped 1.92% to around $4,280 per ounce.
Within just a few hours, most of the gains made since the Fed’s latest decision disappeared.
Traders are nervous. Headlines are red.
And one question is everywhere:
Is gold’s rally over? $XAUT
{future}(XAUTUSDT)
The short answer: No.
The full answer is much more interesting. 👇
What actually happened?
The story is simple:
U.S. interest rates are high, and the dollar is strong.
When bonds offer attractive yields, why hold an asset that pays no interest?
That’s exactly how part of the market is thinking right now.
Even UBS acknowledges that if rates remain elevated, gold could continue facing short-term pressure.
But this is where the bigger story begins.
The number nobody is talking about
89%
That’s the share of central-bank reserve managers who expect global gold holdings to increase over the next 12 months, according to the World Gold Council’s June survey.
Think about that for a second:
Retail investors may be selling because of higher rates…
While some of the largest players in the global financial system are preparing to buy more.
Central banks aren’t buying gold for a one-week trade.
They’re buying it for much deeper reasons.
{future}(XAUUSDT)
Why are central banks holding onto gold?
UBS highlights three key factors:
1. Gradual diversification away from the dollar
Many countries want to reduce their dependence on the U.S. dollar within their reserves.
2. The mountain of global debt
As debt continues to grow, an asset that isn’t dependent on a government’s promise to repay can become increasingly valuable as a reserve asset.
3. Persistent official-sector demand
A large and patient buyer that doesn’t necessarily sell at the first sign of weakness.
That’s why UBS remains constructive on gold over the next 12 months.
The mistake most investors make
They treat gold like a lottery ticket:
Buy when it goes up.
Sell when it goes down.
But UBS views it differently:
Gold is a portfolio hedge.
A hedge against:
• Geopolitical tensions
• Supply shocks
• Inflation waves
And you don’t abandon your hedge simply because the weather is calm today.
The surprise: The metal that could steal the spotlight
Here’s the part many investors overlook.
UBS isn’t simply saying “hold gold.”
It is also pointing toward another metal:
Copper.
Why?
Because the world is being rebuilt around electrification:
Massive power demand
AI data centers consuming infrastructure
Constrained supply
Every EV.
Every power grid.
Every data center.
All require copper.
The hidden message in the UBS outlook
If you’ve benefited from gold’s rally, UBS raises an idea worth considering:
Elevated prices can create an opportunity to rebalance your portfolio.
Not sell everything.
Not hold everything.
But potentially redirect part of those gains toward other areas of the commodities market.
That isn’t necessarily abandoning gold.
It’s about diversifying the gains.
The takeaway in 3 lines
📉 Short term: Higher rates and a stronger dollar are pressuring gold.
📈 Long term: Central banks continue to accumulate, while the underlying demand story remains significant.
🔄 Potential opportunity: Rebalancing toward copper and other metals linked to the next infrastructure cycle.
Markets don’t reward investors for following panic.
They reward those who understand what’s happening beneath the surface.
So what do you think?
Are you holding gold…
Or do you think copper could be the next major opportunity? $COPPER
{future}(COPPERUSDT)
Share your view in the comments.
And if you found this useful, repost it so others can see it.
Disclaimer: This article is for informational and educational purposes only and does not constitute financial advice or a recommendation to buy or sell any asset.
Gold lost 2% in a single day… while central banks keep buying quietly.
On Wednesday, gold dropped 1.92% to around $4,280 per ounce.
Within just a few hours, most of the gains made since the Fed’s latest decision disappeared.
Traders are nervous. Headlines are red.
And one question is everywhere:
Is gold’s rally over? $XAUT
The short answer: No.
The full answer is much more interesting. 👇
What actually happened?
The story is simple:
U.S. interest rates are high, and the dollar is strong.
When bonds offer attractive yields, why hold an asset that pays no interest?
That’s exactly how part of the market is thinking right now.
Even UBS acknowledges that if rates remain elevated, gold could continue facing short-term pressure.
But this is where the bigger story begins.
The number nobody is talking about
89%
That’s the share of central-bank reserve managers who expect global gold holdings to increase over the next 12 months, according to the World Gold Council’s June survey.
Think about that for a second:
Retail investors may be selling because of higher rates…
While some of the largest players in the global financial system are preparing to buy more.
Central banks aren’t buying gold for a one-week trade.
They’re buying it for much deeper reasons.
Why are central banks holding onto gold?
UBS highlights three key factors:
1. Gradual diversification away from the dollar
Many countries want to reduce their dependence on the U.S. dollar within their reserves.
2. The mountain of global debt
As debt continues to grow, an asset that isn’t dependent on a government’s promise to repay can become increasingly valuable as a reserve asset.
3. Persistent official-sector demand
A large and patient buyer that doesn’t necessarily sell at the first sign of weakness.
That’s why UBS remains constructive on gold over the next 12 months.
The mistake most investors make
They treat gold like a lottery ticket:
Buy when it goes up.
Sell when it goes down.
But UBS views it differently:
Gold is a portfolio hedge.
A hedge against:
• Geopolitical tensions
• Supply shocks
• Inflation waves
And you don’t abandon your hedge simply because the weather is calm today.
The surprise: The metal that could steal the spotlight
Here’s the part many investors overlook.
UBS isn’t simply saying “hold gold.”
It is also pointing toward another metal:
Copper.
Why?
Because the world is being rebuilt around electrification:
Massive power demand
AI data centers consuming infrastructure
Constrained supply
Every EV.
Every power grid.
Every data center.
All require copper.
The hidden message in the UBS outlook
If you’ve benefited from gold’s rally, UBS raises an idea worth considering:
Elevated prices can create an opportunity to rebalance your portfolio.
Not sell everything.
Not hold everything.
But potentially redirect part of those gains toward other areas of the commodities market.
That isn’t necessarily abandoning gold.
It’s about diversifying the gains.
The takeaway in 3 lines
📉 Short term: Higher rates and a stronger dollar are pressuring gold.
📈 Long term: Central banks continue to accumulate, while the underlying demand story remains significant.
🔄 Potential opportunity: Rebalancing toward copper and other metals linked to the next infrastructure cycle.
Markets don’t reward investors for following panic.
They reward those who understand what’s happening beneath the surface.
So what do you think?
Are you holding gold…
Or do you think copper could be the next major opportunity? $COPPER
Share your view in the comments.
And if you found this useful, repost it so others can see it.
Disclaimer: This article is for informational and educational purposes only and does not constitute financial advice or a recommendation to buy or sell any asset.
Within just a few hours, most of the gains made since the Fed’s latest decision disappeared.
Traders are nervous. Headlines are red.
And one question is everywhere:
Is gold’s rally over? $XAUT
The short answer: No.
The full answer is much more interesting. 👇
What actually happened?
The story is simple:
U.S. interest rates are high, and the dollar is strong.
When bonds offer attractive yields, why hold an asset that pays no interest?
That’s exactly how part of the market is thinking right now.
Even UBS acknowledges that if rates remain elevated, gold could continue facing short-term pressure.
But this is where the bigger story begins.
The number nobody is talking about
89%
That’s the share of central-bank reserve managers who expect global gold holdings to increase over the next 12 months, according to the World Gold Council’s June survey.
Think about that for a second:
Retail investors may be selling because of higher rates…
While some of the largest players in the global financial system are preparing to buy more.
Central banks aren’t buying gold for a one-week trade.
They’re buying it for much deeper reasons.
Why are central banks holding onto gold?
UBS highlights three key factors:
1. Gradual diversification away from the dollar
Many countries want to reduce their dependence on the U.S. dollar within their reserves.
2. The mountain of global debt
As debt continues to grow, an asset that isn’t dependent on a government’s promise to repay can become increasingly valuable as a reserve asset.
3. Persistent official-sector demand
A large and patient buyer that doesn’t necessarily sell at the first sign of weakness.
That’s why UBS remains constructive on gold over the next 12 months.
The mistake most investors make
They treat gold like a lottery ticket:
Buy when it goes up.
Sell when it goes down.
But UBS views it differently:
Gold is a portfolio hedge.
A hedge against:
• Geopolitical tensions
• Supply shocks
• Inflation waves
And you don’t abandon your hedge simply because the weather is calm today.
The surprise: The metal that could steal the spotlight
Here’s the part many investors overlook.
UBS isn’t simply saying “hold gold.”
It is also pointing toward another metal:
Copper.
Why?
Because the world is being rebuilt around electrification:
Massive power demand
AI data centers consuming infrastructure
Constrained supply
Every EV.
Every power grid.
Every data center.
All require copper.
The hidden message in the UBS outlook
If you’ve benefited from gold’s rally, UBS raises an idea worth considering:
Elevated prices can create an opportunity to rebalance your portfolio.
Not sell everything.
Not hold everything.
But potentially redirect part of those gains toward other areas of the commodities market.
That isn’t necessarily abandoning gold.
It’s about diversifying the gains.
The takeaway in 3 lines
📉 Short term: Higher rates and a stronger dollar are pressuring gold.
📈 Long term: Central banks continue to accumulate, while the underlying demand story remains significant.
🔄 Potential opportunity: Rebalancing toward copper and other metals linked to the next infrastructure cycle.
Markets don’t reward investors for following panic.
They reward those who understand what’s happening beneath the surface.
So what do you think?
Are you holding gold…
Or do you think copper could be the next major opportunity? $COPPER
Share your view in the comments.
And if you found this useful, repost it so others can see it.
Disclaimer: This article is for informational and educational purposes only and does not constitute financial advice or a recommendation to buy or sell any asset.
1
1
14
2.2k
·
--
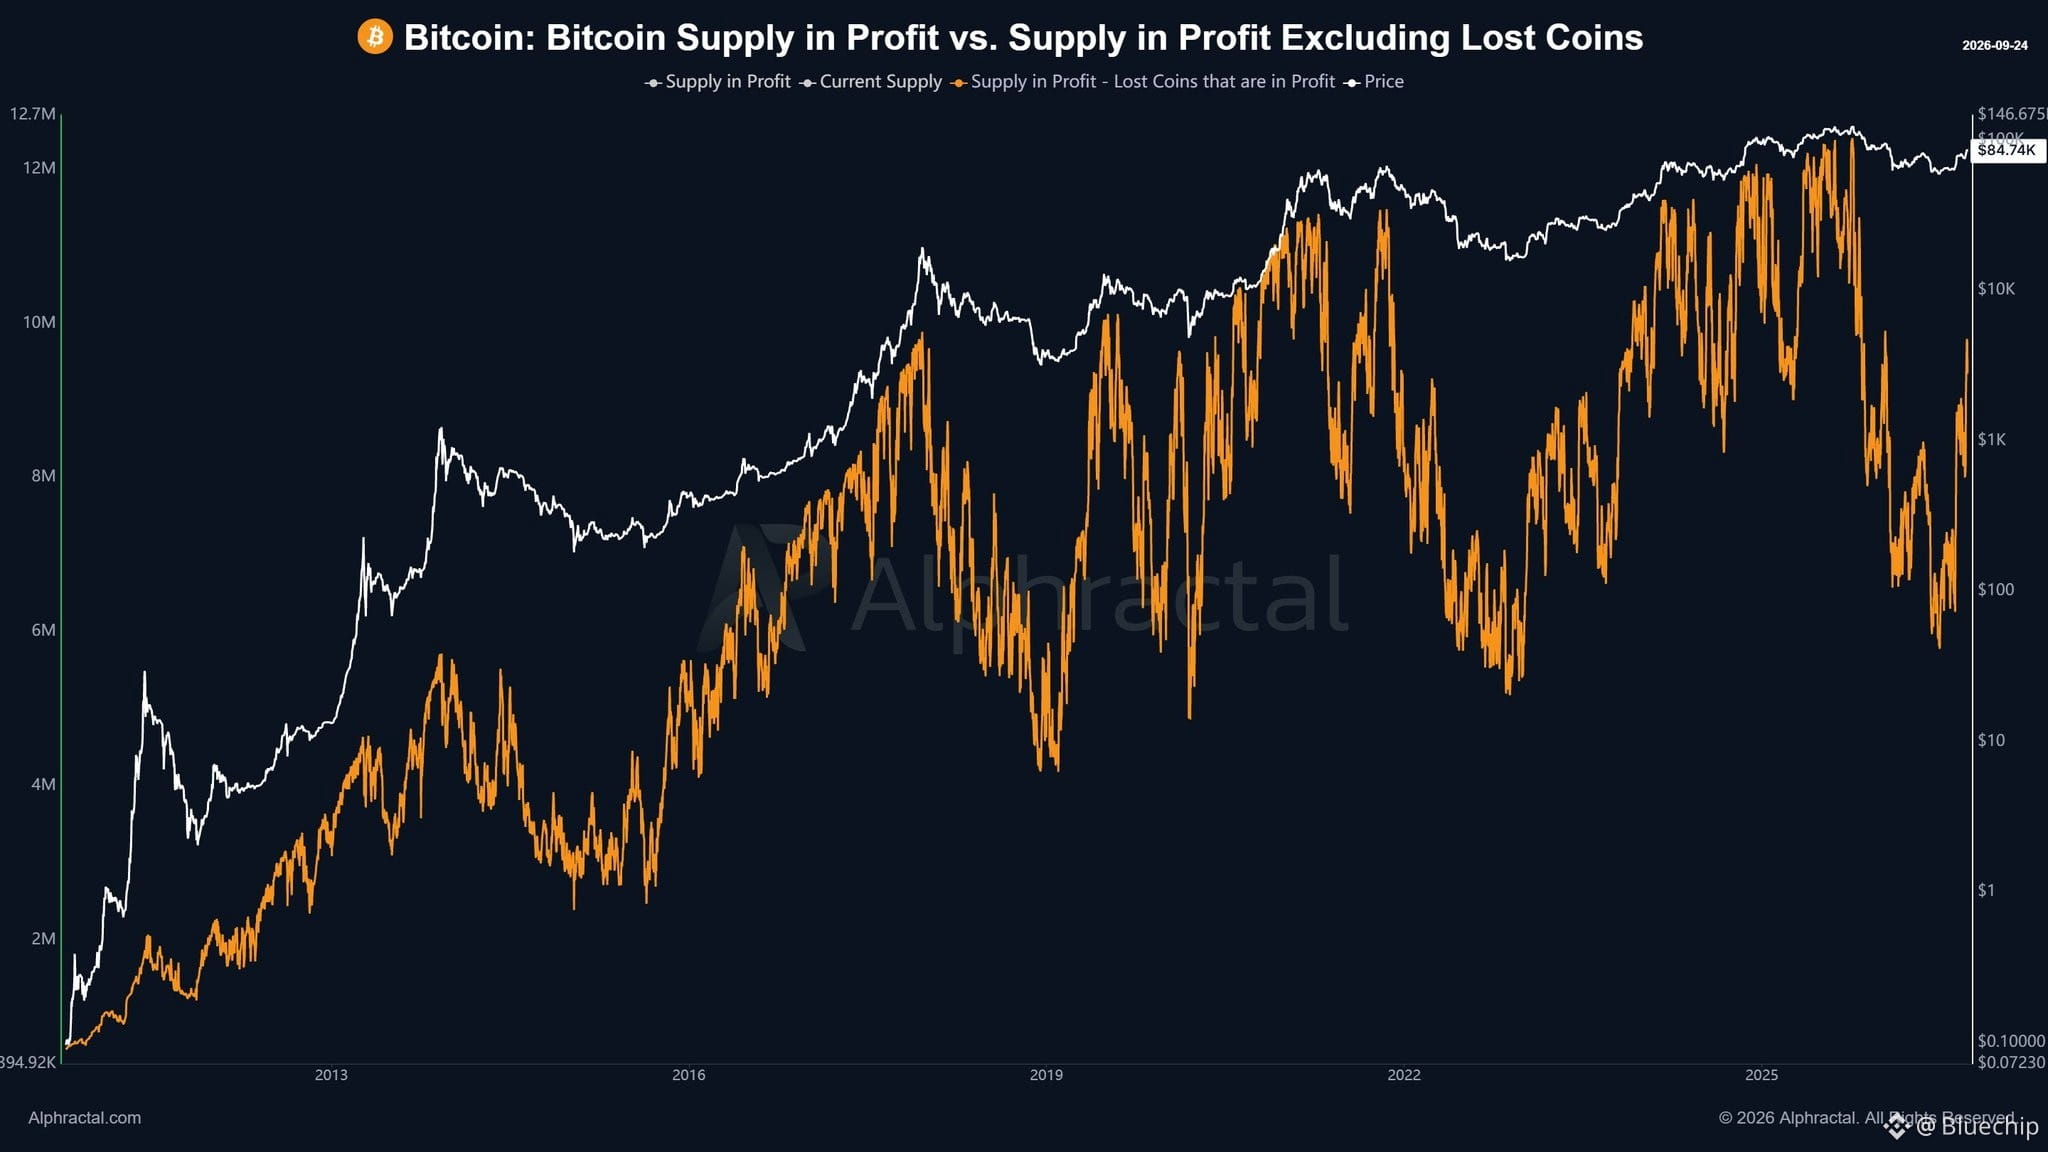
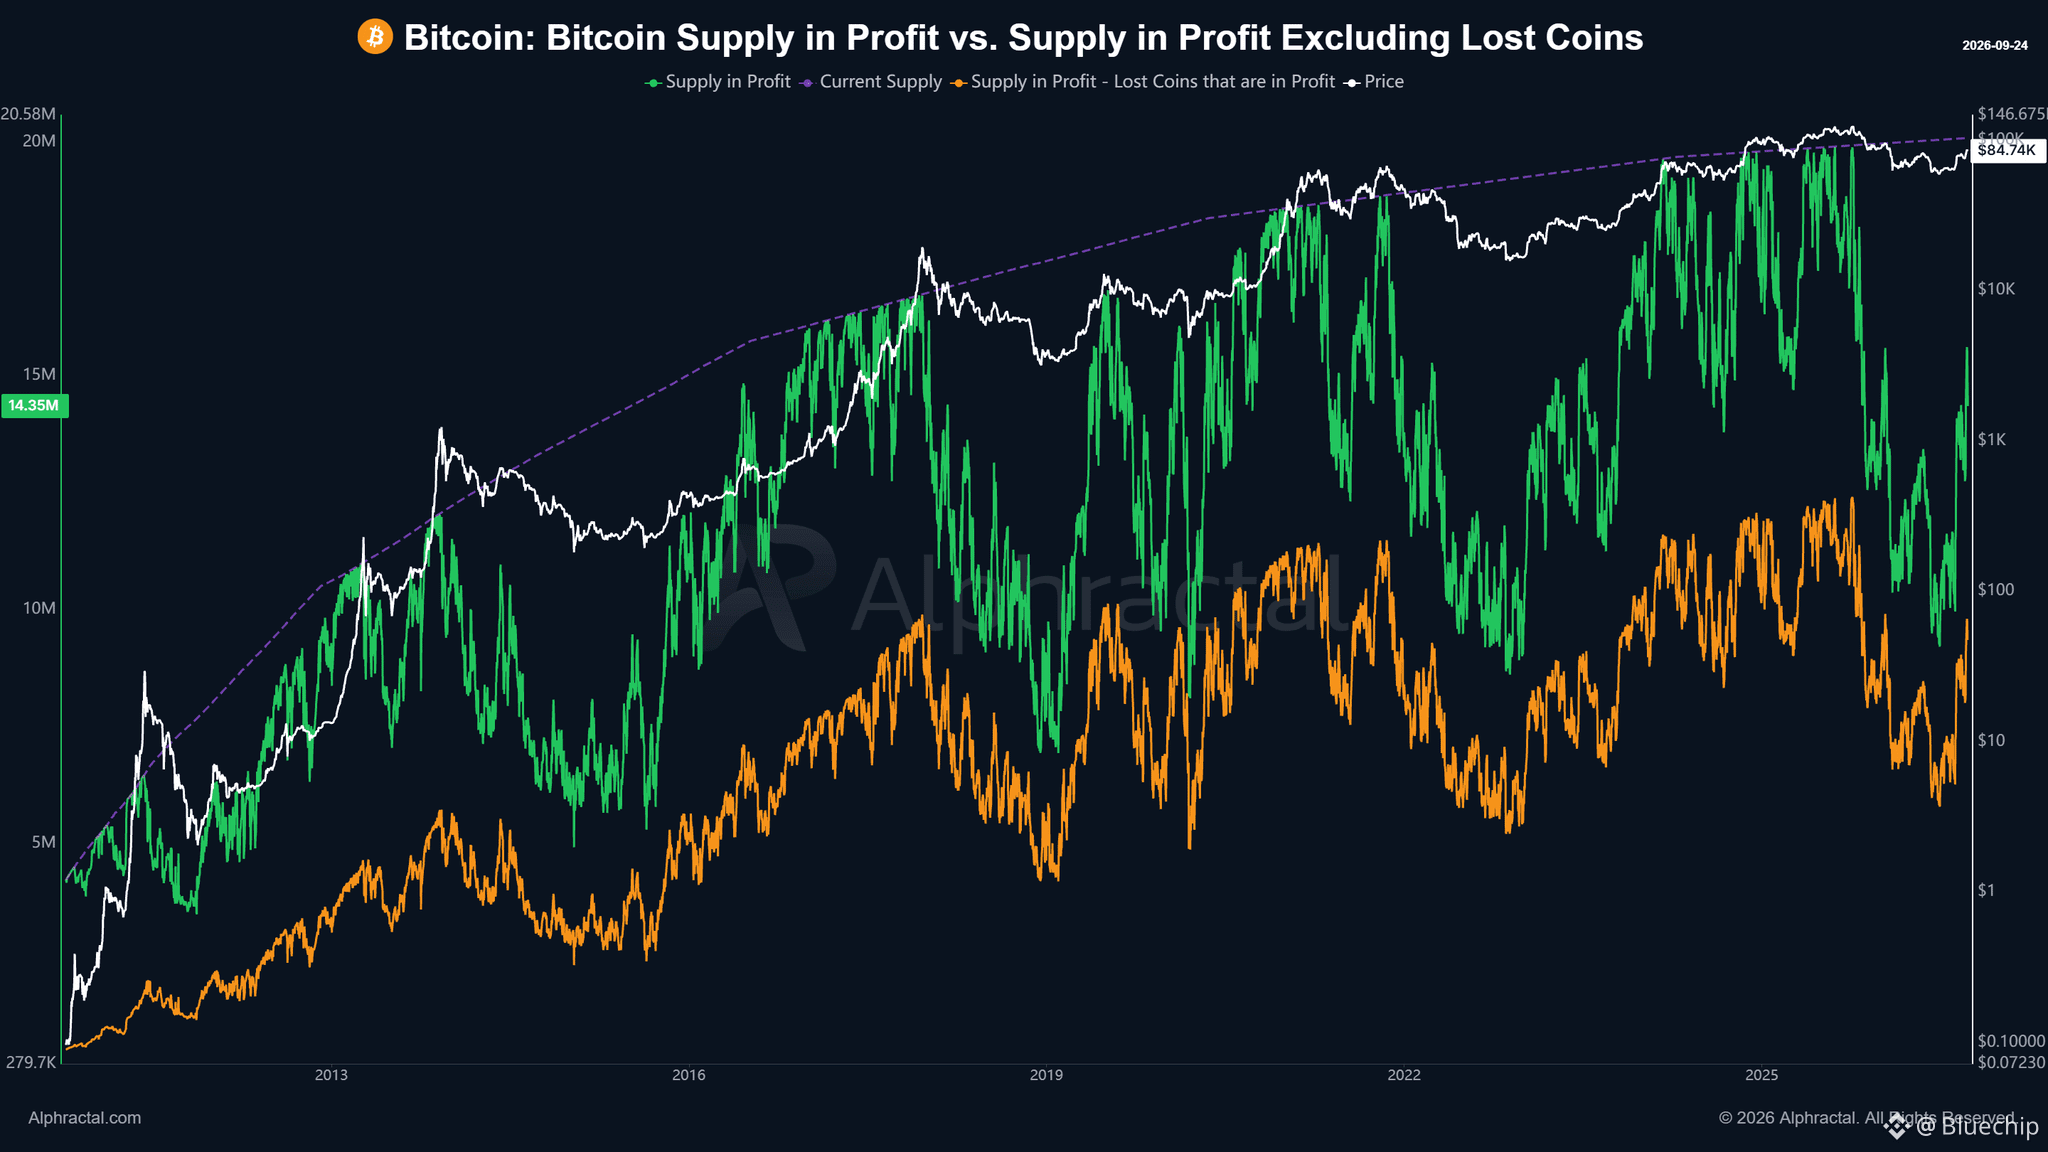
$BTC has a massive amount of old and potentially lost coins.
This includes coins linked to Satoshi Nakamoto, early miners, users who lost access to their wallets, and BTC that has remained dormant for many years.
Looking at the current
- Current Supply: 20.1M BTC
- Supply in Profit: 14.8M BTC, 73.6% of total supply
- Lost Coins in Profit: 5.5M BTC, 27.4% of total supply
- Supply in Profit Excluding Lost Coins: 9.35M BTC, 46.5% of total supply
This means roughly 37% of all BTC currently counted as being in profit may come from coins classified as lost or economically inactive.
Once we remove them, the picture changes significantly.
Traditional Supply in Profit suggests that almost 74% of Bitcoin supply is in profit.
But only around 46.5% of the total supply represents Supply in Profit after excluding these Lost Coins.
This may give us a very different view of the supply that is actually economically relevant to the market.
{future}(BTCUSDT)
$BTC has a massive amount of old and potentially lost coins.
This includes coins linked to Satoshi Nakamoto, early miners, users who lost access to their wallets, and BTC that has remained dormant for many years.
Looking at the current
- Current Supply: 20.1M BTC
- Supply in Profit: 14.8M BTC, 73.6% of total supply
- Lost Coins in Profit: 5.5M BTC, 27.4% of total supply
- Supply in Profit Excluding Lost Coins: 9.35M BTC, 46.5% of total supply
This means roughly 37% of all BTC currently counted as being in profit may come from coins classified as lost or economically inactive.
Once we remove them, the picture changes significantly.
Traditional Supply in Profit suggests that almost 74% of Bitcoin supply is in profit.
But only around 46.5% of the total supply represents Supply in Profit after excluding these Lost Coins.
This may give us a very different view of the supply that is actually economically relevant to the market.
This includes coins linked to Satoshi Nakamoto, early miners, users who lost access to their wallets, and BTC that has remained dormant for many years.
Looking at the current
- Current Supply: 20.1M BTC
- Supply in Profit: 14.8M BTC, 73.6% of total supply
- Lost Coins in Profit: 5.5M BTC, 27.4% of total supply
- Supply in Profit Excluding Lost Coins: 9.35M BTC, 46.5% of total supply
This means roughly 37% of all BTC currently counted as being in profit may come from coins classified as lost or economically inactive.
Once we remove them, the picture changes significantly.
Traditional Supply in Profit suggests that almost 74% of Bitcoin supply is in profit.
But only around 46.5% of the total supply represents Supply in Profit after excluding these Lost Coins.
This may give us a very different view of the supply that is actually economically relevant to the market.
1
5
1.4k
·
--
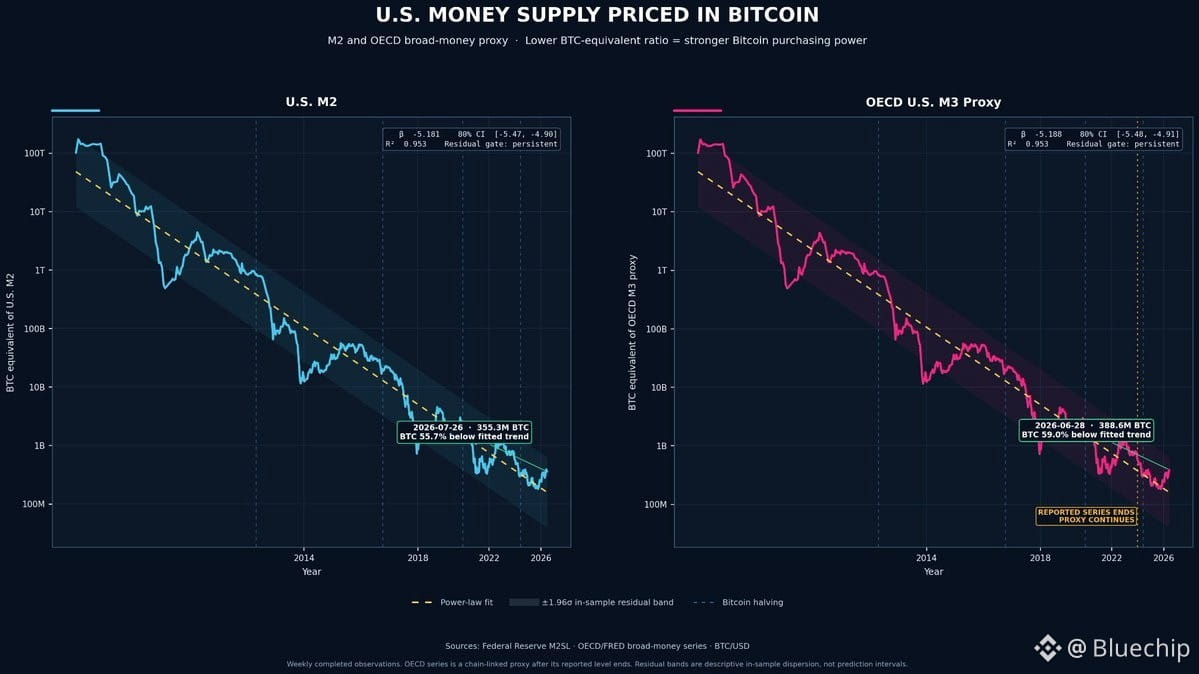
$BTC : EVEN MONEY ITSELF IS LOSING VALUE IN BITCOIN TERMS.
Price the entire U.S. money supply in Bitcoin:
U.S. M2: β = -5.181
OECD U.S. M3 proxy: β = -5.188
Both fits: R² ≈ 0.953
The direction is unmistakable:
It takes fewer and fewer BTC to buy the entire money stock.
That is the deeper monetary point.
The dollar supply keeps expanding.
Bitcoin’s supply does not.
So when you change the denominator from dollars to BTC, even the money supply itself trends toward zero.
{future}(BTCUSDT)
$BTC : EVEN MONEY ITSELF IS LOSING VALUE IN BITCOIN TERMS.
Price the entire U.S. money supply in Bitcoin:
U.S. M2: β = -5.181
OECD U.S. M3 proxy: β = -5.188
Both fits: R² ≈ 0.953
The direction is unmistakable:
It takes fewer and fewer BTC to buy the entire money stock.
That is the deeper monetary point.
The dollar supply keeps expanding.
Bitcoin’s supply does not.
So when you change the denominator from dollars to BTC, even the money supply itself trends toward zero.
Price the entire U.S. money supply in Bitcoin:
U.S. M2: β = -5.181
OECD U.S. M3 proxy: β = -5.188
Both fits: R² ≈ 0.953
The direction is unmistakable:
It takes fewer and fewer BTC to buy the entire money stock.
That is the deeper monetary point.
The dollar supply keeps expanding.
Bitcoin’s supply does not.
So when you change the denominator from dollars to BTC, even the money supply itself trends toward zero.
2
558
·
--
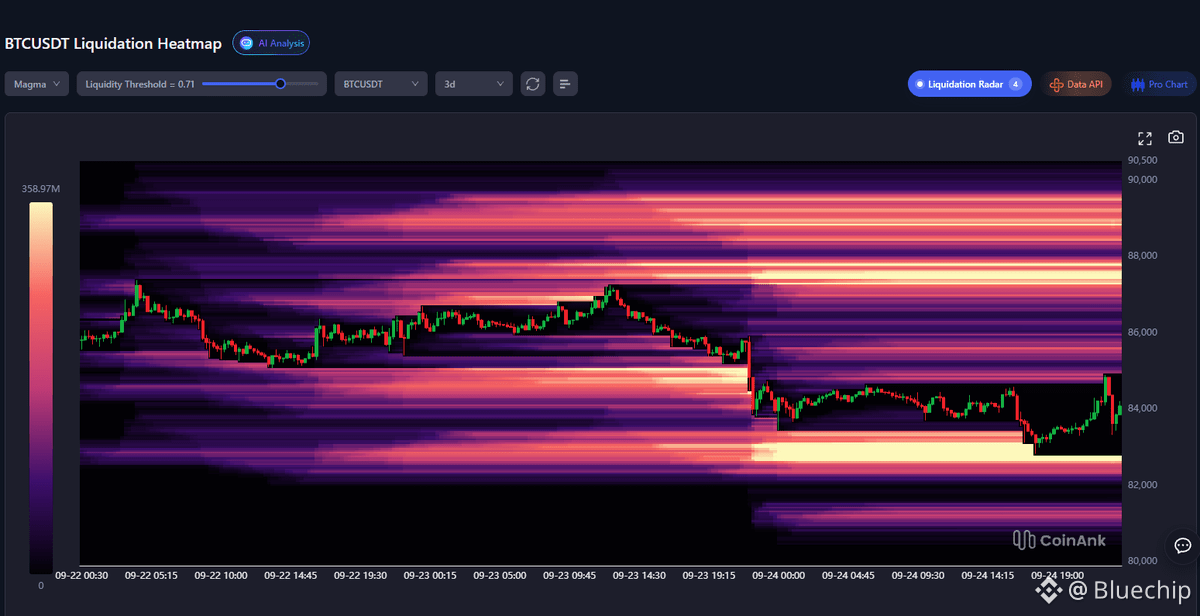
$BTC DUMPED INTO THE $83K HEAT. THAT’S THE LINE.
Price fell out of $87k, sliced through the mid-range, and tagged the brightest band below around $83,000 – $83,400. That’s the high-intensity long pocket. Price is bouncing off it now, holding around $84,000.
Overhead, the next short cluster is still stacked near $87,500 – $88,000, with more density toward $89,000.
{future}(BTCUSDT)
$BTC DUMPED INTO THE $83K HEAT. THAT’S THE LINE.
Price fell out of $87k, sliced through the mid-range, and tagged the brightest band below around $83,000 – $83,400. That’s the high-intensity long pocket. Price is bouncing off it now, holding around $84,000.
Overhead, the next short cluster is still stacked near $87,500 – $88,000, with more density toward $89,000.
Price fell out of $87k, sliced through the mid-range, and tagged the brightest band below around $83,000 – $83,400. That’s the high-intensity long pocket. Price is bouncing off it now, holding around $84,000.
Overhead, the next short cluster is still stacked near $87,500 – $88,000, with more density toward $89,000.
1
1
10
3k
·
--
Verified
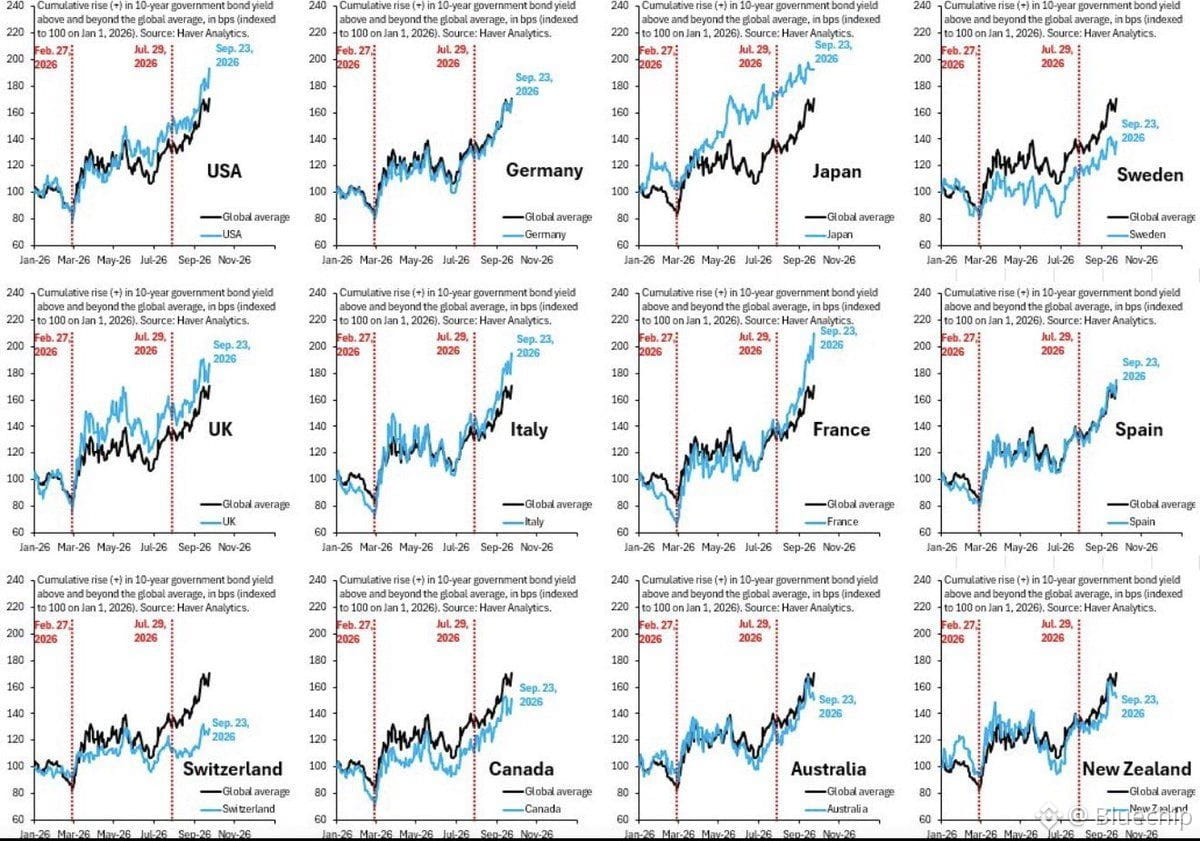
🚨 A GLOBAL BOND MARKET SHOCK
Are we witnessing the early signs of a major new deal between Trump and China?
Government bond markets around the world just experienced one of their worst days in years.
Yields surged sharply and unexpectedly across:
🇺🇸 The U.S.
🇩🇪 Germany
🇯🇵 Japan
🇬🇧 The U.K.
🇸🇪 Sweden
🇮🇹 Italy
🇫🇷 France
🇪🇸 Spain
🇨🇭 Switzerland
🇨🇦 Canada
🇦🇺 Australia
🇳🇿 New Zealand
This isn’t just about abstract charts and numbers.
It may be connected to major economic and geopolitical shifts happening behind the scenes.
According to data from economist Robin Brooks, the cumulative rise in 10-year government bond yields has significantly exceeded historical averages across many major economies.
That kind of synchronized move raises an important question:
Why are investors suddenly demanding higher yields across so many sovereign bond markets?
One of the more controversial interpretations circulating in financial circles is that markets may be pricing in the possibility of a major and unexpected deal between Donald Trump and China.
Under this scenario:
🇨🇳 China could be allowed to export more refined and manufactured products to global markets to meet rising demand.
In return…
🇺🇸 China could potentially receive greater room to expand its influence and manage its regional affairs in Asia with less direct Western interference.
If this interpretation is correct, then this may be much bigger than a temporary move in interest rates.
It could signal a potential shift in:
• Global trade flows
• Supply chains
• Geopolitical influence
• Sovereign bond markets
• And the balance of economic power
But there’s one important caveat:
This remains a market interpretation, not a confirmed agreement.
The real question is:
Are bond markets simply repricing inflation, growth and fiscal risks…
Or are they quietly pricing in a much bigger geopolitical reset?
🚨 A GLOBAL BOND MARKET SHOCK
Are we witnessing the early signs of a major new deal between Trump and China?
Government bond markets around the world just experienced one of their worst days in years.
Yields surged sharply and unexpectedly across:
🇺🇸 The U.S.
🇩🇪 Germany
🇯🇵 Japan
🇬🇧 The U.K.
🇸🇪 Sweden
🇮🇹 Italy
🇫🇷 France
🇪🇸 Spain
🇨🇭 Switzerland
🇨🇦 Canada
🇦🇺 Australia
🇳🇿 New Zealand
This isn’t just about abstract charts and numbers.
It may be connected to major economic and geopolitical shifts happening behind the scenes.
According to data from economist Robin Brooks, the cumulative rise in 10-year government bond yields has significantly exceeded historical averages across many major economies.
That kind of synchronized move raises an important question:
Why are investors suddenly demanding higher yields across so many sovereign bond markets?
One of the more controversial interpretations circulating in financial circles is that markets may be pricing in the possibility of a major and unexpected deal between Donald Trump and China.
Under this scenario:
🇨🇳 China could be allowed to export more refined and manufactured products to global markets to meet rising demand.
In return…
🇺🇸 China could potentially receive greater room to expand its influence and manage its regional affairs in Asia with less direct Western interference.
If this interpretation is correct, then this may be much bigger than a temporary move in interest rates.
It could signal a potential shift in:
• Global trade flows
• Supply chains
• Geopolitical influence
• Sovereign bond markets
• And the balance of economic power
But there’s one important caveat:
This remains a market interpretation, not a confirmed agreement.
The real question is:
Are bond markets simply repricing inflation, growth and fiscal risks…
Or are they quietly pricing in a much bigger geopolitical reset?
Are we witnessing the early signs of a major new deal between Trump and China?
Government bond markets around the world just experienced one of their worst days in years.
Yields surged sharply and unexpectedly across:
🇺🇸 The U.S.
🇩🇪 Germany
🇯🇵 Japan
🇬🇧 The U.K.
🇸🇪 Sweden
🇮🇹 Italy
🇫🇷 France
🇪🇸 Spain
🇨🇭 Switzerland
🇨🇦 Canada
🇦🇺 Australia
🇳🇿 New Zealand
This isn’t just about abstract charts and numbers.
It may be connected to major economic and geopolitical shifts happening behind the scenes.
According to data from economist Robin Brooks, the cumulative rise in 10-year government bond yields has significantly exceeded historical averages across many major economies.
That kind of synchronized move raises an important question:
Why are investors suddenly demanding higher yields across so many sovereign bond markets?
One of the more controversial interpretations circulating in financial circles is that markets may be pricing in the possibility of a major and unexpected deal between Donald Trump and China.
Under this scenario:
🇨🇳 China could be allowed to export more refined and manufactured products to global markets to meet rising demand.
In return…
🇺🇸 China could potentially receive greater room to expand its influence and manage its regional affairs in Asia with less direct Western interference.
If this interpretation is correct, then this may be much bigger than a temporary move in interest rates.
It could signal a potential shift in:
• Global trade flows
• Supply chains
• Geopolitical influence
• Sovereign bond markets
• And the balance of economic power
But there’s one important caveat:
This remains a market interpretation, not a confirmed agreement.
The real question is:
Are bond markets simply repricing inflation, growth and fiscal risks…
Or are they quietly pricing in a much bigger geopolitical reset?
6
1k
·
--
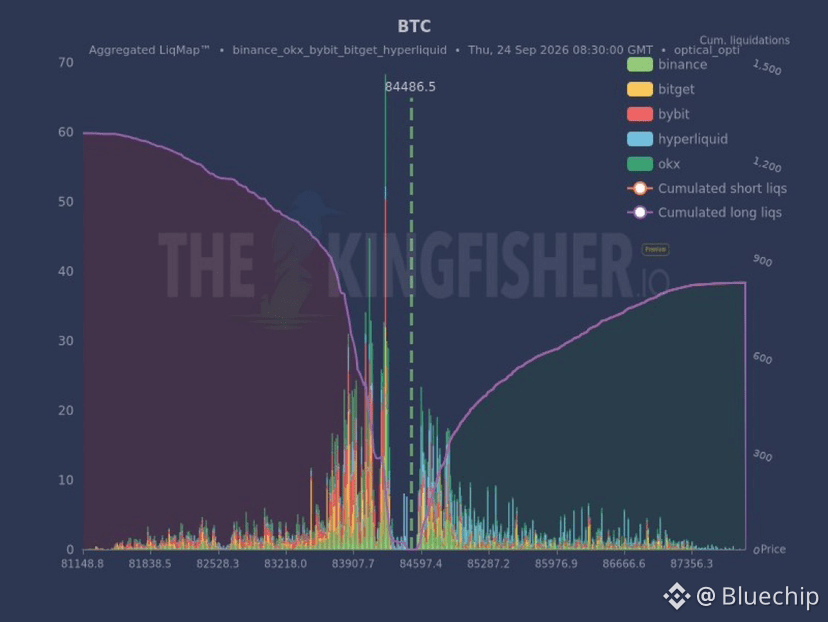
$BTC liquidations map - high leverage (>x20).
Not much to squeeze here. Positions look light on both sides.
{future}(BTCUSDT)
$BTC liquidations map - high leverage (>x20).
Not much to squeeze here. Positions look light on both sides.
Not much to squeeze here. Positions look light on both sides.
1
9
1.8k
·
--
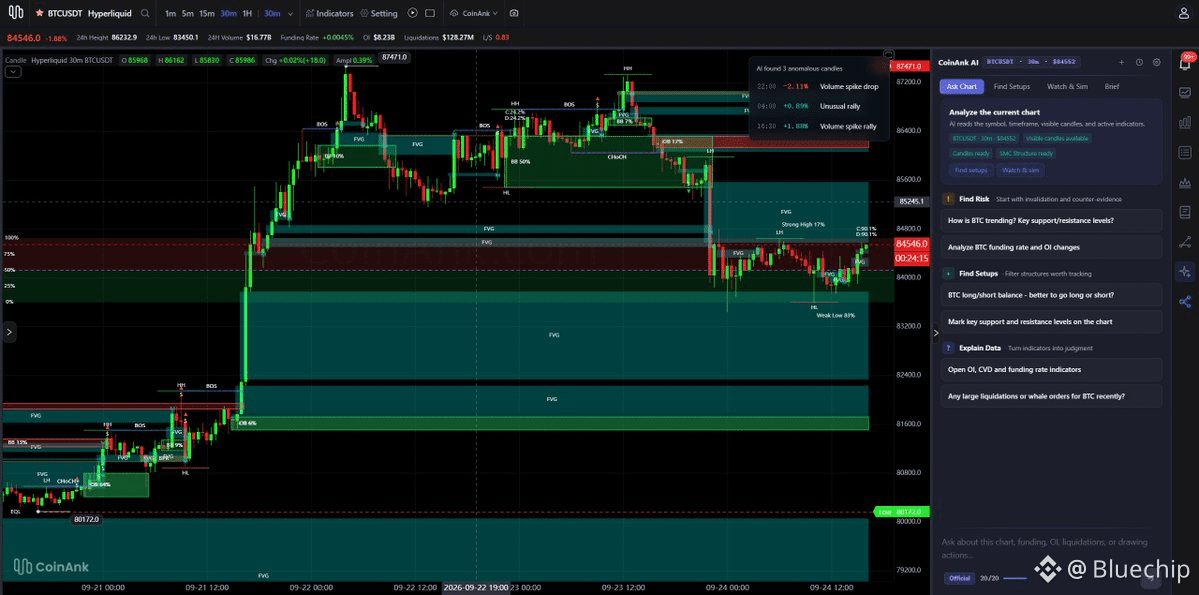
$87.5K GOT REJECTED. PRICE IS SITTING IN THE FVG.
$BTC is trading around $84,546 after tagging $87,471.
The 30m printed the full sequence: higher high, then CHoCH, then a dump into the imbalance.
Price is now bouncing inside the FVG around $84.5k–$85.2k. 24h volume $16.77B. OI $8.23B. $128.27M liquidated.
{future}(BTCUSDT)
$87.5K GOT REJECTED. PRICE IS SITTING IN THE FVG.
$BTC is trading around $84,546 after tagging $87,471.
The 30m printed the full sequence: higher high, then CHoCH, then a dump into the imbalance.
Price is now bouncing inside the FVG around $84.5k–$85.2k. 24h volume $16.77B. OI $8.23B. $128.27M liquidated.
$BTC is trading around $84,546 after tagging $87,471.
The 30m printed the full sequence: higher high, then CHoCH, then a dump into the imbalance.
Price is now bouncing inside the FVG around $84.5k–$85.2k. 24h volume $16.77B. OI $8.23B. $128.27M liquidated.
2
7
1.6k
·
--
Verified
Just In: Binance to list Hyperliquid ($HYPE ) on Sept. 24
Binance will list Hyperliquid (HYPE) on Sept. 24 at 19:00 UTC+8, opening HYPE/USDT, HYPE/USDC and HYPE/TRY spot trading pairs, with deposits starting an hour later and withdrawals expected to open on Sept. 25.
HYPE will carry Binance’s Seed Tag. Hyperliquid is the leading decentralized perpetual-futures exchange by normalized trading volume, with HYPE’s market capitalization at about $21 billion as of Sept. 24.
{future}(HYPEUSDT)
Just In: Binance to list Hyperliquid ($HYPE ) on Sept. 24
Binance will list Hyperliquid (HYPE) on Sept. 24 at 19:00 UTC+8, opening HYPE/USDT, HYPE/USDC and HYPE/TRY spot trading pairs, with deposits starting an hour later and withdrawals expected to open on Sept. 25.
HYPE will carry Binance’s Seed Tag. Hyperliquid is the leading decentralized perpetual-futures exchange by normalized trading volume, with HYPE’s market capitalization at about $21 billion as of Sept. 24.
Binance will list Hyperliquid (HYPE) on Sept. 24 at 19:00 UTC+8, opening HYPE/USDT, HYPE/USDC and HYPE/TRY spot trading pairs, with deposits starting an hour later and withdrawals expected to open on Sept. 25.
HYPE will carry Binance’s Seed Tag. Hyperliquid is the leading decentralized perpetual-futures exchange by normalized trading volume, with HYPE’s market capitalization at about $21 billion as of Sept. 24.

1
1
17
12k
Log in to explore more content
Join global crypto users on Binance Square
⚡️ Get latest and useful information about crypto.
💬 Trusted by the world’s largest crypto exchange.
👍 Discover real insights from verified creators.
Email / Phone number
Trending Topics
CircleTetherFreezeBitgetHackerWallet
18,371 views
204 Discussing
#circletetherfreezebitgethackerwallet 🚨 CIRCLE & TETHER FREEZE BITGET HACKER WALLET
A major crypto security incident has triggered another important debate around stablecoin controls.
Bitget reported a massive security breach on September 24, with the initial loss estimated at $351.6M. The exchange later revised the affected-asset estimate to approximately $387.5M, after accounting for additional assets including Zcash and TRON.
🔒 Circle & Tether Take Action
Circle blacklisted a wallet identified as “Bitget Exploiter 8”, while Tether subsequently blocked the same address.
The wallet contained approximately:
• 99,990 USDC
• 218,023 USDT
• 170.47 ETH
The freeze effectively locked around $318,000 worth of USDC and USDT.
⚠️ But there is a major limitation:
Stablecoin issuers can freeze their own tokens, but they cannot freeze native ETH. Reports indicate that other exploiter wallets still held more than 63,000 ETH.
Bitget CEO Gracy Chen said the attackers compromised a backend system in the exchange's wallet infrastructure and spoofed transaction data, rather than obtaining users' private keys. Bitget says its cold wallets were unaffected and its User Protection Fund holds more than $464M.
📌 The bigger takeaway:
This incident shows both the power and limits of centralized stablecoin controls. USDC and USDT can potentially be frozen at the token-contract level, while assets such as ETH cannot be frozen by stablecoin issuers.
👀 Assets to watch:
$BTC • $ETH • $XRP
#Bitget #CryptoSecurity #Circle #Tether #USDC #USDT #CryptoNews
Ayeshg
·2 Likes
·9.3k views
SECSaysTokenBuybacksNotAutoSecurities
1,738 views
74 Discussing
ChinaUSAgreeOn$30BTariffCut
156 views
3 Discussing