After ten years of ups and downs in the cryptocurrency world, I have reaped substantial rewards during bull markets, but I have also fallen to rock bottom twice, nearing financial collapse. Now, I can make a living by trading cryptocurrencies, having withdrawn over 8 million yuan for living expenses, while steadily holding over 26 million in assets in my account. This journey has not been easy, and it has all been due to my perseverance!
Behind this, I owe it to my in-depth study and practice of the classic trading rules of moving averages. It has allowed me to capture almost all of my holding profits, deeply understanding the essence of 'the greatest principles are the simplest.' I adhere to this trading system, and over time, it has become like my private bank, continuously generating wealth for me.
The trading system I follow is a comprehensive system that covers trading philosophy, signal capture, risk control, and emotion regulation.
- Trading philosophy: It is my deep insight into the market and clear setting of trading goals. Whether pursuing trends, waves, or other specific trading opportunities, I am always aware.
- Trading signals: I accurately capture buying and selling opportunities based on technical analysis indicators (such as moving averages, MACD, etc.) or fundamental analysis information to ensure that decisions are based on solid reasoning.
- Risk management: I carefully set stop-loss and take-profit points and reasonably plan fund management to ensure that I can remain stable amid market fluctuations, keeping losses within an acceptable range.
- Emotion control: I always remain calm and rational, avoiding being swayed by greed or fear, ensuring that trading decisions are not disturbed by emotions.
Of course, executing this trading system is not an easy task. It requires me to overcome psychological barriers, firmly execute the trading plan, and continuously optimize and improve the system to adapt to the ever-changing market environment.
There is no need to delve into the off-market reasons behind price formation; just focus on the K-line.
Do not have the mindset of being 'cut off' by the market.
Why there is no need to delve into the details, just read the K-line chart
In the market, especially in the gold market, the types and numbers of participants are extremely large, including:
Central banks from around the world, such as the People's Bank of China
Global financial giants, such as UBS, the four major American investment banks (Merrill, Morgan, PwC, Goldman Sachs), Citibank, etc.
Large commercial enterprises, such as Japan's Mitsubishi Group, South Korea's Samsung Group
Various funds and investment banks
Top billionaires, such as Bill Gates, etc.
These participants' games in the market involve a variety of analytical tools and methods:
Fundamental analysis: Analyze economic data, political events, etc.
Technical analysis: Use charts and technical indicators to analyze market trends
Software trading: Using automated trading systems (EA) to trade based on specific rules.
Since we cannot figure out the specific tools and analysis methods used by each institution or individual, nor can we understand all their trading decision details, such deep analysis is actually unrealistic.
However, it is worth noting that despite the different analytical methods of these participants, their game results ultimately reflect in the market's price trends, that is, on the K-line chart. Therefore, our focus should be on analyzing the information provided by the K-line chart, as this information has already integrated the decisions and behaviors of all market participants.
Therefore, we only need to analyze the information provided by the K-line chart to make reasonable market judgments and trading decisions.
The mindset of being 'cut off'
Many people believe that there are market makers 'cutting off' the retail investors; this idea usually reflects several aspects behind it:
1. Escaping reality: When investors incur losses in the market, blaming 'market makers' or market manipulation is a common psychological defense mechanism. This explanation allows one to avoid facing shortcomings in their investment decisions and strategies.
2. Market volume issues: For most major trading varieties (such as major stocks, forex, commodities, etc.), the market volume is very large and the participants are extremely diverse. In these markets, retail investors typically account for a low proportion of the overall market. Even with the presence of market makers or large institutions, their operations will not simply target every retail investor. Instead, market price fluctuations usually reflect the competition among bullish forces.
Why is the notion of market makers controlling the market not always valid?
The market volume is enormous: As mentioned earlier, the volume of large markets far exceeds the investment scale of individual retail investors. Even if there are market makers or large institutions, their operations cannot simply target every retail investor, but rather reflect the overall dynamics and capital flows of the market.
Bullish game: There are a wide variety of participants in the market, including institutional investors, hedge funds, retail investors, central banks, etc. Each participant has their own strategies and goals, and the fluctuations in market prices are usually the result of the interaction of these forces.
Market rules: In formal trading markets, the manipulative behaviors of market makers are usually subject to regulation. Large-scale market manipulation activities will attract the attention of regulatory authorities and will be punished accordingly.
How to avoid being influenced by market makers?
1. Enhance investment capabilities: Continuously learn and improve your investment knowledge and skills, constantly optimizing your trading strategies. Understanding the basic rules of the market and tools of technical analysis can help you better judge market trends rather than simply relying on market rumors.
2. Choose trading varieties with large market volume and strong liquidity: When selecting trading varieties, prioritize assets with large market volume and strong liquidity to reduce the risk of being manipulated by individual large institutions.
3. Risk management: Reasonably allocate funds, set stop-loss points, and control the risk of each trade. Good risk management can help you maintain a stable investment state amid market fluctuations.
4. Stay objective: Maintain objectivity towards market fluctuations and avoid easily attributing failures to market makers; instead, improve your trading skills through summarizing experiences and adjusting strategies.
Preview of this section
Next, we will start learning about 'trading ranges'.
This section mainly discusses the basic concepts of trading ranges, their formation reasons, and their performance on K-line charts.
Trading range
Let's first take a look at a few cases of trading ranges:
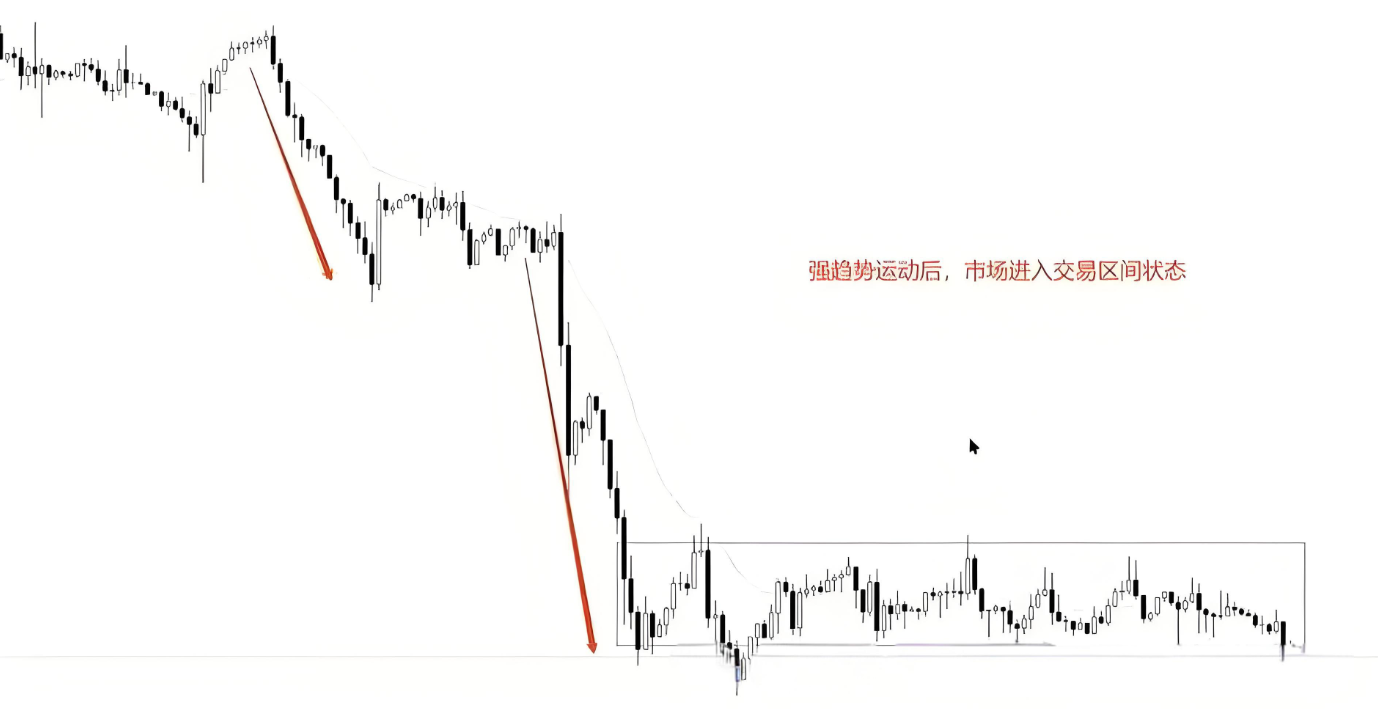
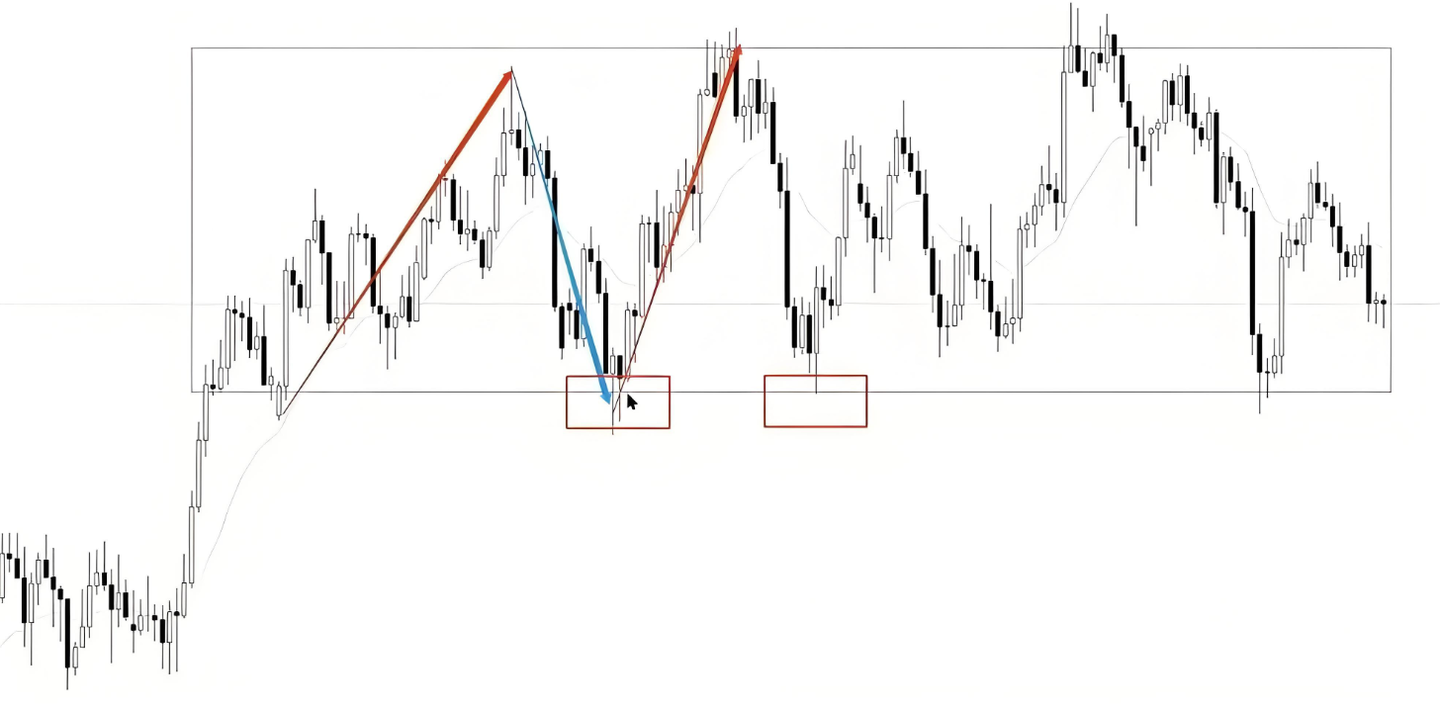
The two-hour chart of gold
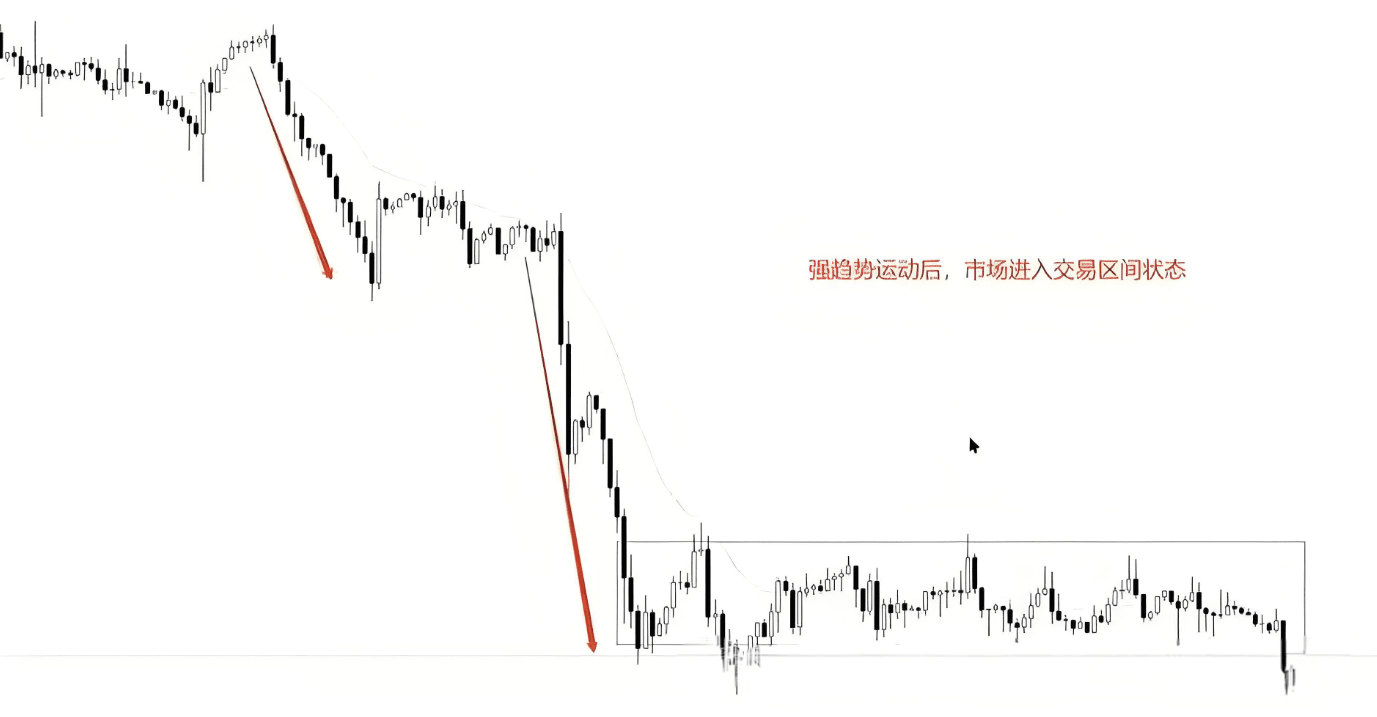
This chart shows that the price has gone through two phases of decline, after which the market entered a trading range state. After a strong trend movement, the price showed lateral fluctuations, forming a trading range.
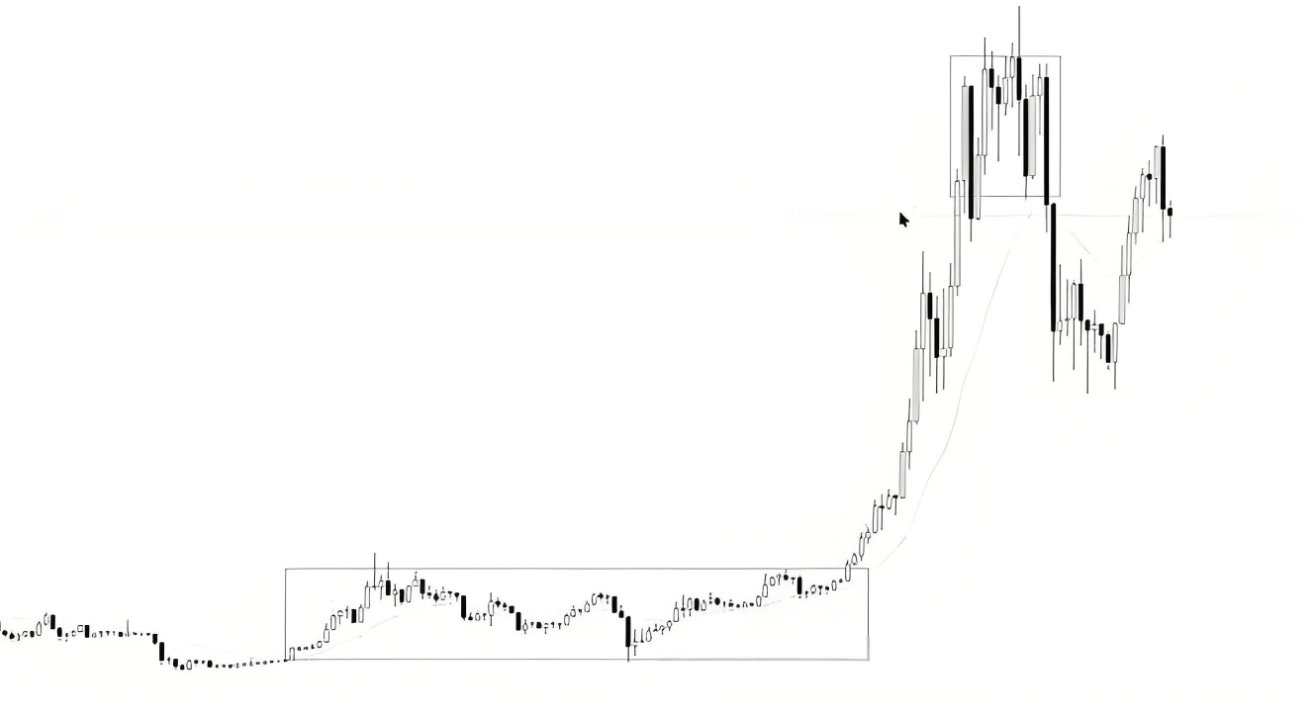
The two-hour chart of gold (another example)
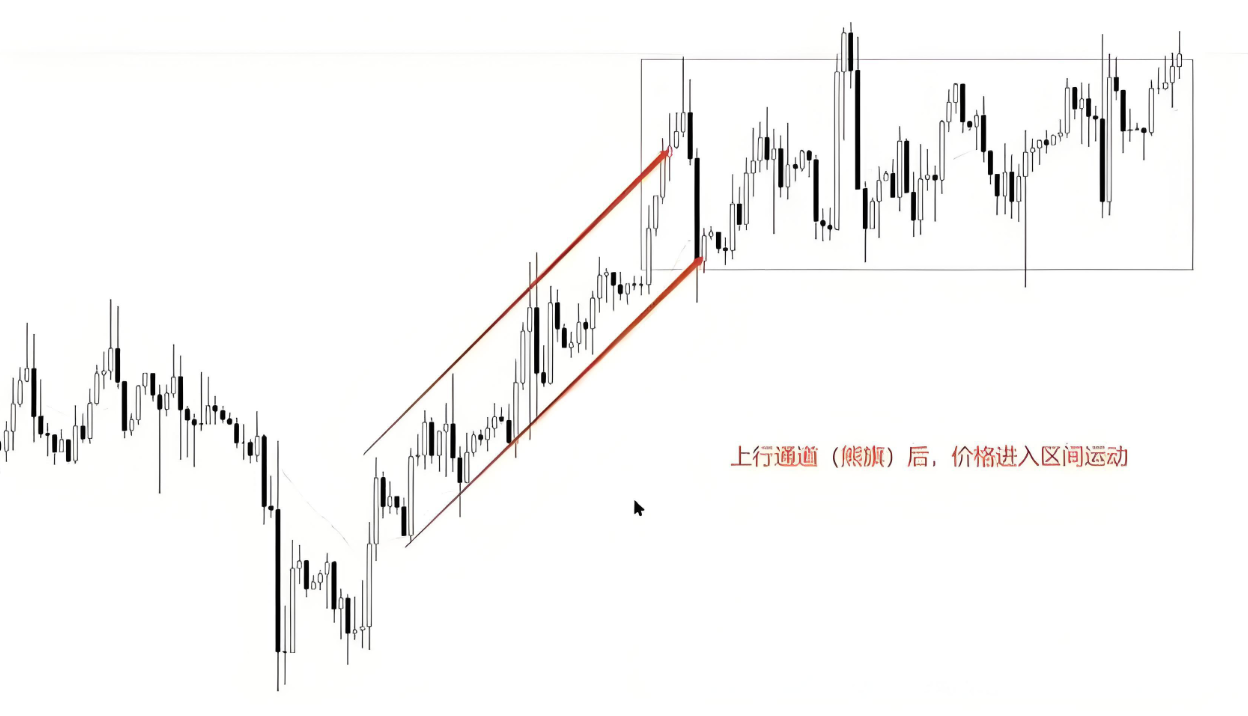
In this example, gold forms an upward channel on the two-hour chart, and then the price enters a horizontal range movement. This indicates that after experiencing an upward channel, the market begins a period of oscillation.
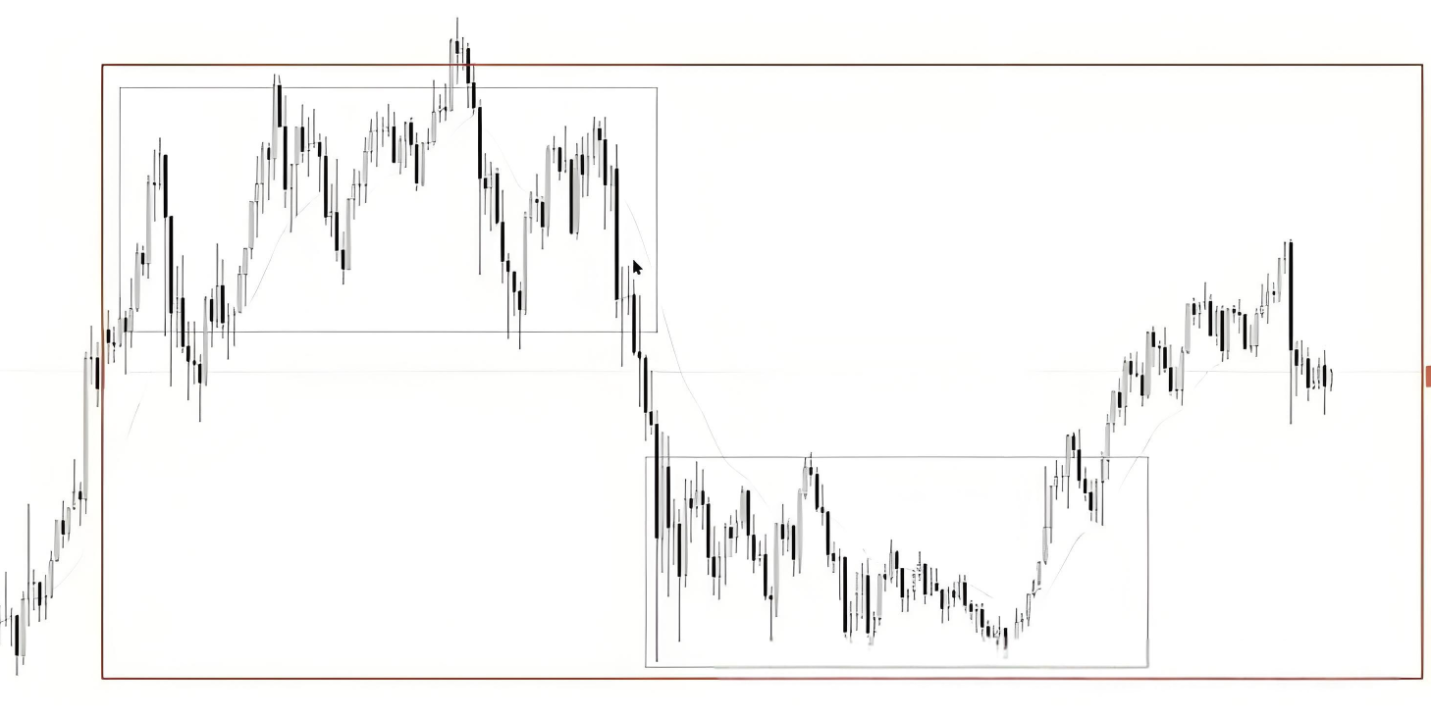
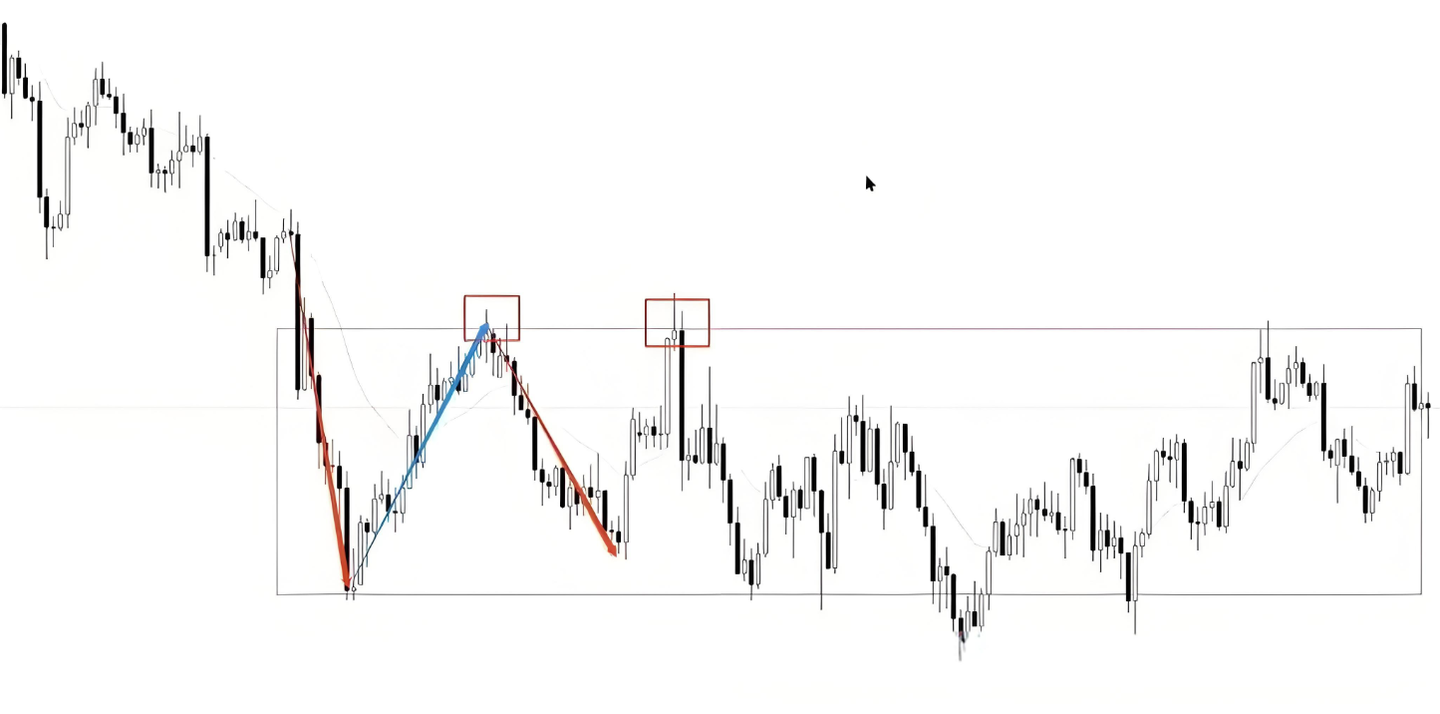
The four-hour chart of WTI crude oil
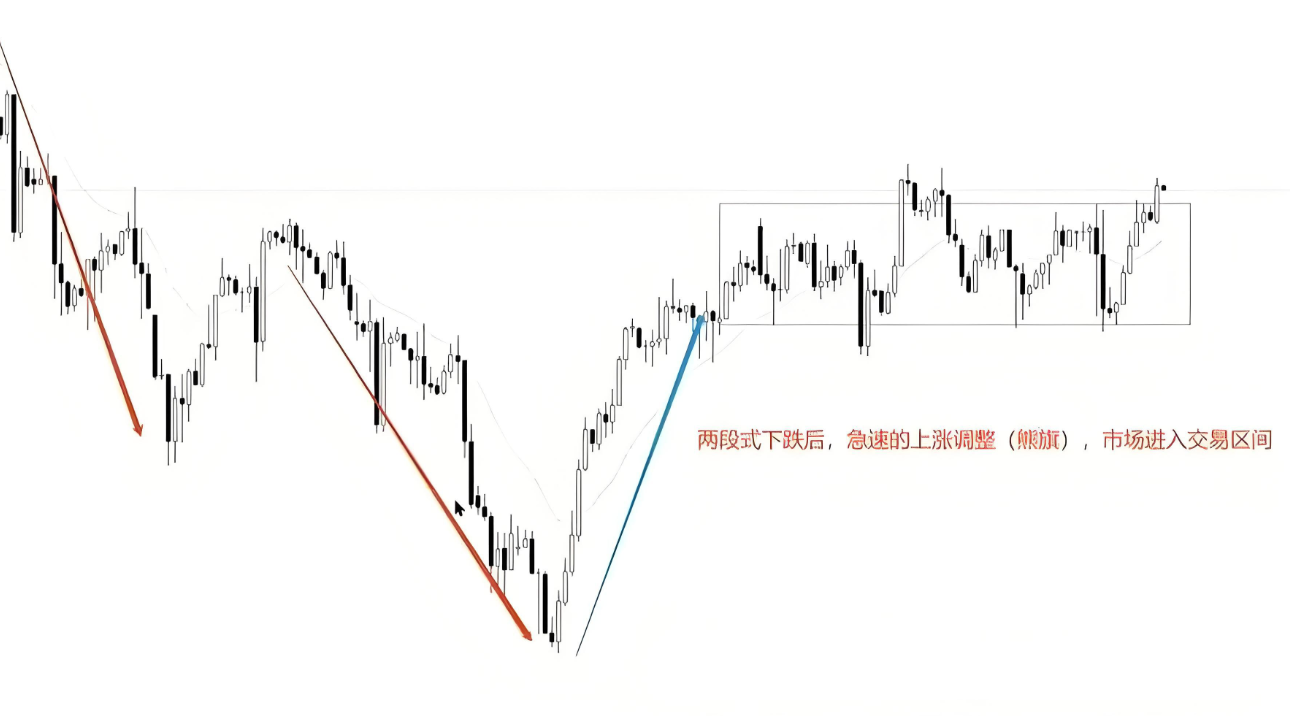
This chart illustrates that WTI crude oil underwent two phases of decline, followed by a strong rise and adjustment, and then formed a trading range. This range reflects the price's state of consolidation after undergoing strong fluctuations.
Analysis of the formation of ranges
From the cases, we can see that the market usually experiences a rapid movement before entering a trading range state. This rapid movement may be a strong trend movement or a strong correction of the trend. Regardless of the situation, the market will always first experience rapid movement.
We can review the knowledge points discussed earlier to understand the reasons behind market trend movements. Taking the downward trend in the example as a case:

1. Consensus views in the market
During this decline, the main participants in the market (such as major bearish participants) generally believed that prices should decline further. Therefore, they kept increasing their short positions while bulls chose to stay on the sidelines, waiting for prices to reach their expected entry points. Due to the consensus among major participants regarding market trends, the resistance in market prices decreased, resulting in trend movements.
2. The role of major bearish participants
Major bearish participants dominate the downward trend in the market, and their bullish positions are on hold until prices reach a certain target position, reducing buying power in the market. In this case, trend movements dominated by bears will usually be very smooth since bulls are temporarily not participating in the market.
3. The price reaches the bullish expected position
When the price falls to the expected entry position of the bulls, the situation will change. The primary bullish participants begin to intervene, and the price approaches or reaches what they consider an appropriate buying point. This expected target may be an important support level, or it may be a signal from a technical indicator in the market indicating that buying can begin.
4. Emergence of buying power
When the price reaches the expected position, buying power begins to emerge in the market. The earlier trend movements were so smooth because bears dominated the market, and at this time, the participation of bulls begins to increase, leading the market into a state of oscillation or trading range. We need to read this information from the K-line chart to understand the changes in market forces.
Therefore, after a rapid trend movement, the market enters a state of trading range because bullish participants begin to gradually return to the market, forming a new market equilibrium point. Understanding this can help us better grasp the changes in the market and formulate corresponding trading strategies.
Market state analysis
In chart analysis, we can judge the market state and participant behaviors from the following aspects:
Selling climax, bullish exit
Rapid decline: The market first experienced a rapid decline, then after an adjustment, it rapidly declined again, indicating that bearish momentum may have shown signs of exhaustion.
Large bearish candles: Two very strong large bearish candles have appeared, indicating significant selling pressure in a short period of time. However, if this rapid decline has not undergone sufficient complex adjustments, it may mean that the market's bearish momentum is nearing exhaustion.
Selling climax: This situation usually indicates that the market's downward speed is too fast, leading to the exhaustion of bearish momentum.
A selling climax and false breakout signals usually indicate that the bearish power in the market is weakening and may signal that a market reversal or adjustment is imminent.
False breakouts, bullish intervention
Downward false breakout: The market has experienced a false breakout of the previous trend extreme, meaning there was no follow-up force after the breakout. Here, after the downward breakout, there was no follow-up force from the bears, indicating that bearish power is weakening.
Response of major bearish participants: Due to the weakness of bearish power, many major bearish participants began to gradually take profits, which will reduce selling pressure in the market.
Bullish entry: The main bullish participants will begin to build positions when the signals of bearish power are weak. This indicates that the market is undergoing a potential reversal or adjustment period.
Market state: Although bullish participants have begun to intervene, this does not mean that they are strong. The strength of bulls should typically be demonstrated by the price breaking through key levels; if the price remains sideways, it indicates that the market is still uncertain.
The intervention of bullish participants does not necessarily indicate market strength, as prices have not broken through key levels; the market may still be consolidating sideways.
Market uncertainty
If both bullish and bearish participants continue to engage in market price movements and the prices range sideways within the range, the market is in an uncertain state. In a sideways range nearing 100 K-lines, the bears cannot effectively suppress prices, nor can the bulls break through, indicating that the forces of both sides in the market are relatively balanced, leading to price movement within the range. The bullish and bearish forces are relatively balanced, and we need to wait for further signals from the market to confirm changes in trend.
Scenes of the emergence of trading ranges
We say that the probability of breaking through the upper and lower limits of a trading range is 50:50, but strictly speaking, the probability of breaking in the direction of the trend is slightly higher. However, this slight probability advantage is very small; we should pay more attention to the characteristics of the range itself.
In a trend movement, the views of bullish and bearish main participants are consistent. One side continues to enter, while the other side temporarily exits and observes.
In a range movement, the views of bullish and bearish main participants show divergence. The trend-following side hopes to push prices to the extreme of the trend, while the counter-trend side believes the current price has participation value and continues to enter the market.
Here we can also understand it from another perspective:
The trading range is a zone where both bullish and bearish participants believe there is trading value, while the trend movement is the market searching for such value areas. Within the area of value consensus, both bullish and bearish participants continue to participate. When one side no longer believes that this price is worth participating in, they will choose to temporarily exit the market and observe; at this point, the range is broken, and the market enters a trend movement in search of a new price area. Both sides then actively participate in the market again, forming a new trading range.
Price movement can be categorized into two states: trend movement and non-trend movement, which is to say trends and ranges. The market breaks through a value area to search for new values, breaks again and pauses, and this cycle continues; this is the basic law of price movement.
If the price breaks through a value area and runs far before forming a new value area, this is what we commonly refer to as a bull market; if it falls, it is a bear market, characterized by a strong trend lasting a long time.
If the price breaks through a value area and does not move far before forming a new value area, and then breaks back into the original value area, this indicates that the market has transformed from a small range into a larger trading range. At this point, the bullish and bearish main participants have not formed a consistent view on the direction of market movement, and both sides are still actively participating within the larger value area.
Both upward and downward channels are sloping trading ranges.
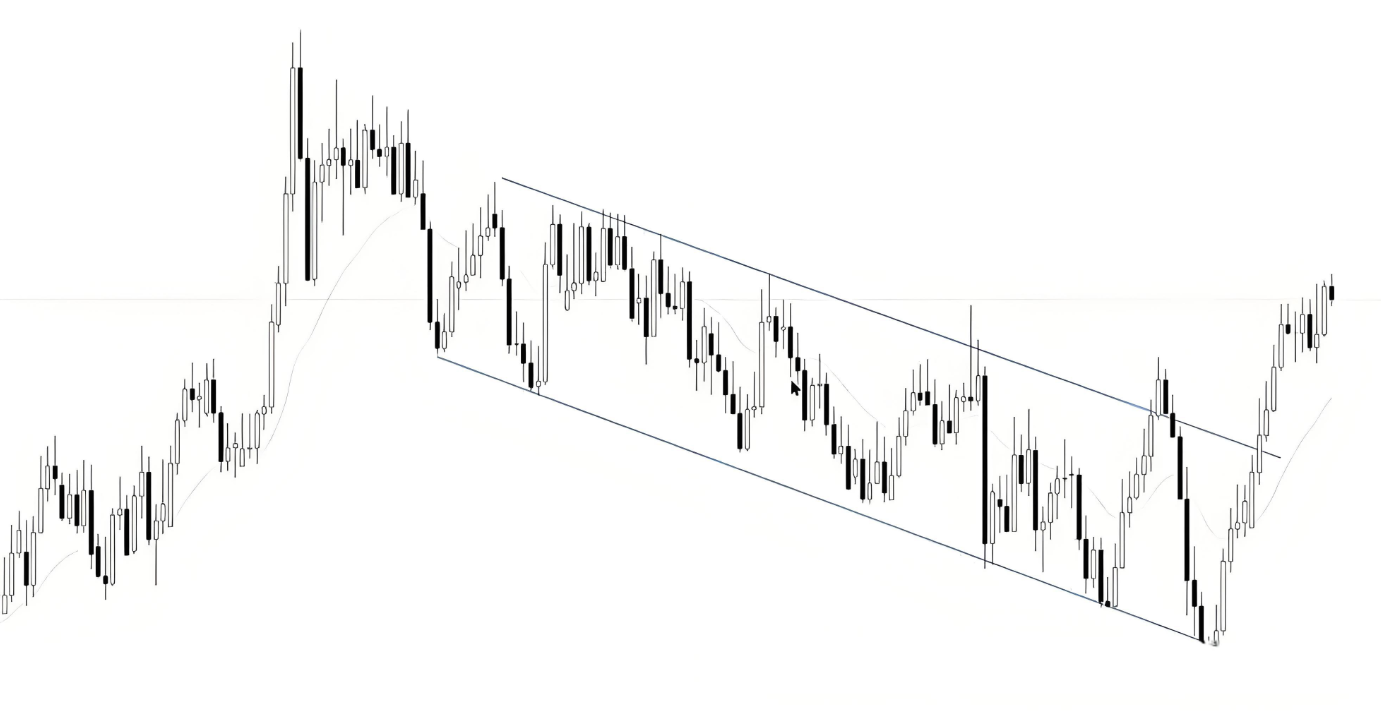
In the channel, both bullish and bearish main participants are actively participating in the market, with one side holding a slight advantage.
Many new traders have a cognitive bias, believing that bullish participants have a significant advantage in an upward channel, while bearish participants have a significant advantage in a downward channel. In fact, this is a mistaken viewpoint that can be easily disproven by simple logical reasoning. Taking the descending channel as an example, if bearish participants had a significant advantage, prices should break down immediately. However, in reality, prices cannot break through; each time they approach the channel line, we can see bullish participants actively participating in the market, pushing prices up to the upper part of the range. Therefore, it is best to treat this channel as a sloped trading range.
Case one
How do we judge the progress of trading ranges on the chart? Let's first look at the first case:
This is the 6-hour chart of the New Zealand dollar against the US dollar. In this chart, the market first experienced a strong push from bulls, pushing the bullish trend to the extreme. Although this final push formed a channel, we won't discuss it in detail here, as it would make the chart appear very complex.
After the bullish trend pushed to the extreme, the market underwent a deep correction. In fact, this correction manifested as a rapid movement and channel, followed by a retest at the channel starting point. After this deep correction, the bullish trend continued again. However, this continuation did not clearly break through the trend direction; instead, the breakout in the trend direction failed. The price subsequently adjusted and found support at the previous wave point.
When the price finds support at the previous wave point again, we can consider that the market has formed a potential trading range. Subsequently, the market indeed entered the state of range movement.
Just a side note, if this adjustment does not find support at the previous wave point and instead breaks strongly below, it may form a potential reversal pattern. We will discuss this in detail in the reversal section.
Case two
This is also the 6-hour chart of the New Zealand dollar against the US dollar.
In this chart, the market first experienced a rapid decline, followed by a deep adjustment. After this deep adjustment, the downward trend breakout failed, and it did not even test the extreme of the downward trend.
After the failure of the test at the low point, the price adjusted deeply again. In this adjustment, the price encountered resistance at the previous wave point, which also verified the resistance level of the downward trend.#RWA总规模持续增长
In this case, we can consider that the market may enter a potential range movement state. Similar to the first case, if resistance is not found at the previous wave point but instead breaks directly above it, this situation is no longer a potential trading range but a potential reversal pattern.
Summary of the background of trading range formation
The two cases used earlier are relatively standard and simple. In the actual market, we will encounter a variety of variants, but overall, the formation of a range follows several steps:
Trend pullback: First, the market will experience a pullback of the trend, preferably a deep pullback.
Failure to break in the direction of the trend: After a pullback, if the breakout in the direction of the trend fails, it indicates that trend energy is weakening.
Support and resistance: The next time a pullback occurs, if the price finds support at the previous wave point, it usually means the market has entered a potential trading range. If the price directly breaks below or above the previous wave point, it may indicate a potential reversal pattern.
Verifying the range: When these steps occur, we believe the market may enter a potential trading range. Note the wording: 'potential' does not mean it will definitely enter a trading range, but it is possible. If the subsequent verification confirms the formation of the range, represented by two continuously rising peaks and two continuously falling troughs, then this range is confirmed.
Moreover, it is worth noting that the trading ranges in textbooks are all standard ranges, with wave highs and lows being completely parallel. In reality, in actual trading, standard trading ranges are very rare; most ranges are irregular. Therefore, it is essential to understand this point: the ranges in actual trading are often more complex and irregular.
Characteristics of trading ranges
Price movement has inertia. Human instinct is to chase rising prices and sell falling ones, buying more as prices rise and selling more as they fall. Even if everyone's actions stop, and acceleration is zero, price movement will still continue in the original direction, gradually decreasing to zero and then reversing.
Perhaps Newton discovered the relationship between speed and acceleration during stock trading (just kidding).
The market tends to maintain its current state of movement, whether it is a trend movement or a range movement.
In a clear trend, potential reversal patterns are mostly likely to fail and evolve into trend continuation patterns. Therefore, beginners are advised not to participate too much in trading reversal patterns, such as double tops, head and shoulders tops and bottoms, as these patterns often fail and turn into trend continuation patterns.
In a clear range, most breakouts of the range will fail, resulting in false breakouts. A range is also a state of motion in the market, and the market tends to maintain its current state of motion.
Taking the one-hour chart of gold as an example, after experiencing a strong bullish push and a deep pullback, the market has formed a potential trading range.
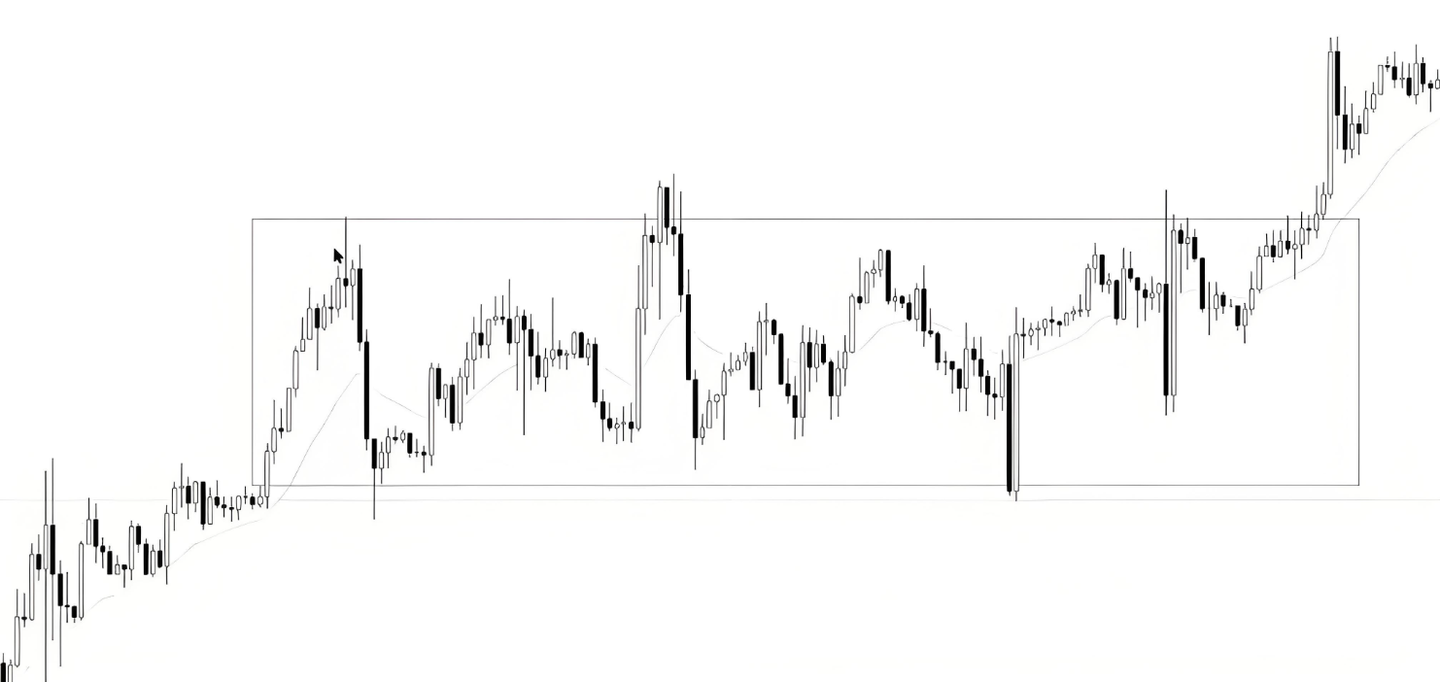
After the range forms, the market runs for a long time, during which multiple false breakouts occur within the range. If these breakouts are viewed as reversal patterns, one might get trapped by the market. Therefore, it is recommended to treat these patterns as ranges to avoid being misled by the market.
Let's summarize the characteristics of range trading:
Duration: Once formed, a range usually lasts for a long time.
False breakouts: False breakouts are common within ranges.
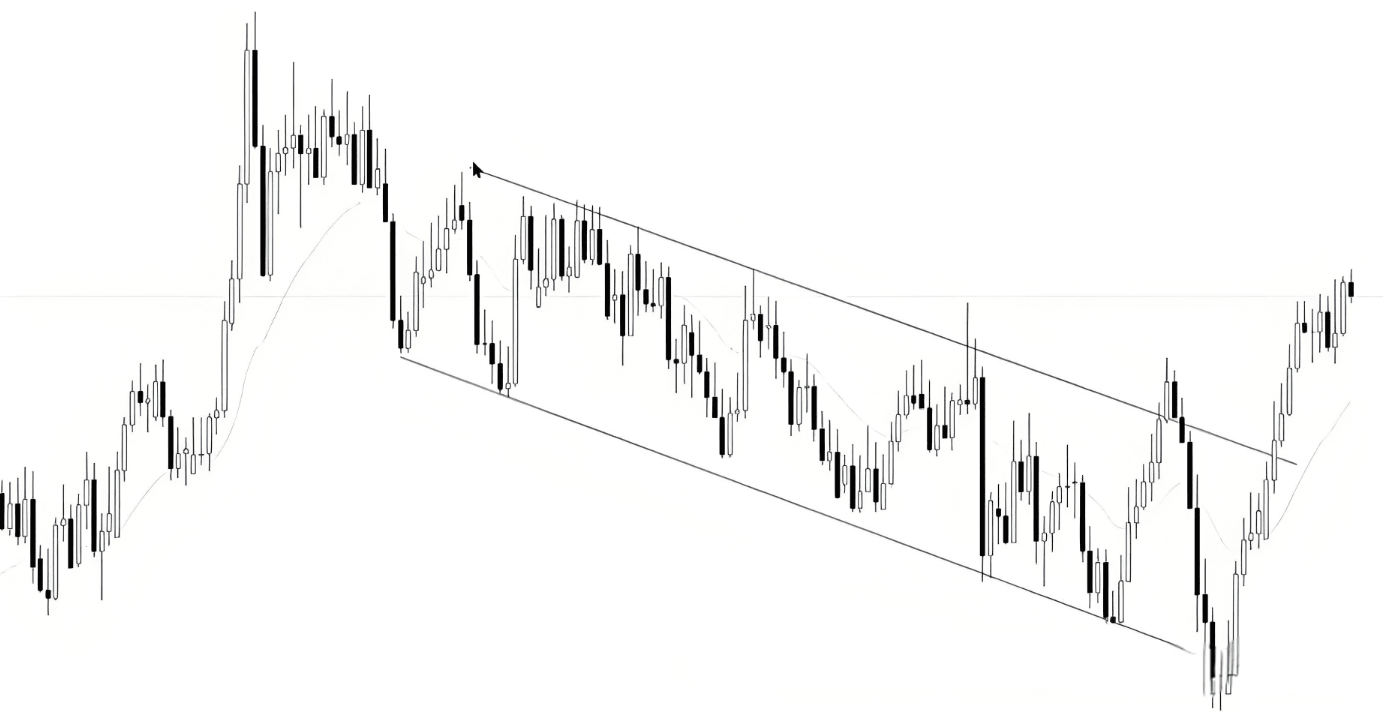
Taking the following descending channel as an example, it is also a type of trading range, which has seen multiple false breakouts and has lasted for a long time.
The methods for operating within trading ranges mainly include the following two:
Trading within the range: This includes going short at high points and going long at low points, or engaging in reverse trading when a breakout of the range fails (trading false breakouts).
Range breakout trading: When it is believed that the market has transitioned from a range to a trend, trade on the breakout of the range.
This is the trading experience that Yan An shares with everyone today. Often, it is due to your doubts that you lose many opportunities to make money. If you do not dare to boldly try, engage, and understand, how will you know the pros and cons? You must take the first step to know what the next step should be. A cup of warm tea and a piece of advice, I am both a teacher and your talkative friend.
Fate is a connection, and knowing each other is a separation. I firmly believe that destiny will lead to encounters, and parting is ordained. The journey of investment is long, and temporary gains and losses are merely the tip of the iceberg. One must understand that even the wisest will have a moment of oversight, and even the least wise will have a moment of gain. Regardless of emotions, time will not pause for you. Pick up the worries in your heart, stand up again, and move forward.
The secrets of martial arts have already been given to you; whether or not you can become famous in the world depends on yourself.
These methods must be saved for future reference; if you find them useful, please share them with more people around you who are trading cryptocurrencies. Follow me for more cryptocurrency insights. Having been through the rain, I am willing to hold an umbrella for the retail investors! Follow me, and let’s walk the cryptocurrency path together!