I have been trading cryptocurrencies for 10 years, earning 1.1 small goals. If I want to change my fate, I must try the crypto world. If you can't make money in this circle, ordinary people will never have a chance. Recently, I had the fortune to drink tea with a big shot in the crypto world and talk about the trends in the cryptocurrency market.
His words deeply shocked me.
It turns out that he once went bankrupt due to making contracts within three days, suffering a loss of 50 million yuan. This experience was undoubtedly a profound lesson for him.
Looking back at my own journey in the crypto world, it has been full of ups and downs. From the initial investment of 50,000 to making tens of millions during the bull market; then from tens of millions down to over 2,000 to my current 1.1 small goals; and now, I am waiting for the next bull market to arrive, aiming to reach 3 small goals.
My cryptocurrency trading method is not complicated, but it is extremely practical. In just one year, I grew my assets to eight figures. My secret is to only trade based on one pattern, and only enter the market decisively when I see a clear opportunity. If there is no clear pattern, I will not place any orders.
For the past five years, I have maintained a win rate of over 90%, thanks to my patience and accurate judgment.

Today we'll learn something simple: the main signals of the MACD indicator and their corresponding price action.
Many novice traders go through a phase where they blindly believe in indicators, thinking they are king and only trading according to their signals. However, after a while, they discover that technical indicators are lagging and that following them doesn't make money, so they fall to the other extreme, thinking that indicators are useless, then delete all indicator templates and start learning naked candlestick charts.
Both of these extreme views are wrong and undesirable. In fact, the vast majority of technical indicators are calculated based on candlestick data, and all technical indicators and price behavior should complement each other.
Each technical indicator signal should correspond to a specific price action. After completing my previous lessons on price action, understanding most indicator signals should become much easier.
Hopefully, today's article will offer you a new perspective on price movements, helping you achieve a comprehensive understanding as soon as possible.
A brief review of the MACD algorithm
Let's start by briefly explaining the algorithm for the MACD indicator. Many beginners don't even know how the indicator is calculated, yet they dare to trade with real money, which I find quite admirable.
I believe that before using an indicator for trading, you need to understand how it's calculated, what its purpose is, and what market conditions it represents. Only then can you decide how to use it to support your trading plan.
I'll give a brief explanation here.
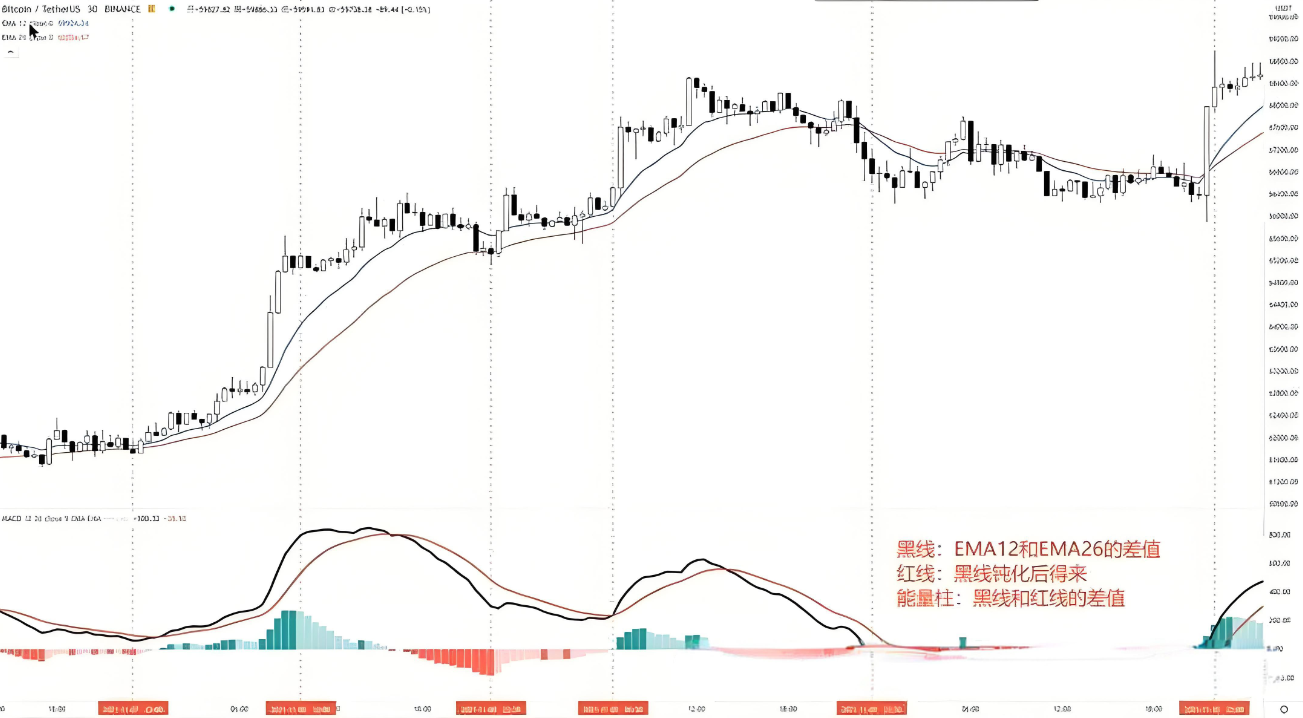
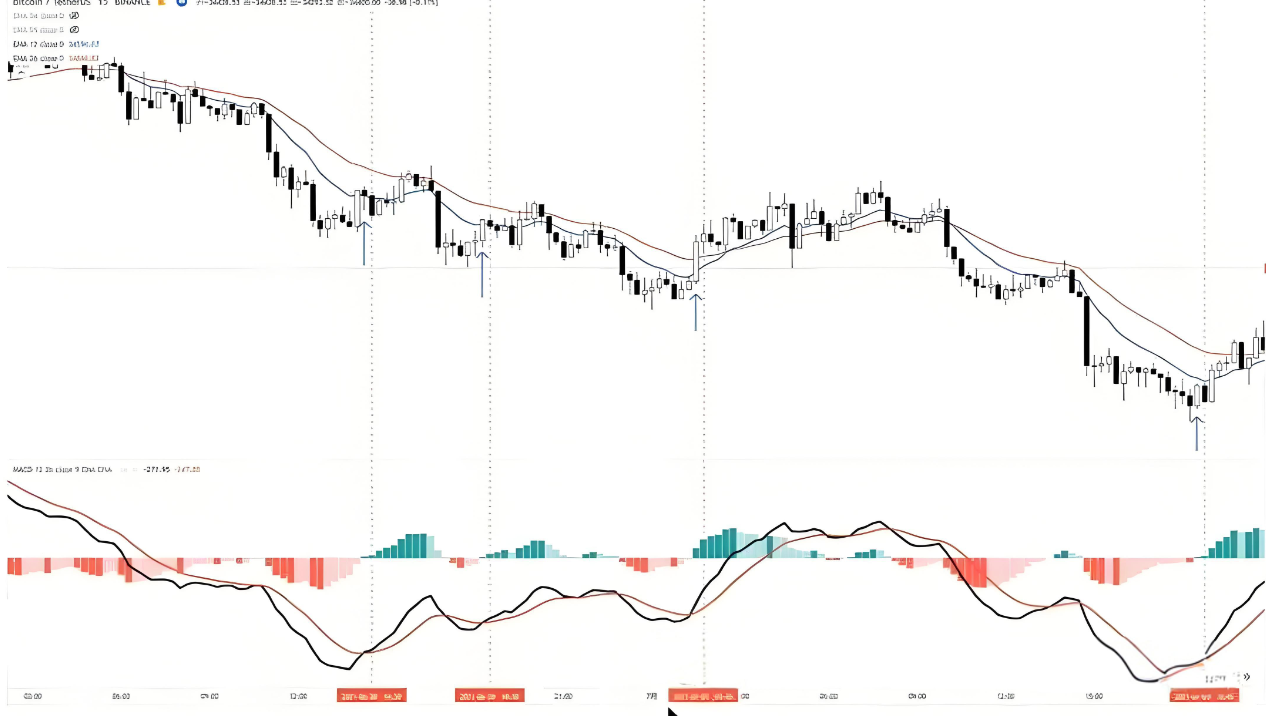
In the indicator bar at the bottom of the chart above, the bold black line, often called the fast line, is actually the MACD line. How is it calculated?
MACD has four important concepts, as follows:
1. Two moving averages
Let's look at the two moving averages close to the K-line in the main chart: EMA12 (blue) and EMA26 (red). The parameter settings for the moving averages are listed here; 12 and 26 are the default parameters for MACD. The MACD line represents the difference between these two moving averages (EMA12 and EMA26).
2. MACD line (convergence/divergence line, or fast line)
The term MACD stands for Moving Average Convergence/Divergence. When the MACD line (black line) is above the zero line, it means that the EMA12 is above the EMA26. The farther the black line is from the zero line, the farther the EMA12 is from the EMA26. From the preceding rise of the MACD line in the chart, we can see that the gap with the moving averages above is widening.
In the following section, EMA12 is below EMA26, so the MACD line is below the zero line. This means that the value of EMA12 minus EMA26 is negative. If EMA12 and EMA26 coincide, then the difference between them is 0, and the MACD line will be on the zero line.
3. Signal lines (slow line, convergence/divergence average line)
Now let's look at this red line again. This red line is what we commonly call the slow line, which is calculated by applying a passivation effect to the fast line. For details on how to perform this passivation, please refer to relevant materials; explaining it here would be quite complex.
4. Energy column (difference between fast and slow lines)
The difference between the fast and slow lines is represented by the MACD histogram below, also known as the energy bars. When the fast line moves away from the slow line, meaning the difference between the black and red lines in the chart increases, the energy bars gradually strengthen, and the color of the energy bars in the indicator gradually deepens. For example, in this segment, the green energy bars are becoming increasingly darker, and the red energy bars are also becoming increasingly darker.
Conversely, as the fast line approaches the slow line (i.e., the black line in the chart gradually approaches the red line), the energy bars will gradually weaken. At this time, the color of the energy bars in the indicator will gradually lighten.
Golden cross, death cross
This is the most commonly used MACD signal. Its definition is simple: a golden cross occurs when the fast line crosses above the slow line, and a death cross occurs when the fast line crosses below the slow line.
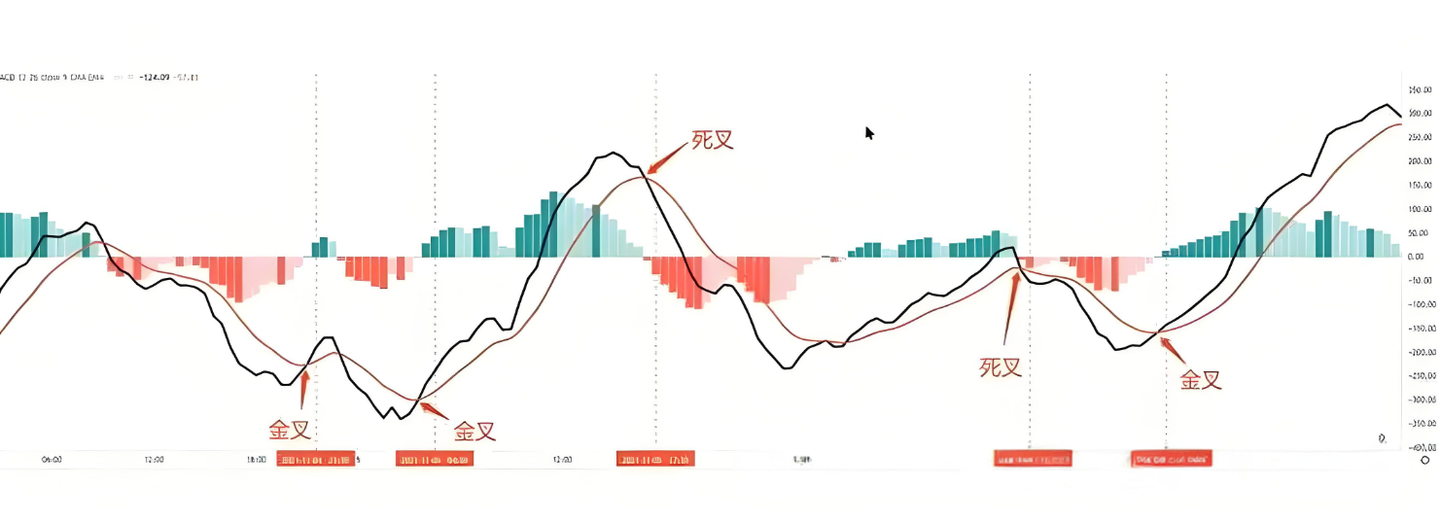
Although many people are keen to observe the MACD golden cross signal, I believe that this signal has little practical reference value and is often just a "magic indicator" for reviewing past performance, with limited effectiveness in actual trading.
Common MACD golden cross and death cross scenarios include the following:
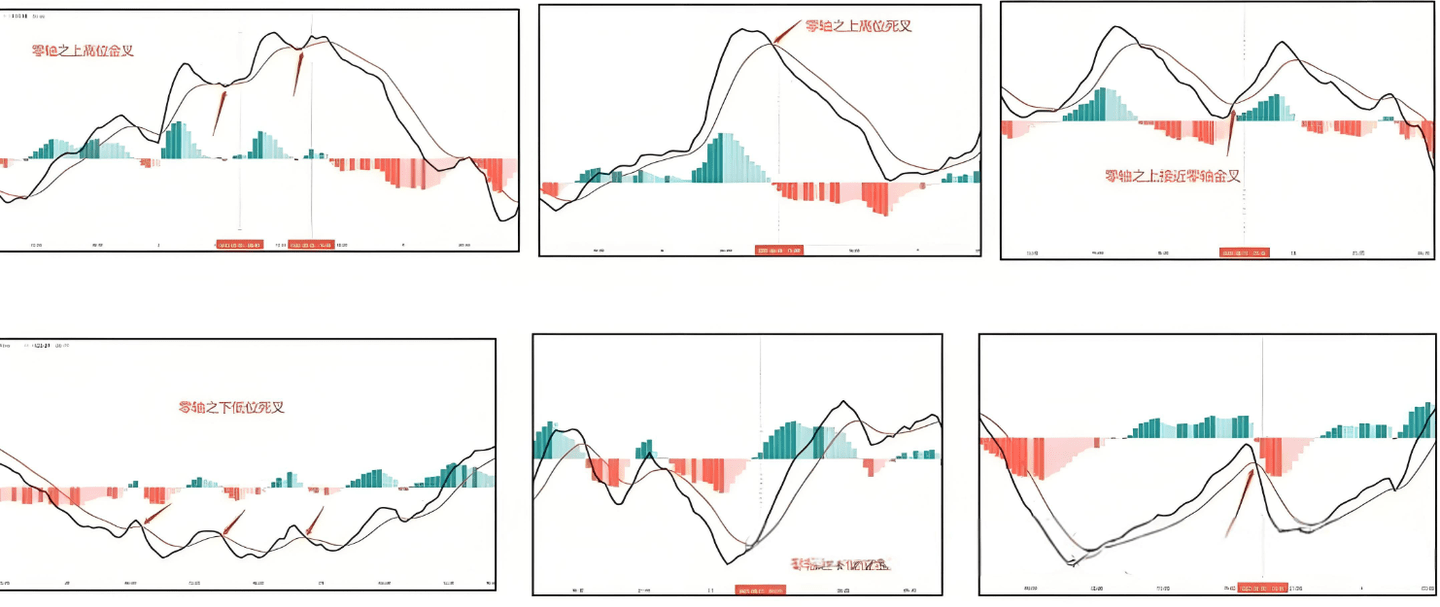
1. Golden cross at a high level above the zero line
2. A death cross at a high level above the zero line
3. A golden cross that moves upwards when the price is above the zero line and close to the zero line.
4. Death cross at a low position below the zero axis
5. Golden cross at a low position below the zero axis
6. A death cross that occurs when the price is close to the zero axis below the zero axis.
In these situations, golden crosses at high levels and death crosses at low levels are usually not very useful for reference, so I won't go into detail. We will focus on the second situation, namely death crosses at high levels and golden crosses at low levels.
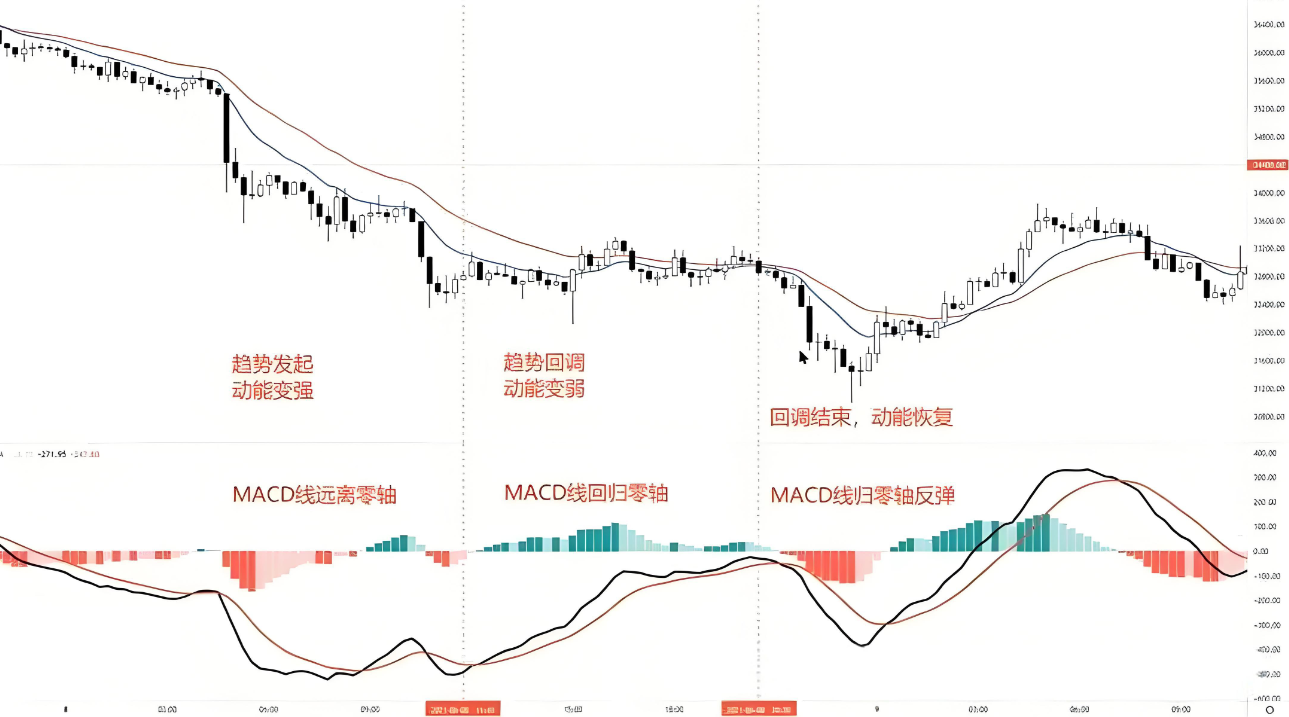
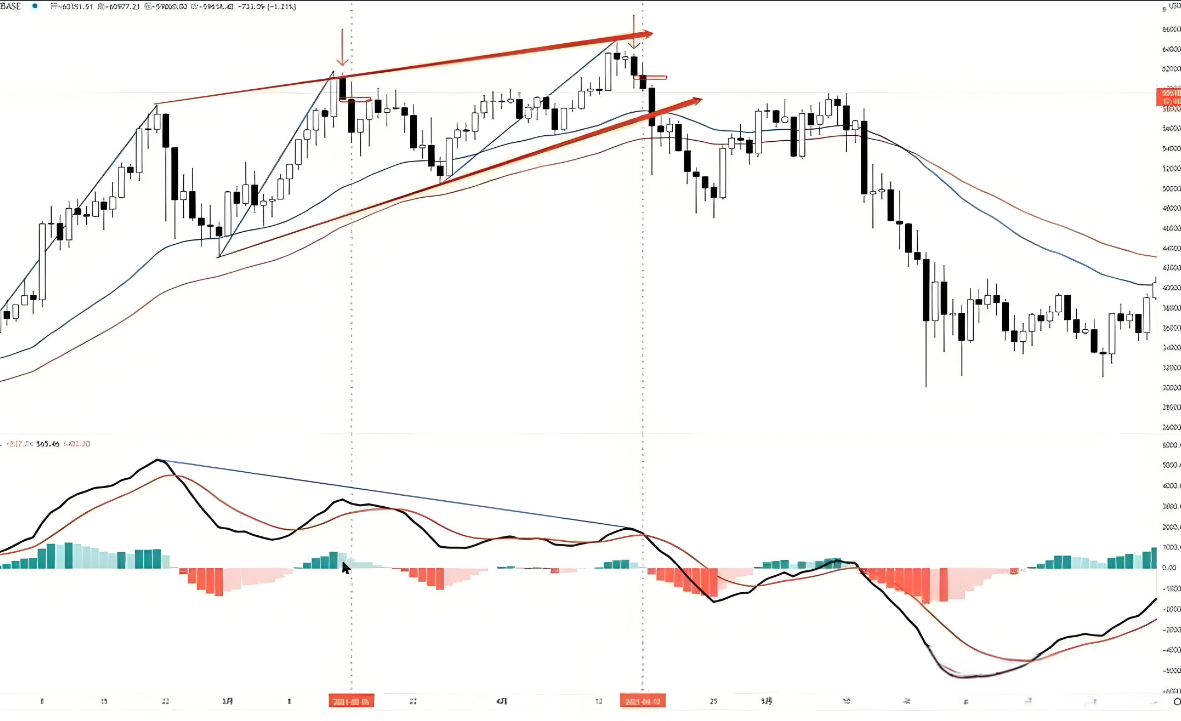
High-level death cross
We know that the MACD line (black line) represents the difference between the EMA12 and EMA26. When the MACD line is rising, it means that the difference between these two moving averages is increasing, and the trend momentum is strengthening. Conversely, when the MACD line is falling, it indicates that the difference between the moving averages is narrowing, and the trend momentum is weakening.
The trend pattern we understand is that after a period of trend movement, there is often a period of pullback and consolidation before the trend continues. This price movement is represented by the MACD indicator as follows:
Trend movement: Momentum is increasing, as evidenced by the MACD line moving away from the 0 axis.
Pullback movement: Momentum weakens, as evidenced by the MACD line returning to the 0 axis.
After a pullback and consolidation, if the trend continues and momentum strengthens again, the MACD line will move away from the zero axis once more.
Pay attention to these two death crosses at high levels in the chart below. Their significance is quite simple—they confirm the pullback movement.
The MACD line is returning to the zero axis from a high level, but this signal is not very reliable because when a death cross forms at a high level, the pullback movement has actually lasted for several candlesticks.
In the example shown in the image, using this high-level death cross signal as a basis for closing out long positions is acceptable. However, you should absolutely not use this signal to reverse your position and go short, because this type of high-level death cross signal has a strong lag.
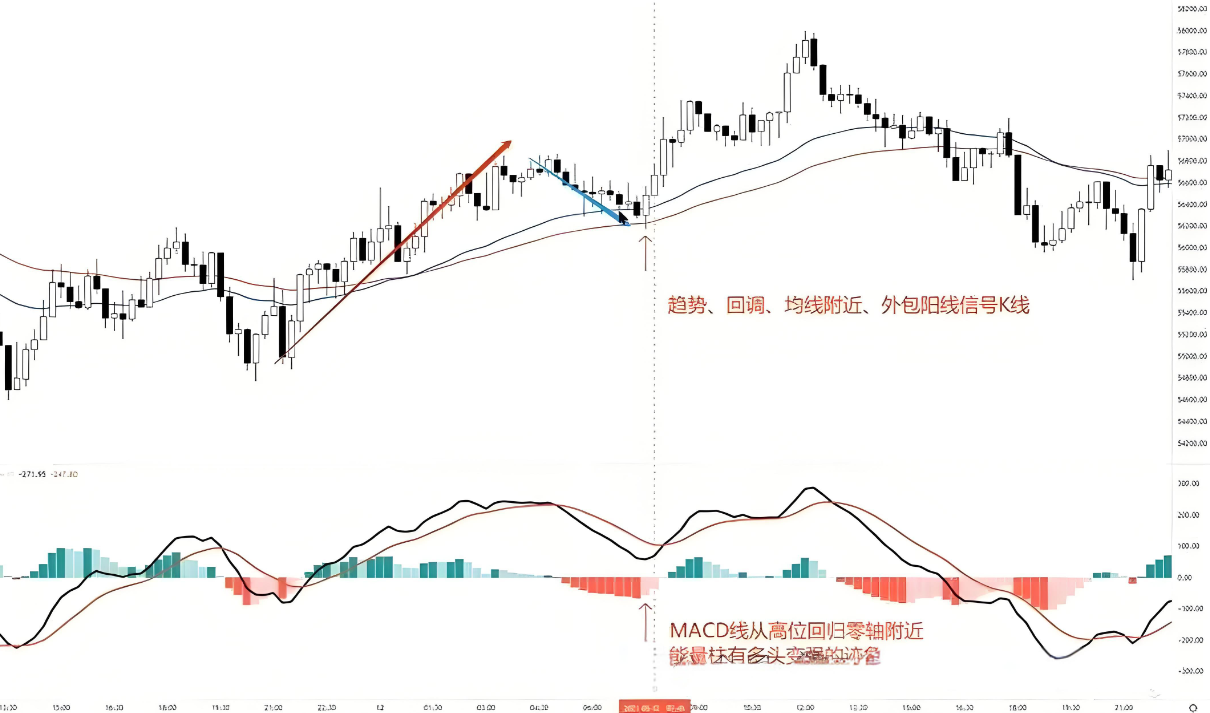
Golden cross at low position
The same applies to golden crosses at low levels; they can be interpreted as the reverse of death crosses at high levels, both representing a trend pullback. However, their practical value is limited due to their significant lag. By the time a golden cross signal appears, the key trend point has already passed. Such signals typically fail to provide effective assistance for timely trading decisions.
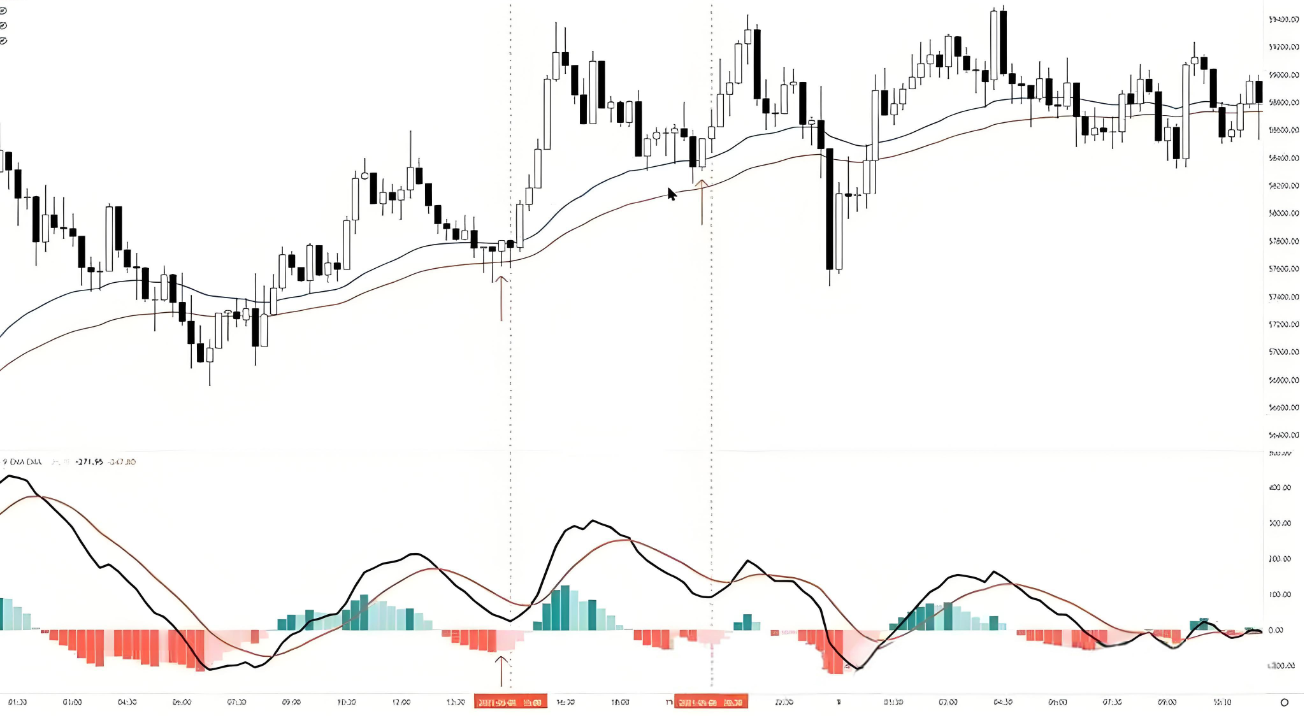
Zero axis death cross
Take a look at the death cross below the zero line, close to the zero line.
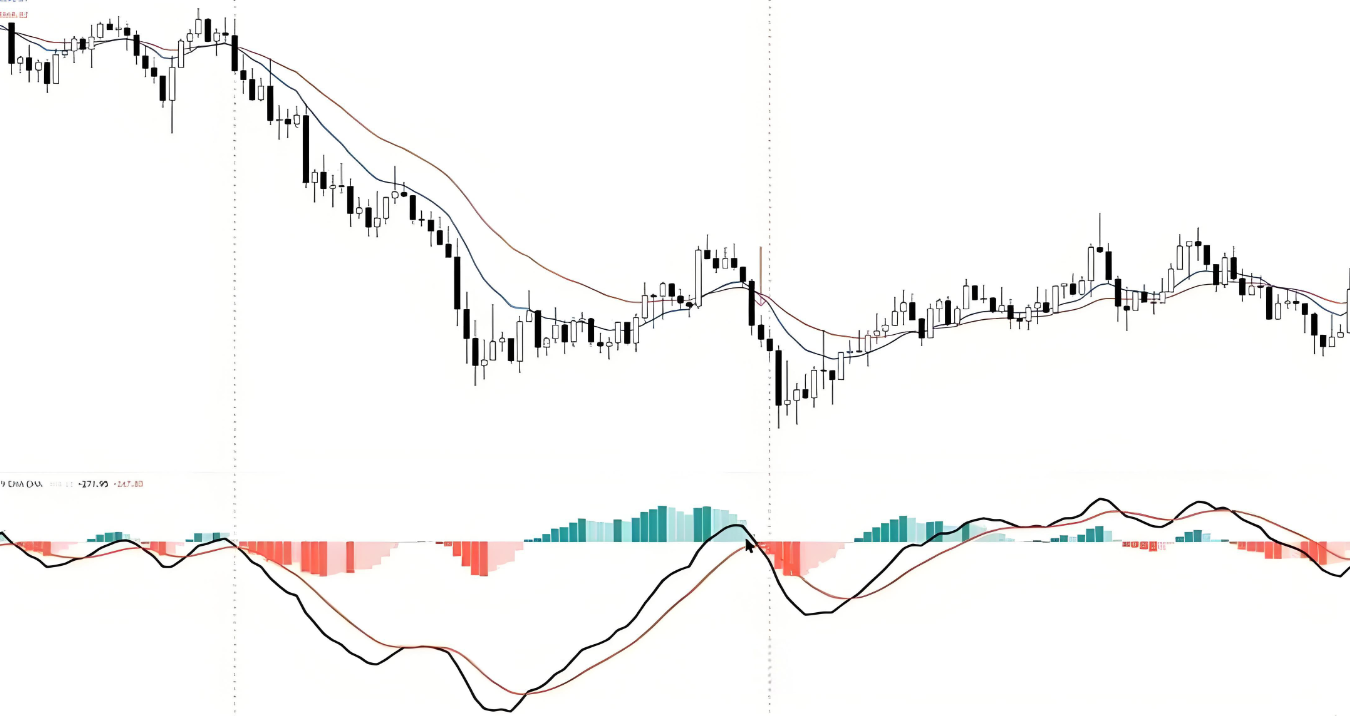
When the MACD line moves downwards away from the zero axis, it indicates the initiation of bearish momentum, showing that this decline is very strong. When the MACD line returns to the zero axis, it corresponds to a price pullback.
A death cross appearing near the zero line can be interpreted as a continuation of bearish momentum. However, the problem with this signal is that it is too lagging, and it cannot provide an effective basis for timely entry operations.
Zero-axis golden fork
Looking at this case of a golden cross near the zero axis, although the lag of the golden cross here is not too severe, the golden cross signal usually has a strong lag.
Lag
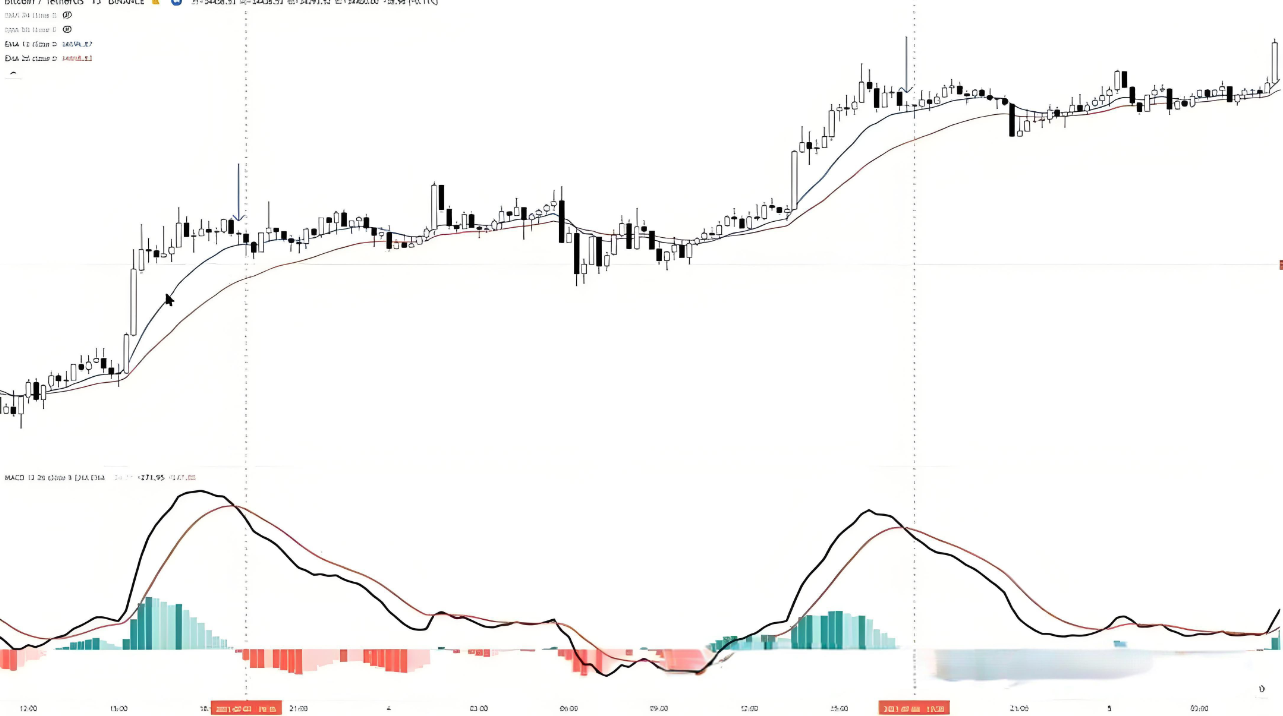
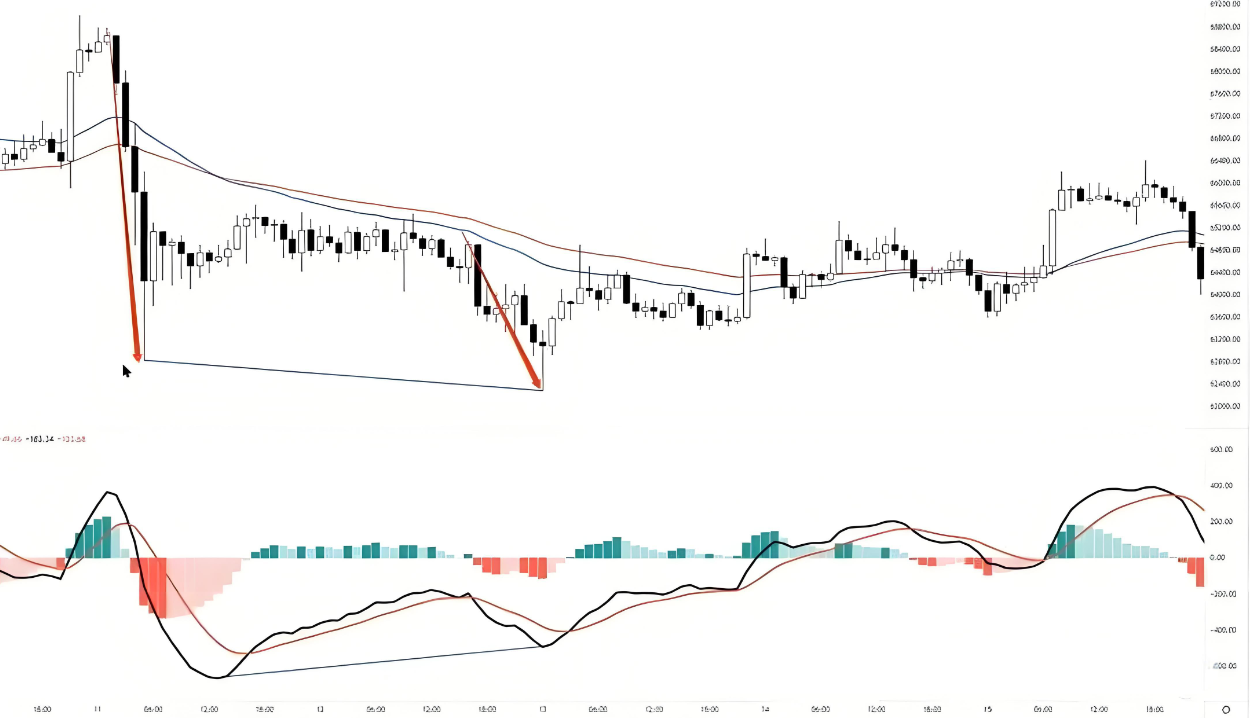
Why is MACD often called a "god-tier indicator for backtesting" but a prime example of something useless for trading? One reason is its strong visual misleading nature.
If you're reviewing your trades and don't mark the candlestick with the death cross like I did, you might notice a death cross has occurred, and the price is at a certain level, making you think it's a good entry point. However, the actual death cross signal occurs after the close of the candlestick I marked. Only then does the MACD signal truly indicate a death cross.
We can confirm MACD signals by observing the color changes of the histogram bars. When the histogram bars change from green to red, it indicates that the MACD line (black line) is below the slow line (red line), meaning the difference becomes negative. Green histogram bars indicate a positive difference between the MACD line and the slow line, while red histogram bars indicate a negative difference. Therefore, by simply observing the color changes of the histogram bars, we can determine the occurrence of golden crosses and death crosses.
In the chart, the energy bars only turned from green to red at the close of the candlestick indicated by the red arrow, and the MACD indicator only then gave a death cross signal. This indicates that the signal is already very lagging. Shorting at the close of the candlestick is no longer a suitable strategy.
If you can participate in the continuation of short-selling momentum earlier than the MACD death cross signal based on other price action or signals, this will significantly improve the quality of your trading.
For those who enjoy observing MACD golden crosses and death crosses, you can mark the candlesticks that form these crosses, like I have, and then review them. This way, you can avoid the pitfall of over-relying on golden cross and death cross signals.
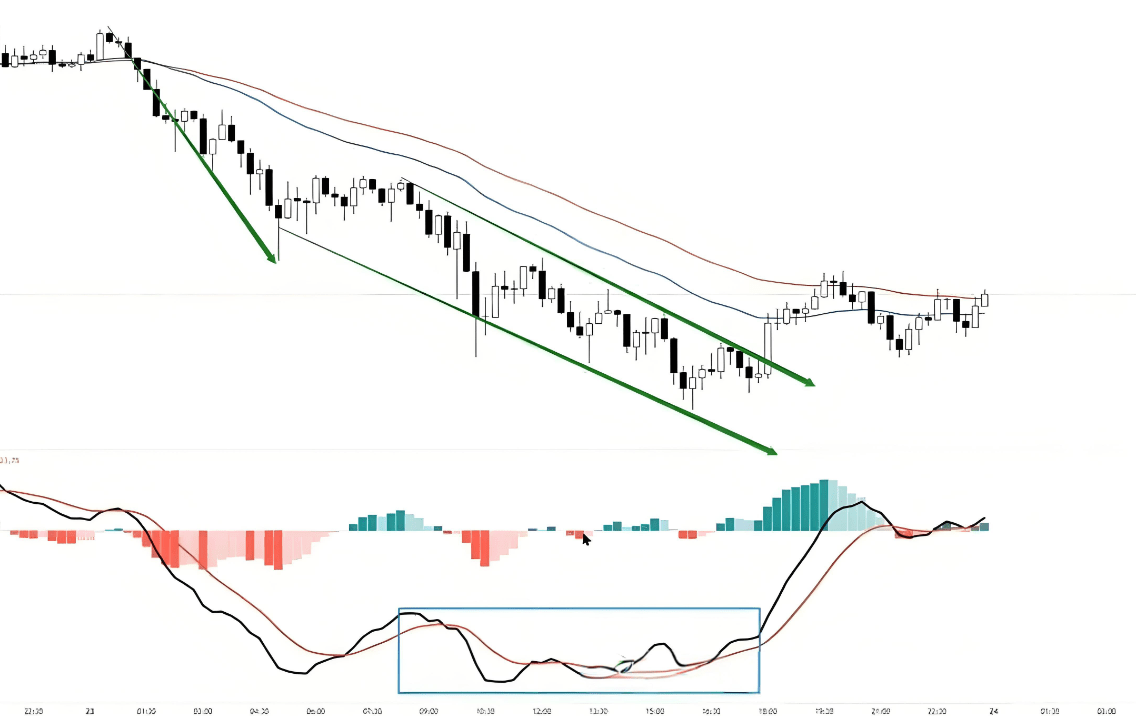
Zero axis
The second commonly used MACD signal is a bounce back to the zero line. Some people call this downward bounce to the zero line a "bounce," while an upward bounce to the zero line is called a "pullback." However, I won't go into detail about these terms here. The key is what price action they represent.
A common pattern in price movements is that the trend tends to retrace before resuming. The MACD line represents the difference between two moving averages, reflecting the energy of the trend. Therefore, the MACD line's movement pattern corresponds to this: moving away from the zero line, returning to the zero line, and then moving away from the zero line again.
A rebound from the zero axis refers to a continuation of the trend after a pullback ends.
Since moving towards the zero line indicates a price pullback, the pullback patterns we learned in our price action training also apply to this. Therefore, there isn't a single entry method for a rebound from the zero line.
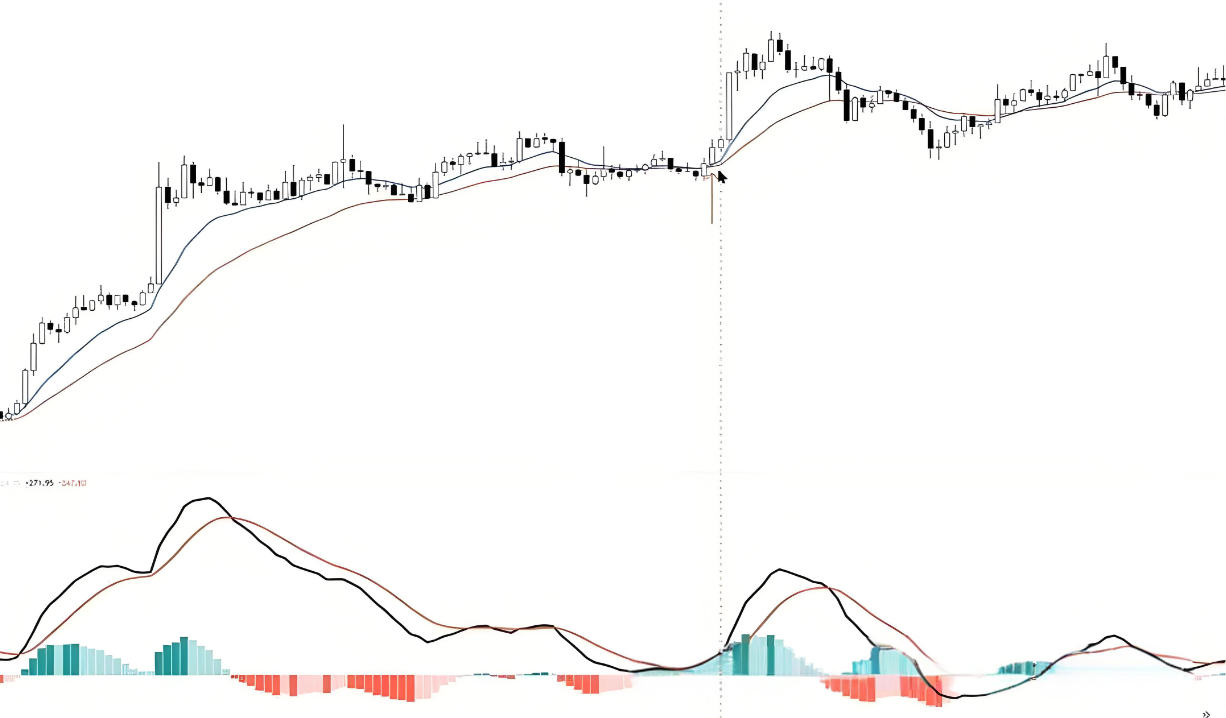
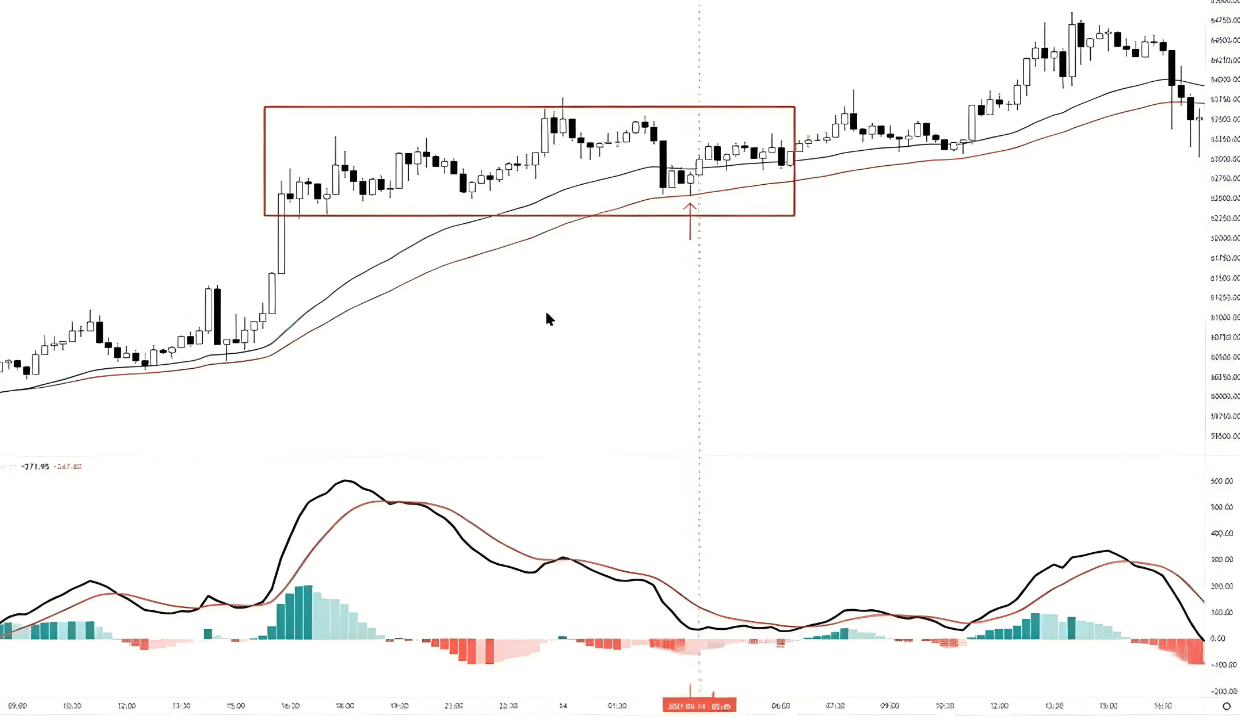
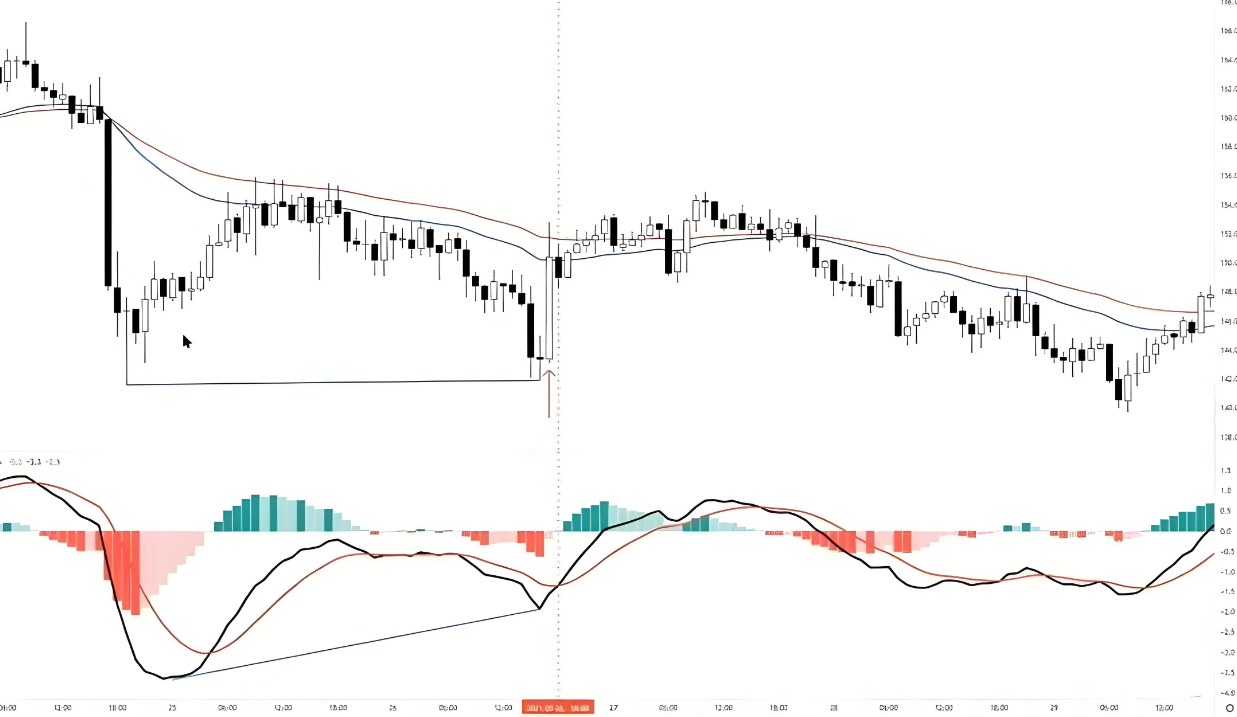
Case 1
This is a case of a rebound from the zero axis. If we roughly observe the large wave range based on the two arrows I drew, this matches the simple pullback cases we've learned before.
However, a closer look at this pullback reveals numerous overlapping candlesticks and long wicks. Furthermore, while the signal candlestick is an engulfing bullish candle, it's accompanied by long upper and lower shadows, making it less than perfect. Therefore, based on the price action theories we've learned, this pullback might not be considered for participation.
However, from the perspective of the MACD indicator, the MACD line has returned from its high point to near the zero axis, and the downward momentum bars are weakening. This means that the momentum bars have changed from dark to light at the arrow, indicating that the pullback may be nearing its end and bullish momentum may be returning. Therefore, the entry signal for a rebound is relatively clear in this situation.
Sometimes, indicator signals (such as the MACD signal in this case) can indeed help us filter out the noise on the candlestick chart. In such cases, how to interpret the indicator and price behavior varies from person to person, and everyone's views and judgments may differ.
Case 2
This is a relatively simple example of a rebound from the zero axis, and the corresponding price behavior is also relatively simple. We can enter the market based on the candlestick patterns we have learned.
Here's a quick note about the moving average parameters I used for the rebound from the zero line. I used 34 and 55, two non-Fibonacci numbers. These are just random settings I've chosen out of habit; there's nothing magical about them. You can choose a suitable parameter between EMA 30 and 60, fine-tuning it according to the specific instruments you're trading. Since I'm primarily a price action trader, focusing on candlestick charts and using indicators only as a reference, these settings are arbitrary for me.
In practice, I've found that when the MACD line returns to the zero line, the corresponding candlestick always retraces to the EMA between 30 and 60. This is a pattern I've observed, but I haven't delved too much into the underlying logic.
Case 3
Many people have a misconception about pullbacks, believing that a pullback must involve a large counter-trend wave to qualify. This is incorrect. Pullback patterns, or more precisely, consolidation patterns, including sideways trading ranges, are also considered pullbacks.
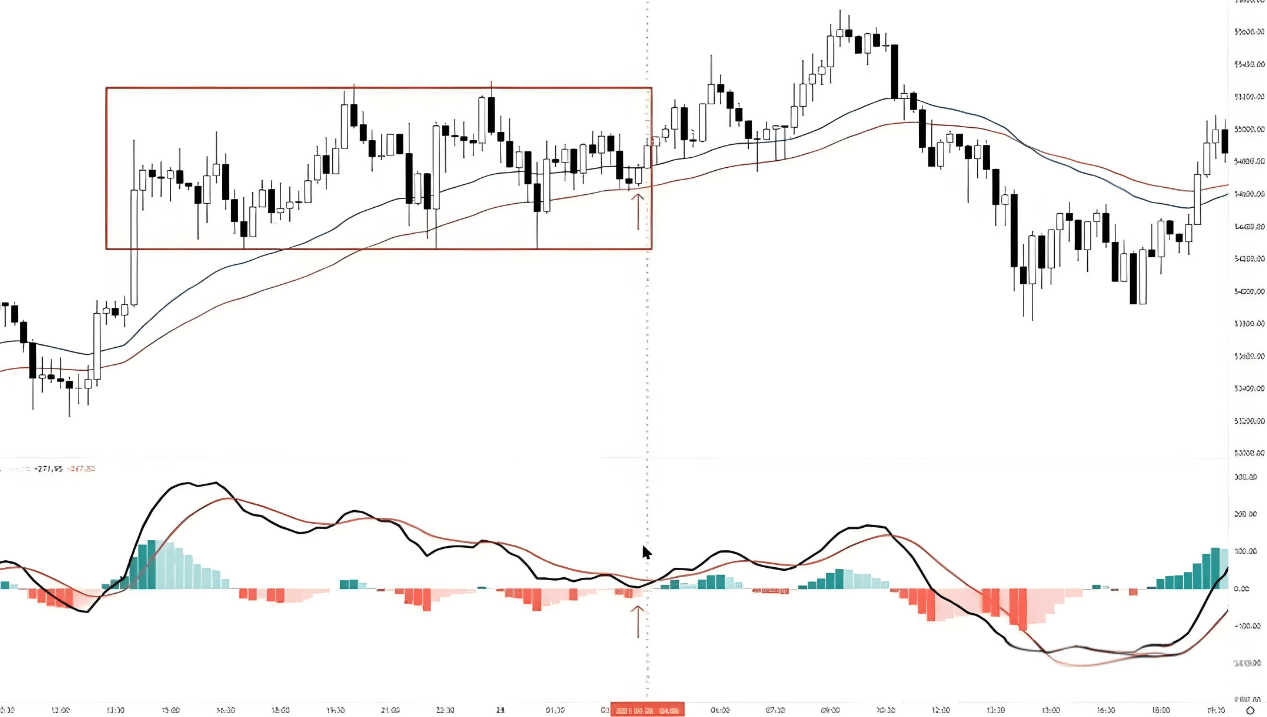
Some traders, seeing an overbought or weak trend, assume the market is about to experience a major pullback and then confidently engage in contrarian trading. However, the market may simply be consolidating within a sideways range before breaking out in the direction of the trend. If you stubbornly cling to your view and wait for that major pullback, you could face significant losses.
The example in the chart illustrates a sideways price consolidation, with the MACD line slowly returning to the zero line, followed by continued trend momentum. This is represented by the MACD line rebounding from the zero line, while the candlestick chart shows the continuation of the trend after the consolidation. This is also an example of a sideways consolidation with a rebound from the zero line, demonstrating that the price action corresponding to the MACD's rebound from the zero line is a pullback.
Characteristics of zero-axis rebound
The characteristics of a pullback pattern also apply to a rebound when the MACD crosses the zero line:
1. Pullback patterns are complex, not simple.
2. Pullback patterns may fail, evolving into range trading or reversals.
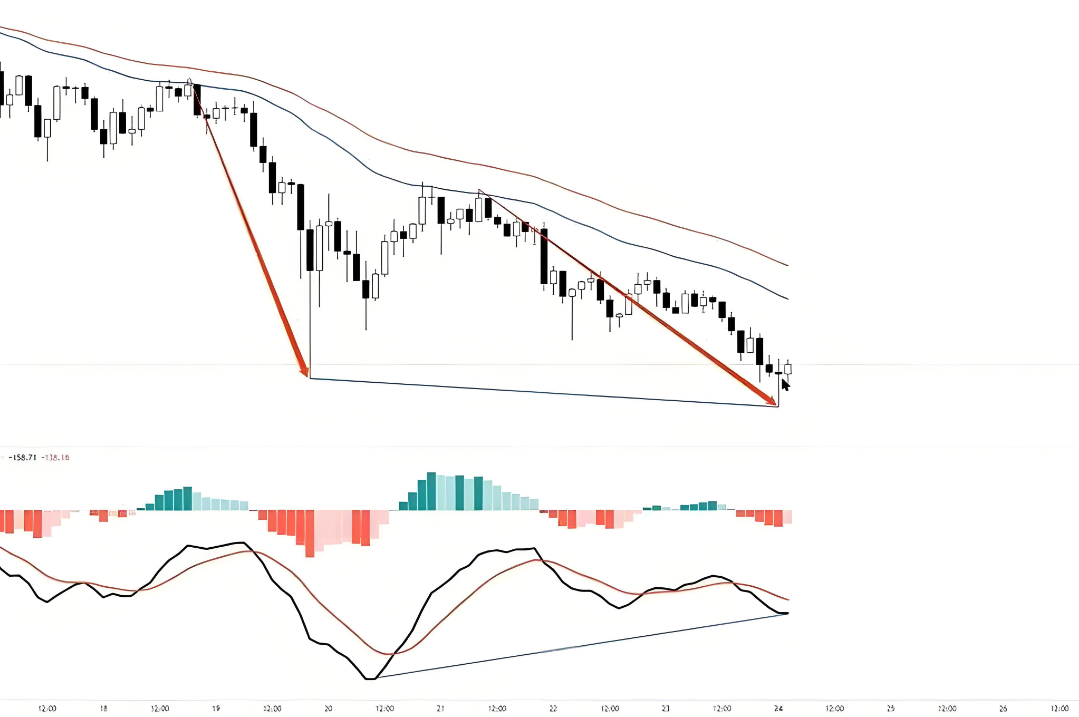
Deviation
Finally, let's discuss another commonly used MACD signal—divergence, which has some reference value. However, even though it's relatively useful, this indicator signal shouldn't be overemphasized. We'll examine its effectiveness in conjunction with price action later.
Definition of MACD divergence
I initially thought MACD divergence was a simple matter of common sense, but in reality, many people fail to grasp the correct divergence signals and often trade incorrectly, which shocked me. Common MACD divergence signals fall into two categories: MACD line divergence and histogram divergence. Regardless of the type, there's a crucial prerequisite: the MACD line (the black line) cannot cross the zero line. This is extremely important, yet many people overlook it.
MACD line divergence
Please see the example in the image below:
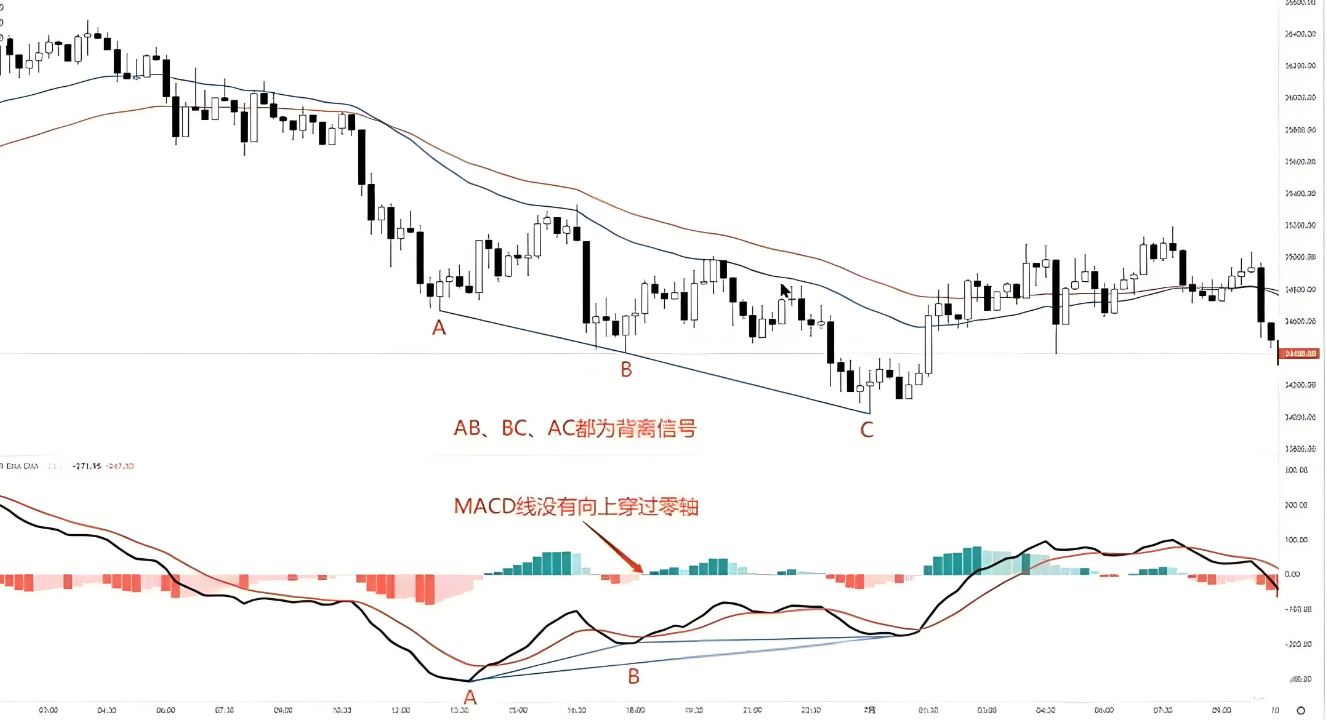
Points A and B
Points B and C, as well as points AC, have both deviated from each other.
This is manifested in lower price lows, while higher MACD line lows are rising.
This phenomenon is called price-momentum divergence, meaning that the trend's momentum may be weakening. In this example, the MACD line did not cross the zero line upwards.
Deviation across the zero axis
If the MACD line crosses the 0 axis significantly and then diverges, the effectiveness of the divergence signal will be greatly reduced.
Some might wonder if divergence signals that cross the zero line are still valid. Indeed, technical analysis is about probability. When the zero line has been significantly crossed before a divergence occurs, the success rate of the signal decreases significantly. Even if some signals may still be valid, is it necessary to act on signals with such a low success rate? Therefore, it's recommended to focus only on divergence cases that haven't crossed the zero line; this is simpler and more effective.
If the 0 axis of the current timeframe is crossed, it is recommended to switch to a larger timeframe to look for signal patterns.
Deviation and corresponding price behavior
Divergence reflects a lack of energy in price movements.
Let's look at our previous example again. Here I've marked the situation for each downward push.
As you can see, the downward momentum gradually weakens with each decline. Although the changes in the latter two segments may not be particularly clear, this conclusion can be reached by actual measurement. These three successively weakening impulses form a three-pronged wedge, or a channel, which are price patterns we have learned before.
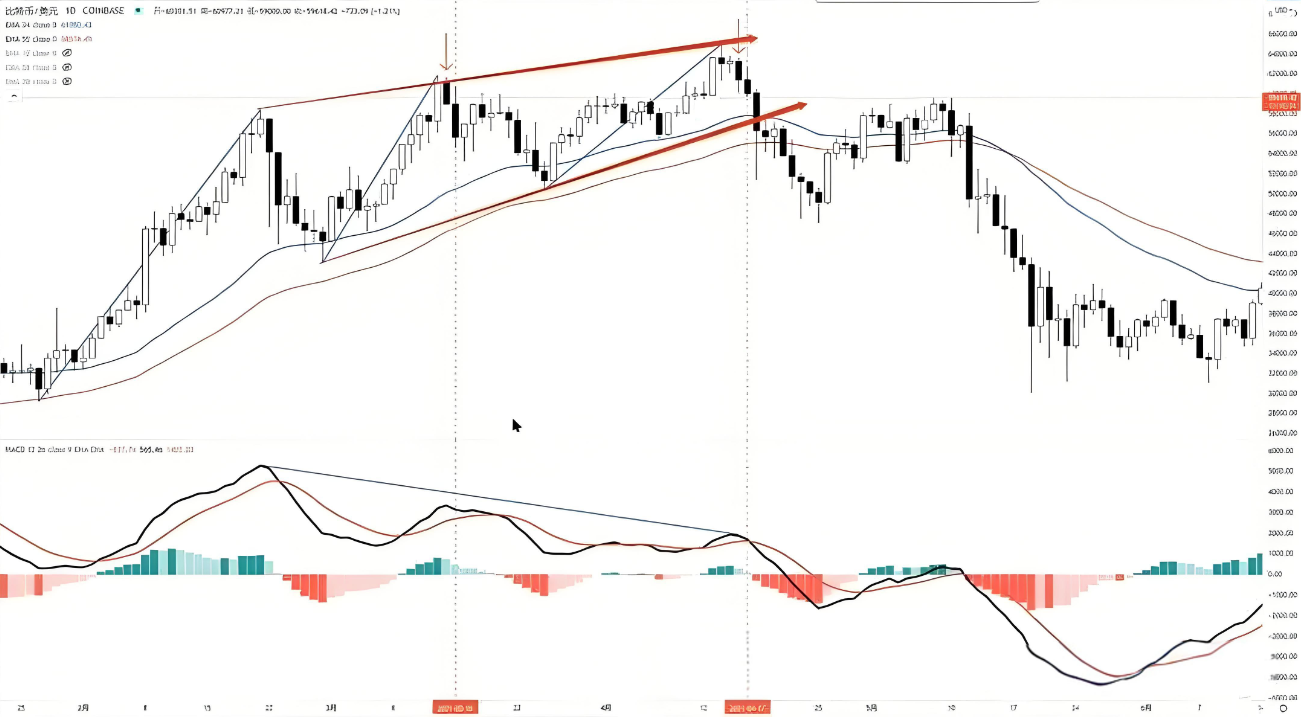
Let's take another look at the familiar example of the three pushes on the Bitcoin daily chart. This is a manifestation of continuous divergence.
The hysteresis of divergence signals
Many beginners find divergence very powerful when they first encounter it, especially when they see divergence signals during post-market analysis, and they may think that they can sell at the highest point or buy at the lowest point.
However, when we carefully mark the candlesticks where divergence occurs, we find that this is not the case.
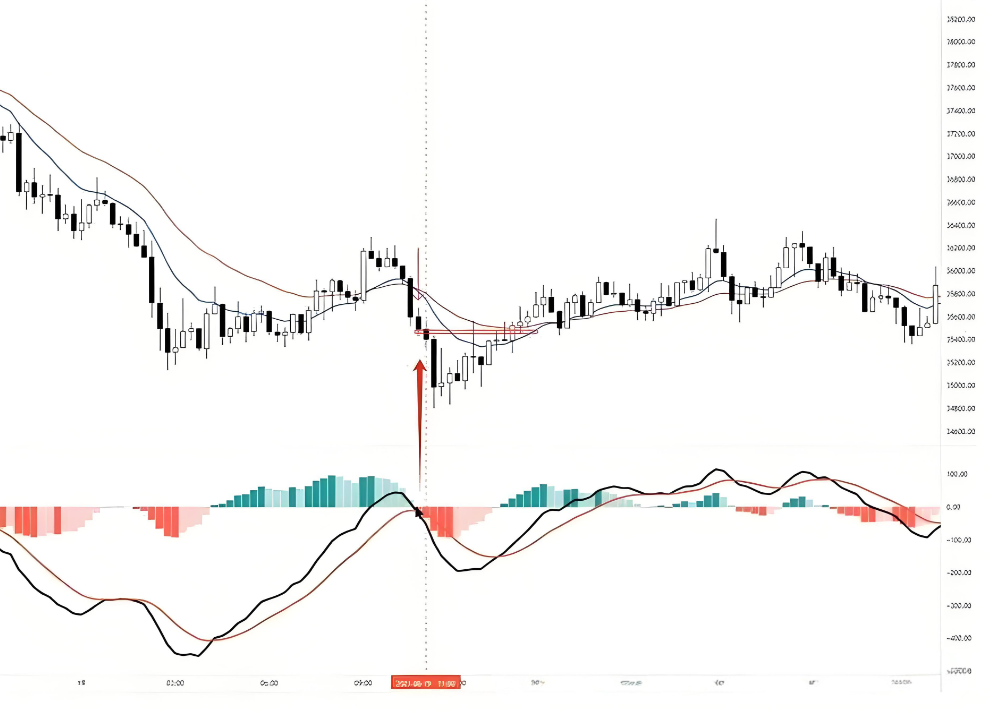
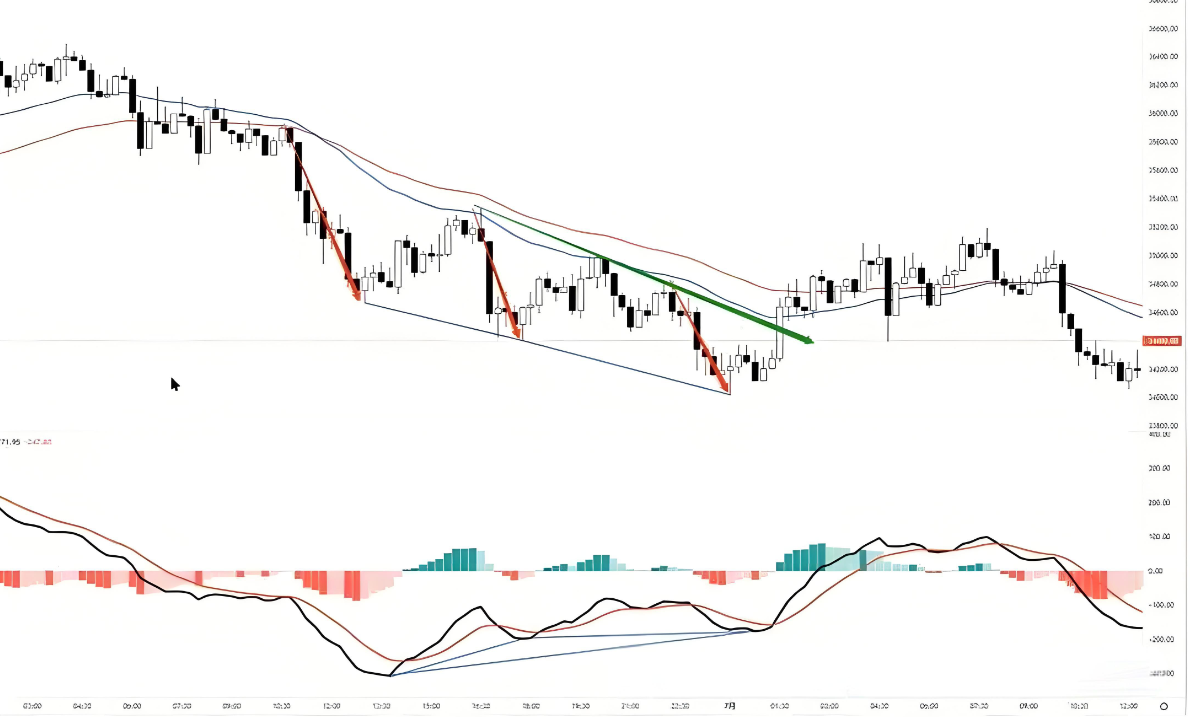
In the example shown in the image, I have marked the two candlesticks with arrows.
When these two candlesticks close, we can check the corresponding indicators (which I've marked with vertical lines). We can see that the indicators only give a signal of weakening energy bars (i.e., the color lightens) when these candlesticks close. Only then do we realize that divergence may have occurred and consider entering the market, rather than prematurely identifying divergence at the highest point, before the subsequent candlesticks have closed.
These two candlesticks are just the beginning of a weakening of the energy bars. If you're looking for MACD divergence, you should usually wait for a few more candlesticks after this one, until the MACD line shows a turning point, before entering the market.
Therefore, divergence signals are not as strong as they appear during post-mortem analysis.
Let's look at this case. When an indicator divergence signal appears, it means that the price lows are decreasing, but the MACD line lows are not decreasing.
This indicates that the impetus in the second phase is weaker than that in the first phase, but this only represents a decrease in the trend energy.
Another case of deviation
Let's look at another example of divergence, which is also one of the manifestations of divergence.
The price lows were roughly parallel, but the MACD momentum clearly lagged behind. This also indicates insufficient trend momentum. However, if you rely solely on indicators in this case, you might miss the opportunity to participate in time, because by the time the indicator gives a signal—that is, when the large bullish candlestick closes as indicated by the arrow—the upward move has essentially ended.
If we use price action analysis, there is indeed an entry pattern here. However, this entry signal is difficult to grasp and the logic is quite complex, so I do not intend to explain it in detail in the course.
Divergence does not necessarily mean reversal
Many traders who are new to divergence get very excited, thinking they can grasp the reversal of trends and make a lot of profits.
Indeed, many trend reversals will show divergence signals because most reversals are caused by insufficient trend momentum. However, the fact that trend reversals are prone to divergence does not mean that a divergence signal will necessarily lead to a trend reversal. This logic is clearly untenable.
In our price action course, we learned that insufficient trend momentum can lead to deep pullbacks or the formation of sideways trading ranges before ultimately causing a trend reversal. Once you understand the nature of price movements, you won't rely excessively on divergence indicators or any other indicator signals.
Gradually deviating from the target
Once you have a good grasp of price behavior, you will no longer need to rely on indicator divergence.
Taking the 4-hour chart as an example, the case in the chart shows a rapid decline, followed by a channel-like downward phase.
After breaking the previous low, a reversal candlestick appeared. On a shorter timeframe chart, this usually corresponds to a divergence signal.
Switching to a smaller 2-hour timeframe chart will give you a clearer view of this divergence signal.
After the last candlestick closes, the weakening of the energy bars is evident, indicating a divergence has occurred. If the MACD line also turns downwards after a few candlesticks, then the MACD divergence is confirmed.
If you can directly read energy changes from candlestick charts, then you no longer need to look at indicators. Of course, before reaching an advanced level, using indicators as an aid is perfectly fine; I also gradually progressed using indicators.
MACD and price action trading range
Let's look at another pattern:
If the MACD line is far from the zero axis and moves sideways without returning to the zero axis, then the price pattern it usually corresponds to is a rapid decline or channel consolidation.
If the MACD line is stuck to the zero axis and fluctuates wildly around it, then the corresponding price action is usually within a narrow trading range.
If the MACD line oscillates widely around the 0 axis, the corresponding price action is usually within a wide trading range.
Identifying these patterns is relatively complex, so I won't provide specific examples. In practice, trading based on price action is often simpler and more effective; indicator signals offer no significant advantage in these situations.
at last
Finally, I'd like to share some experience:
The MACD indicator isn't particularly effective in the forex market, but it performs better in the stock and cryptocurrency markets. You may have noticed that most of the examples I've used are from cryptocurrencies. This is likely because, although the price movement logic is similar across different markets, each market has its own unique volatility patterns.
Overall, the MACD indicator shows a high degree of correlation with price action, effectively handling various price patterns—a feat difficult for other indicators to achieve. In my early profitable phase, I frequently used the MACD indicator as a supplement, but as my understanding of price action deepened, I gradually reduced my reliance on it. #币安区块链周
For beginners, learning the MACD indicator can be helpful. Even if you eventually stop using it, it can still provide a perspective for understanding the market. Don't blindly believe in any indicator. While some traders can succeed using indicator systems, this is more due to their superior trading skills. Indicators are not useless; when used properly, they can make trading easier.
The above is the trading experience that Yan'an shared with you today. Many times, you miss out on many money-making opportunities because of your doubts. If you don't dare to try, explore, and understand, how will you know the advantages and disadvantages? Only by taking the first step will you know what to do next. With a cup of warm tea and a word of advice, I am both a teacher and a good friend to you.
Meeting is fate, understanding is destiny. I firmly believe that those destined to meet will eventually meet, even from afar; those not destined will simply pass each other by. The road of investment is long, and temporary gains or losses are merely the tip of the iceberg. Remember, even the wisest can make a mistake, and even the most cunning can have a stroke of genius. No matter your emotions, time will not stand still for you. Pick yourself up from your troubles, stand up again, and move forward with renewed vigor.
The martial arts manual has been given to you all; whether you can become famous in the martial arts world depends on yourselves.
Be sure to save these methods and review them multiple times. If you find them useful, please share them with other cryptocurrency traders. Follow me to learn more about the crypto world. Having weathered the storm, I'm here to help those who are already struggling in the crypto market! Follow me, and let's journey together in the crypto world!