Over the past 10 years in the cryptocurrency field, I have witnessed the alternation of three bull and bear markets, from initially holding 300,000 yuan in capital to now achieving the dream of financial freedom.
In these six years of trading cryptocurrencies full-time, I have experienced the ups and downs of life, from being heavily in debt to now achieving financial freedom, realizing a leap across 9 levels. During this time, I have ventured into various fields, whether participating in dog projects, ICOs, or diving into mining, I have tried them all. Along the way, I have stepped into countless pitfalls and experienced the market's tug-of-war, but what I have felt more deeply is the tempering of my mindset. There are continuous surprises, as well as disappointments and frustrations; this is a circle that is both magical and full of temptation.
I have summarized countless trading skills and strategies, but ultimately found that the only method for sustained profitability is simple and direct—buying bravely in a bear market and decisively selling in a bull market. This strategy may seem crude, but it has consistently worked for me, allowing me to profit without loss.
Through the previous articles, everyone should have mastered the basic K line patterns and K line combinations, possessing the ability to simply read market strength. At the same time, you should be able to identify common structural patterns in the market and make simple decisions.
However, just having this knowledge is far from sufficient to achieve stable profitability. This stage is somewhat similar to when we first learn to use the MACD indicator or Fibonacci retracement and mistakenly believe we have mastered everything about the market.
However, in reality, we have not even touched the threshold of stable profitability. Price movements are highly variable, and no pattern can guarantee success 100%. Even patterns that currently appear very favorable can fail after just a few K lines.
Truly understanding and accepting the uncertainty of market movements, as well as the changes between structural forms, and then making corresponding decisions based on these changes is what we call the realm of integrated understanding.
Today's lesson mainly focuses on several basic laws of price movement, aiming to help everyone connect the knowledge learned previously, making chart reading easier and simpler.
Multiplicity of price movements
The basic principle of market price movements is uncertainty or multiplicity. If one cannot understand and accept this point, it will be difficult to achieve stable profitability in trading.
The reality is that most traders often fail to understand the uncertainty of price movements. Many still pursue the so-called trading holy grail, hoping to find a simple set of conditions and steps that can lead to stable profits.
To understand the uncertainty of price movements, one must first clarify the reasons for price rises and falls.
In simple terms, when the buying funds in the market exceed the selling funds, the price will rise;
Conversely, when selling funds exceed buying funds, the price will fall.
The market price is ultimately formed by all participants based on their respective analysis and decisions, and their combined force determines the market price direction.
Diverse market participants
Different markets have different compositions of participants. Taking traditional large investment markets as an example, participants include large investment institutions, bank hedge funds, and small speculative institutions.
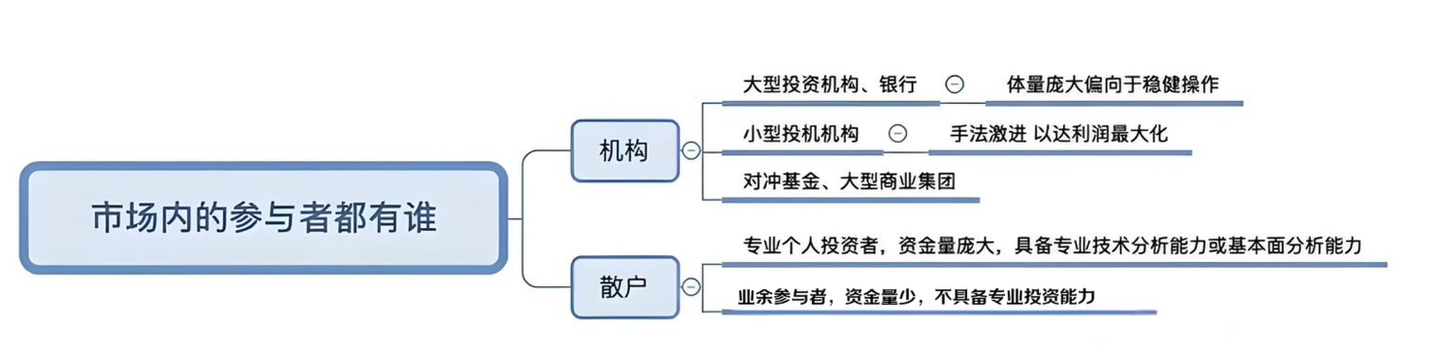
1/ Large investment institutions, due to their enormous capital scale, have their trading decisions and operations directly affecting market price trends. Therefore, they usually tend toward stable operations, holding assets for the long term to pursue stable annualized returns. Bank hedge funds manage risks through hedging strategies.
2/ Small speculative institutions are more aggressive, and their operational style is more flexible, aiming to maximize profits. Some small speculative institutions may not even aim for profits but rather hedge their risks in other risk assets.
3/ There are also a large number of retail participants in the market, who also exhibit diversity. Some retail investors have capital levels comparable to small institutions, while others engage in small investments. A portion of them possess professional technical analysis or fundamental analysis capabilities, while others rely purely on intuition or follow the crowd.
The market is not simply a confrontation between institutions and retail investors; different types of participants together shape the complexity and diversity of the market. Each person's operating methods and goals may differ, leading to various reactions and fluctuations in market prices at different times.
Diverse decision-making frameworks
Different market participants adopt various methods and tools when conducting market analysis and decision-making, which directly influences their trading behavior and market impact.
First, let’s look at institutional investors. Institutions differ from smaller participants in that their analytical tools and methods are diverse. Some institutions primarily rely on fundamental analysis, including industry prospects, national policies, corporate governance, and financial data, to assess the long-term value and investment potential of assets. Other institutions focus on technical analysis, using large cycle moving average combinations for trend trading, or employing overbought and oversold indicators for reversal trading, even developing unique price action analysis and structural models.
In addition to traditional fundamental and technical analysis, some institutions use mathematical quantitative models. These models employ complex algorithms and big data analysis to discover rules and opportunities in the market. With advancements in computer technology, quantitative trading has increasingly become a significant part of the market, and various quantitative model designs are constantly emerging.
In contrast, retail participants' market analysis and decisions are relatively simple and direct. Most small retail investors lack professional analysis tools and usually make decisions based on market hotspots or the price fluctuations of individual varieties. For example, they may follow the investment enthusiasm of popular sectors or think an asset is 'cheap' and buy it after a significant price drop.
However, there is also a portion of professional retail participants whose analysis tools are similar to those of institutional investors. They may use similar technical analysis tools, such as large cycle moving averages or structural analysis, to assist in their trading decisions. These professional retail investors strive to find high-probability trading opportunities through in-depth market research and analysis.
In summary, the diversity of market analysis and decision-making methods among various types of participants, whether institutions or retail investors, directly shapes the complexity and volatility of the market. Each analysis method has its unique advantages and limitations, influencing the evolution and trends of market prices.
Unlike some misunderstandings that institutions uniformly adopt the same analysis systems or indicators for trading decisions, the reality is much more complex. Even in fundamental analysis, different analysts and institutions may make different assessments based on their interpretations of national policies and economic prospects, with some being optimistic while others may be pessimistic. Similarly, even in technical analysis, such as tracking moving averages to identify trends, there are aggressive and conservative differences, leading to different decisions on the same price patterns.
Market sentiment
We all know that emotions have a huge impact on decision-making, especially when the market is in extreme fear or greed.
However, accurately understanding each participant's emotional state is quite difficult. Some institutions specialize in studying market sentiment; they extract market sentiment indicators through various means such as surveys, social media keywords, etc. However, even if they have more resources and technology, these indicators can only reflect the overall sentiment of the current market in a general way.
For example, when the sentiment indicator shows extreme fear in the market, it does not necessarily mean that the price has reached the bottom; similarly, extreme greed does not necessarily mean that the price is about to drop. Extreme values of market sentiment may also persist for a while rather than reversing immediately. Therefore, while we recognize the importance of sentiment in the market, it is very difficult to accurately predict the specific direction of prices through sentiment analysis.
Summary
We can understand that the diversity of price movements is determined by the interplay of various funds in the market. Each fund's buying and selling behavior stems from the analysis and decisions of market participants, who operate using various different analytical tools. Although we understand these factors, we must also admit that we cannot accurately grasp each participant's emotional state.
The market contains numerous different types of participants whose analytical tools and emotional responses are complex and diverse. The combined effect of these factors makes it impossible for us to accurately predict price rises and falls.
In high market capitalization and high liquidity markets, the speculation of multiple institutions makes the uncertainty of prices the norm. Unless participating in varieties with lower market capitalizations, lower depth, and obvious main force control, accurately predicting price fluctuations is extremely challenging.
Thus, the complexity and uncertainty of the market teach us to approach price predictions with humility and to always maintain risk management and asset diversification strategies.
Multi-solution case analysis
We take the 4-hour chart of crude oil as a case to feel the state of the market.
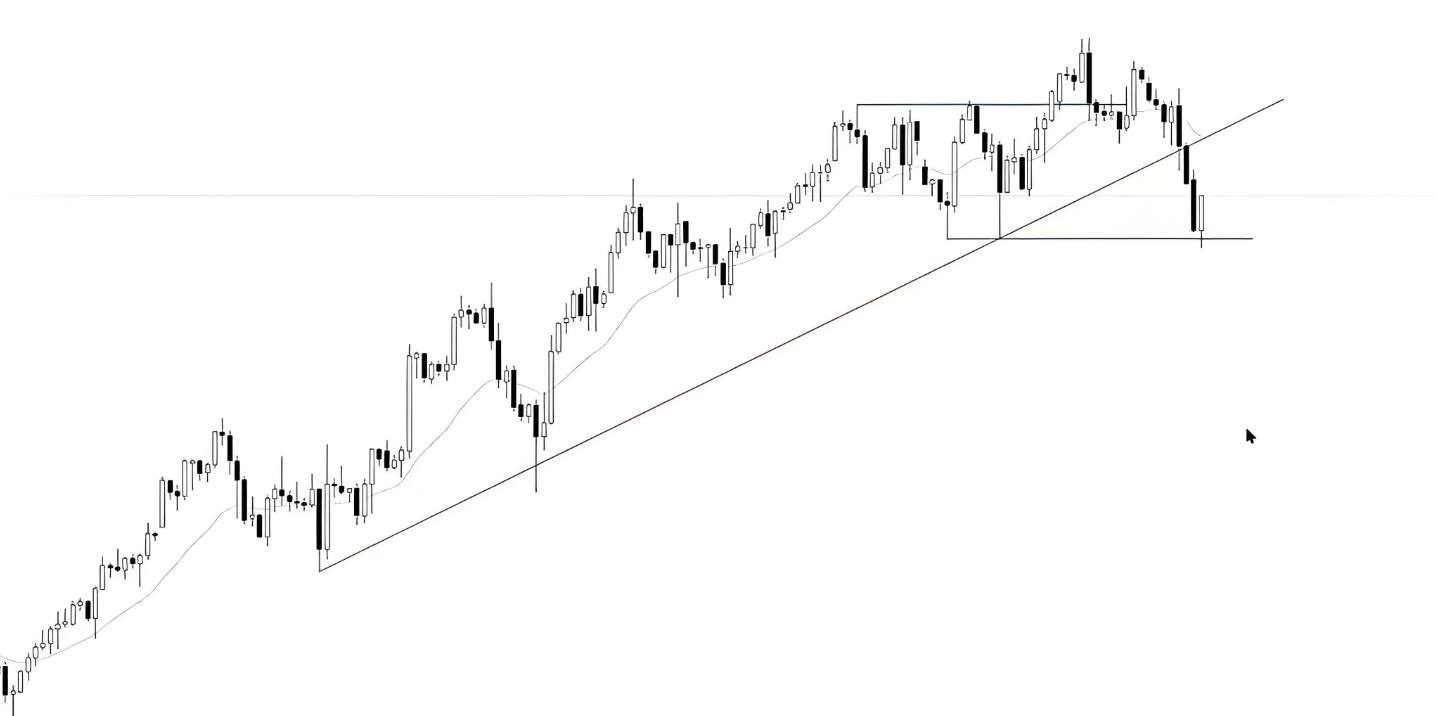
Three iconic actions have appeared in the current market:
1. False breakout to the upside
2. Breakdown of the trend line
3. Verification of support levels
Decision-making case
Different types of participants will analyze and make decisions on this chart differently:
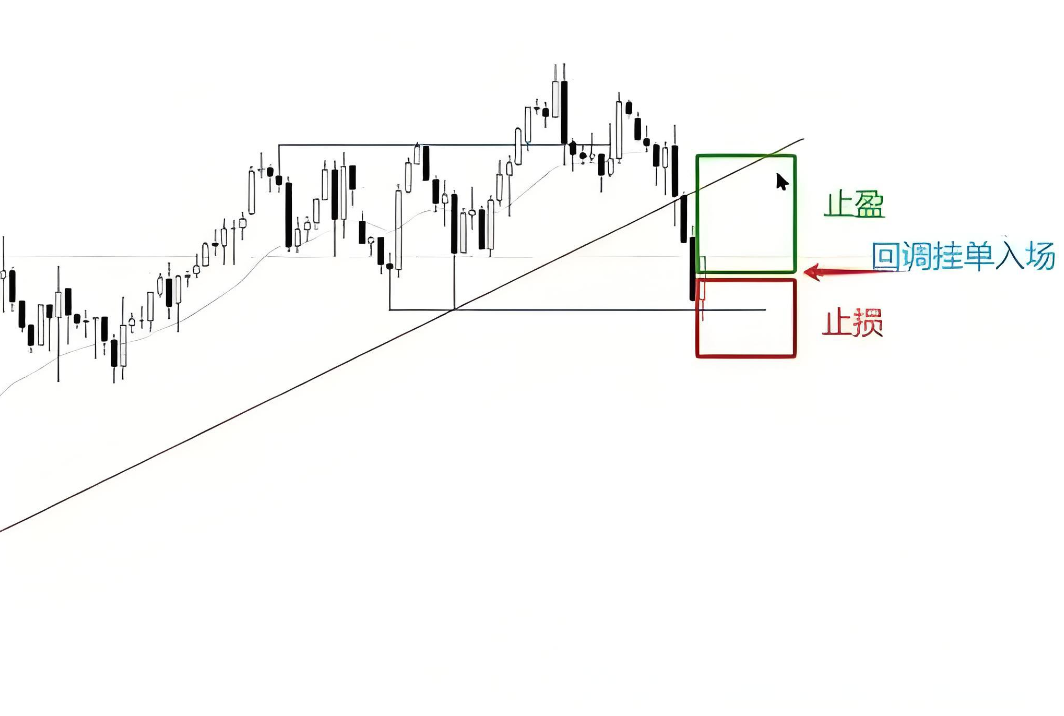
Suppose you mainly do price action trading within technical analysis. When you see the price drop sharply and touch the support level, you might think that the bearish momentum is about to exhaust, and the market may form a trading range. If a long entry signal K line appears in the market, you may actively participate.
Different traders will have different choices for bullish signal K lines: some hope to see strong single K line reversals, some may wait for a second breakout, while others may think that bearish momentum has exhausted after seeing a large bearish line and enter directly.
Each person will choose different entry methods under the same bullish logic.
Suppose you are subjectively inclined toward reversal pattern trading. If you see a false breakout to the upside in the market and a significant break below the trend line, you may think this is a potential reversal pattern signal. When the price retests the previous high again, you might consider participating in a short. In this process, some may choose to build positions in batches, some may wait for the trend line to retest before participating, while others may wait for the price to show a reversal signal K line near the previous high before entering.
Suppose you are subjectively inclined towards trend trading, and you open the moving average group system (e.g., VEGAS).

Observing that the current moving average arrangement shows a strong trend, you will think that the current trend is still healthy and may only be undergoing a complex adjustment phase. You will look for various long entry signals and prepare to participate in the market. Your strategy is to wait for a further breakout in the trend direction.
Here are just a few examples. In reality, there are many other technical analysis tools and various indicator systems, each with its unique users. Regardless of which tool is used for trading analysis, it will have an impact on the market.
Therefore, the same chart and market conditions may lead to different views and decisions among different traders. In such a diversified analysis tool and market participant environment, no one can accurately predict market trends, as each person's analysis perspective and decision are based on personal experience, risk preference, and market observation. Therefore, the true trend of the market is often a comprehensive reflection of many views and decisions, rather than a single correct answer.
Who is right and who is wrong?
When a person's predictive ability is inaccurate, does that mean their analytical logic is wrong?
We previously discussed a cognitive bias in trading called outcome bias. This refers to focusing solely on the correctness of trading outcomes while neglecting to consider the reasoning process behind trading logic. Obviously, this practice is incorrect.
As long as your analysis logic is correct and your entry and exit positions are reasonable, regardless of the final profit or loss, your trading is justified.
For example, in the earlier mentioned case, different system traders make different decisions when viewing the same chart based on their respective trading logics, and these decisions are all correct. Although everyone's analysis logic is correct, the market will ultimately only move in one pattern. As a result, some will inevitably profit while others will incur losses.
Why is this? It's simple: even if there are various opinions in the market, everyone's final decision will become a driving force behind the market. When the funds buying due to various logics exceed the funds selling due to various logics, the price will rise; conversely, it will fall.
Man proposes, God disposes.
The significance of technical analysis
In situations where market movements cannot be accurately predicted, why do we still study technical analysis and engage in trading? Both bullish and bearish views can be correct; doesn't that mean it's meaningless? Why not just avoid learning anything and operate freely?
The purpose of our learning technical analysis is to find those rapidly changing advantages in an uncertain market. This advantage refers to a good combination of win rate and risk-reward ratio.
For example, suppose you are engaged in price action short-term trading. When you see a signal K line giving a long entry opportunity, if you can ensure at least a 1:1 risk-reward ratio and have a win rate of over 60%, this constitutes your advantage.
Even if a particular trade incurs a loss, in the long run, due to your mathematical advantage, you can still achieve stable profits.
The quality of the signal K line in the case shown in the figure is actually average and does not provide a perfect second breakout entry point. If better signals and entry points could be achieved, your win rate and profit potential would be greater. Therefore, by continuously optimizing your trading strategy and signal selection, you can enhance your trading advantage and increase the likelihood of long-term profitability.
If you choose to participate in reversal trading when retesting previous highs, assuming you can ensure at least a 2:1 risk-reward ratio, your win rate should be at least 40%.
Even if the win rate of this trading method is less than half, due to the existence of a high risk-reward ratio, you still possess an advantage from a mathematical perspective. Although short-term losses may occur, in the long run, you can still achieve stable profitability.
The uncertainty of price movements means that under the same market conditions, whether going long or short, there is a possibility of making money. In this case, those who understand technical analysis and mathematical advantages can find profitable opportunities in the market. In contrast, those who do not understand technical analysis and mathematical advantages, whether going long or short, usually incur losses, thus contributing profits to other traders in the market.
Uncertainty of price movements
In the previous case, the price is likely to rise shortly at the signal K line at the support level.
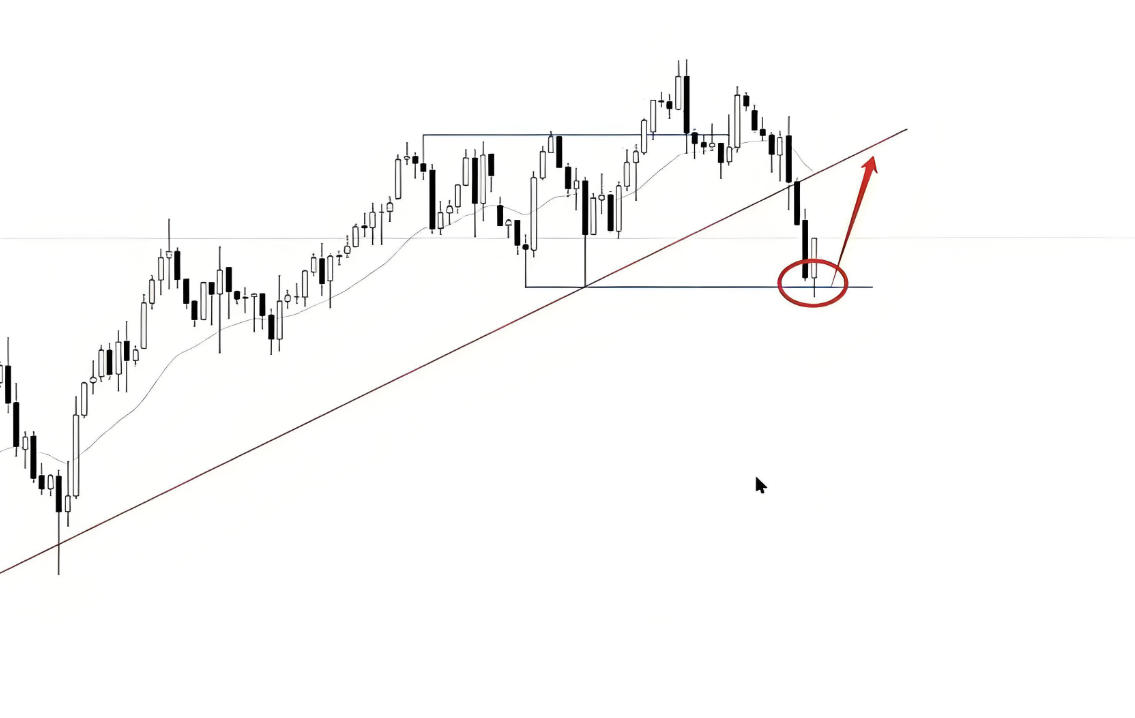
However, after this K line, even if the market experiences 5 K lines of sideways consolidation and then breaks down sharply, it would not be surprising. This trend indicates that the buying power at the current price level is not strong, and the market may seek stronger buying support at lower price levels.
Uncertainty is the fundamental principle and underlying logic of market price movements. We need to understand and accept any trend that may emerge in the market. In this uncertainty, we use technical analysis to find and grasp short-term advantages.
Do not go all-in.
Having understood the uncertainty of price movements, we realize that no matter how perfect the entry patterns are, they can still fail because there are always people holding views opposite to yours in the market. As Al Brooks mentioned in his book, this saying has always reminded me and helped me avoid many detours:
"No matter how confident you are in your judgment, there will always be equally intelligent people who are equally confident in the opposite judgment."
When you encounter what seems to be a very perfect trading opportunity and are very confident in your judgment, even feeling the urge to go all-in, I hope you can remember this saying.
Any pattern can fail.
Any pattern can fail. When a pattern fails, the market usually forms a new pattern.
For example:
If a simple one-segment pullback fails, the trend momentum may not be sufficient and may transform into a two-segment pullback.
If a two-segment pullback also fails, it may turn into a three-segment wedge pullback.
If a potential reversal pattern fails, it may turn into a trading range pullback pattern.
If a trend direction breakout fails, a counter-trend breakout may occur, at which point the pullback pattern may turn into an end-of-cycle reversal.
Pattern failure case one
Observe the price patterns in the chart:

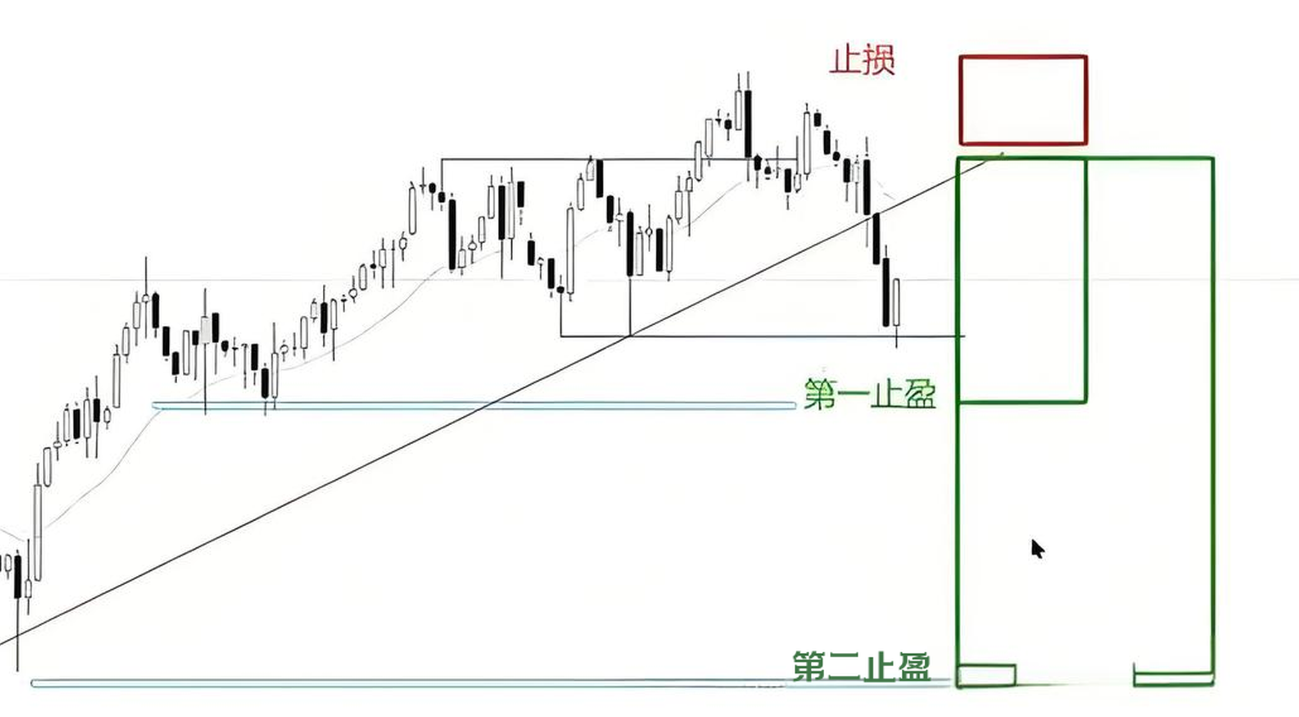
You can view it as a main trend reversal or an end-of-cycle flag reversal; both are reasonable.
We use this reversal pattern to estimate the price movement target. Generally, we take the height of this pattern for equidistant extension. Here, we adopt a conservative height, measuring the vertical distance between the high and low points of the pattern’s body and then extending it downward to find a horizontal level. This horizontal level is our final profit target for shorting.
Subsequent trend analysis: After breaking the double top pattern, the price retested the breakout point and continued to decline.
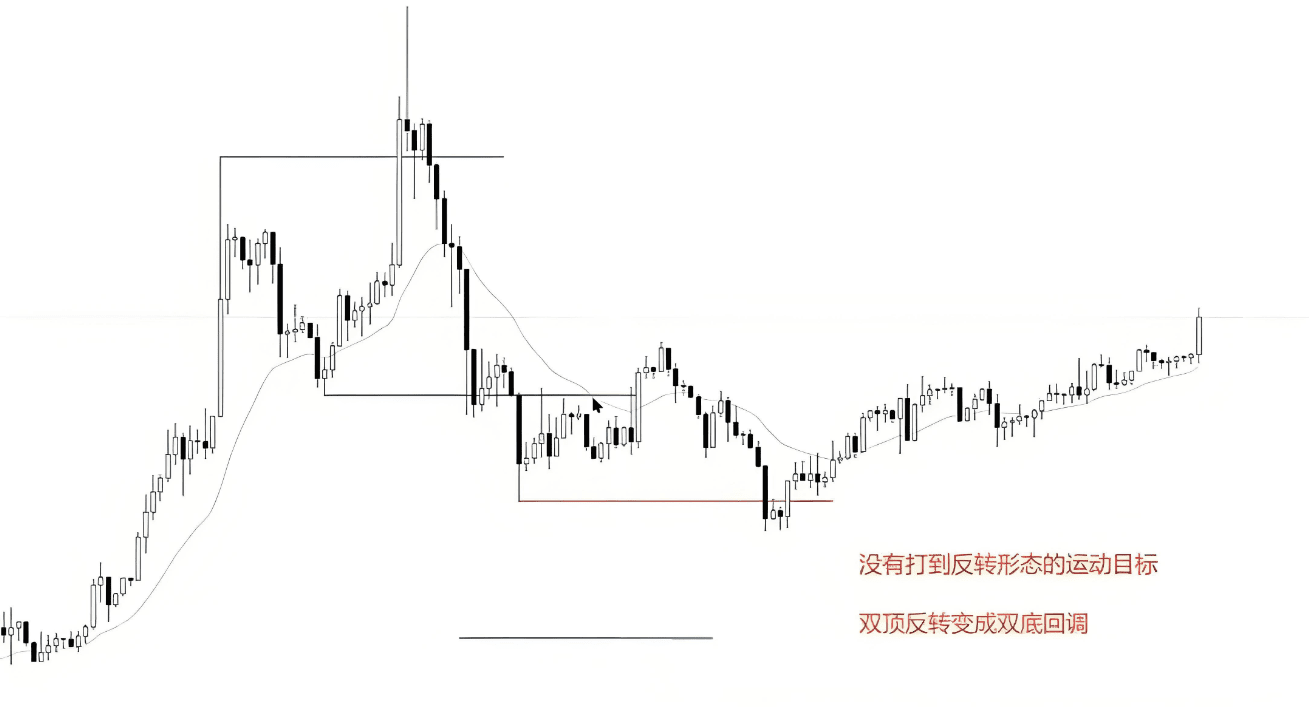
But this drop ultimately failed, with no continuation of bearish momentum, leading to a double top reversal pattern turning into a double bottom pullback.
This situation is relatively common in trading. When we engage in reversal trading and see a counter-trend breakout occur, we may think that the reversal pattern has been established and expect to gain substantial profits. However, reversal patterns often quickly turn into pullback patterns, which can be frustrating. After all, the success rate of reversing the main trend itself is low.
Pattern failure case two
Let’s take a look at this case:
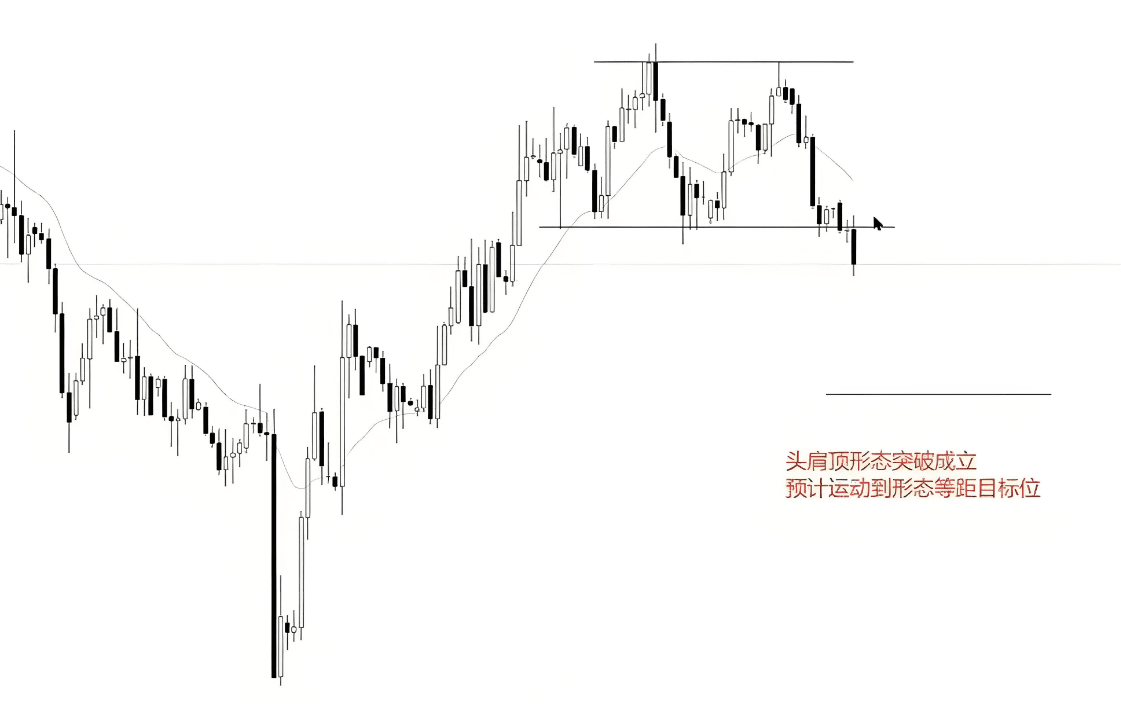
The chart shows a simple head and shoulders pattern that has broken down and formed a reversal. We have plotted the equidistant target levels for this pattern on the chart to determine the final profit target.
Subsequent trend analysis: Although the head and shoulders pattern has broken down and formed a reversal, the actual trend has not shown the expected significant decline.
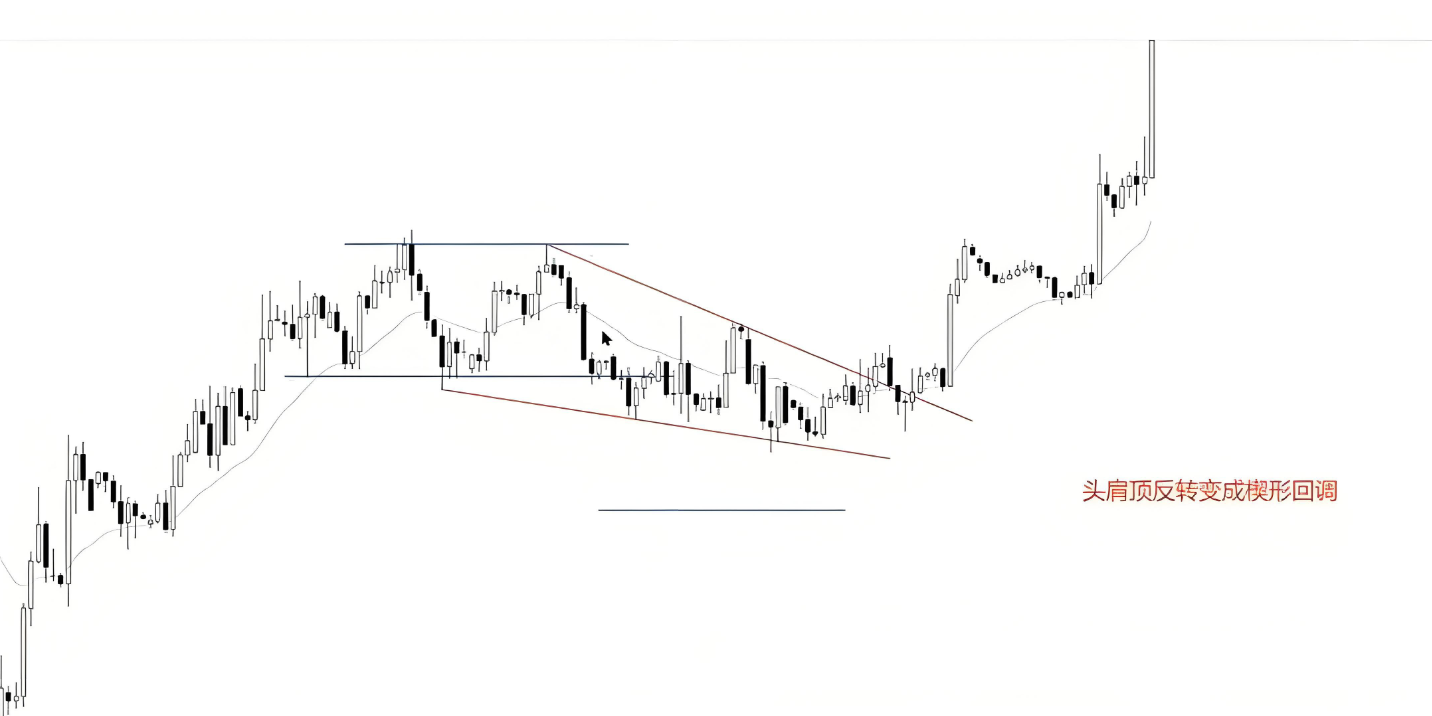
On the contrary, the price movement turned into a slanted pullback (marked in red line segments in the figure). This indicates that after breaking below the head and shoulders pattern, the selling power in the market did not significantly exceed the buying power.
We cannot explore the fundamental reasons for the formation of this phenomenon, but that is not important. What matters is that the chart has already shown the results of the bullish and bearish interplay. Based on these results, we can make corresponding strategies to adapt to the actual market situation.
As a side note: humans are products of habit. When we are pushed to change, our natural reaction is to push back. Resisting change is human nature, while the only way to conquer the market is to adapt to it and embrace change.
The core of trading lies in strategy.
We cannot accurately predict changes in patterns; the core of trading lies in formulating countermeasures.
If you have practiced for a period, understood and accepted the uncertainty of price movements, and can skillfully identify changes among patterns, you have already surpassed most traders in the market. However, to achieve stable profitability in trading, one last point is needed—how to effectively manage orders in a constantly changing market.
Order management is a complex and important topic that cannot be summarized in just a few words. Different types of traders—whether aggressive or conservative—use different trading systems such as long-term, short-term, swing, trend, range, or reversal strategies, and their order management strategies vary accordingly. There are no standard answers for order management; everyone needs to find the method that suits them. In future courses, we will delve deeper into this topic.
Everyone can first consider how to respond to the following issues encountered during trading:
1. Setting take profit and stop loss after entering: Adjust according to personal trading system.
2. After entering, the market quickly hits the take profit or stop loss: the system exits automatically, requiring no additional management.
3. After entering, the market moves sideways: observe the market trend and adjust the strategy in a timely manner.
4. After entering, the price moves toward the target but reverses before reaching it: assess the market situation and decide whether to adjust take profit or stop loss.
5. After entering, the price hits the stop loss but then presents a good second entry opportunity: adjust the strategy based on new information.
In future courses, I will provide some ideas and suggestions to help everyone solve these problems. When you understand and accept the uncertainty of price movements, are able to recognize pattern changes skillfully, and have developed effective coping strategies, congratulations, you have already stepped into the door of stable profitability in trading.
Nested structures of patterns
It is quite common for a large structure to contain a small pattern.
For example, in a large trading range, if the movement from the bottom to the top of the range is a triple push rest shape, then shorting at the peak or going long at the bottom of the range is equivalent to simultaneously validating multiple pattern logics. This means you can make decisions using multiple pattern signals at the same entry point.
Another example, if a small head and shoulders reversal pattern appears at the top of a range, then shorting at this position also simultaneously validates multiple pattern logics. This trading approach is usually more comfortable because it has a higher win rate.
Patterns nested within a range are relatively easy to identify, but there are also nested structural forms in other market states. If you can identify such nested structures, you can seize trading opportunities with significant advantages.
Limitations of technical analysis
Although technical analysis is very useful in many cases, it also has its limitations.
1. Low market capitalization market
The effectiveness of technical analysis is mainly reflected in markets where bullish and bearish interactions are sufficient and liquidity is normal. When the market has low capitalizations and the main force controls it tightly, the effectiveness of technical analysis will be greatly reduced. In this case, the main force can manipulate K line charts at will, and retail investors often cannot effectively utilize technical analysis tools because their interplay with the main force is unequal. If you enjoy participating in such markets, many technical analysis methods in this series of courses may not provide you with practical help. In such markets, you can refer to the Wyckoff method, learning to identify accumulation, distribution, and other patterns.
2. Liquidity explosion
This situation typically arises from sudden news shocks, such as significant positive or negative news suddenly appearing. The market will instantaneously see a surge of buying or selling power, resulting in insufficient counterparties to digest these transactions in a short time. In such cases, prices often break through all small cycle technical patterns quickly and pause at the support or resistance levels of larger cycles. For example, in the foreign exchange market, when important economic data is released, if the data deviates significantly from expectations, related varieties may experience severe fluctuations, and all small cycle technical patterns will fail. As a short-term trader, I usually avoid trading during the US market session to mitigate the risks brought by such liquidity shocks.
3. Liquidity exhaustion
Liquidity exhaustion usually occurs in extreme market conditions, such as during a global financial crisis. In such cases, markets like gold and crude oil may experience huge spreads, and trading liquidity may drop significantly. For example, during a financial crisis, the spread of gold could widen to several dollars, which is unimaginable under normal circumstances. At this time, the effectiveness of technical analysis will also be greatly reduced because the market's liquidity is insufficient to support the formation and verification of technical patterns.
4. Large-scale capital entry and exit
When institutions or large funds engage in large-scale trading, their entries and exits can have a huge impact on the market, creating liquidity shocks. For example, if a big player buys a large amount of Bitcoin, the price may rise rapidly, breaking small cycle technical patterns. Conversely, if the big player sells off, the price may drop quickly, breaking through multiple technical support levels. Such situations are common in the cryptocurrency trading market, especially when large funds intervene; technical analysis patterns can fail due to liquidity shocks.
In these cases, the role of technical analysis is diminished, and we need to respond flexibly to sudden market situations and adjust our strategies based on actual market changes.
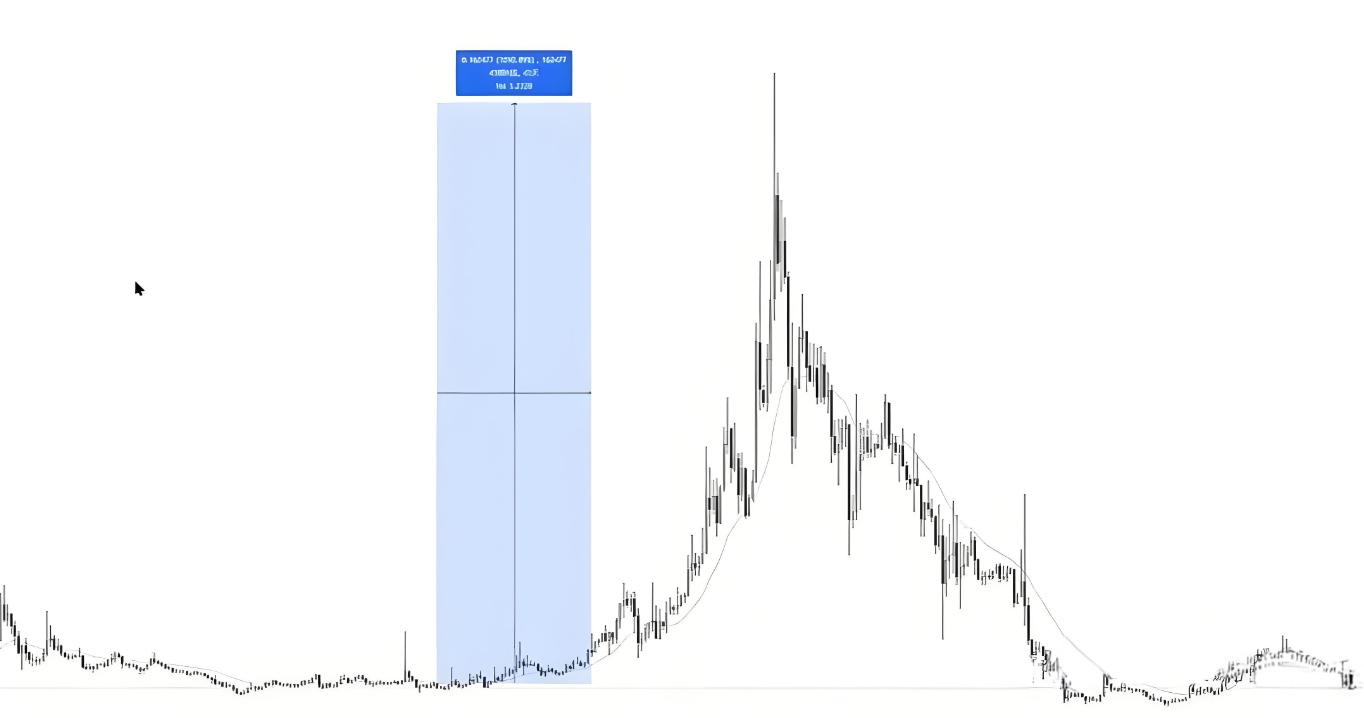
Small-cap variety case study
Why can some varieties increase dozens or even hundreds of times in a few years? The logic behind it is quite simple: either there is a lack of selling power, or there is continuous buying power, or both exist simultaneously. In this case, a price increase of several dozen times is indeed not a problem.
Let's discuss the differences between the two in more detail. Newcomers may mistakenly believe this is the same market state. Look at some small altcoins; they all share several common characteristics:
First of all, these altcoins have very low market capitalizations, and the main team holds the vast majority of the chips, with over 90% of the chips in their hands. This level of control in the stock market is unimaginable due to regulations. Additionally, most people do not have a positive outlook on these altcoins and do not buy. Thus, when they start to rise, there is almost no selling power, as the chips are all held by the main force, leading to very little circulation in the market. They can raise the price however they want, and increases of dozens or even hundreds of times are not a dream.
However, many new friends entering the market like to participate in these varieties, fantasizing about getting rich quickly, but these varieties have several fundamental problems:
1. Low trading volume during the bottoming phase: In the bottoming phase, trading volume is very low, and you cannot buy many chips. Once you make a large purchase, your buying power will form a large bullish line due to insufficient market depth. The main force may see retail investors making large purchases and may abandon their short-term pull-up plans.
2. High position ratio: Even if you buy in batches every day and acquire a lot of chips, fantasizing about your value multiplying dozens of times, you cannot forget that your large purchases may already occupy a considerable proportion of the actual circulating chips in the market. Once you sell, the effect of this selling behavior is close to that of the main force's sell-off. When you see a floating profit of dozens of times, a 30% loss is quite normal.
3. Main force controls the price: The previous two points assume that the price is likely to rise, but in reality, due to the main force's strong control, whether the price rises is determined by the main force. If they do not want to pull up the price, it is normal for your position to be stuck for years. Even if the price rises, where it rises to is also determined by the main force, as they hold the majority of the chips. Once they sell off, the price will plummet rapidly, even to zero.
The high control of these altcoins makes the price fluctuations completely decided by the main force.
Participating in this market carries significant risks, as price crashes to zero are not uncommon. When the main force distributes more than 90% of the chips to the market, without sufficient funds to absorb them, the price will naturally collapse. This logic couldn't be simpler.
High market capitalization varieties
Figure one is the weekly chart of Moutai, and figure two is the weekly chart of Apple.
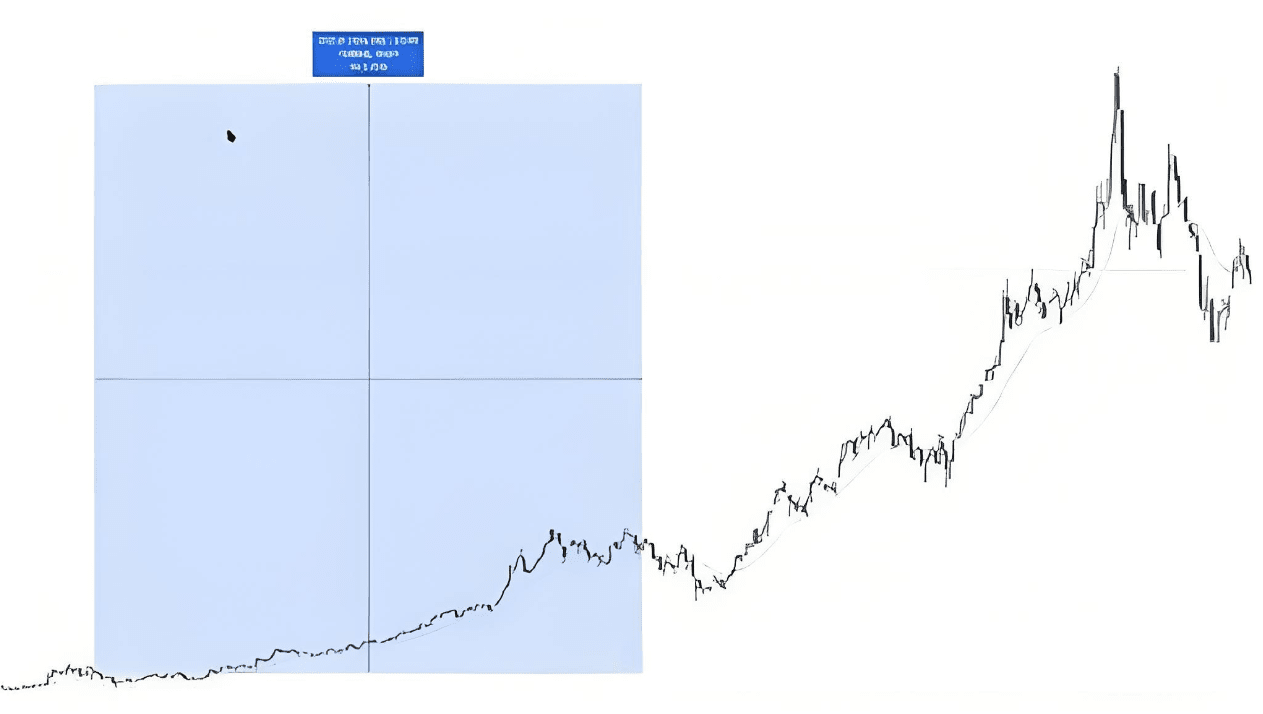
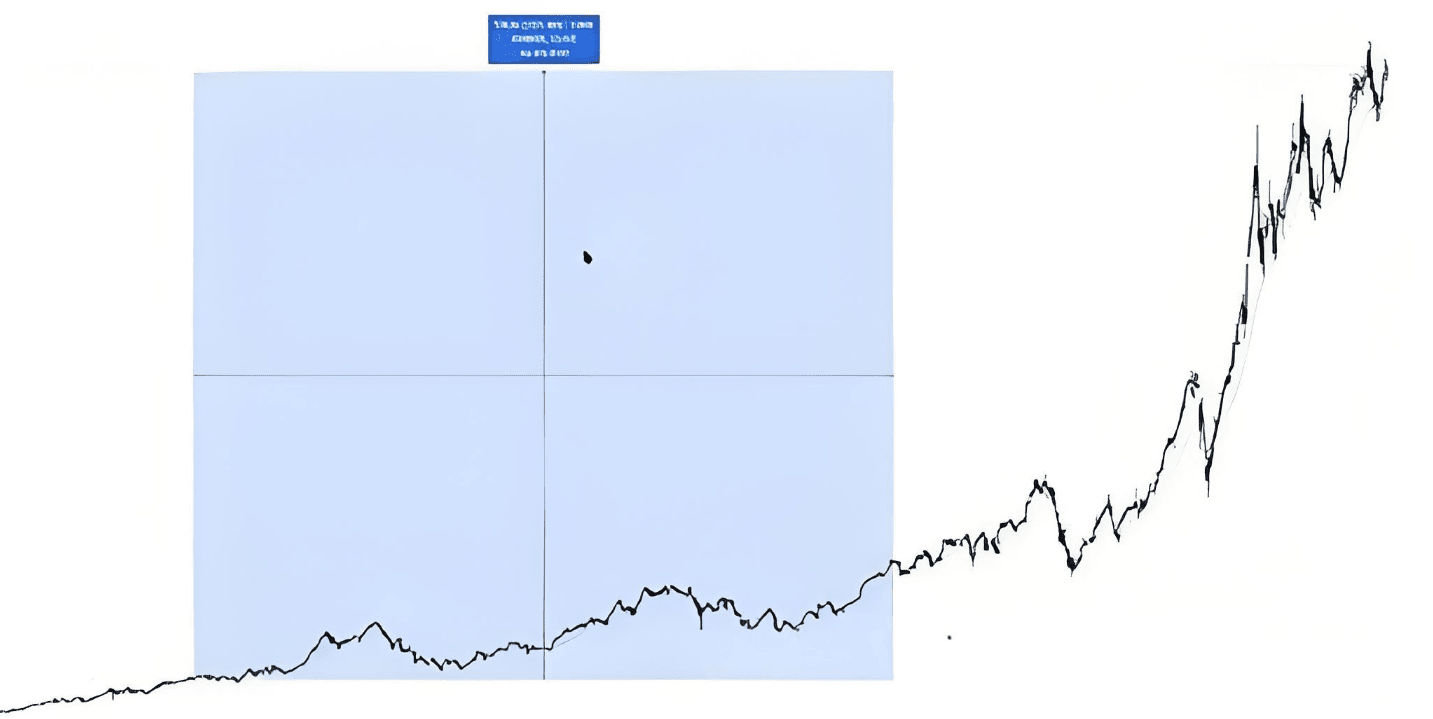
These two varieties have also increased more than tenfold over a long time. So, what is the difference between them and the altcoins mentioned earlier?
1. Both are leaders in their respective sectors with very high market capitalizations.
2. Due to regulatory mechanisms in the stock market, it is impossible for any institution to have high control.
In these markets, many institutions are fully engaging in speculation. These varieties also had many retail investors involved in the early stages.
Why can these varieties also rise dozens of times continuously in ten years? The reason is simple: there is continuous buying power. Institutions or individuals have many reasons for continuous buying, which could be national policy guidance, a positive outlook for the industry, or technical advantages.
During the global financial crisis, central banks around the world released a lot of liquidity, which flooded into the stock market and further propelled the rise of these varieties.
In summary, these varieties have sustained buying power, supporting the continuation of the bull market. When trading these varieties, you don't have to be as worried as when trading small altcoins. You can buy at any time without worrying about insufficient market depth; you can also sell at any time, whether selling hundreds of millions or billions, the market has enough liquidity to absorb it.
Trading experience and chart-reading ability
Some friends ask why you read charts so easily, always finding key patterns and signals, making trading seem easy. Meanwhile, when I trade, I read charts slowly and cannot find key information, lacking confidence in trading.
This is actually due to the difference in trading experience.
Recently, I visited a trader friend in real life. He traveled from Dali to Shanghai, and we discussed a lot about trading experiences and insights. His trading enlightenment came from Livermore and Al Brooks, specializing in short-term trading on 5-minute and 15-minute charts. Therefore, our trading systems are very similar. He mainly uses two sets of systems: moving average combinations and naked K price action entry signals.
Although our systems have some differences, the entry logic is the same. However, even using a similar system, his trading data shows a risk-reward ratio of around 1.2:1, a win rate of 75%, a loss rate of 10%, and the rest is break-even. This is very impressive trading data; if I hadn't seen it with my own eyes, I would have difficulty believing it.
He used this system to trade $500,000, with an average profit of $150,000 to $200,000 per month, and this was at a level where he stopped compounding two years ago. If he continued to compound growth, the current account size would be unimaginable.
Why can his trading level be so much higher than mine using almost the same system? It is also due to differences in experience. The longer you trade, the more trades you experience, and the richer your chart-reading experience, the better you can discern which signals are more advantageous and which signals are not worth taking, leading to subjective decisions. Moreover, trading will also feel more natural.
In his own words, reading K lines to trade is as natural as drinking water; entering, exiting, and managing orders require no excessive thought. Therefore, I believe that for a newcomer, from just starting trading to achieving stable profits, becoming a trading expert, gradually accumulating wealth, and finally becoming a master to achieve financial freedom, each step is an accumulation of experience.
Trading discipline
Some friends reflect that they cannot control their hands, knowing they shouldn't but still unable to stop themselves from making random trades, leading to losses. I don't know what to say about this.
I believe that adhering to discipline is a basic condition for trading; without discipline, stable profits cannot be achieved. This is a very simple truth, so for me, it is just a matter of executing simply.
I am also unclear about why many people cannot adhere to discipline. Friends with such issues can look for books on trading psychology to learn, or avoid situations of losing control in the design of their trading systems.
For example, for me, if a trade hits my stop loss and immediately gives a good second entry opportunity, I will not take it. This entry is easy to get me excited, so when designing the system, I directly eliminated this situation.
This is the trading experience that Yan An shares with everyone today. Many times, your doubts lead to missed opportunities for profit. If you do not dare to boldly try, engage, and understand, how will you know the pros and cons? You will only know what to do next after taking the first step. A cup of warm tea, a word of advice, I am both a teacher and your eloquent friend.
Fate brings people together, but understanding separates them. I firmly believe that destiny leads to encounters, and separation is a matter of fate. The journey of investment is long, and momentary gains and losses are just the tip of the iceberg. One must understand that even the wisest can make mistakes, while the less wise may find gains. Regardless of emotions, time will not stop for you. Put away your worries and stand up to face forward again.
The martial arts secret has been shared with you; whether you can become famous in the world depends on yourself.
Everyone should save these methods, and friends who find them useful can share them with more people involved in cryptocurrency trading. Follow me to learn more valuable content in the crypto space. Having been through the rain, I am willing to hold an umbrella for the retail investors! Follow me, and let’s walk hand in hand on the crypto journey!