I have been in the cryptocurrency world for ten years. Six years ago, I quit my job to trade cryptocurrencies. The real change came to me on a night six years ago. Something an old senior said to me struck a chord and helped me position myself correctly. I understood the eight major periods that every cryptocurrency enthusiast must go through, constantly reflecting on myself, using this as a mirror, and finally reclaimed everything I had lost!
Perhaps in the eyes of some, retail investors are always sheep waiting to be slaughtered!
If you are ready to enter the cryptocurrency world, I sincerely hope this article can help you. As someone who has decent summarizing skills and can express myself reasonably well, I believe some of my thoughts may be of assistance to you. Alright, without further ado, let's get straight to the point~
When it's difficult to make a selling decision in cryptocurrency trading, ask yourself: If your analysis is correct, why is the market moving in the opposite direction? The only reason is that you are wrong, because the market does not make mistakes!
Before we start learning, we emphasize again!
Market movements have inertia; once a clear trend develops, all reversal patterns are likely to fail and are more likely to form a fluctuation range, with only a small probability of leading to a counter-trend breakout that reverses the original trend.
Guide
Peak reversals and terminal flags are both difficult to enter trades, and I usually use them to manage orders I already hold.#加密市场回调
Although these patterns are not suitable for entry trades, learning them is still crucial. Only by mastering the logic and rules of various price movements can we remain calm and composed in the trading market, better manage our mindset and orders.
At the same time, the two patterns explained today are challenging in trading, but they are quite common in the market. Understanding these patterns can help us gain a more comprehensive understanding of market dynamics and make more precise judgments in actual operations.
Peak reversal
First, we will explain the peak reversal. The peak reversal is a manifestation of extreme market sentiment.
FIL case analysis
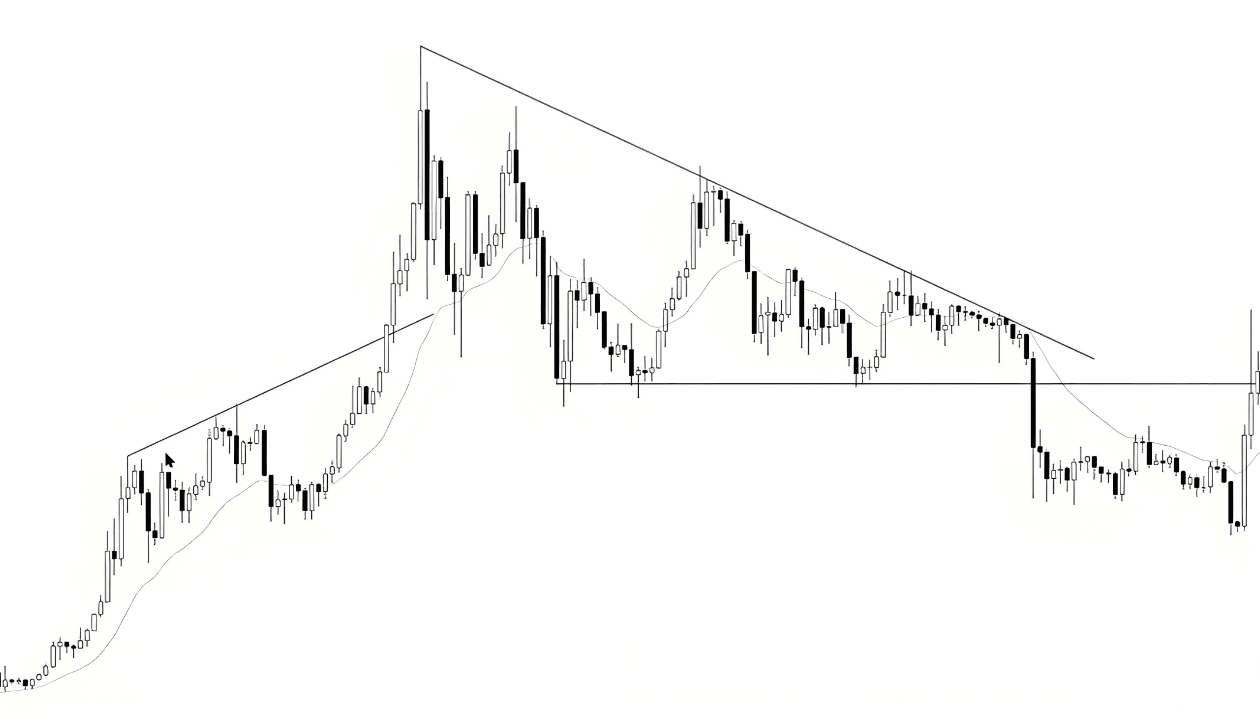
Taking the bullish trend case in the picture as an example, this situation is especially typical in commodity markets. The picture shows that the market has entered an overbought state, meaning the bullish trend has run for a long time without significant pullbacks.
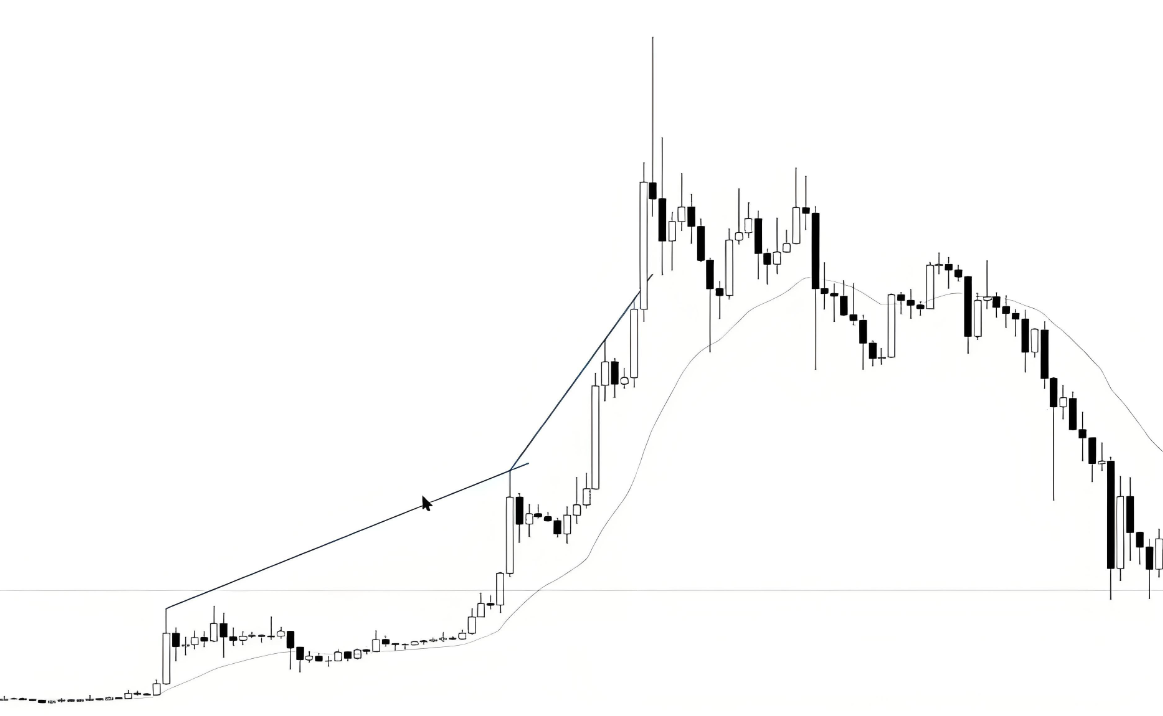
Please note the two channel lines in the picture; the slope of the second channel line has clearly increased, indicating the market is accelerating. This increase in slope indicates that the market's buying sentiment is very urgent. The extreme greed in the market is shown by participants fearing that the market will not provide good pullback prices again, thus they are willing to buy at any market price. This sentiment is manifested as consecutive strong trend candlesticks, with trend candlesticks getting longer, as shown in the picture, and breaking through the short-term trend channel line.
We know that if the trend movement is too rapid and the magnitude is too large, the number of profit-taking positions in the market will increase, and many counter-trend participants will be willing to enter. Under rational conditions, we usually do not want to chase such accelerating price movements. However, many weak traders and retail investors often buy frantically in such situations because they are controlled by extreme greedy emotions.
Such peak rises are usually accompanied by good news, while peak declines are often accompanied by bad news. Therefore, when traders see such rapidly rising candlestick charts, they often see not risks, but the fantasy of huge profits, worrying about missing out on a big market, and thus buying frantically without waiting for a pullback.
When market-dominating emotional traders take the lead, strong participants, rational traders, and institutional players all know that most people have already bought in, and there is no new buying force. The main players and institutions are usually unwilling to enter at this price because they already participated in the trend at lower positions. When this extreme emotion appears, they will begin to take profits, and may even trade reversely.
For traders holding short positions during a peak, their emotions are often extremely panicked, unwilling to wait for a pullback, and instead closing positions at market price. When the last batch of weak short traders despair and exit, the number of new longs in the market gradually decreases, leading to simple subsequent movements such as significant pullbacks, prolonged sideways consolidations, or trend reversals.
Weak traders often make opposite moves to the institutions. When the market quickly rises, the originally sidelined weak bullish traders can no longer resist and jump in, while the severely losing weak bearish traders cannot stand the losses and close their orders.
Strong participants, on the contrary, will close their long positions while the peak rises, and some institutions will even start shorting in batches after a long bullish candlestick appears. For example, this giant bullish candlestick:
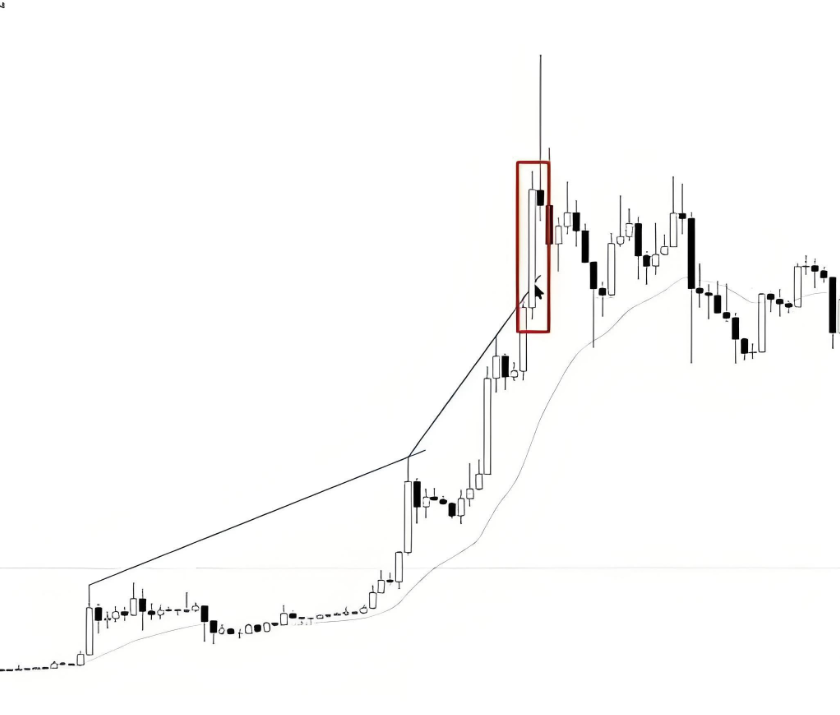
Of course, this operation is what institutions do, and I do not recommend ordinary traders attempt to build positions in batches because it requires strict position management and order management, which is difficult for ordinary traders to achieve. If we encounter signals of peak reversals, we can choose to close positions in batches; this is also the only practical operation method for peak reversal patterns for me.
For example, in the case of FIL, Teacher Luo bought it at over 20 USD and emptied all positions at around 170 USD. This is how strong traders operate; they follow rational logic rather than emotions. Although the price ultimately rose another 40% after closing the position, as traders, we should focus on the money we have already made, not on the money we could have made.
I remember when the price broke through 200 USD, market sentiment was at its most frenzied, and many cryptocurrency chat groups and communities were buying frantically. Getting trapped in such extreme sentiment is to be expected. Peak reversals usually come very quickly and thoroughly. For example, in the bullish trend shown in the picture, some strong momentum traders continued to increase their positions as the price accelerated upward because they believed the market would continue to rise. However, at certain key points, they might judge that the market has risen too much and too quickly, leaving only a very short window to sell and gain substantial profits. If they fail to sell in time, a slight pullback may quickly turn into a complete reversal, missing the ideal exit opportunity. For instance, FIL stayed at its peak around 200 USD for several hours, and if you didn't sell during that time, your long position could face significant losses.
While major bullish players are madly taking profits, large institutions short-sellers will also catch signals of excessive market rises and conduct a large number of short sales, causing the market to quickly decline by one or two waves, or even more. This is a significant peak reversal bearish trend.
Although peak reversals can easily lead to significant and rapid counter-trend movements, like other reversal patterns, most attempts to reverse trends often end in failure.
After the peak reversal in a bullish trend, prices usually drop significantly. However, when prices fall to a level acceptable to major bullish players, these bulls may re-enter, trying to extend the bullish trend. Only when they find that the bullish strength cannot effectively break through the previous high will they change their view of the market state.
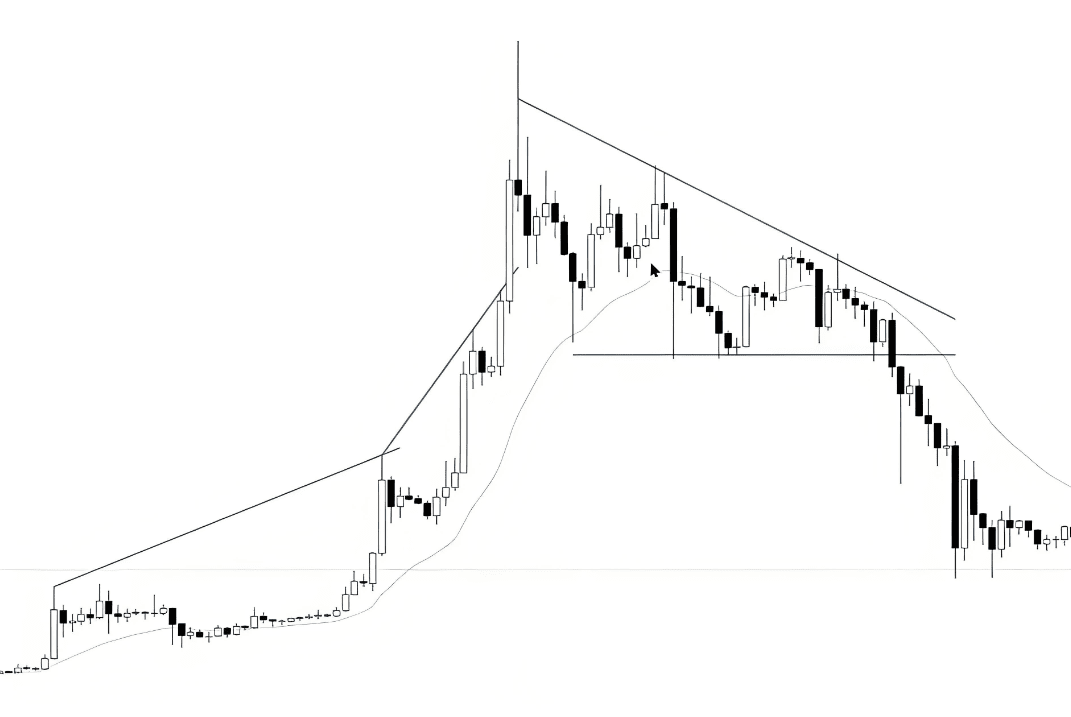
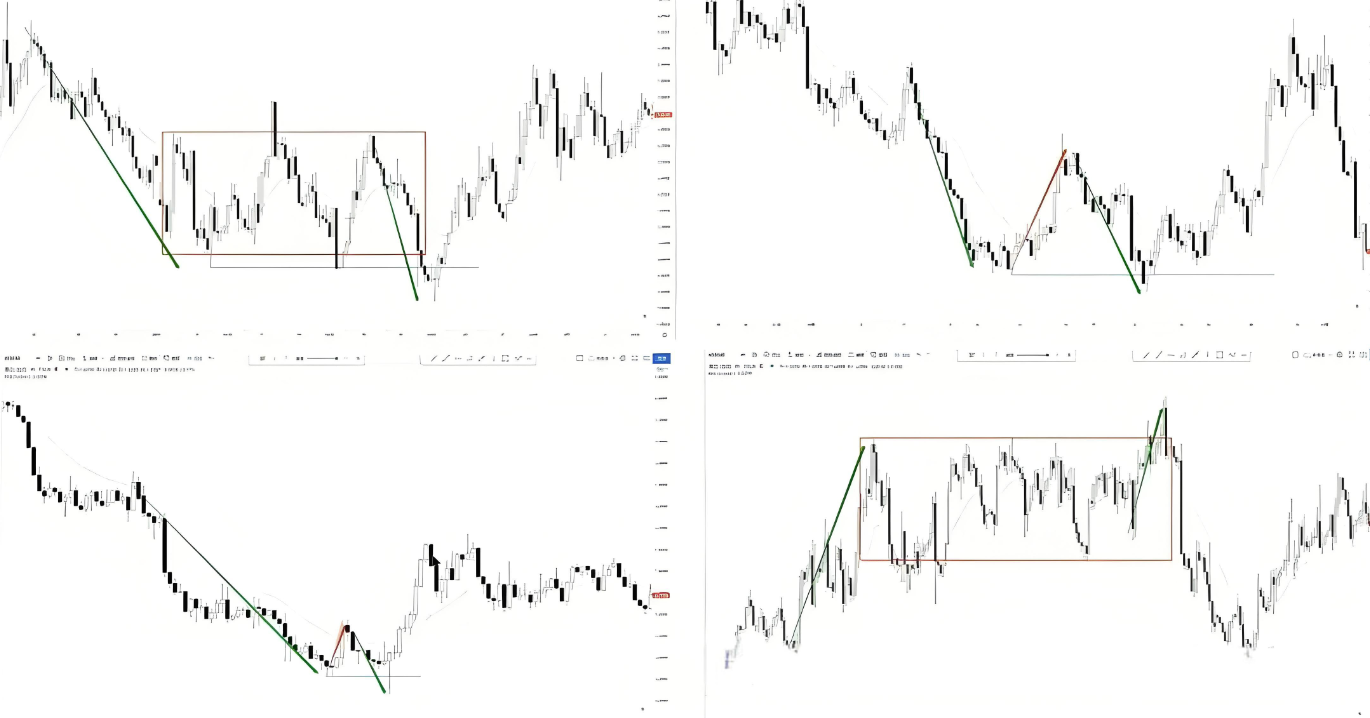
For example, the case in the picture shows that after the peak reversal, the price does not drop directly but forms a new consolidation pattern, namely a converging pattern. When this pattern breaks downward, it indicates that the bullish force is weakening, that the bulls are no longer defending, nor buying. At this time, the trend may completely reverse.
BTC case analysis
The Bitcoin case is also like this.
Firstly, it broke through a channel line, then the upward movement accelerated, represented by consecutive bullish trend candlesticks that are increasingly longer, all of which are manifestations of peak emotions. Next, the price sharply reverses and drops significantly.
When the price drops to a level where a bullish trader is willing to re-enter, the price will once again attempt to test the previous high. However, if it is weak in testing the previous high, it will form a new consolidation range, namely a converging pattern. Once this new pattern breaks downward, the entire trend will completely reverse.
Secondary testing of the peak reversal
A peak reversal can also go through a secondary test, but sometimes the magnitude of the test is very small, almost negligible.
For example, after the panic selling of Bitcoin during the 312 period, the price did not test the bottom above 3,000 USD again.
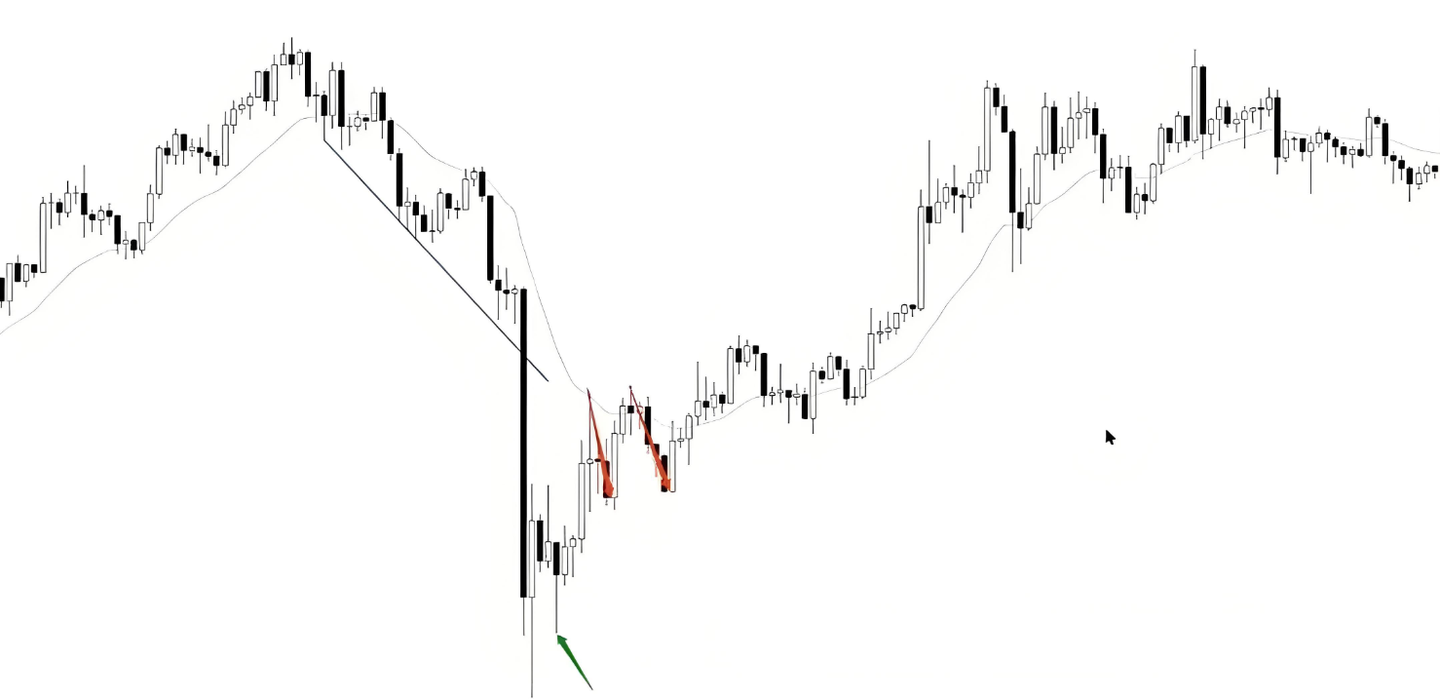
Although the down wave (red arrow) tested the bottom, the magnitude was very small and can be ignored. Additionally, the green arrow indicates a test of the bottom, which is actually a micro double bottom, with the low point slightly elevated, which is more apparent on smaller timeframes but not so evident on our current time chart.
As a side note, regarding the issue of multiplicity. We can understand these two declines (red arrows) as tests of the bottom, viewing them as a continuation of bearish trend energy. However, these two declines can also be seen as a pullback in the bullish trend after a peak reversal, i.e., an adjustment trend following a rapid rise. Such interpretations are reasonable in actual trading.
In actual trading, we often encounter wave trends with multiple possible interpretations. Understanding and accepting this multiplicity is crucial.
Peak reversals in trend pullbacks
In peak reversals during trend pullbacks, wave points are often not easily tested. For example, the case in the picture shows that there was a clear bullish trend before, followed by a pullback.
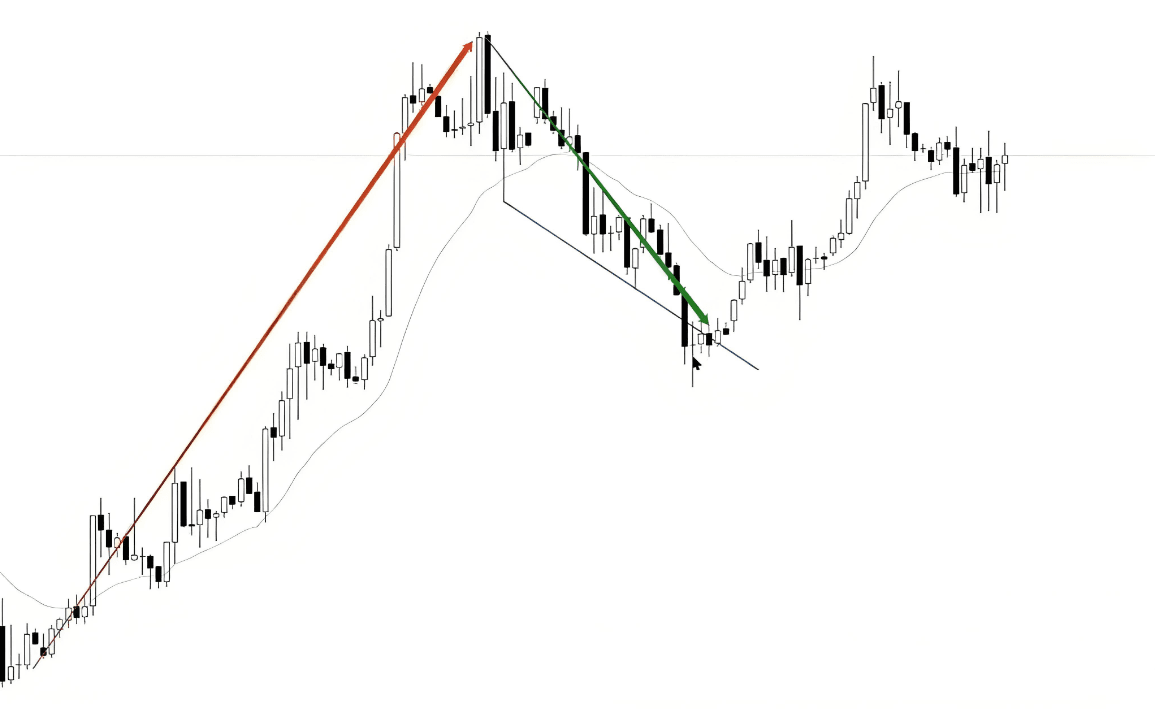
During the pullback process, the downward channel line was broken, while the bearish trend line gradually extended, ultimately forming a bearish peak reversal.
When this peak reversal occurs during the pullback trend, most trend-following traders will think that the pullback has ended, and the trend is about to resume. They usually participate actively in the market because they have no hesitation or uncertainty about their view. Therefore, for these traders, a secondary test is not necessary to verify their perspective.
Peak reversal in support and resistance levels
Sometimes, peak reversals can occur at certain support or resistance levels, such as horizontal levels.
For example, the case in the picture shows a horizontal resistance level for the wave. At this horizontal resistance level, the market experienced peak rises, the slope of the trend channel line accelerated upward, ultimately forming a peak reversal.
Peak reversal of the trend line
In the example of a peak reversal on a trend line, such as the rising trend shown in the picture. During this pullback, although the trend line shows a clear peak reversal, this decline is displayed as a downtrend on a smaller timeframe.
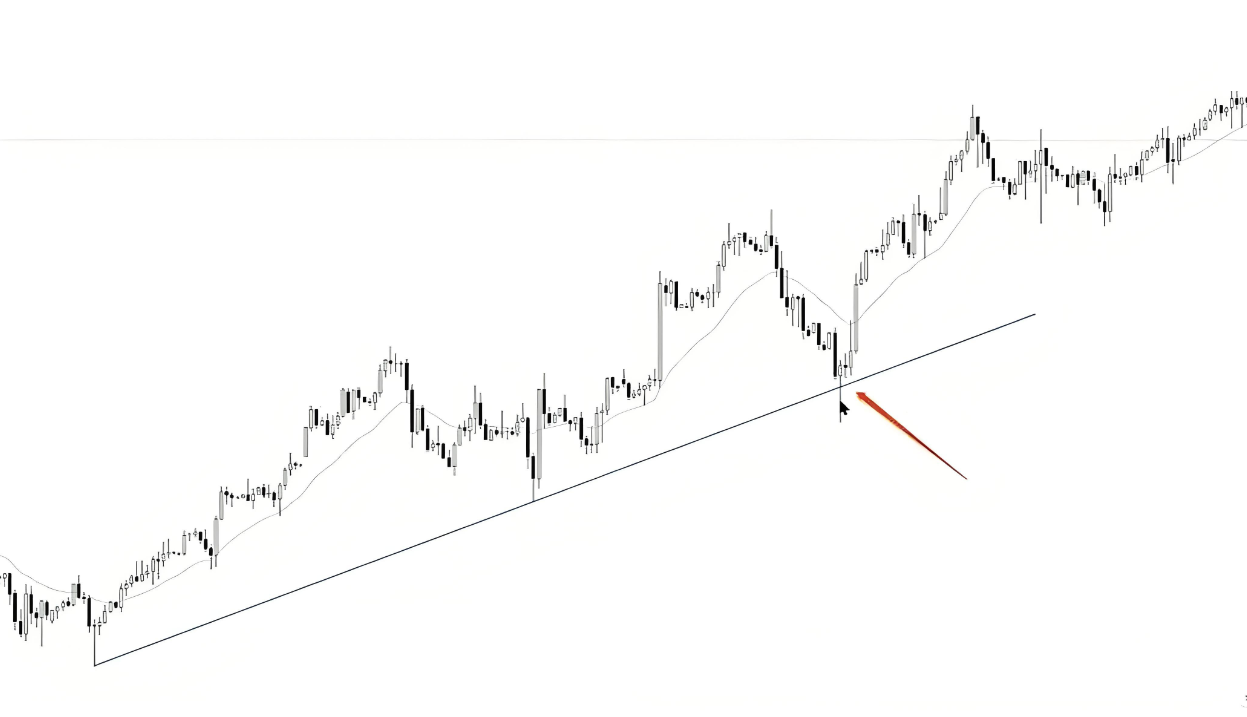
In this drop, there was a sudden acceleration, with the long-wicked candlesticks showing characteristics of a rapid drop followed by a rapid rise, reflecting the characteristics of a peak reversal.
Additionally, the following chart shows a peak reversal at the channel line.
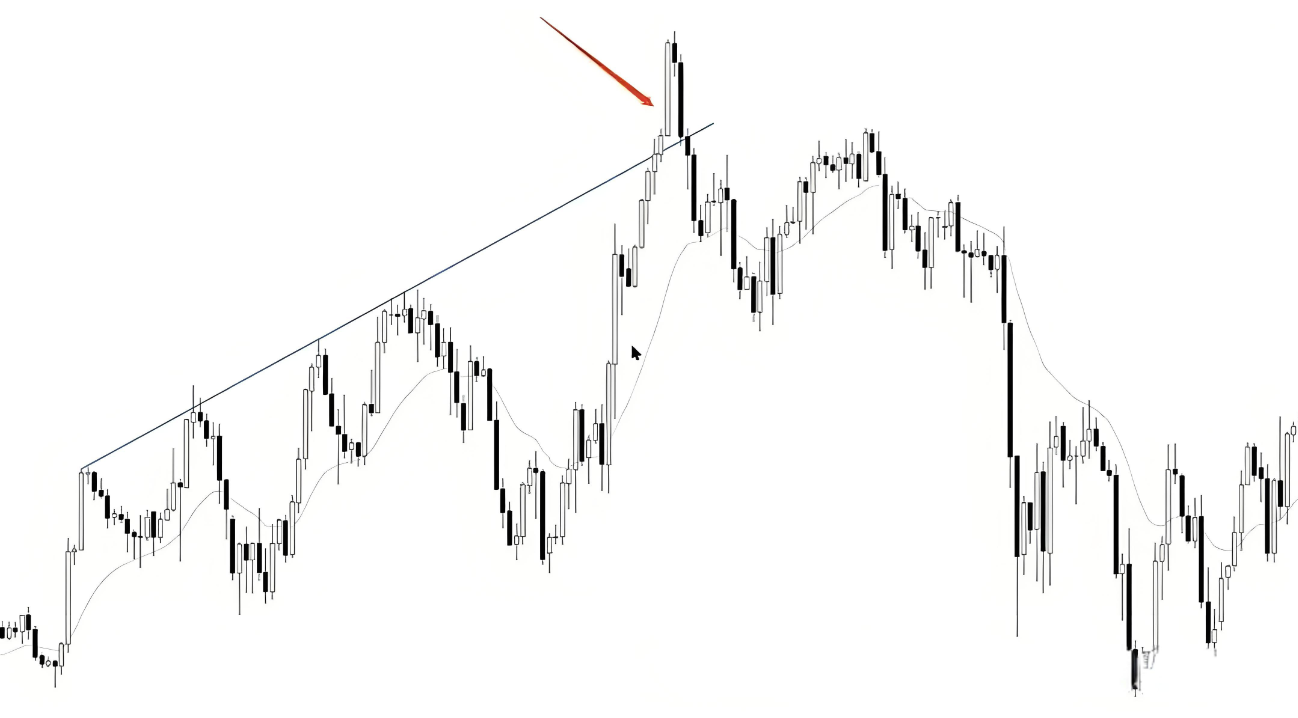
Whether at trend channel lines, moving averages, or other support and resistance levels, the phenomenon of peak reversal may occur.
Experienced traders or major institutions usually make reversal trades based on these signals. However, for beginners, I do not recommend trying this strategy as it is very difficult to master.
The purpose of studying this pattern is to understand the logic of price movements and use it as a basis for profit-taking or batch closing, which can help us warn of risks and avoid rushing in like novices when seeing consecutive bullish or bearish candlesticks.
Terminal flag
The definition of the terminal flag reversal pattern is: it usually appears in the last stage of the trend, manifested as a type of adjustment pattern.
Al Brooks refers to all consolidation patterns as 'flags', not limited to channel patterns.
Let's look at a few cases.
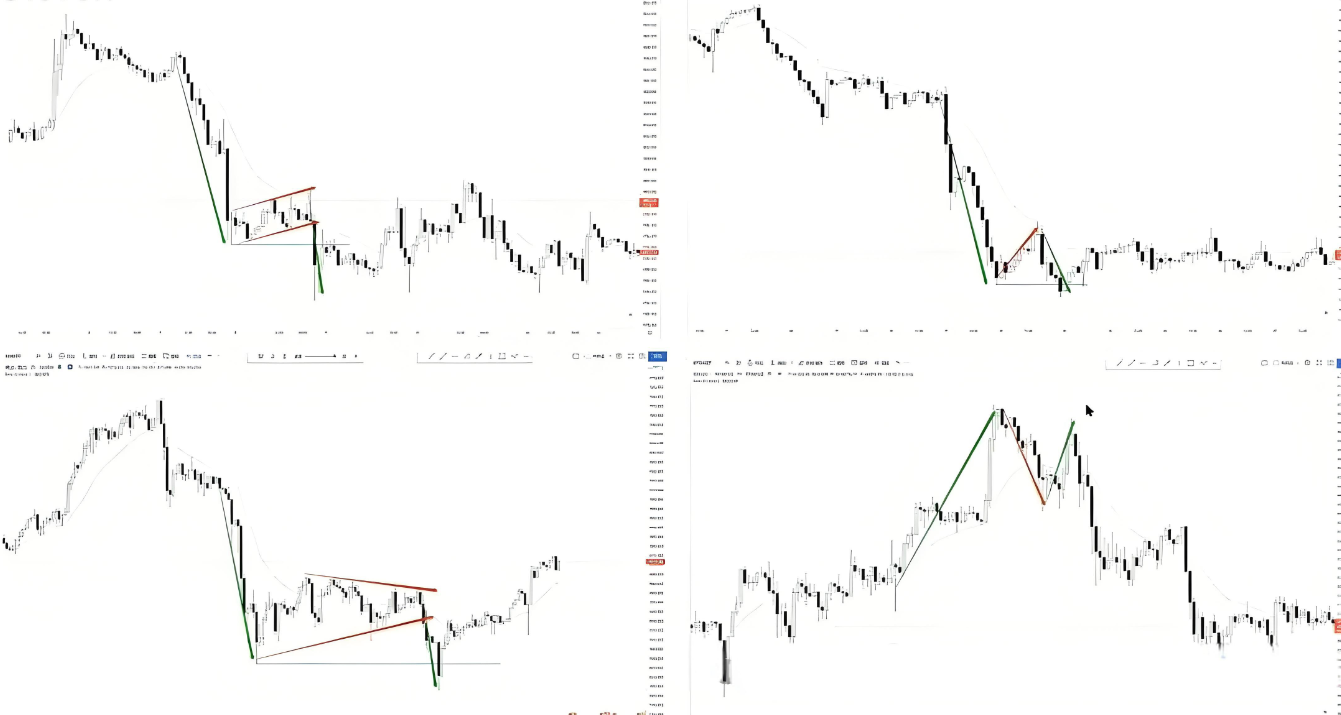
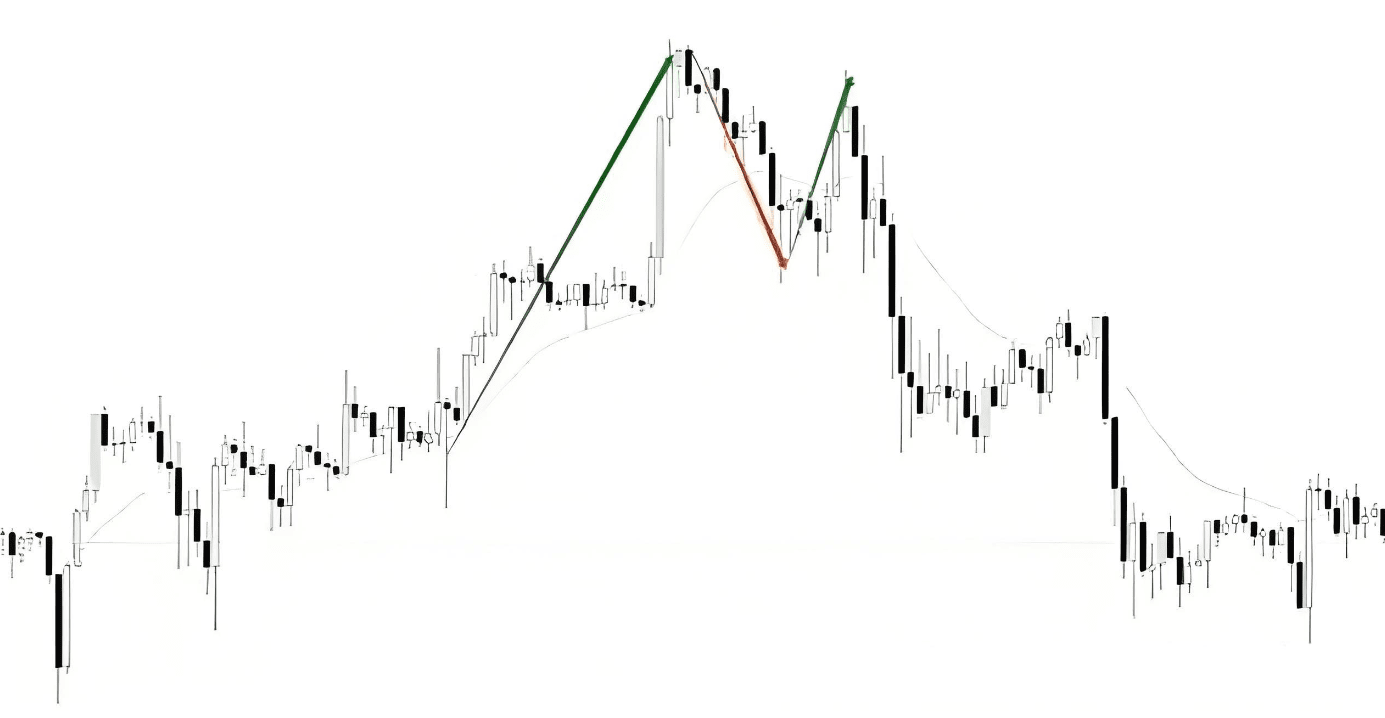
In the chart, the red arrows indicate trend consolidation patterns, while the green arrows indicate the wave movements in the trend direction. It can be seen that these adjustment patterns often lead to weak trend waves, often accompanied by false breakouts and may not even test the extreme values of the previous trend.
We will analyze these cases one by one:
First case
This is a terminal cycling adjustment pattern. After a significant drop, there is a slight decline following an adjustment, and this decline is weak. Then, a terminal cycling reversal occurs, which, although it does not trigger a trend reversal, forms a sideways range. Reversal patterns rarely lead to true trend reversals; they more often manifest as counter-trend waves or sideways range consolidations.
Second case
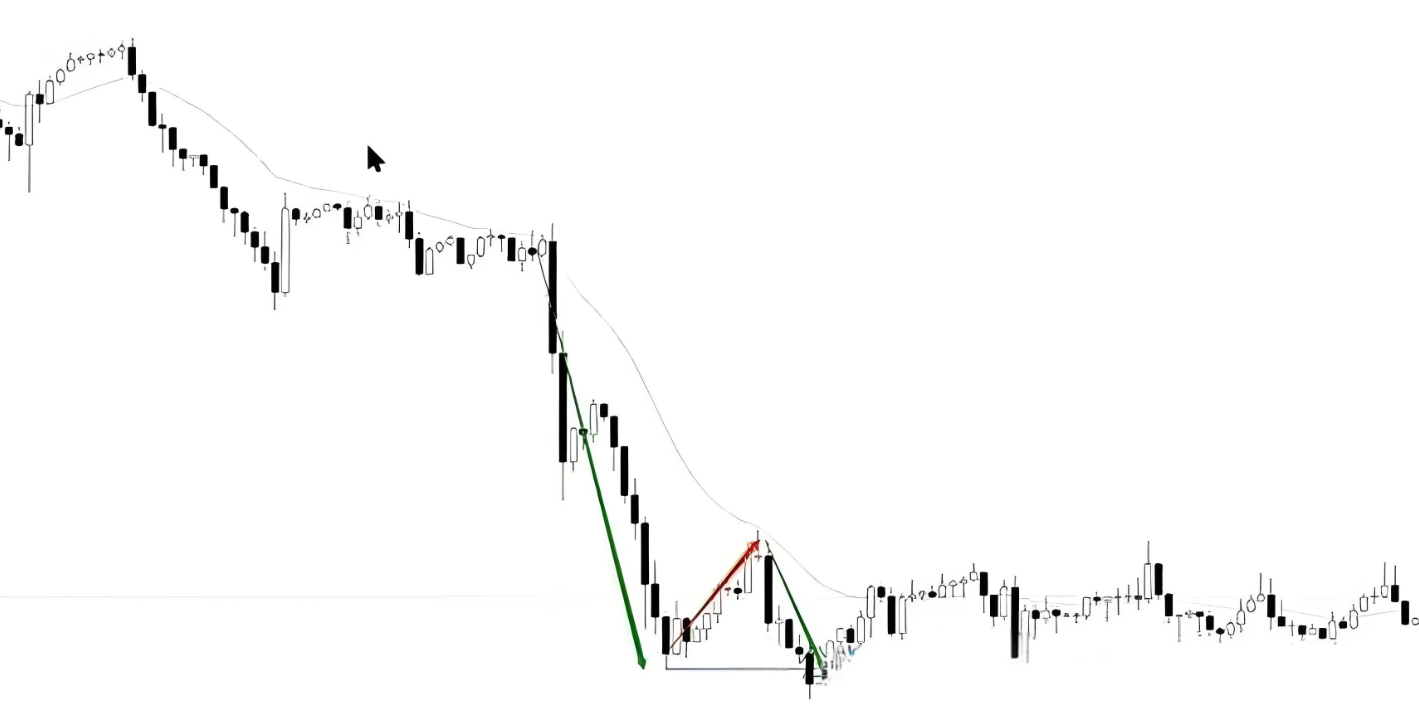
This is also an adjustment after a strong decline. After a simple pullback, the downtrend continues, but this continuation is also weak. Although the price slightly broke through the previous wave low, it quickly returned to its original position.
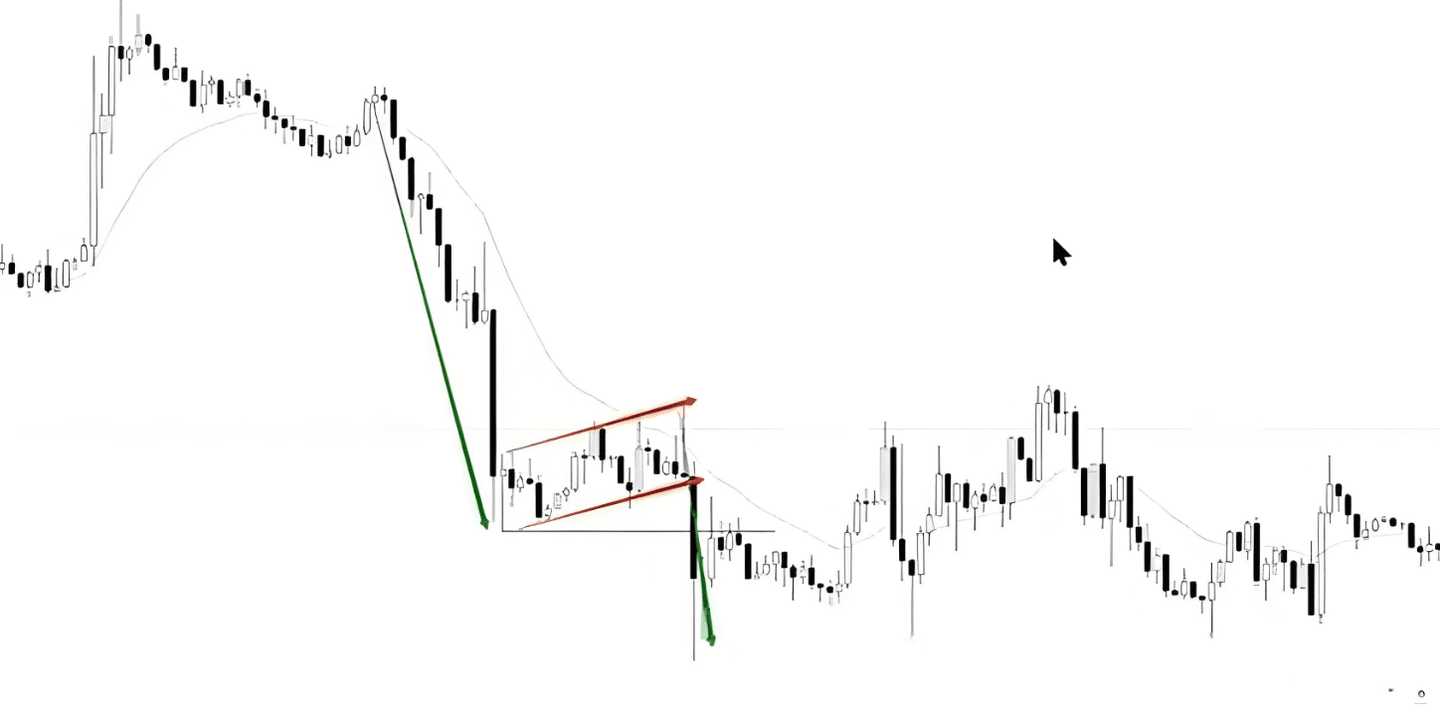
Third case
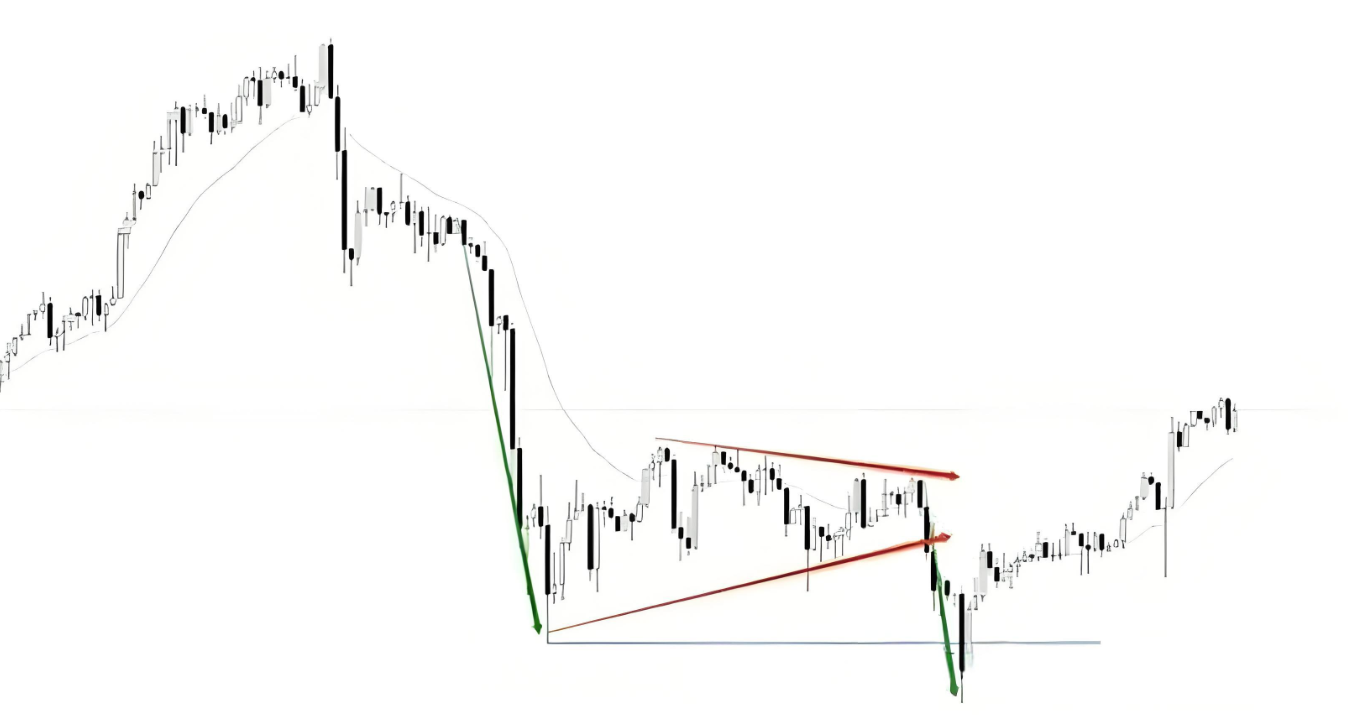
This declining wave formed a complex adjustment similar to a converging pattern. After breaking the adjustment pattern, the downtrend continued and broke through the extreme values of the original trend, entering the low points of the previous wave. However, after the breakout failed, the price retraced, which may indicate a future reversal trend.
Fourth case
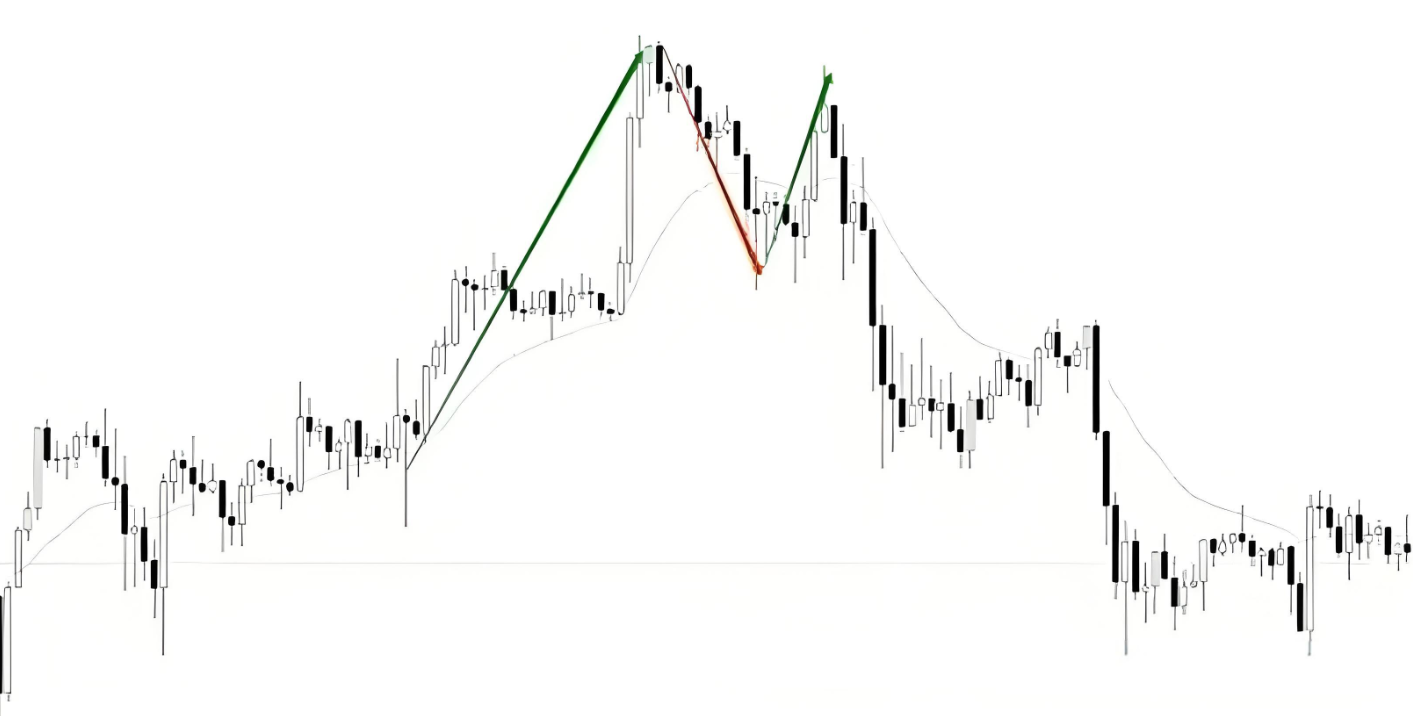
Pullbacks in the upward trend, followed by a continuation of the original upward trend. However, this rise is relatively weak, and it did not even exceed the previous wave high. This pattern also fits the definition of terminal cycling, as all final pushes that lead the trend are referred to as terminal flags.
Understanding terminal flags, you can view it in conjunction with the pattern of 'rapid market turning into channel adjustment, then back to rapid'. 'Rapid - Channel - Rapid' is a manifestation of energy exhaustion.
All reversals should have terminal flags
Some friends may have noticed that according to this definition, all reversal patterns should have terminal cycling. That's right; after all, trends will experience pullbacks during their development, and such pullbacks can all be referred to as terminal flags. You can look for any trend reversal case and observe whether it fits this definition.
Some friends may have realized that the so-called terminal flag is actually a false breakout caused by insufficient trend energy. Indeed, the definition of terminal flags is quite broad, and many patterns may not be suitable for actual trading.
For example, in this case, although it fits the definition of a terminal flag, it does not provide an ideal entry logic.
If we operate according to major trend reversals, it may be easier. Therefore, we should focus on false breakouts, which will make trading simpler.
Since it is a false breakout in the trend direction, I believe I do not need to elaborate on the principle of terminal flags.
All false breakouts refer to the lack of follow-through power after the breakout. Since trend pullbacks should benefit the breakout in the trend direction, many participants will enter the market at the breakout. However, when the breakout in the trend direction fails, these participants may no longer enter and choose to close their positions. The result is weakened trend energy, and the market may face significant pullbacks, trading ranges, or even trend reversals.
The reversal patterns we often refer to, such as breaking the top and breaking the bottom, are standard terminal flag reversals.
Other cases
Let's showcase a few easily tradable terminal flag cases.
These are all standard false breakouts, so trading them is relatively clear. The details of the exit strategy will not be elaborated here, as the two patterns introduced in this video - the peak reversal and the terminal flag - are both difficult to master. Especially the terminal flag, which I hardly use in actual trading, thus I do not recommend beginners try it directly.
We previously discussed the entry strategy for false breakouts. You can treat these terminal flags as false breakouts, which simplifies things a lot. The main purpose of understanding terminal flags is to accept the multiplicity of price movements.
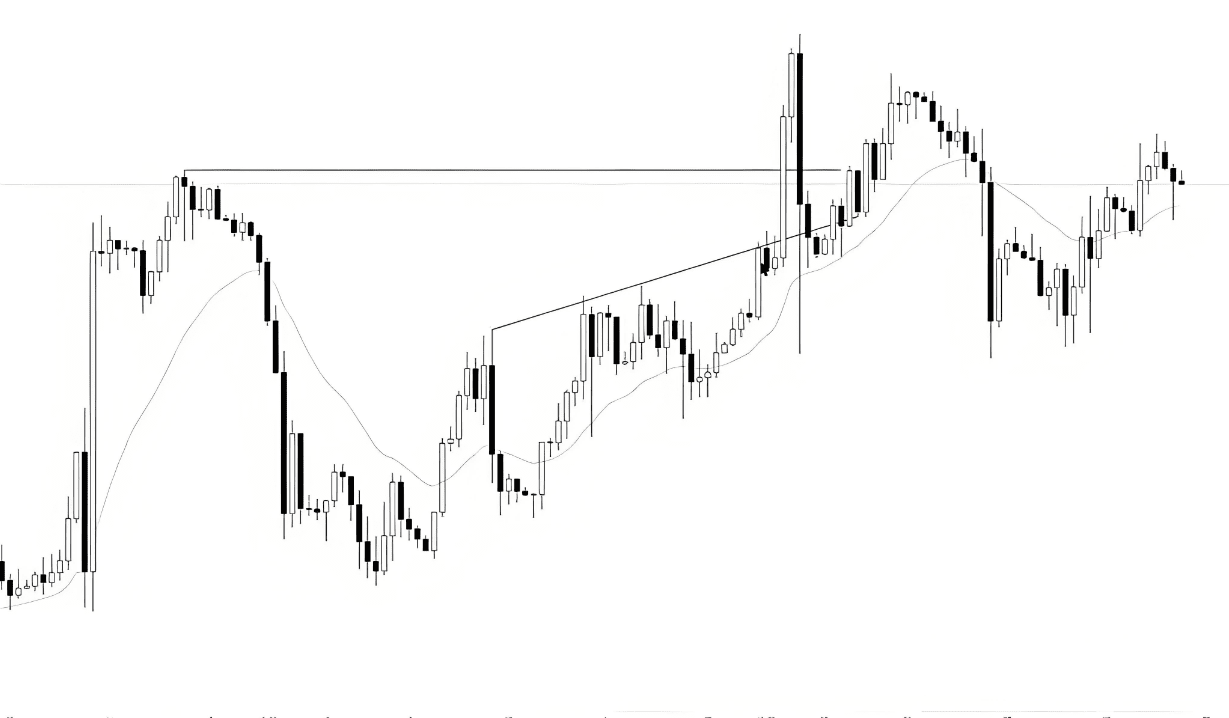
In this case, there was indeed a clear strong trend before, and now it has entered a range adjustment, which is also quite standard.
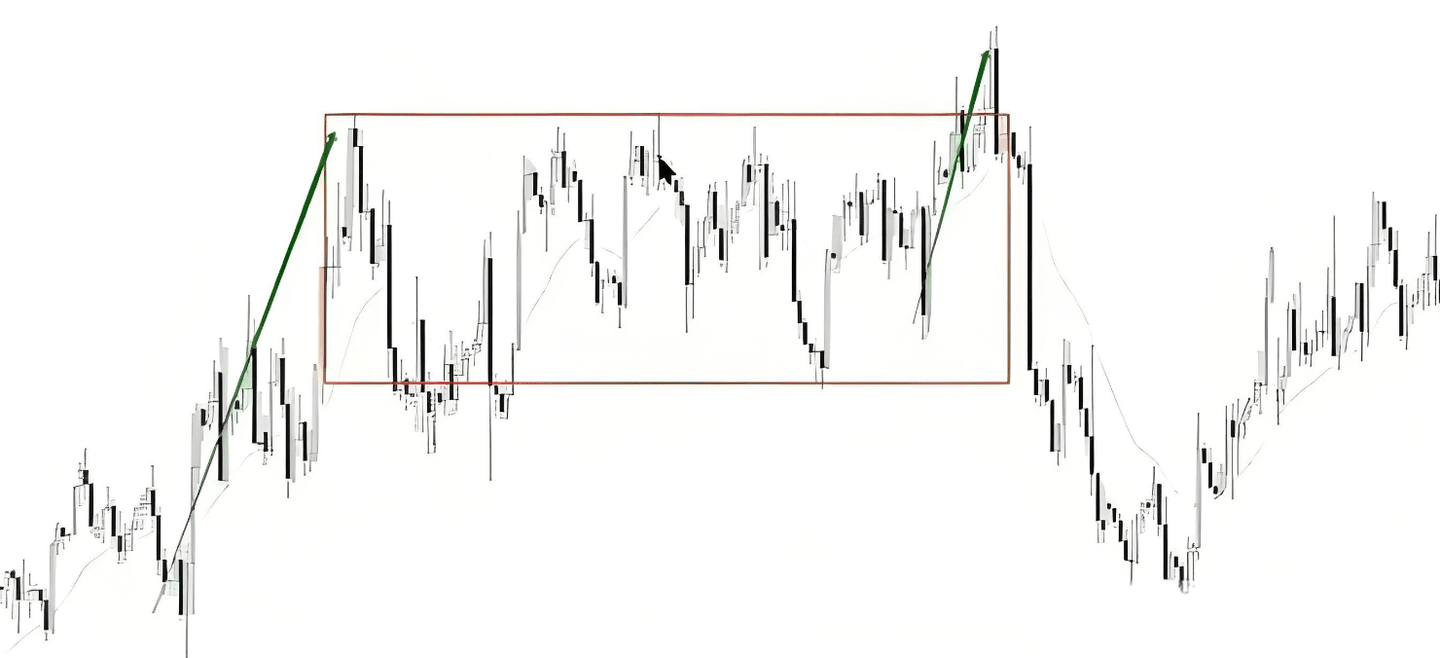
When the range breaks upward, many people will participate in going long, expecting the previous bullish trend to continue; this logic is not problematic. However, if a false breakout occurs after the upward break, and the price returns to the range, novice traders may feel confused because the previous trend was strong, and the adjustment pattern was good; why did it not rise after breaking upward?
Understanding the trends of terminal flags and peak reversals can help us adjust our views on the market in a timely manner when trends encounter problems. This way, we can timely exit or maintain focus, manage our orders properly, thus avoiding significant losses or liquidation.
The above is the trading experience shared by Yan An today. Many times, you lose many opportunities to make money due to your doubts. If you do not dare to try boldly, to engage, to understand, how can you know the pros and cons? You must take the first step to understand how to proceed next. A cup of warm tea, a piece of advice, I am both a teacher and a friendly conversationalist.
Fate brings us together, knowing each other is a separation. I firmly believe that fate leads to meeting across thousands of miles, and separation is destiny. The journey of investment is long; a moment's gains or losses are just the tip of the iceberg. Remember that even the wisest can miss, and even the unwise can gain; regardless of emotions, time will not stop for you. Pick up the troubles in your heart, stand up again, and move forward.
The martial arts secrets have been given to you; whether you can become famous in the martial arts world depends on yourself.
These methods must be saved, and those who find them useful can share them with more cryptocurrency traders around them. Follow me to learn more cryptocurrency insights. Having been through the rain, I am willing to hold an umbrella for the chives! Follow me, and let us walk together on the road of cryptocurrency!