
#w
w
7.3M views
8,825 Discussing
Hot
Latest

·
--
⚔️ $ZRO vs $W: which one wins?
🔹 $ZRO: LayerZero is omnichain messaging with configurable security. Total supply is 1B.
🔹 $W: Wormhole is cross-chain messaging secured by a guardian network. Total supply is 10B.
📊 ZRO lets apps choose their security setup. W relies on a guardian set.
⚠️ Cross-chain protocols are hack targets and face token unlocks.
$ZRO or $W? 👇
Not financial advice. DYOR.
#ZRO #W #Binance
⚔️ $ZRO vs $W : which one wins?
🔹 $ZRO : LayerZero is omnichain messaging with configurable security. Total supply is 1B.
🔹 $W : Wormhole is cross-chain messaging secured by a guardian network. Total supply is 10B.
📊 ZRO lets apps choose their security setup. W relies on a guardian set.
⚠️ Cross-chain protocols are hack targets and face token unlocks.
$ZRO or $W ? 👇
Not financial advice. DYOR.
#ZRO #W #Binance
🔹 $ZRO : LayerZero is omnichain messaging with configurable security. Total supply is 1B.
🔹 $W : Wormhole is cross-chain messaging secured by a guardian network. Total supply is 10B.
📊 ZRO lets apps choose their security setup. W relies on a guardian set.
⚠️ Cross-chain protocols are hack targets and face token unlocks.
$ZRO or $W ? 👇
Not financial advice. DYOR.
#ZRO #W #Binance

1
366

·
--
$W has one level that matters right now at $0.01196
That ceiling sits 6.4 percent above current spot near $0.01124
A clean hourly close through that pocket opens up some real room
Otherwise failure sends it drifting back toward $0.01064 support
Open $W and set an alert at that level
Break or reject? 👀
#W #PriceAction
$W has one level that matters right now at $0.01196
That ceiling sits 6.4 percent above current spot near $0.01124
A clean hourly close through that pocket opens up some real room
Otherwise failure sends it drifting back toward $0.01064 support
Open $W and set an alert at that level
Break or reject? 👀
#W #PriceAction
That ceiling sits 6.4 percent above current spot near $0.01124
A clean hourly close through that pocket opens up some real room
Otherwise failure sends it drifting back toward $0.01064 support
Open $W and set an alert at that level
Break or reject? 👀
#W #PriceAction
3

·
--
$wusdt SHORT
WUSDT is trading near $0.01127 with 4H momentum remaining neutral to bearish and price below key moving averages. A rejection near $0.01140 could push toward $0.01080 before entry confirm selling volume and bearish candle closure.
Entry $0.01125–$0.01140
TP 1 $0.01100
TP2 $0.01070
TP3 $0.01030
SL. $0.01165
#w
$wusdt SHORT
WUSDT is trading near $0.01127 with 4H momentum remaining neutral to bearish and price below key moving averages. A rejection near $0.01140 could push toward $0.01080 before entry confirm selling volume and bearish candle closure.
Entry $0.01125–$0.01140
TP 1 $0.01100
TP2 $0.01070
TP3 $0.01030
SL. $0.01165
#w
WUSDT is trading near $0.01127 with 4H momentum remaining neutral to bearish and price below key moving averages. A rejection near $0.01140 could push toward $0.01080 before entry confirm selling volume and bearish candle closure.
Entry $0.01125–$0.01140
TP 1 $0.01100
TP2 $0.01070
TP3 $0.01030
SL. $0.01165
#w
1
314
·
--
$W volume is 1.5x its weekly average. Most traders stare at the price and miss the real story
Traders see $W up 2.1 percent at $0.01122 and think the move is weak
That changes when you look at the $1.2M daily volume compared to the 7 day baseline
A move on low volume is just noise that fades out before it reaches the 7 day high of $0.01280
A move on high volume means actual participants are stepping in
To check this ratio in 20 seconds divide today volume by the 7 day average shown on your exchange
Look for volume spikes during the swing between the 24h low of $0.01057 and the high of $0.01154
Never trust a breakout if the volume bar is smaller than the average line next to it
What is your favorite volume indicator to spot fake breakouts
#W #TradingTips
$W volume is 1.5x its weekly average. Most traders stare at the price and miss the real story
Traders see $W up 2.1 percent at $0.01122 and think the move is weak
That changes when you look at the $1.2M daily volume compared to the 7 day baseline
A move on low volume is just noise that fades out before it reaches the 7 day high of $0.01280
A move on high volume means actual participants are stepping in
To check this ratio in 20 seconds divide today volume by the 7 day average shown on your exchange
Look for volume spikes during the swing between the 24h low of $0.01057 and the high of $0.01154
Never trust a breakout if the volume bar is smaller than the average line next to it
What is your favorite volume indicator to spot fake breakouts
#W #TradingTips
Traders see $W up 2.1 percent at $0.01122 and think the move is weak
That changes when you look at the $1.2M daily volume compared to the 7 day baseline
A move on low volume is just noise that fades out before it reaches the 7 day high of $0.01280
A move on high volume means actual participants are stepping in
To check this ratio in 20 seconds divide today volume by the 7 day average shown on your exchange
Look for volume spikes during the swing between the 24h low of $0.01057 and the high of $0.01154
Never trust a breakout if the volume bar is smaller than the average line next to it
What is your favorite volume indicator to spot fake breakouts
#W #TradingTips
13

·
--
Bullish
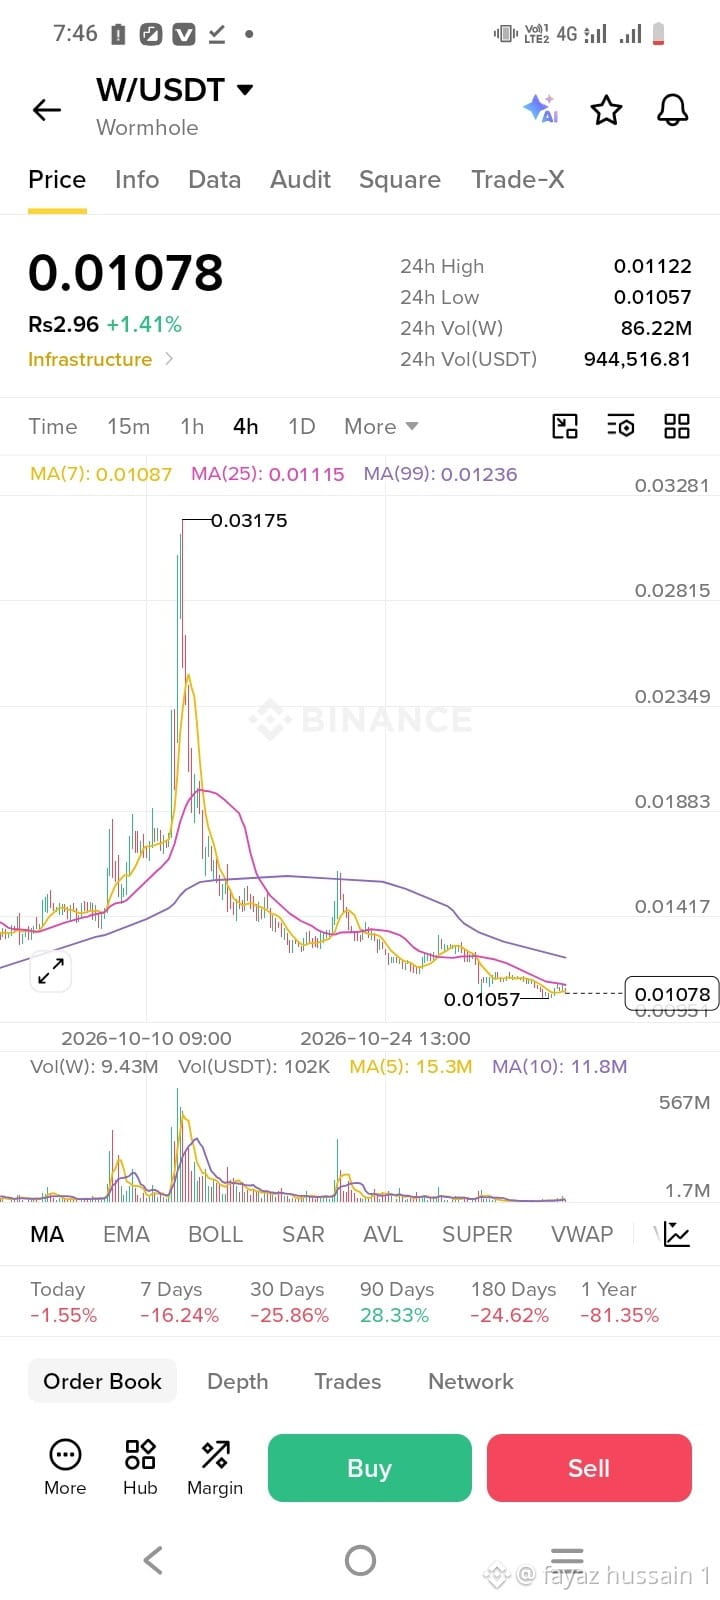
$W this token price 1.6$ in year of 2024 and now 0.01$ 😲
160x down token what is next move w token in this bull run ?
#w
{spot}(WUSDT)
$W this token price 1.6$ in year of 2024 and now 0.01$ 😲
160x down token what is next move w token in this bull run ?
#w
160x down token what is next move w token in this bull run ?
#w
12

·
--
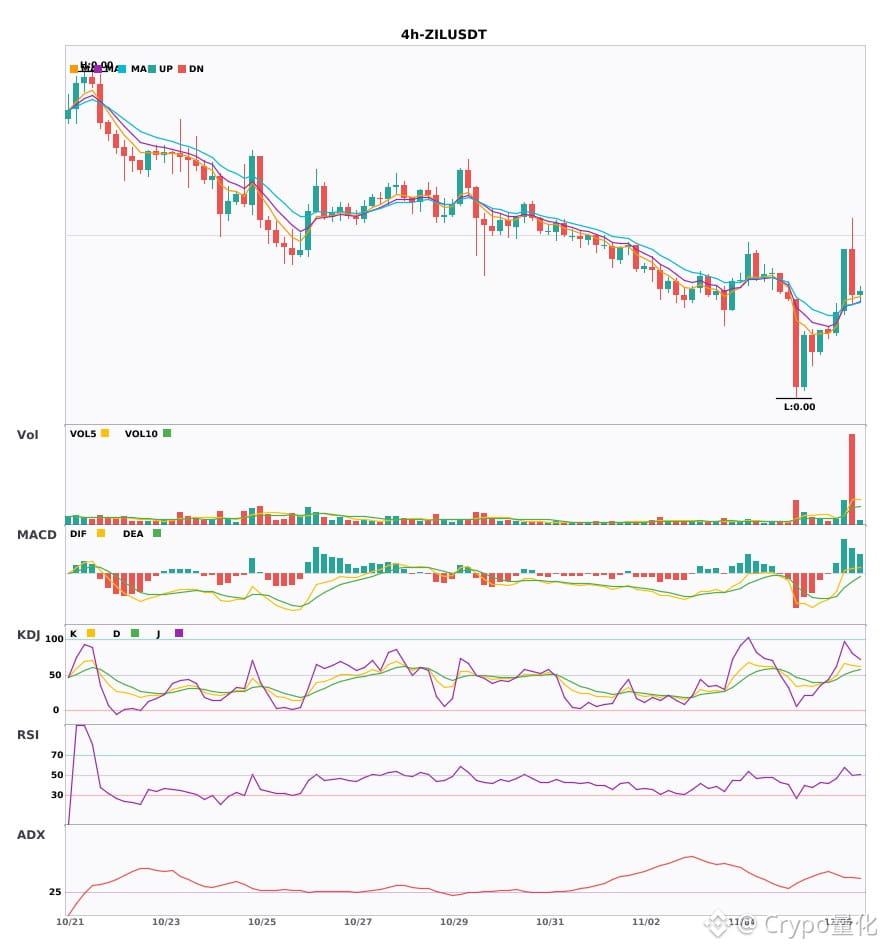
Two 4-hour bullish signals appeared simultaneously: $W / $ZIL🔥
════════════════════
🔴 $W 4-hour bullish signal
⚠️Technical analysis: ADX(33) indicates a clear trend | MACD is bullish, with a strong trend and increasing momentum | EMA5 > EMA8 > EMA13, bullish alignment | KDJ is strong, with bulls in control (K: 71.5, D: 58.1) | Volume surge (2.6x)
════════════════════
🔴 $ZIL 4-hour bullish signal
⚠️Technical analysis: ADX(43) indicates a clear trend | MACD DIF breaks above the zero line, signaling a bullish trend reversal | EMA5 crosses above EMA8, turning bullish in the short term | KDJ is strong, with bulls in control (K: 66.5, D: 51.0) | Volume surge (2.7x)
════════════════════
🔔 Follow for firsthand market movement alerts 🔔
#技术分析 #W #ZIL
📌 When trading, watch for confirming candlestick patterns
Two 4-hour bullish signals appeared simultaneously: $W / $ZIL 🔥
════════════════════
🔴 $W 4-hour bullish signal
⚠️Technical analysis: ADX(33) indicates a clear trend | MACD is bullish, with a strong trend and increasing momentum | EMA5 > EMA8 > EMA13, bullish alignment | KDJ is strong, with bulls in control (K: 71.5, D: 58.1) | Volume surge (2.6x)
════════════════════
🔴 $ZIL 4-hour bullish signal
⚠️Technical analysis: ADX(43) indicates a clear trend | MACD DIF breaks above the zero line, signaling a bullish trend reversal | EMA5 crosses above EMA8, turning bullish in the short term | KDJ is strong, with bulls in control (K: 66.5, D: 51.0) | Volume surge (2.7x)
════════════════════
🔔 Follow for firsthand market movement alerts 🔔
#技术分析 #W #ZIL
📌 When trading, watch for confirming candlestick patterns
════════════════════
🔴 $W 4-hour bullish signal
⚠️Technical analysis: ADX(33) indicates a clear trend | MACD is bullish, with a strong trend and increasing momentum | EMA5 > EMA8 > EMA13, bullish alignment | KDJ is strong, with bulls in control (K: 71.5, D: 58.1) | Volume surge (2.6x)
════════════════════
🔴 $ZIL 4-hour bullish signal
⚠️Technical analysis: ADX(43) indicates a clear trend | MACD DIF breaks above the zero line, signaling a bullish trend reversal | EMA5 crosses above EMA8, turning bullish in the short term | KDJ is strong, with bulls in control (K: 66.5, D: 51.0) | Volume surge (2.7x)
════════════════════
🔔 Follow for firsthand market movement alerts 🔔
#技术分析 #W #ZIL
📌 When trading, watch for confirming candlestick patterns
4
·
--
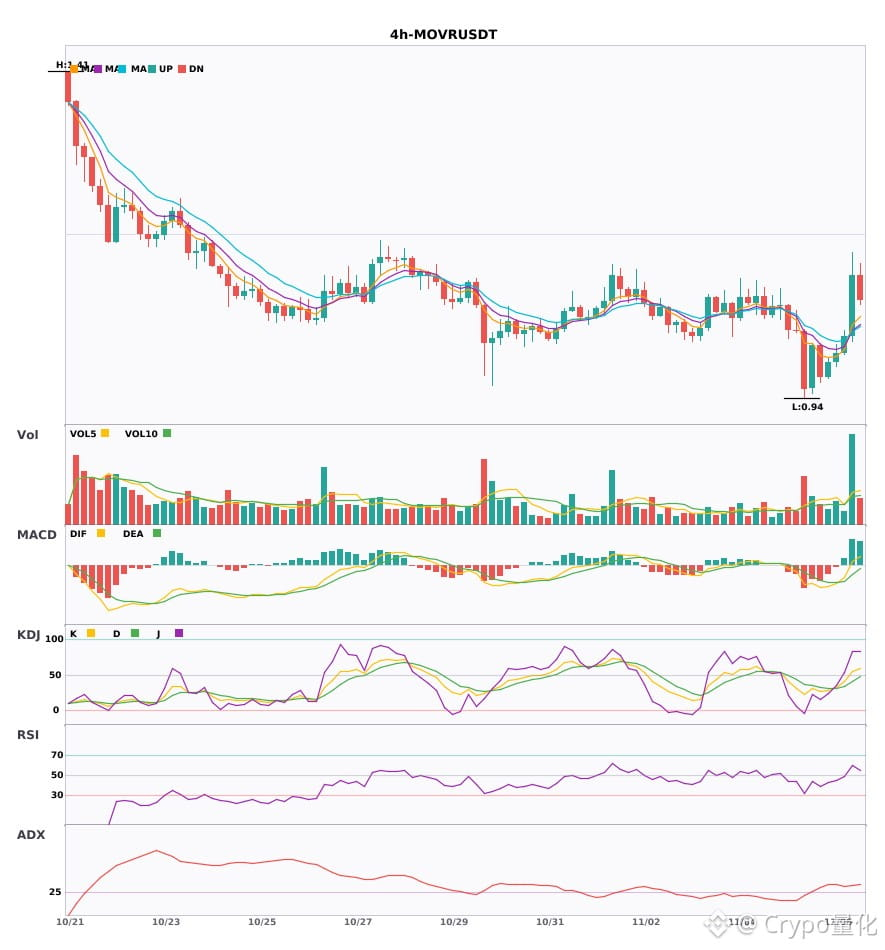
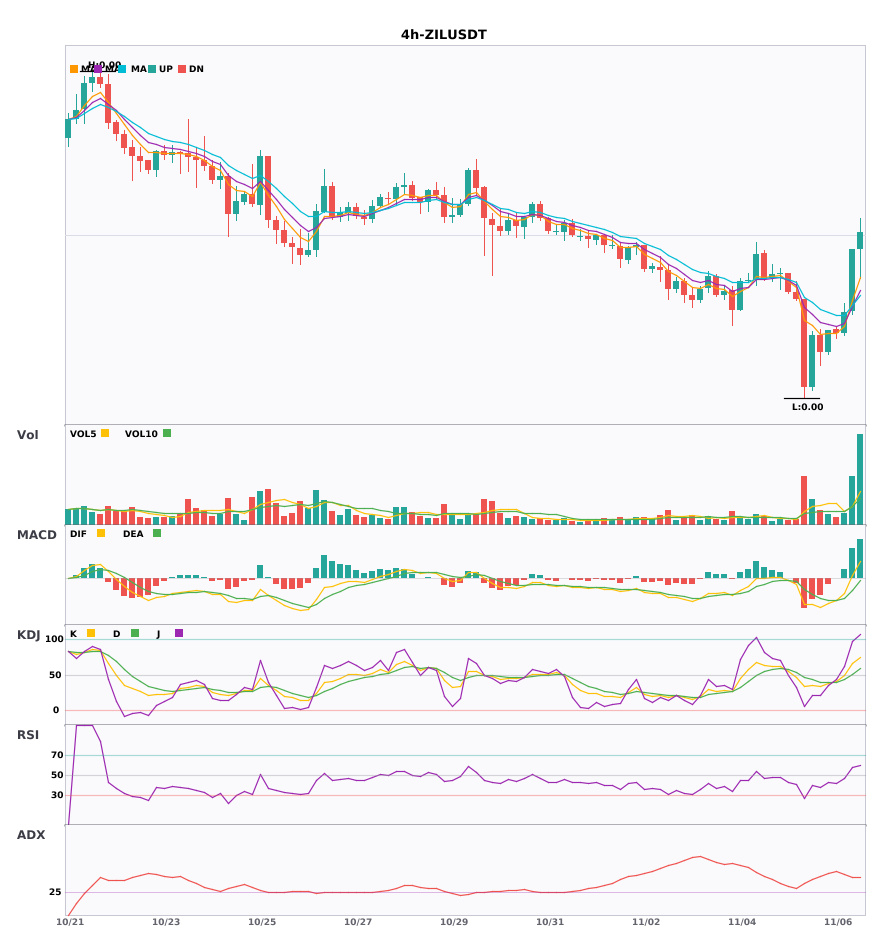
Three 4-hour bullish signals appeared at the same time: $MOVR / $W / $ZIL🔥
════════════════════
🔴 $MOVR 4-hour bullish signal
⚠️Technical analysis: ADX(36) indicates a clear trending market | MACD DIF breaks above zero, signaling a bullish trend | EMA5 crosses above EMA8, turning bullish in the short term | Volume surge (3.2x)
════════════════════
🔴 $W 4-hour bullish signal
⚠️Technical analysis: ADX(33) indicates a clear trending market | MACD is bullish, with a strong trend and increasing momentum | EMA5 > EMA8 > EMA13, in bullish alignment | KDJ is strong, with bulls in control (K: 71.5, D: 58.1) | Volume surge (2.6x)
════════════════════
🔴 $ZIL 4-hour bullish signal
⚠️Technical analysis: ADX(43) indicates a clear trending market | MACD DIF breaks above zero, signaling a bullish trend | EMA5 crosses above EMA8, turning bullish in the short term | KDJ is strong, with bulls in control (K: 66.5, D: 51.0) | Volume surge (2.7x)
════════════════════
🔔 Follow for first-hand market movement updates 🔔
#技术分析 #MOVR #W #ZIL
📌 When trading, pay attention to whether the candlestick patterns align
Three 4-hour bullish signals appeared at the same time: $MOVR / $W / $ZIL 🔥
════════════════════
🔴 $MOVR 4-hour bullish signal
⚠️Technical analysis: ADX(36) indicates a clear trending market | MACD DIF breaks above zero, signaling a bullish trend | EMA5 crosses above EMA8, turning bullish in the short term | Volume surge (3.2x)
════════════════════
🔴 $W 4-hour bullish signal
⚠️Technical analysis: ADX(33) indicates a clear trending market | MACD is bullish, with a strong trend and increasing momentum | EMA5 > EMA8 > EMA13, in bullish alignment | KDJ is strong, with bulls in control (K: 71.5, D: 58.1) | Volume surge (2.6x)
════════════════════
🔴 $ZIL 4-hour bullish signal
⚠️Technical analysis: ADX(43) indicates a clear trending market | MACD DIF breaks above zero, signaling a bullish trend | EMA5 crosses above EMA8, turning bullish in the short term | KDJ is strong, with bulls in control (K: 66.5, D: 51.0) | Volume surge (2.7x)
════════════════════
🔔 Follow for first-hand market movement updates 🔔
#技术分析 #MOVR #W #ZIL
📌 When trading, pay attention to whether the candlestick patterns align
════════════════════
🔴 $MOVR 4-hour bullish signal
⚠️Technical analysis: ADX(36) indicates a clear trending market | MACD DIF breaks above zero, signaling a bullish trend | EMA5 crosses above EMA8, turning bullish in the short term | Volume surge (3.2x)
════════════════════
🔴 $W 4-hour bullish signal
⚠️Technical analysis: ADX(33) indicates a clear trending market | MACD is bullish, with a strong trend and increasing momentum | EMA5 > EMA8 > EMA13, in bullish alignment | KDJ is strong, with bulls in control (K: 71.5, D: 58.1) | Volume surge (2.6x)
════════════════════
🔴 $ZIL 4-hour bullish signal
⚠️Technical analysis: ADX(43) indicates a clear trending market | MACD DIF breaks above zero, signaling a bullish trend | EMA5 crosses above EMA8, turning bullish in the short term | KDJ is strong, with bulls in control (K: 66.5, D: 51.0) | Volume surge (2.7x)
════════════════════
🔔 Follow for first-hand market movement updates 🔔
#技术分析 #MOVR #W #ZIL
📌 When trading, pay attention to whether the candlestick patterns align
13

·
--
🐋 $W hit a new 24-hour high, with very active buying.
Current price: 0.0116, above the previous high of 0.01144; 24-hour trading volume: $1.83 million.
Short stop-losses are often clustered near new highs, so holding above this level could trigger a short squeeze. But beware of a spike followed by a pullback.
#W
🐋 $W hit a new 24-hour high, with very active buying.
Current price: 0.0116, above the previous high of 0.01144; 24-hour trading volume: $1.83 million.
Short stop-losses are often clustered near new highs, so holding above this level could trigger a short squeeze. But beware of a spike followed by a pullback.
#W
Current price: 0.0116, above the previous high of 0.01144; 24-hour trading volume: $1.83 million.
Short stop-losses are often clustered near new highs, so holding above this level could trigger a short squeeze. But beware of a spike followed by a pullback.
#W
4

·
--
💪 $W hit a new 24-hour high of 0.0116, breaking past the previous high of 0.01144.
I just checked the market—it's all in the green. Whether this rally can go further depends on whether the volume holds up. Have you gotten in?
#W
For reference only. Trade at your own risk.
💪 $W hit a new 24-hour high of 0.0116, breaking past the previous high of 0.01144.
I just checked the market—it's all in the green. Whether this rally can go further depends on whether the volume holds up. Have you gotten in?
#W
For reference only. Trade at your own risk.
I just checked the market—it's all in the green. Whether this rally can go further depends on whether the volume holds up. Have you gotten in?
#W
For reference only. Trade at your own risk.
6

·
--
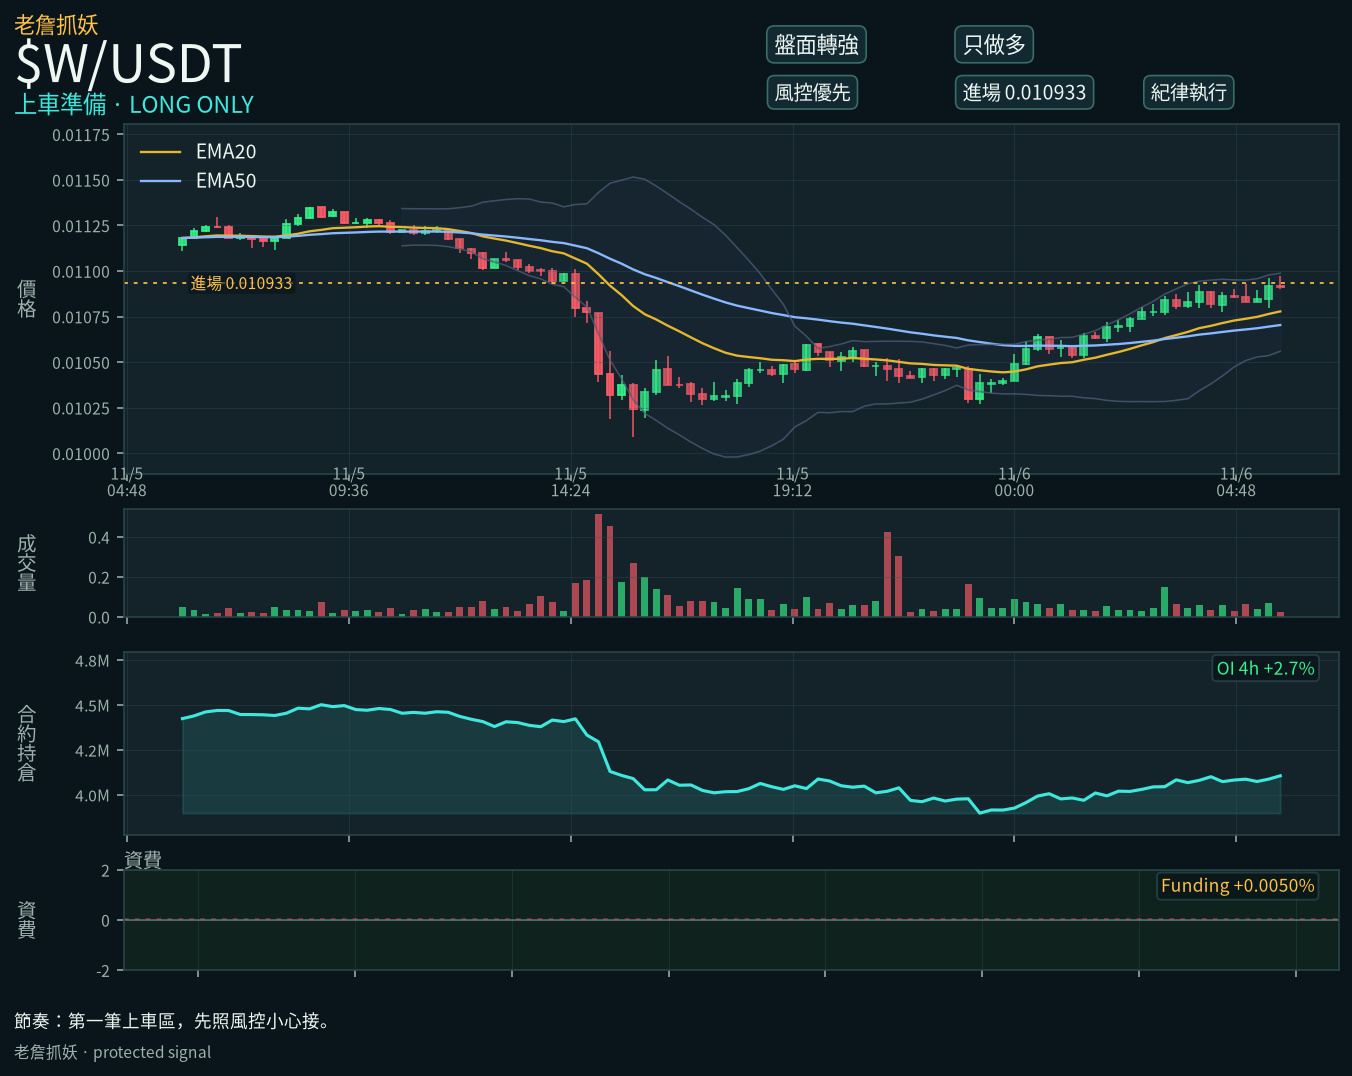
$W: Starting from a low, getting ready to get in. But the broader market is weak, so it could be dragged down.
My approach: The broader market is weak, so I’m cutting my position in half. Stop-loss at 0.009293, first target at 0.01203; take 30% off when it gets there.
#W #妖幣 #Contract
Not investment advice. Manage your own position.
$W : Starting from a low, getting ready to get in. But the broader market is weak, so it could be dragged down.
My approach: The broader market is weak, so I’m cutting my position in half. Stop-loss at 0.009293, first target at 0.01203; take 30% off when it gets there.
#W #妖幣 #Contract
Not investment advice. Manage your own position.
My approach: The broader market is weak, so I’m cutting my position in half. Stop-loss at 0.009293, first target at 0.01203; take 30% off when it gets there.
#W #妖幣 #Contract
Not investment advice. Manage your own position.
58

·
--
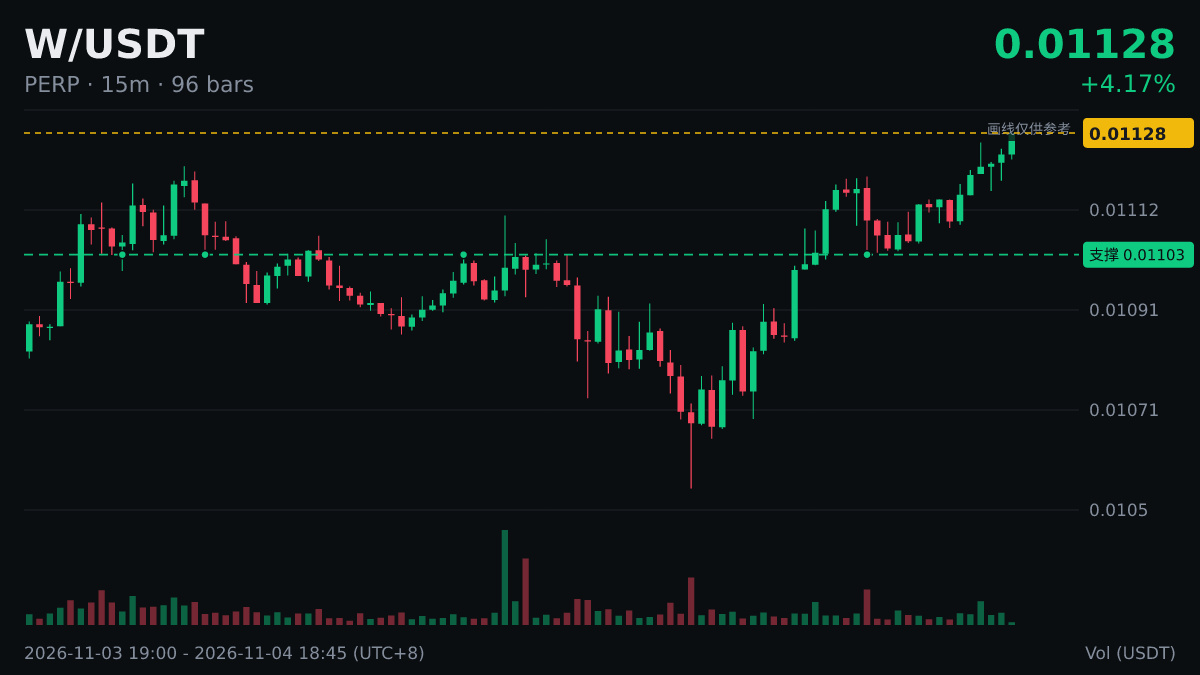
🆙 $W sets a new 24-hour high of 0.01129, breaking above the previous high of 0.01121.
This candlestick chart looks good. Bulls have the upper hand, but watch out for a wick-driven shakeout. Keep an eye on whether trading volume can keep up.
#W
This does not constitute investment advice. You assume all risks.
🆙 $W sets a new 24-hour high of 0.01129, breaking above the previous high of 0.01121.
This candlestick chart looks good. Bulls have the upper hand, but watch out for a wick-driven shakeout. Keep an eye on whether trading volume can keep up.
#W
This does not constitute investment advice. You assume all risks.
This candlestick chart looks good. Bulls have the upper hand, but watch out for a wick-driven shakeout. Keep an eye on whether trading volume can keep up.
#W
This does not constitute investment advice. You assume all risks.
125

$W 30The 30-minute timeframe is leaning bullish; key indicators confirm
📈 $W | 30-minute bullish signal
━━━━━━━━━━━━━━━━━━
Technical analysis: ADX(26) trend is forming; participation is possible | MACD DIF breaks above the zero line, trend turns bullish | EMA5 crosses above EMA8, short-term outlook turns bullish | KDJ is weak, bears have the upper hand (K is 49.0, D is 38.6) | Volume surge (4.4x)
Price change: 0.6300%
━━━━━━━━━━━━━━━━━━
#技术分析 #W
📌 The above content is for reference only and does not constitute investment advice
$W 30The 30-minute timeframe is leaning bullish; key indicators confirm
📈 $W | 30-minute bullish signal
━━━━━━━━━━━━━━━━━━
Technical analysis: ADX(26) trend is forming; participation is possible | MACD DIF breaks above the zero line, trend turns bullish | EMA5 crosses above EMA8, short-term outlook turns bullish | KDJ is weak, bears have the upper hand (K is 49.0, D is 38.6) | Volume surge (4.4x)
Price change: 0.6300%
━━━━━━━━━━━━━━━━━━
#技术分析 #W
📌 The above content is for reference only and does not constitute investment advice
📈 $W | 30-minute bullish signal
━━━━━━━━━━━━━━━━━━
Technical analysis: ADX(26) trend is forming; participation is possible | MACD DIF breaks above the zero line, trend turns bullish | EMA5 crosses above EMA8, short-term outlook turns bullish | KDJ is weak, bears have the upper hand (K is 49.0, D is 38.6) | Volume surge (4.4x)
Price change: 0.6300%
━━━━━━━━━━━━━━━━━━
#技术分析 #W
📌 The above content is for reference only and does not constitute investment advice
4
·
--
$W 30 Bullish signal on the 30-minute timeframe 🔥
════════════════════
🔴 $W 30 30-minute bullish signal
⚠️ Technical analysis: ADX (26): trend is forming, potential entry | MACD DIF breaks above the zero line, trend turns bullish | EMA5 crosses above EMA8, short-term trend turns bullish | KDJ is weak, bears have the upper hand (K: 49.0, D: 38.6) | Volume surge (4.4x)
════════════════════
🔔 Follow for first-hand market updates 🔔
#技术分析 #W
📌 When trading, pay attention to whether the candlestick pattern confirms the signal
$W 30 Bullish signal on the 30-minute timeframe 🔥
════════════════════
🔴 $W 30 30-minute bullish signal
⚠️ Technical analysis: ADX (26): trend is forming, potential entry | MACD DIF breaks above the zero line, trend turns bullish | EMA5 crosses above EMA8, short-term trend turns bullish | KDJ is weak, bears have the upper hand (K: 49.0, D: 38.6) | Volume surge (4.4x)
════════════════════
🔔 Follow for first-hand market updates 🔔
#技术分析 #W
📌 When trading, pay attention to whether the candlestick pattern confirms the signal
════════════════════
🔴 $W 30 30-minute bullish signal
⚠️ Technical analysis: ADX (26): trend is forming, potential entry | MACD DIF breaks above the zero line, trend turns bullish | EMA5 crosses above EMA8, short-term trend turns bullish | KDJ is weak, bears have the upper hand (K: 49.0, D: 38.6) | Volume surge (4.4x)
════════════════════
🔔 Follow for first-hand market updates 🔔
#技术分析 #W
📌 When trading, pay attention to whether the candlestick pattern confirms the signal
2
·
--
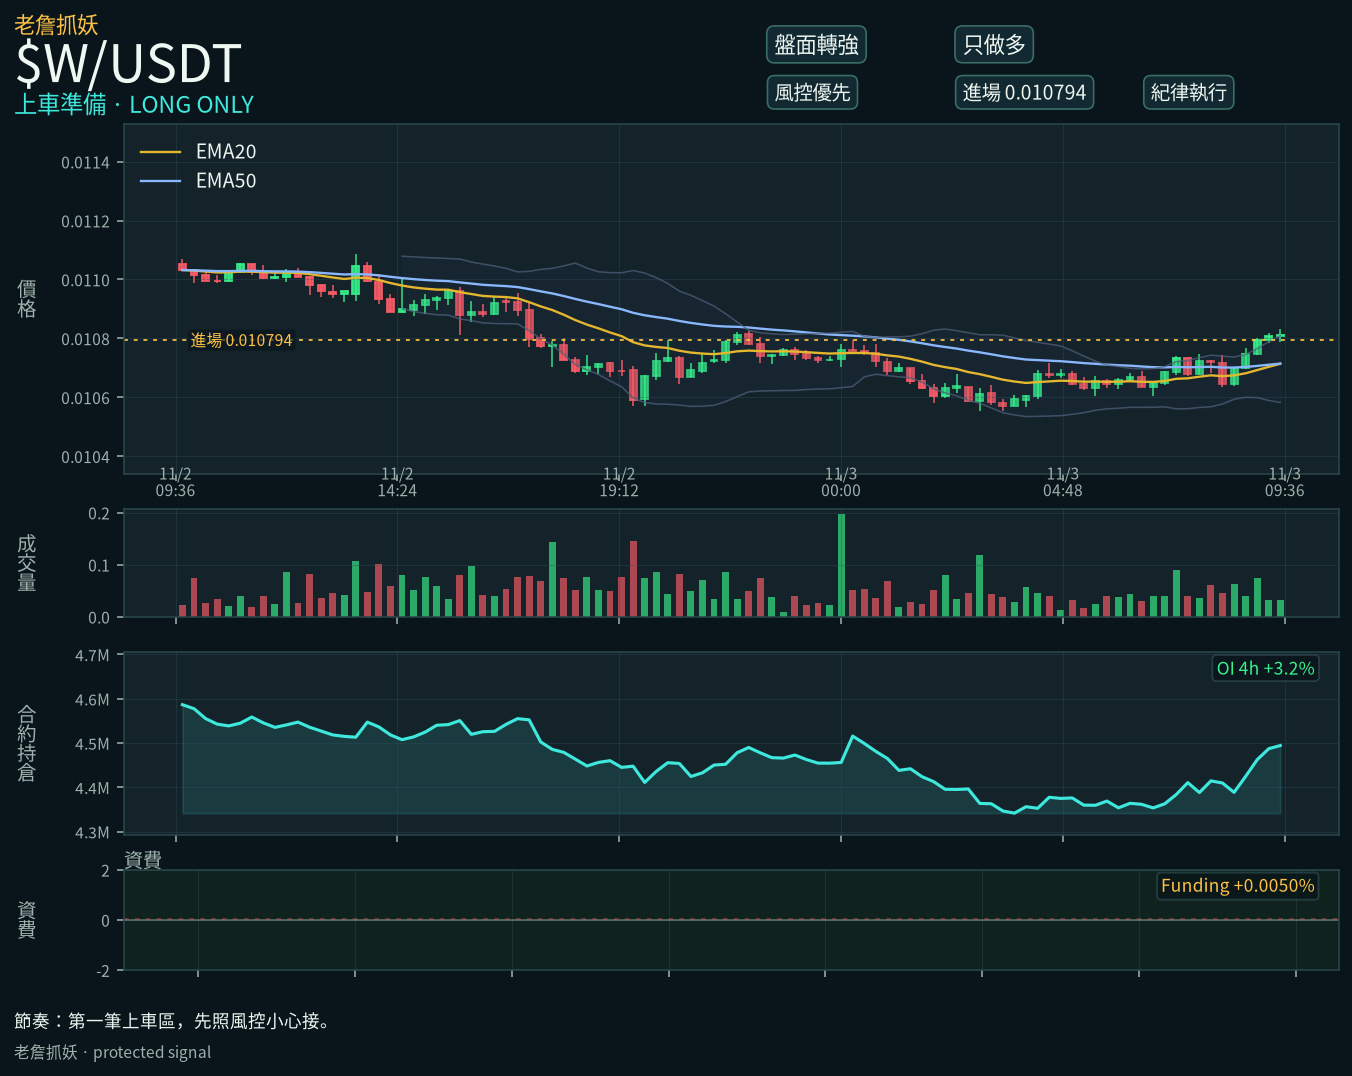
$W It’s starting from a low level here, and I’m getting ready to get in. But the broader market is weak, so it could get dragged down.
My approach: With the broader market weak, cut the position size in half. Stop loss at 0.009175; first target at 0.01187. Take 30% off when it gets there.
#W #妖幣 #Contract
Keep your position size under control and set a stop loss.
$W It’s starting from a low level here, and I’m getting ready to get in. But the broader market is weak, so it could get dragged down.
My approach: With the broader market weak, cut the position size in half. Stop loss at 0.009175; first target at 0.01187. Take 30% off when it gets there.
#W #妖幣 #Contract
Keep your position size under control and set a stop loss.
My approach: With the broader market weak, cut the position size in half. Stop loss at 0.009175; first target at 0.01187. Take 30% off when it gets there.
#W #妖幣 #Contract
Keep your position size under control and set a stop loss.
33

⚡ $W IGNITES EXPLOSIVE BREAKOUT AFTER ABSORBING ACCUMULATION BASE LIQUIDITY! 💥
Entry: 0.00932 - 0.00945 ⚡
Target: 0.00960 - 0.01000 🚀
Stop Loss: 0.00918 ⚠️
Aggressive buyers just sliced through the 0.00920–0.00925 consolidation shelf with heavy 1H bid pressure. 📊 As long as bulls defend the 0.00930 flip zone on minor pullbacks, the expansion phase remains fully intact.
Order flow is shifting fast as floating supply gets absorbed right above the base level. 💡 Holding this key reclaim opens up a clean highway directly toward the 0.01000 psychological liquidity pool. 💭 Are you positioning on this base reclaim or waiting to buy the high-volume breakout later? 👇
⚠️ Not financial advice. Always manage your risk. 🛡️
🏷️ #W #LongSetup #Breakout #Crypto
🔥 ⚡
⚡ $W IGNITES EXPLOSIVE BREAKOUT AFTER ABSORBING ACCUMULATION BASE LIQUIDITY! 💥
Entry: 0.00932 - 0.00945 ⚡
Target: 0.00960 - 0.01000 🚀
Stop Loss: 0.00918 ⚠️
Aggressive buyers just sliced through the 0.00920–0.00925 consolidation shelf with heavy 1H bid pressure. 📊 As long as bulls defend the 0.00930 flip zone on minor pullbacks, the expansion phase remains fully intact.
Order flow is shifting fast as floating supply gets absorbed right above the base level. 💡 Holding this key reclaim opens up a clean highway directly toward the 0.01000 psychological liquidity pool. 💭 Are you positioning on this base reclaim or waiting to buy the high-volume breakout later? 👇
⚠️ Not financial advice. Always manage your risk. 🛡️
🏷️ #W #LongSetup #Breakout #Crypto
🔥 ⚡
Entry: 0.00932 - 0.00945 ⚡
Target: 0.00960 - 0.01000 🚀
Stop Loss: 0.00918 ⚠️
Aggressive buyers just sliced through the 0.00920–0.00925 consolidation shelf with heavy 1H bid pressure. 📊 As long as bulls defend the 0.00930 flip zone on minor pullbacks, the expansion phase remains fully intact.
Order flow is shifting fast as floating supply gets absorbed right above the base level. 💡 Holding this key reclaim opens up a clean highway directly toward the 0.01000 psychological liquidity pool. 💭 Are you positioning on this base reclaim or waiting to buy the high-volume breakout later? 👇
⚠️ Not financial advice. Always manage your risk. 🛡️
🏷️ #W #LongSetup #Breakout #Crypto
🔥 ⚡
25
·
--
$W is sitting at $0.01218 today and I am passing entirely
Volume is dead at half of normal and $1.1M total means you get trapped instantly 📉
Trading thin books on a 5.9 percent drop is how accounts bleed
I need an hourly close above $0.01303 before I care
Or I want a clean test holding $0.01205 to show buyers are alive
It could bounce without me and missing a move hurts less than getting stuck
Chasing $W here, or waiting for 0.01205
#W #RiskManagement
$W is sitting at $0.01218 today and I am passing entirely
Volume is dead at half of normal and $1.1M total means you get trapped instantly 📉
Trading thin books on a 5.9 percent drop is how accounts bleed
I need an hourly close above $0.01303 before I care
Or I want a clean test holding $0.01205 to show buyers are alive
It could bounce without me and missing a move hurts less than getting stuck
Chasing $W here, or waiting for 0.01205
#W #RiskManagement
Volume is dead at half of normal and $1.1M total means you get trapped instantly 📉
Trading thin books on a 5.9 percent drop is how accounts bleed
I need an hourly close above $0.01303 before I care
Or I want a clean test holding $0.01205 to show buyers are alive
It could bounce without me and missing a move hurts less than getting stuck
Chasing $W here, or waiting for 0.01205
#W #RiskManagement
33

·
--
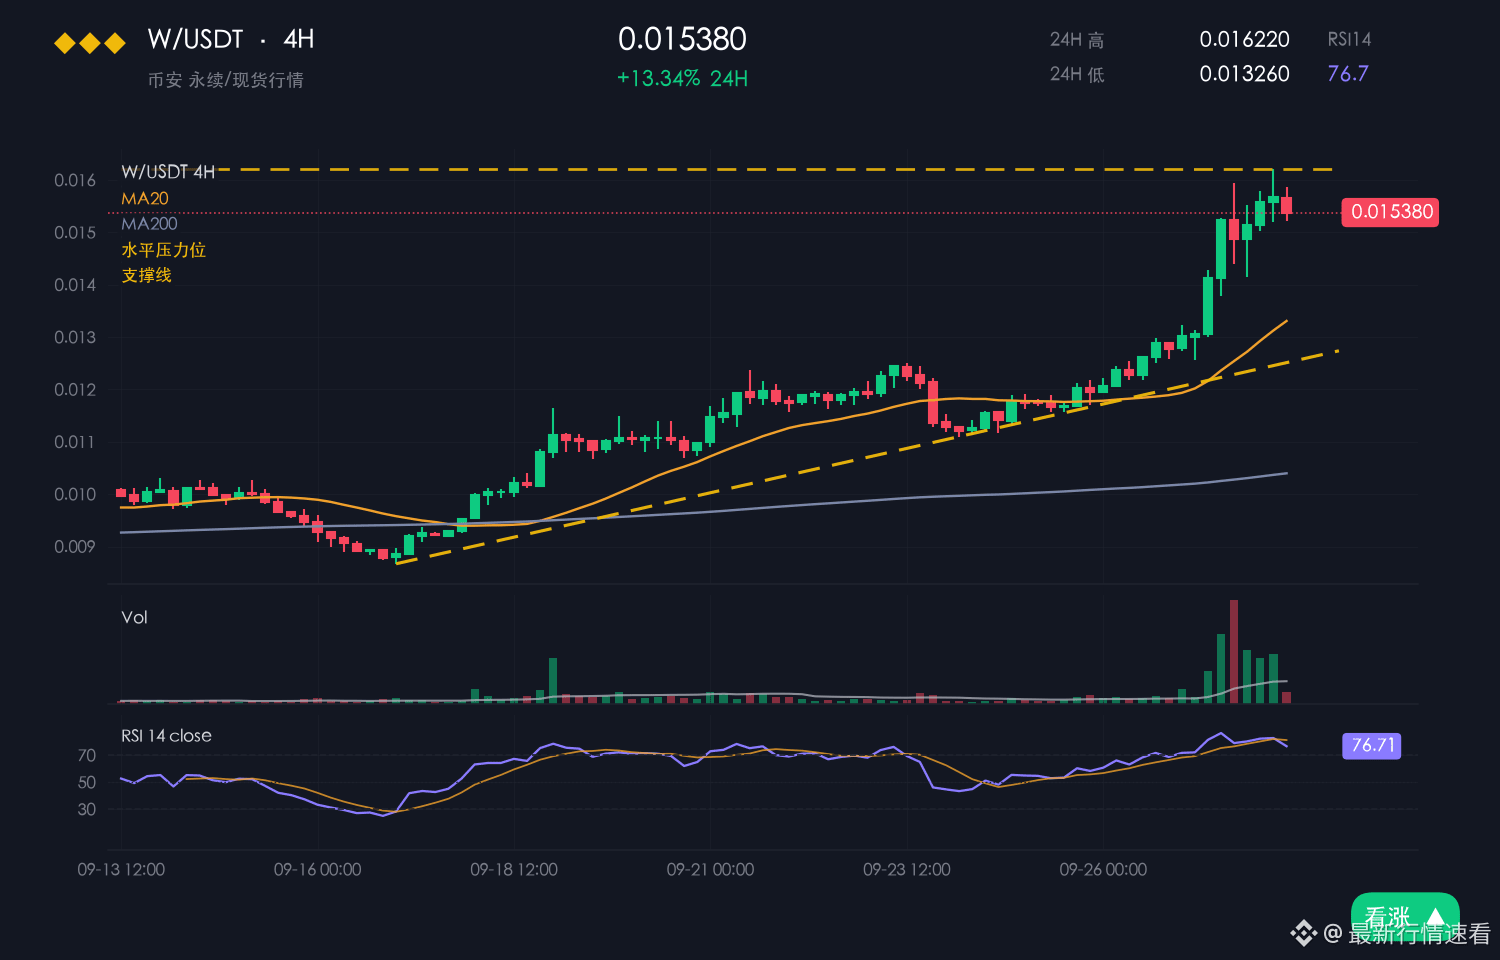
W is currently at 0.0129, up 6.89% in 24 hours, but still down 1.30% over 7 days. The intraday range is 0.0120–0.0130, with an amplitude of 8.7%.
【Market Overview】
Quite a few people have been asking whether W is worth watching right now, so here’s a quick take.
First, a basic point: the intraday range of 0.0120–0.0130 is public information; it wasn’t drawn by anyone.
The center of gravity of the last few 4-hour candlesticks has been steadily rising, showing fairly clear signs of bullish control.
The price has retested 0.0120 several times without breaking below it, and buying support on pullbacks has been decisive.
Compared with BTC’s -0.18%, W is showing relative strength. Assets like this are often at the forefront of a rebound.
【Macro Outlook】 U.S. stocks rose overnight: Nasdaq +0.82%, S&P 500 +0.70% (close on 2026-10-27). BTC ETFs saw net outflows of about $45.2 billion this month. U.S. CPI came in at 3.7% year over year, above expectations. The probability of a rate hike at the 2026-10-27/28 policy meeting is about 47%.
The short-term outlook leans bullish.
【Bullish Case】
What’s the most important thing? The 0.0120 level. That level gives us a range, and the range gives us a rhythm.
It’s still down 1.30% over 7 days, so a single-day gain of 6.89% should be viewed as an oversold bounce for now. Don’t rush to call it a reversal.
A rhythm of buying support on pullbacks and strong volume on upward moves is more sustainable than a one-way rally.
Take it slow; no need to rush.
Fast gains also mean fast pullbacks, so leaving some room in your position is more comfortable than going all in.
$W #W
W is currently at 0.0129, up 6.89% in 24 hours, but still down 1.30% over 7 days. The intraday range is 0.0120–0.0130, with an amplitude of 8.7%.
【Market Overview】
Quite a few people have been asking whether W is worth watching right now, so here’s a quick take.
First, a basic point: the intraday range of 0.0120–0.0130 is public information; it wasn’t drawn by anyone.
The center of gravity of the last few 4-hour candlesticks has been steadily rising, showing fairly clear signs of bullish control.
The price has retested 0.0120 several times without breaking below it, and buying support on pullbacks has been decisive.
Compared with BTC’s -0.18%, W is showing relative strength. Assets like this are often at the forefront of a rebound.
【Macro Outlook】 U.S. stocks rose overnight: Nasdaq +0.82%, S&P 500 +0.70% (close on 2026-10-27). BTC ETFs saw net outflows of about $45.2 billion this month. U.S. CPI came in at 3.7% year over year, above expectations. The probability of a rate hike at the 2026-10-27/28 policy meeting is about 47%.
The short-term outlook leans bullish.
【Bullish Case】
What’s the most important thing? The 0.0120 level. That level gives us a range, and the range gives us a rhythm.
It’s still down 1.30% over 7 days, so a single-day gain of 6.89% should be viewed as an oversold bounce for now. Don’t rush to call it a reversal.
A rhythm of buying support on pullbacks and strong volume on upward moves is more sustainable than a one-way rally.
Take it slow; no need to rush.
Fast gains also mean fast pullbacks, so leaving some room in your position is more comfortable than going all in.
$W #W
【Market Overview】
Quite a few people have been asking whether W is worth watching right now, so here’s a quick take.
First, a basic point: the intraday range of 0.0120–0.0130 is public information; it wasn’t drawn by anyone.
The center of gravity of the last few 4-hour candlesticks has been steadily rising, showing fairly clear signs of bullish control.
The price has retested 0.0120 several times without breaking below it, and buying support on pullbacks has been decisive.
Compared with BTC’s -0.18%, W is showing relative strength. Assets like this are often at the forefront of a rebound.
【Macro Outlook】 U.S. stocks rose overnight: Nasdaq +0.82%, S&P 500 +0.70% (close on 2026-10-27). BTC ETFs saw net outflows of about $45.2 billion this month. U.S. CPI came in at 3.7% year over year, above expectations. The probability of a rate hike at the 2026-10-27/28 policy meeting is about 47%.
The short-term outlook leans bullish.
【Bullish Case】
What’s the most important thing? The 0.0120 level. That level gives us a range, and the range gives us a rhythm.
It’s still down 1.30% over 7 days, so a single-day gain of 6.89% should be viewed as an oversold bounce for now. Don’t rush to call it a reversal.
A rhythm of buying support on pullbacks and strong volume on upward moves is more sustainable than a one-way rally.
Take it slow; no need to rush.
Fast gains also mean fast pullbacks, so leaving some room in your position is more comfortable than going all in.
$W #W
25

·
--
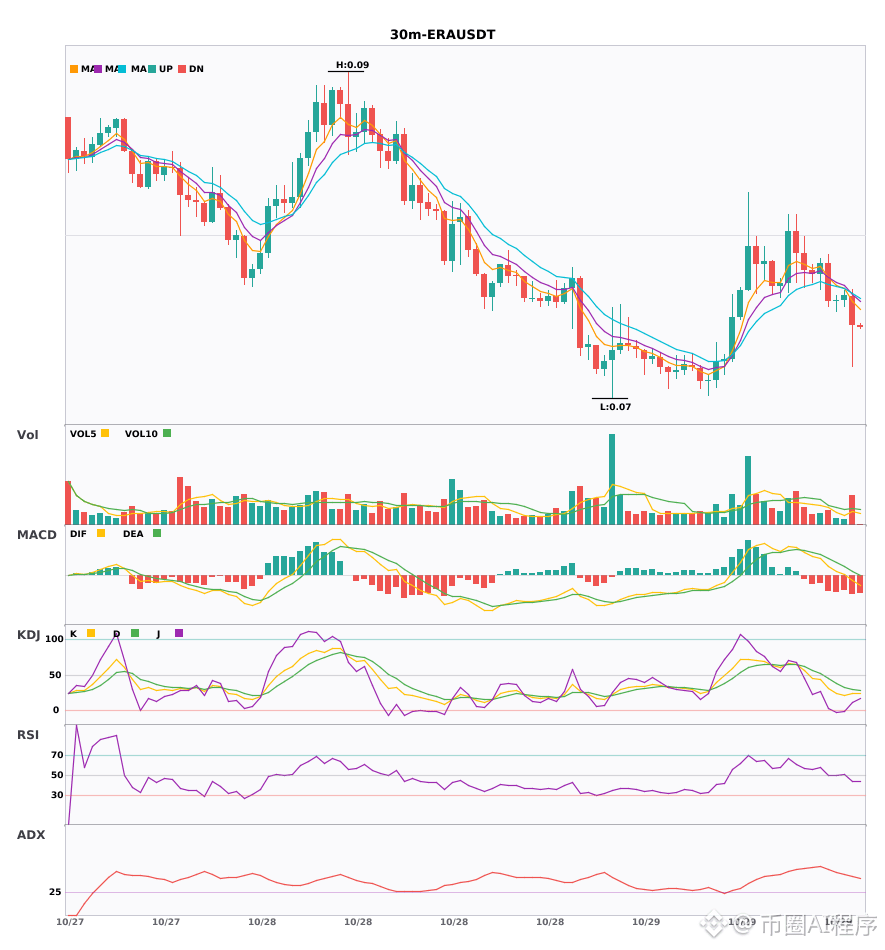
$ERA / $W 30-minute shorts + 4-hour shorts aligned, multi-timeframe confluence turns bearish 🔥
════════════════════
🟢 $ERA 30-minute short signal
⚠️ Technical analysis: 4-hour bearish confluence confirmed | 30-minute entry: MACDDIF breaks below the zero line, trend turns bearish | EMA5 < EMA8 < EMA13, bearish alignment | KDJ trending weakly, bears in control (K = 23.4, D = 29.5) | Volume increased (1.7x)
════════════════════
🟢 $W 30-minute short signal
⚠️ Technical analysis: 4-hour bearish confluence confirmed | 30-minute entry: MACDDIF breaks below the zero line, trend turns bearish | EMA5 < EMA8 < EMA13, bearish alignment | KDJ trending weakly, bears in control (K = 33.0, D = 45.6) | Volume normal (1.3x)
════════════════════
🔔 Follow for first-hand market updates 🔔
#多周期共振 #ERA #W
📌 When trading, pay attention to whether the candlestick pattern meets the criteria
$ERA / $W 30-minute shorts + 4-hour shorts aligned, multi-timeframe confluence turns bearish 🔥
════════════════════
🟢 $ERA 30-minute short signal
⚠️ Technical analysis: 4-hour bearish confluence confirmed | 30-minute entry: MACDDIF breaks below the zero line, trend turns bearish | EMA5 < EMA8 < EMA13, bearish alignment | KDJ trending weakly, bears in control (K = 23.4, D = 29.5) | Volume increased (1.7x)
════════════════════
🟢 $W 30-minute short signal
⚠️ Technical analysis: 4-hour bearish confluence confirmed | 30-minute entry: MACDDIF breaks below the zero line, trend turns bearish | EMA5 < EMA8 < EMA13, bearish alignment | KDJ trending weakly, bears in control (K = 33.0, D = 45.6) | Volume normal (1.3x)
════════════════════
🔔 Follow for first-hand market updates 🔔
#多周期共振 #ERA #W
📌 When trading, pay attention to whether the candlestick pattern meets the criteria
════════════════════
🟢 $ERA 30-minute short signal
⚠️ Technical analysis: 4-hour bearish confluence confirmed | 30-minute entry: MACDDIF breaks below the zero line, trend turns bearish | EMA5 < EMA8 < EMA13, bearish alignment | KDJ trending weakly, bears in control (K = 23.4, D = 29.5) | Volume increased (1.7x)
════════════════════
🟢 $W 30-minute short signal
⚠️ Technical analysis: 4-hour bearish confluence confirmed | 30-minute entry: MACDDIF breaks below the zero line, trend turns bearish | EMA5 < EMA8 < EMA13, bearish alignment | KDJ trending weakly, bears in control (K = 33.0, D = 45.6) | Volume normal (1.3x)
════════════════════
🔔 Follow for first-hand market updates 🔔
#多周期共振 #ERA #W
📌 When trading, pay attention to whether the candlestick pattern meets the criteria
7
·
--
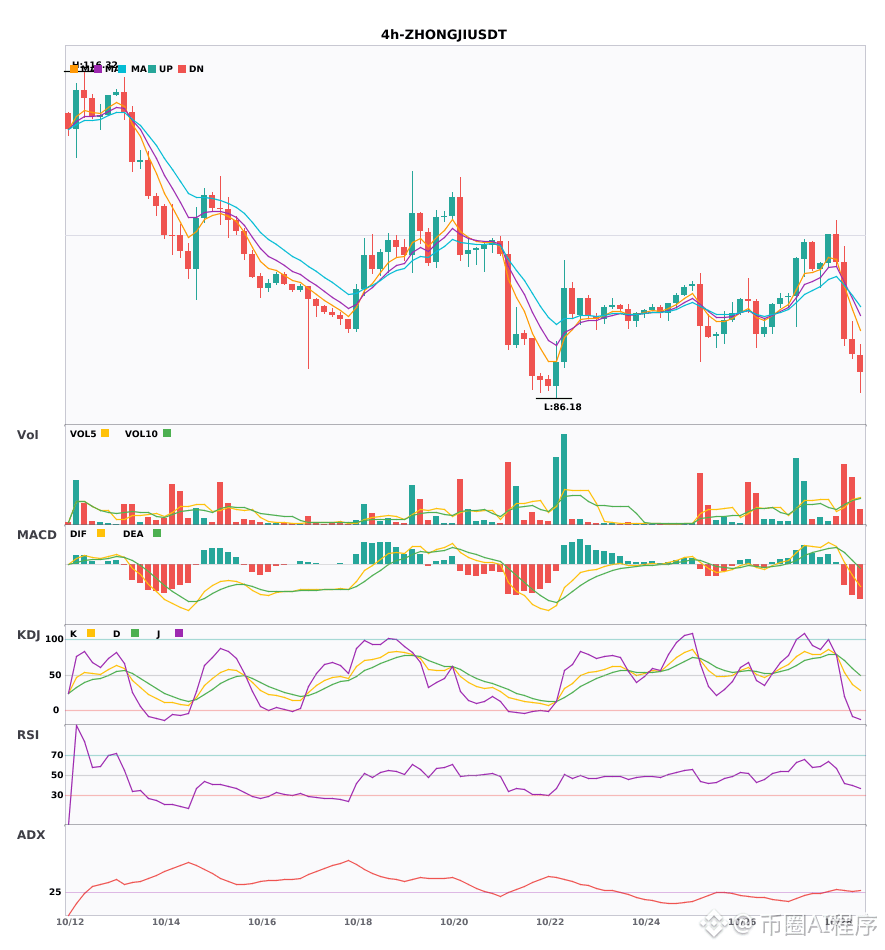
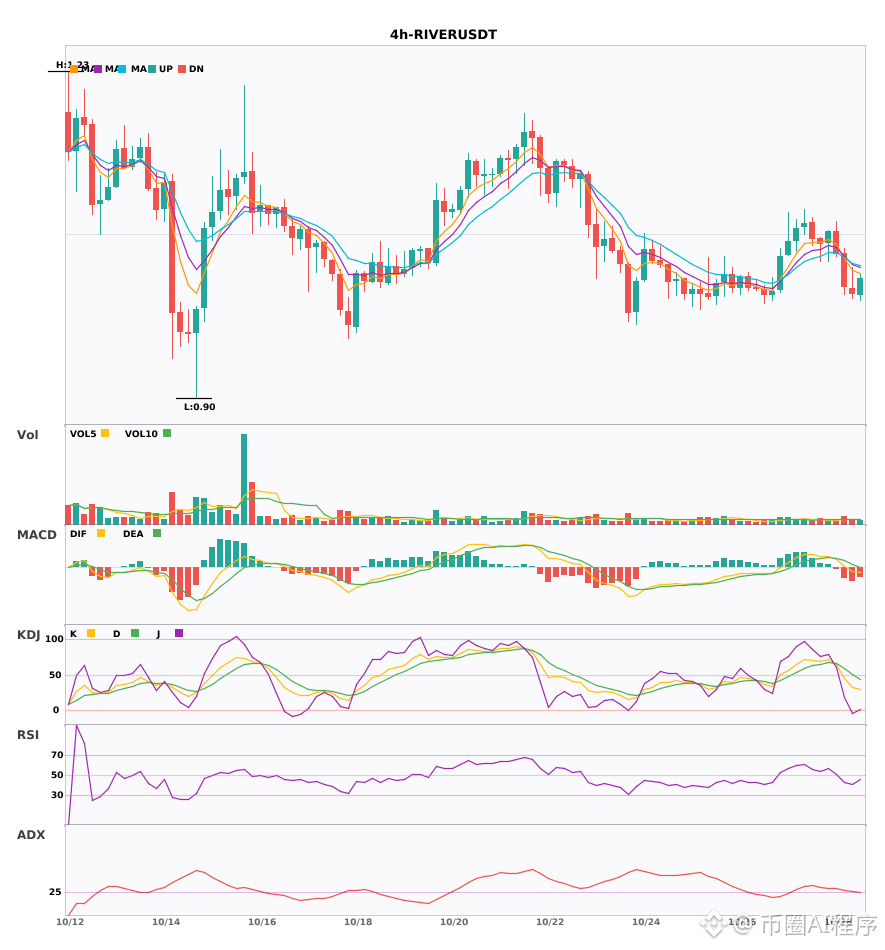
$ZHONGJI / $W / $RIVER 4-hour shorts + daily shorts aligned; multiple timeframes confirm a bearish reversal 🔥
════════════════════
🟢 $ZHONGJI 4-hour bearish signal
⚠️ Technical: Daily bearish alignment confirmed | 4-hour entry: MACD DIF falls below the zero line, trend turns bearish | EMA5 < EMA8 < EMA13, bearish alignment | Volume surge (2.9x)
════════════════════
🟢 $W 4-hour bearish signal
⚠️ Technical: Daily bearish alignment confirmed | 4-hour entry: MACD DIF falls below the zero line, trend turns bearish | EMA5 < EMA8 < EMA13, bearish alignment | KDJ showing weakness, bears in control (K: 28.4, D: 44.2) | Normal volume (1.3x)
════════════════════
🟢 $RIVER 4-hour bearish signal
⚠️ Technical: Daily bearish alignment confirmed | 4-hour entry: MACD DIF falls below the zero line, trend turns bearish | EMA5 < EMA8 < EMA13, bearish alignment | Normal volume (1.5x)
════════════════════
🔔 Follow for first-hand market movement alerts 🔔
#多周期共振 #ZHONGJI #W #RIVER
📌 When trading, pay attention to whether the candlestick pattern is consistent
$ZHONGJI / $W / $RIVER 4-hour shorts + daily shorts aligned; multiple timeframes confirm a bearish reversal 🔥
════════════════════
🟢 $ZHONGJI 4-hour bearish signal
⚠️ Technical: Daily bearish alignment confirmed | 4-hour entry: MACD DIF falls below the zero line, trend turns bearish | EMA5 < EMA8 < EMA13, bearish alignment | Volume surge (2.9x)
════════════════════
🟢 $W 4-hour bearish signal
⚠️ Technical: Daily bearish alignment confirmed | 4-hour entry: MACD DIF falls below the zero line, trend turns bearish | EMA5 < EMA8 < EMA13, bearish alignment | KDJ showing weakness, bears in control (K: 28.4, D: 44.2) | Normal volume (1.3x)
════════════════════
🟢 $RIVER 4-hour bearish signal
⚠️ Technical: Daily bearish alignment confirmed | 4-hour entry: MACD DIF falls below the zero line, trend turns bearish | EMA5 < EMA8 < EMA13, bearish alignment | Normal volume (1.5x)
════════════════════
🔔 Follow for first-hand market movement alerts 🔔
#多周期共振 #ZHONGJI #W #RIVER
📌 When trading, pay attention to whether the candlestick pattern is consistent
════════════════════
🟢 $ZHONGJI 4-hour bearish signal
⚠️ Technical: Daily bearish alignment confirmed | 4-hour entry: MACD DIF falls below the zero line, trend turns bearish | EMA5 < EMA8 < EMA13, bearish alignment | Volume surge (2.9x)
════════════════════
🟢 $W 4-hour bearish signal
⚠️ Technical: Daily bearish alignment confirmed | 4-hour entry: MACD DIF falls below the zero line, trend turns bearish | EMA5 < EMA8 < EMA13, bearish alignment | KDJ showing weakness, bears in control (K: 28.4, D: 44.2) | Normal volume (1.3x)
════════════════════
🟢 $RIVER 4-hour bearish signal
⚠️ Technical: Daily bearish alignment confirmed | 4-hour entry: MACD DIF falls below the zero line, trend turns bearish | EMA5 < EMA8 < EMA13, bearish alignment | Normal volume (1.5x)
════════════════════
🔔 Follow for first-hand market movement alerts 🔔
#多周期共振 #ZHONGJI #W #RIVER
📌 When trading, pay attention to whether the candlestick pattern is consistent
85
·
--
$W volume is 0.5x its weekly average. Here is why that matters more than price
Most traders see a plus 3.1 percent day on $W and think buyers are stepping in
I check the volume ratio first because price can drift on empty air
Right now $W has 1.9M in daily volume while its seven day average is double that
That means half the usual participation is actually trading this move
A green candle on low volume is usually just a lack of sellers rather than real demand
If you want to check this ratio in twenty seconds just look at your volume moving average on the daily chart
Compare today against the past seven bars to see if the crowd is actually here
What volume filter do you use before taking a trade
#W #TradingTips
$W volume is 0.5x its weekly average. Here is why that matters more than price
Most traders see a plus 3.1 percent day on $W and think buyers are stepping in
I check the volume ratio first because price can drift on empty air
Right now $W has 1.9M in daily volume while its seven day average is double that
That means half the usual participation is actually trading this move
A green candle on low volume is usually just a lack of sellers rather than real demand
If you want to check this ratio in twenty seconds just look at your volume moving average on the daily chart
Compare today against the past seven bars to see if the crowd is actually here
What volume filter do you use before taking a trade
#W #TradingTips
Most traders see a plus 3.1 percent day on $W and think buyers are stepping in
I check the volume ratio first because price can drift on empty air
Right now $W has 1.9M in daily volume while its seven day average is double that
That means half the usual participation is actually trading this move
A green candle on low volume is usually just a lack of sellers rather than real demand
If you want to check this ratio in twenty seconds just look at your volume moving average on the daily chart
Compare today against the past seven bars to see if the crowd is actually here
What volume filter do you use before taking a trade
#W #TradingTips
29
Log in to explore more content
Join global crypto users on Binance Square
⚡️ Get latest and useful information about crypto.
💬 Trusted by the world’s largest crypto exchange.
👍 Discover real insights from verified creators.
Email / Phone number
Trending Topics
1
#CPITestsDecemberRateOutlook
0 views
8 Discussing
2
#BitcoinRebounds$75KAsChipsLead
15,144 views
184 Discussing
3
#JobsReportRaisesHikeOdds
173,953 views
1,485 Discussing
4
#US Data Center Rules May Constrain AI Expansion
28,233 views
137 Discussing
5
#WillAnthropicListOnTime
38,685 views
523 Discussing
6
#BitcoinETFsSee$412MNetOutflows
205 views
30 Discussing
7
#HKSFCPlansToRestrictCryptoAndExchangeTerms
2,736 views
109 Discussing
8
#AnthropicStillPlansPreThanksgivingIPO
12,877 views
186 Discussing
9
#FinCENAndFedWithdraw$250CryptoTransferProposal
3,890 views
13 Discussing
10
#TradFiForBeginners
26,998 views
437 Discussing