
#w
w
7.3M views
8,799 Discussing
Hot
Latest

·
--
$W volume is 1.5x its weekly average. Most traders stare at the price and miss the real story
Traders see $W up 2.1 percent at $0.01122 and think the move is weak
That changes when you look at the $1.2M daily volume compared to the 7 day baseline
A move on low volume is just noise that fades out before it reaches the 7 day high of $0.01280
A move on high volume means actual participants are stepping in
To check this ratio in 20 seconds divide today volume by the 7 day average shown on your exchange
Look for volume spikes during the swing between the 24h low of $0.01057 and the high of $0.01154
Never trust a breakout if the volume bar is smaller than the average line next to it
What is your favorite volume indicator to spot fake breakouts
#W #TradingTips
$W volume is 1.5x its weekly average. Most traders stare at the price and miss the real story
Traders see $W up 2.1 percent at $0.01122 and think the move is weak
That changes when you look at the $1.2M daily volume compared to the 7 day baseline
A move on low volume is just noise that fades out before it reaches the 7 day high of $0.01280
A move on high volume means actual participants are stepping in
To check this ratio in 20 seconds divide today volume by the 7 day average shown on your exchange
Look for volume spikes during the swing between the 24h low of $0.01057 and the high of $0.01154
Never trust a breakout if the volume bar is smaller than the average line next to it
What is your favorite volume indicator to spot fake breakouts
#W #TradingTips
Traders see $W up 2.1 percent at $0.01122 and think the move is weak
That changes when you look at the $1.2M daily volume compared to the 7 day baseline
A move on low volume is just noise that fades out before it reaches the 7 day high of $0.01280
A move on high volume means actual participants are stepping in
To check this ratio in 20 seconds divide today volume by the 7 day average shown on your exchange
Look for volume spikes during the swing between the 24h low of $0.01057 and the high of $0.01154
Never trust a breakout if the volume bar is smaller than the average line next to it
What is your favorite volume indicator to spot fake breakouts
#W #TradingTips
5

·
--
Bullish
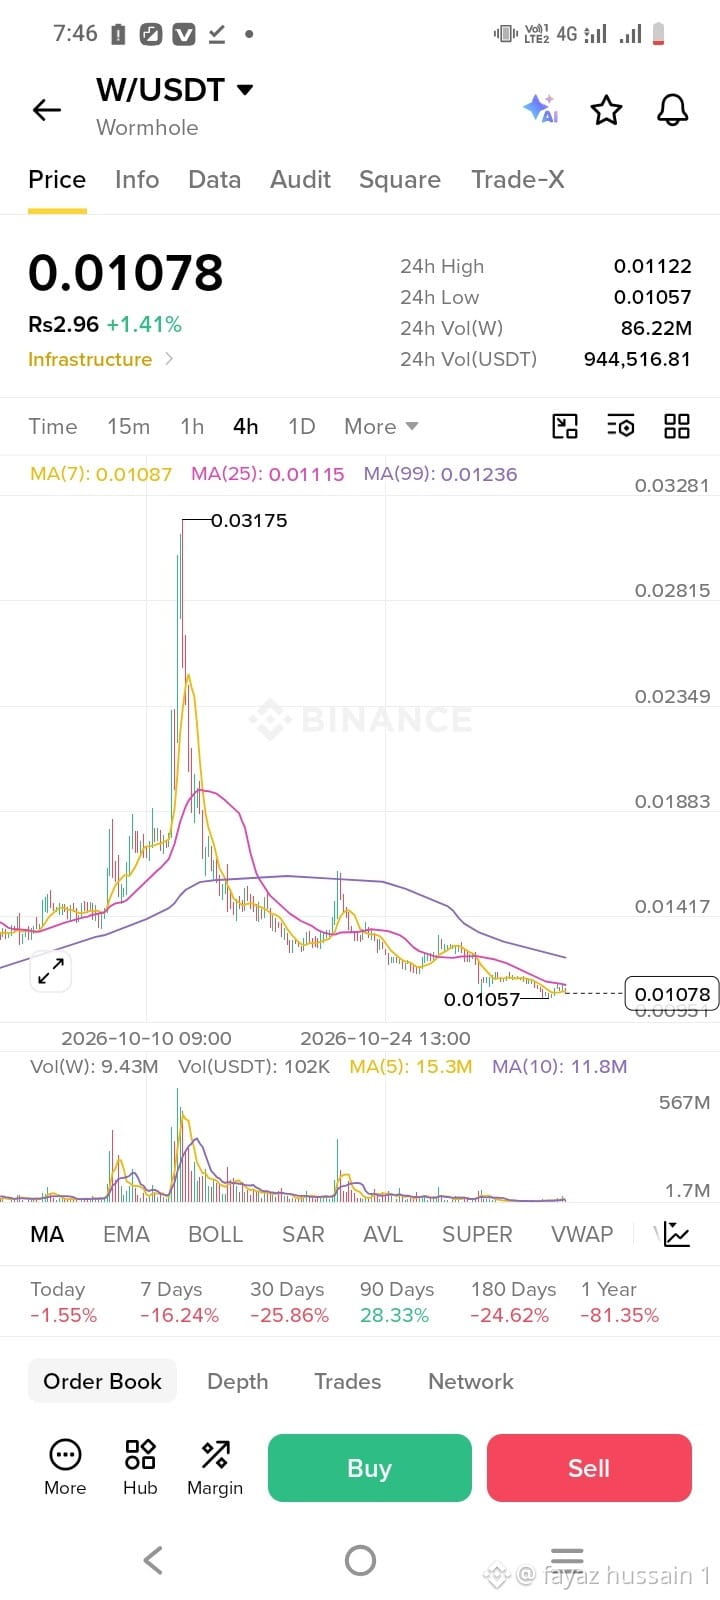
$W this token price 1.6$ in year of 2024 and now 0.01$ 😲
160x down token what is next move w token in this bull run ?
#w
{spot}(WUSDT)
$W this token price 1.6$ in year of 2024 and now 0.01$ 😲
160x down token what is next move w token in this bull run ?
#w
160x down token what is next move w token in this bull run ?
#w
12

·
--
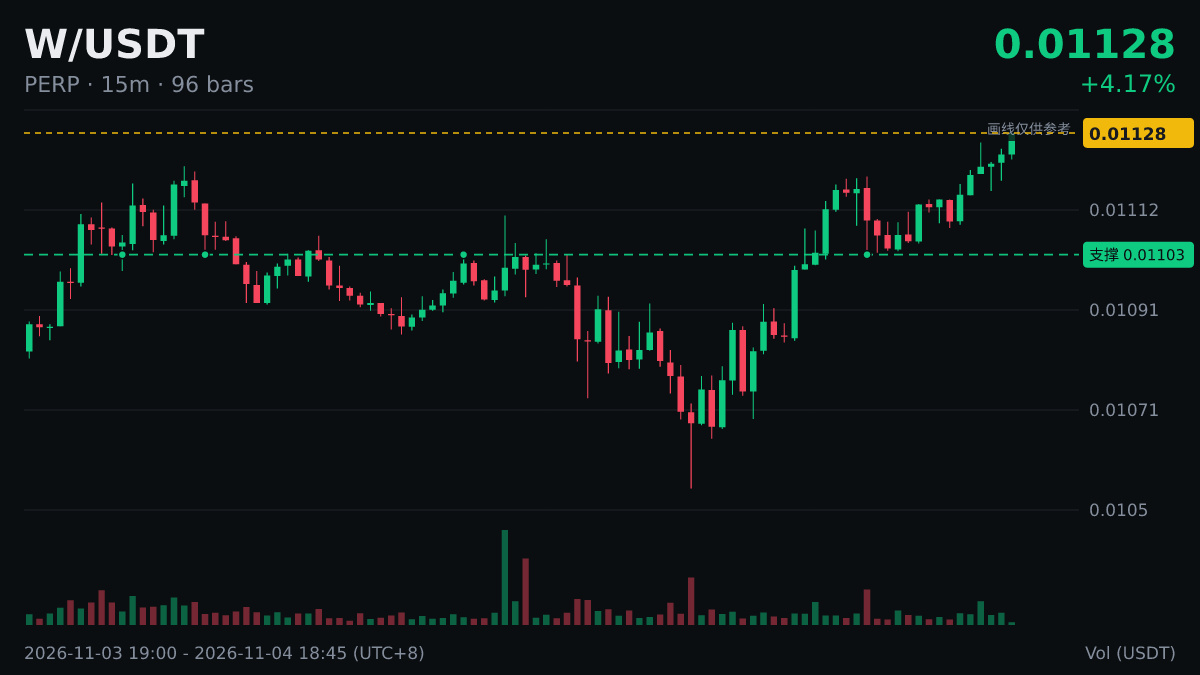
🆙 $W sets a new 24-hour high of 0.01129, breaking above the previous high of 0.01121.
This candlestick chart looks good. Bulls have the upper hand, but watch out for a wick-driven shakeout. Keep an eye on whether trading volume can keep up.
#W
This does not constitute investment advice. You assume all risks.
🆙 $W sets a new 24-hour high of 0.01129, breaking above the previous high of 0.01121.
This candlestick chart looks good. Bulls have the upper hand, but watch out for a wick-driven shakeout. Keep an eye on whether trading volume can keep up.
#W
This does not constitute investment advice. You assume all risks.
This candlestick chart looks good. Bulls have the upper hand, but watch out for a wick-driven shakeout. Keep an eye on whether trading volume can keep up.
#W
This does not constitute investment advice. You assume all risks.
124

$W 30The 30-minute timeframe is leaning bullish; key indicators confirm
📈 $W | 30-minute bullish signal
━━━━━━━━━━━━━━━━━━
Technical analysis: ADX(26) trend is forming; participation is possible | MACD DIF breaks above the zero line, trend turns bullish | EMA5 crosses above EMA8, short-term outlook turns bullish | KDJ is weak, bears have the upper hand (K is 49.0, D is 38.6) | Volume surge (4.4x)
Price change: 0.6300%
━━━━━━━━━━━━━━━━━━
#技术分析 #W
📌 The above content is for reference only and does not constitute investment advice
$W 30The 30-minute timeframe is leaning bullish; key indicators confirm
📈 $W | 30-minute bullish signal
━━━━━━━━━━━━━━━━━━
Technical analysis: ADX(26) trend is forming; participation is possible | MACD DIF breaks above the zero line, trend turns bullish | EMA5 crosses above EMA8, short-term outlook turns bullish | KDJ is weak, bears have the upper hand (K is 49.0, D is 38.6) | Volume surge (4.4x)
Price change: 0.6300%
━━━━━━━━━━━━━━━━━━
#技术分析 #W
📌 The above content is for reference only and does not constitute investment advice
📈 $W | 30-minute bullish signal
━━━━━━━━━━━━━━━━━━
Technical analysis: ADX(26) trend is forming; participation is possible | MACD DIF breaks above the zero line, trend turns bullish | EMA5 crosses above EMA8, short-term outlook turns bullish | KDJ is weak, bears have the upper hand (K is 49.0, D is 38.6) | Volume surge (4.4x)
Price change: 0.6300%
━━━━━━━━━━━━━━━━━━
#技术分析 #W
📌 The above content is for reference only and does not constitute investment advice
2

·
--
$W 30 Bullish signal on the 30-minute timeframe 🔥
════════════════════
🔴 $W 30 30-minute bullish signal
⚠️ Technical analysis: ADX (26): trend is forming, potential entry | MACD DIF breaks above the zero line, trend turns bullish | EMA5 crosses above EMA8, short-term trend turns bullish | KDJ is weak, bears have the upper hand (K: 49.0, D: 38.6) | Volume surge (4.4x)
════════════════════
🔔 Follow for first-hand market updates 🔔
#技术分析 #W
📌 When trading, pay attention to whether the candlestick pattern confirms the signal
$W 30 Bullish signal on the 30-minute timeframe 🔥
════════════════════
🔴 $W 30 30-minute bullish signal
⚠️ Technical analysis: ADX (26): trend is forming, potential entry | MACD DIF breaks above the zero line, trend turns bullish | EMA5 crosses above EMA8, short-term trend turns bullish | KDJ is weak, bears have the upper hand (K: 49.0, D: 38.6) | Volume surge (4.4x)
════════════════════
🔔 Follow for first-hand market updates 🔔
#技术分析 #W
📌 When trading, pay attention to whether the candlestick pattern confirms the signal
════════════════════
🔴 $W 30 30-minute bullish signal
⚠️ Technical analysis: ADX (26): trend is forming, potential entry | MACD DIF breaks above the zero line, trend turns bullish | EMA5 crosses above EMA8, short-term trend turns bullish | KDJ is weak, bears have the upper hand (K: 49.0, D: 38.6) | Volume surge (4.4x)
════════════════════
🔔 Follow for first-hand market updates 🔔
#技术分析 #W
📌 When trading, pay attention to whether the candlestick pattern confirms the signal
2

·
--
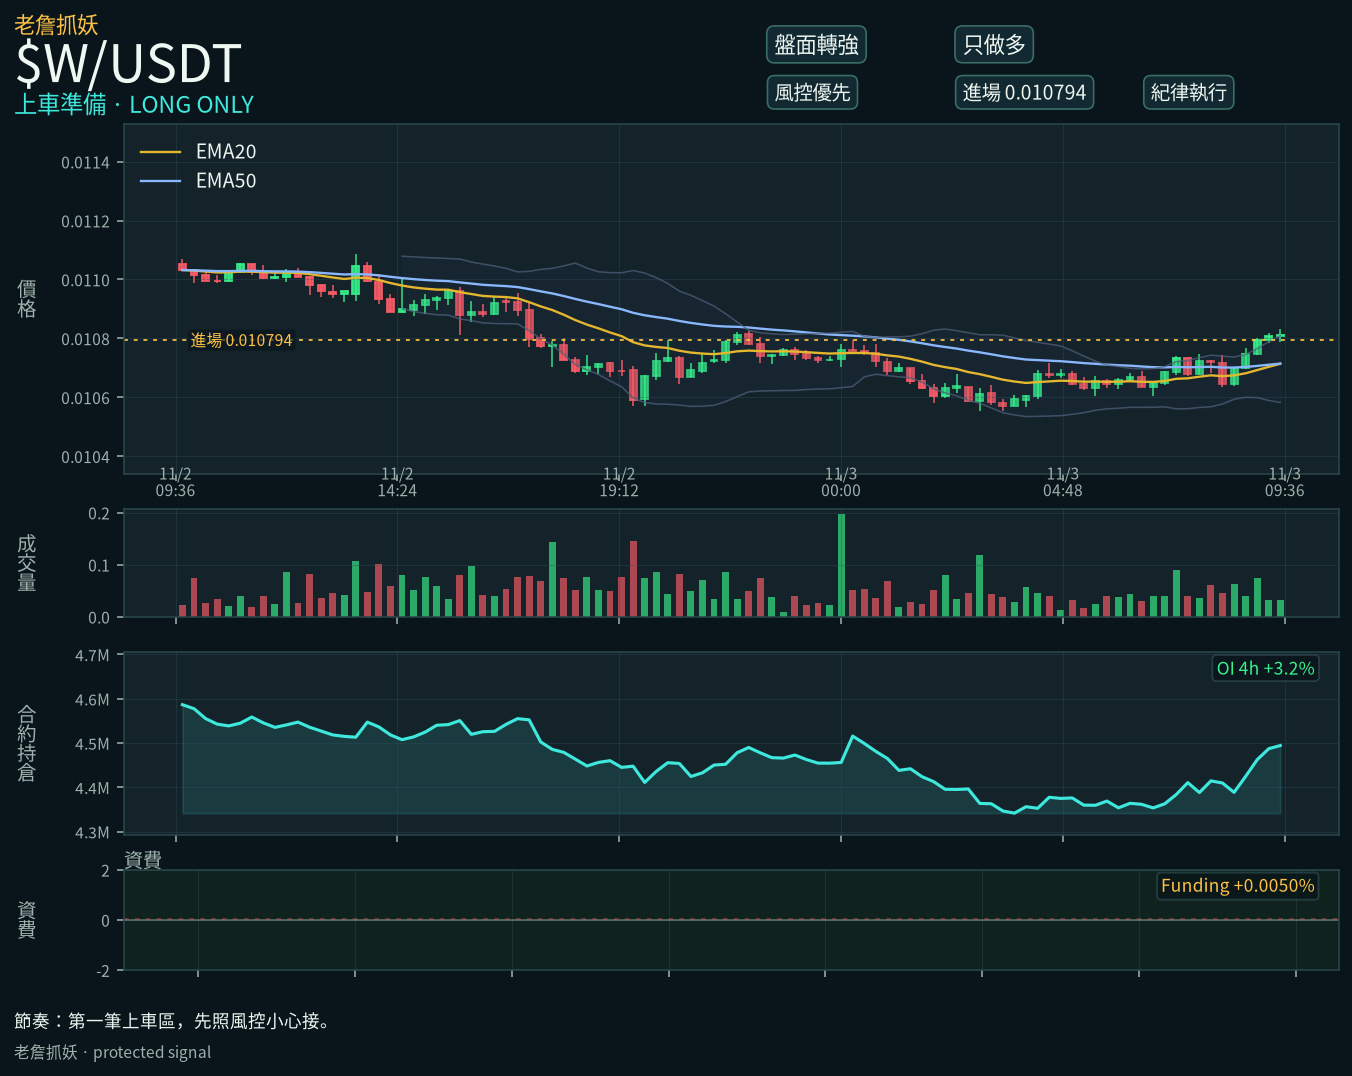
$W It’s starting from a low level here, and I’m getting ready to get in. But the broader market is weak, so it could get dragged down.
My approach: With the broader market weak, cut the position size in half. Stop loss at 0.009175; first target at 0.01187. Take 30% off when it gets there.
#W #妖幣 #Contract
Keep your position size under control and set a stop loss.
$W It’s starting from a low level here, and I’m getting ready to get in. But the broader market is weak, so it could get dragged down.
My approach: With the broader market weak, cut the position size in half. Stop loss at 0.009175; first target at 0.01187. Take 30% off when it gets there.
#W #妖幣 #Contract
Keep your position size under control and set a stop loss.
My approach: With the broader market weak, cut the position size in half. Stop loss at 0.009175; first target at 0.01187. Take 30% off when it gets there.
#W #妖幣 #Contract
Keep your position size under control and set a stop loss.
32

⚡ $W IGNITES EXPLOSIVE BREAKOUT AFTER ABSORBING ACCUMULATION BASE LIQUIDITY! 💥
Entry: 0.00932 - 0.00945 ⚡
Target: 0.00960 - 0.01000 🚀
Stop Loss: 0.00918 ⚠️
Aggressive buyers just sliced through the 0.00920–0.00925 consolidation shelf with heavy 1H bid pressure. 📊 As long as bulls defend the 0.00930 flip zone on minor pullbacks, the expansion phase remains fully intact.
Order flow is shifting fast as floating supply gets absorbed right above the base level. 💡 Holding this key reclaim opens up a clean highway directly toward the 0.01000 psychological liquidity pool. 💭 Are you positioning on this base reclaim or waiting to buy the high-volume breakout later? 👇
⚠️ Not financial advice. Always manage your risk. 🛡️
🏷️ #W #LongSetup #Breakout #Crypto
🔥 ⚡
⚡ $W IGNITES EXPLOSIVE BREAKOUT AFTER ABSORBING ACCUMULATION BASE LIQUIDITY! 💥
Entry: 0.00932 - 0.00945 ⚡
Target: 0.00960 - 0.01000 🚀
Stop Loss: 0.00918 ⚠️
Aggressive buyers just sliced through the 0.00920–0.00925 consolidation shelf with heavy 1H bid pressure. 📊 As long as bulls defend the 0.00930 flip zone on minor pullbacks, the expansion phase remains fully intact.
Order flow is shifting fast as floating supply gets absorbed right above the base level. 💡 Holding this key reclaim opens up a clean highway directly toward the 0.01000 psychological liquidity pool. 💭 Are you positioning on this base reclaim or waiting to buy the high-volume breakout later? 👇
⚠️ Not financial advice. Always manage your risk. 🛡️
🏷️ #W #LongSetup #Breakout #Crypto
🔥 ⚡
Entry: 0.00932 - 0.00945 ⚡
Target: 0.00960 - 0.01000 🚀
Stop Loss: 0.00918 ⚠️
Aggressive buyers just sliced through the 0.00920–0.00925 consolidation shelf with heavy 1H bid pressure. 📊 As long as bulls defend the 0.00930 flip zone on minor pullbacks, the expansion phase remains fully intact.
Order flow is shifting fast as floating supply gets absorbed right above the base level. 💡 Holding this key reclaim opens up a clean highway directly toward the 0.01000 psychological liquidity pool. 💭 Are you positioning on this base reclaim or waiting to buy the high-volume breakout later? 👇
⚠️ Not financial advice. Always manage your risk. 🛡️
🏷️ #W #LongSetup #Breakout #Crypto
🔥 ⚡
24
·
--
$W is sitting at $0.01218 today and I am passing entirely
Volume is dead at half of normal and $1.1M total means you get trapped instantly 📉
Trading thin books on a 5.9 percent drop is how accounts bleed
I need an hourly close above $0.01303 before I care
Or I want a clean test holding $0.01205 to show buyers are alive
It could bounce without me and missing a move hurts less than getting stuck
Chasing $W here, or waiting for 0.01205
#W #RiskManagement
$W is sitting at $0.01218 today and I am passing entirely
Volume is dead at half of normal and $1.1M total means you get trapped instantly 📉
Trading thin books on a 5.9 percent drop is how accounts bleed
I need an hourly close above $0.01303 before I care
Or I want a clean test holding $0.01205 to show buyers are alive
It could bounce without me and missing a move hurts less than getting stuck
Chasing $W here, or waiting for 0.01205
#W #RiskManagement
Volume is dead at half of normal and $1.1M total means you get trapped instantly 📉
Trading thin books on a 5.9 percent drop is how accounts bleed
I need an hourly close above $0.01303 before I care
Or I want a clean test holding $0.01205 to show buyers are alive
It could bounce without me and missing a move hurts less than getting stuck
Chasing $W here, or waiting for 0.01205
#W #RiskManagement
32

·
--
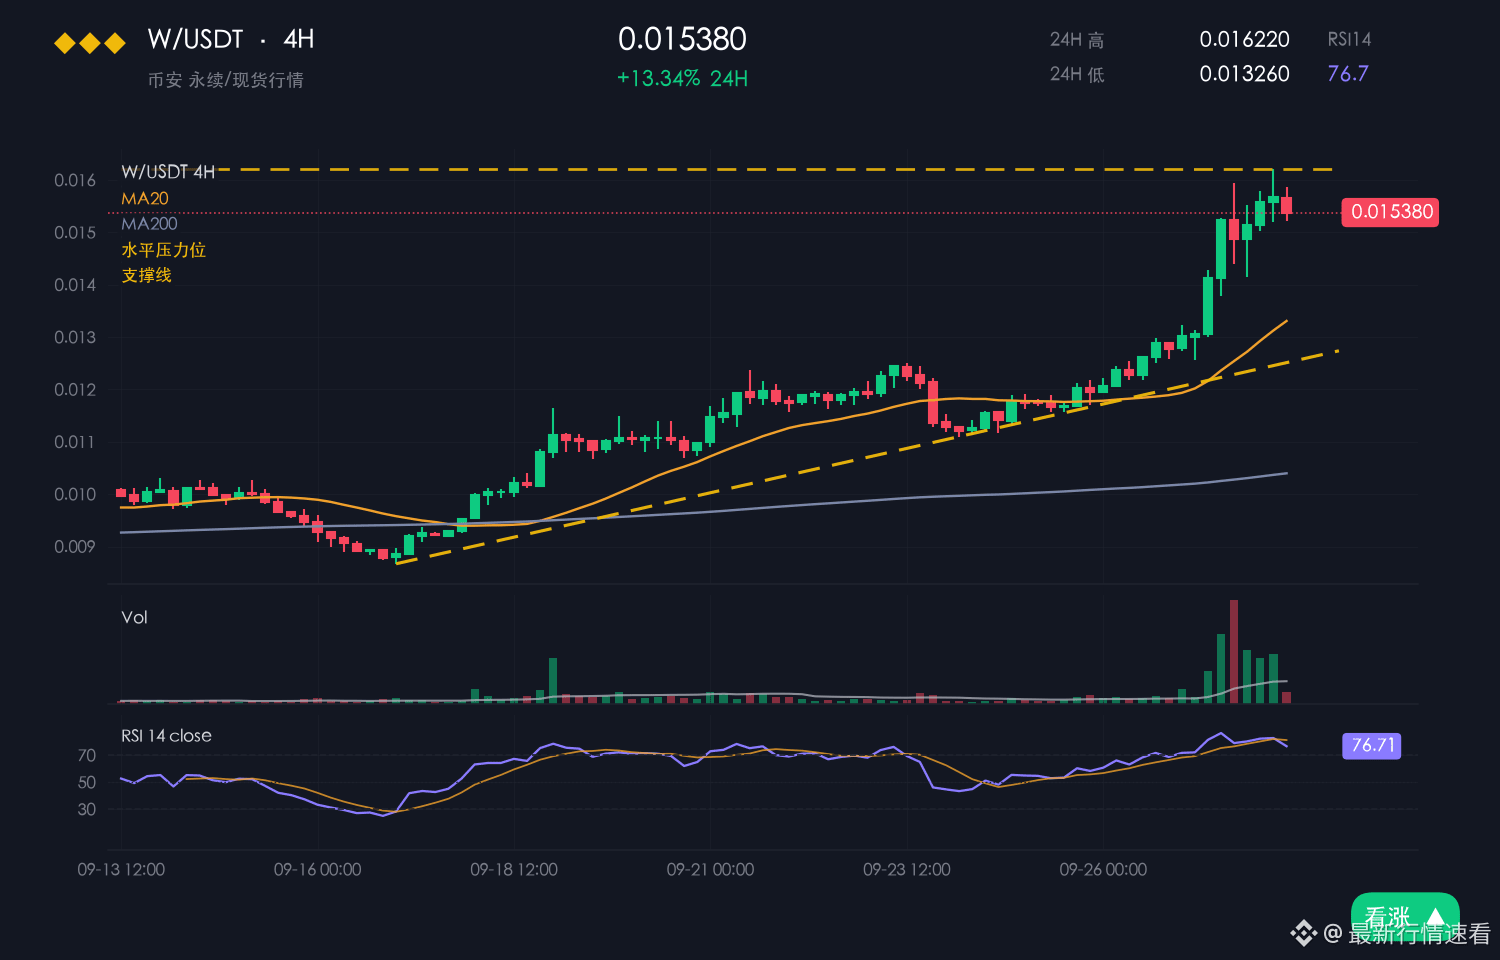
W is currently at 0.0129, up 6.89% in 24 hours, but still down 1.30% over 7 days. The intraday range is 0.0120–0.0130, with an amplitude of 8.7%.
【Market Overview】
Quite a few people have been asking whether W is worth watching right now, so here’s a quick take.
First, a basic point: the intraday range of 0.0120–0.0130 is public information; it wasn’t drawn by anyone.
The center of gravity of the last few 4-hour candlesticks has been steadily rising, showing fairly clear signs of bullish control.
The price has retested 0.0120 several times without breaking below it, and buying support on pullbacks has been decisive.
Compared with BTC’s -0.18%, W is showing relative strength. Assets like this are often at the forefront of a rebound.
【Macro Outlook】 U.S. stocks rose overnight: Nasdaq +0.82%, S&P 500 +0.70% (close on 2026-10-27). BTC ETFs saw net outflows of about $45.2 billion this month. U.S. CPI came in at 3.7% year over year, above expectations. The probability of a rate hike at the 2026-10-27/28 policy meeting is about 47%.
The short-term outlook leans bullish.
【Bullish Case】
What’s the most important thing? The 0.0120 level. That level gives us a range, and the range gives us a rhythm.
It’s still down 1.30% over 7 days, so a single-day gain of 6.89% should be viewed as an oversold bounce for now. Don’t rush to call it a reversal.
A rhythm of buying support on pullbacks and strong volume on upward moves is more sustainable than a one-way rally.
Take it slow; no need to rush.
Fast gains also mean fast pullbacks, so leaving some room in your position is more comfortable than going all in.
$W #W
W is currently at 0.0129, up 6.89% in 24 hours, but still down 1.30% over 7 days. The intraday range is 0.0120–0.0130, with an amplitude of 8.7%.
【Market Overview】
Quite a few people have been asking whether W is worth watching right now, so here’s a quick take.
First, a basic point: the intraday range of 0.0120–0.0130 is public information; it wasn’t drawn by anyone.
The center of gravity of the last few 4-hour candlesticks has been steadily rising, showing fairly clear signs of bullish control.
The price has retested 0.0120 several times without breaking below it, and buying support on pullbacks has been decisive.
Compared with BTC’s -0.18%, W is showing relative strength. Assets like this are often at the forefront of a rebound.
【Macro Outlook】 U.S. stocks rose overnight: Nasdaq +0.82%, S&P 500 +0.70% (close on 2026-10-27). BTC ETFs saw net outflows of about $45.2 billion this month. U.S. CPI came in at 3.7% year over year, above expectations. The probability of a rate hike at the 2026-10-27/28 policy meeting is about 47%.
The short-term outlook leans bullish.
【Bullish Case】
What’s the most important thing? The 0.0120 level. That level gives us a range, and the range gives us a rhythm.
It’s still down 1.30% over 7 days, so a single-day gain of 6.89% should be viewed as an oversold bounce for now. Don’t rush to call it a reversal.
A rhythm of buying support on pullbacks and strong volume on upward moves is more sustainable than a one-way rally.
Take it slow; no need to rush.
Fast gains also mean fast pullbacks, so leaving some room in your position is more comfortable than going all in.
$W #W
【Market Overview】
Quite a few people have been asking whether W is worth watching right now, so here’s a quick take.
First, a basic point: the intraday range of 0.0120–0.0130 is public information; it wasn’t drawn by anyone.
The center of gravity of the last few 4-hour candlesticks has been steadily rising, showing fairly clear signs of bullish control.
The price has retested 0.0120 several times without breaking below it, and buying support on pullbacks has been decisive.
Compared with BTC’s -0.18%, W is showing relative strength. Assets like this are often at the forefront of a rebound.
【Macro Outlook】 U.S. stocks rose overnight: Nasdaq +0.82%, S&P 500 +0.70% (close on 2026-10-27). BTC ETFs saw net outflows of about $45.2 billion this month. U.S. CPI came in at 3.7% year over year, above expectations. The probability of a rate hike at the 2026-10-27/28 policy meeting is about 47%.
The short-term outlook leans bullish.
【Bullish Case】
What’s the most important thing? The 0.0120 level. That level gives us a range, and the range gives us a rhythm.
It’s still down 1.30% over 7 days, so a single-day gain of 6.89% should be viewed as an oversold bounce for now. Don’t rush to call it a reversal.
A rhythm of buying support on pullbacks and strong volume on upward moves is more sustainable than a one-way rally.
Take it slow; no need to rush.
Fast gains also mean fast pullbacks, so leaving some room in your position is more comfortable than going all in.
$W #W
23

·
--
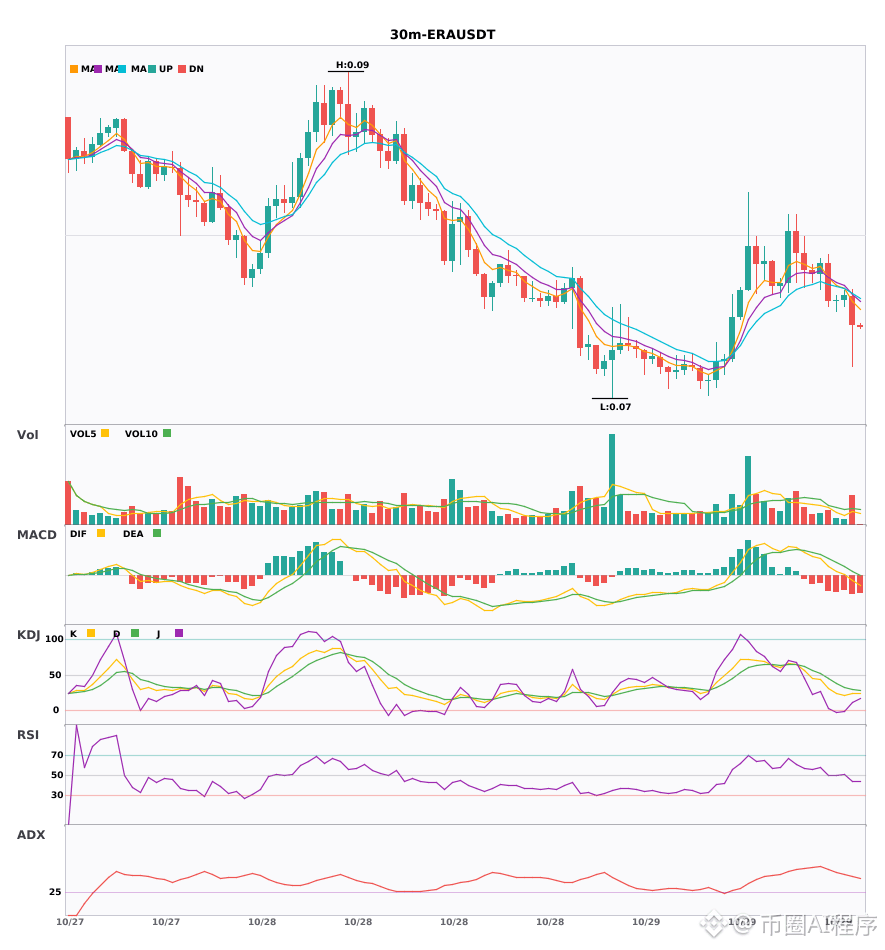
$ERA / $W 30-minute shorts + 4-hour shorts aligned, multi-timeframe confluence turns bearish 🔥
════════════════════
🟢 $ERA 30-minute short signal
⚠️ Technical analysis: 4-hour bearish confluence confirmed | 30-minute entry: MACDDIF breaks below the zero line, trend turns bearish | EMA5 < EMA8 < EMA13, bearish alignment | KDJ trending weakly, bears in control (K = 23.4, D = 29.5) | Volume increased (1.7x)
════════════════════
🟢 $W 30-minute short signal
⚠️ Technical analysis: 4-hour bearish confluence confirmed | 30-minute entry: MACDDIF breaks below the zero line, trend turns bearish | EMA5 < EMA8 < EMA13, bearish alignment | KDJ trending weakly, bears in control (K = 33.0, D = 45.6) | Volume normal (1.3x)
════════════════════
🔔 Follow for first-hand market updates 🔔
#多周期共振 #ERA #W
📌 When trading, pay attention to whether the candlestick pattern meets the criteria
$ERA / $W 30-minute shorts + 4-hour shorts aligned, multi-timeframe confluence turns bearish 🔥
════════════════════
🟢 $ERA 30-minute short signal
⚠️ Technical analysis: 4-hour bearish confluence confirmed | 30-minute entry: MACDDIF breaks below the zero line, trend turns bearish | EMA5 < EMA8 < EMA13, bearish alignment | KDJ trending weakly, bears in control (K = 23.4, D = 29.5) | Volume increased (1.7x)
════════════════════
🟢 $W 30-minute short signal
⚠️ Technical analysis: 4-hour bearish confluence confirmed | 30-minute entry: MACDDIF breaks below the zero line, trend turns bearish | EMA5 < EMA8 < EMA13, bearish alignment | KDJ trending weakly, bears in control (K = 33.0, D = 45.6) | Volume normal (1.3x)
════════════════════
🔔 Follow for first-hand market updates 🔔
#多周期共振 #ERA #W
📌 When trading, pay attention to whether the candlestick pattern meets the criteria
════════════════════
🟢 $ERA 30-minute short signal
⚠️ Technical analysis: 4-hour bearish confluence confirmed | 30-minute entry: MACDDIF breaks below the zero line, trend turns bearish | EMA5 < EMA8 < EMA13, bearish alignment | KDJ trending weakly, bears in control (K = 23.4, D = 29.5) | Volume increased (1.7x)
════════════════════
🟢 $W 30-minute short signal
⚠️ Technical analysis: 4-hour bearish confluence confirmed | 30-minute entry: MACDDIF breaks below the zero line, trend turns bearish | EMA5 < EMA8 < EMA13, bearish alignment | KDJ trending weakly, bears in control (K = 33.0, D = 45.6) | Volume normal (1.3x)
════════════════════
🔔 Follow for first-hand market updates 🔔
#多周期共振 #ERA #W
📌 When trading, pay attention to whether the candlestick pattern meets the criteria
6
·
--
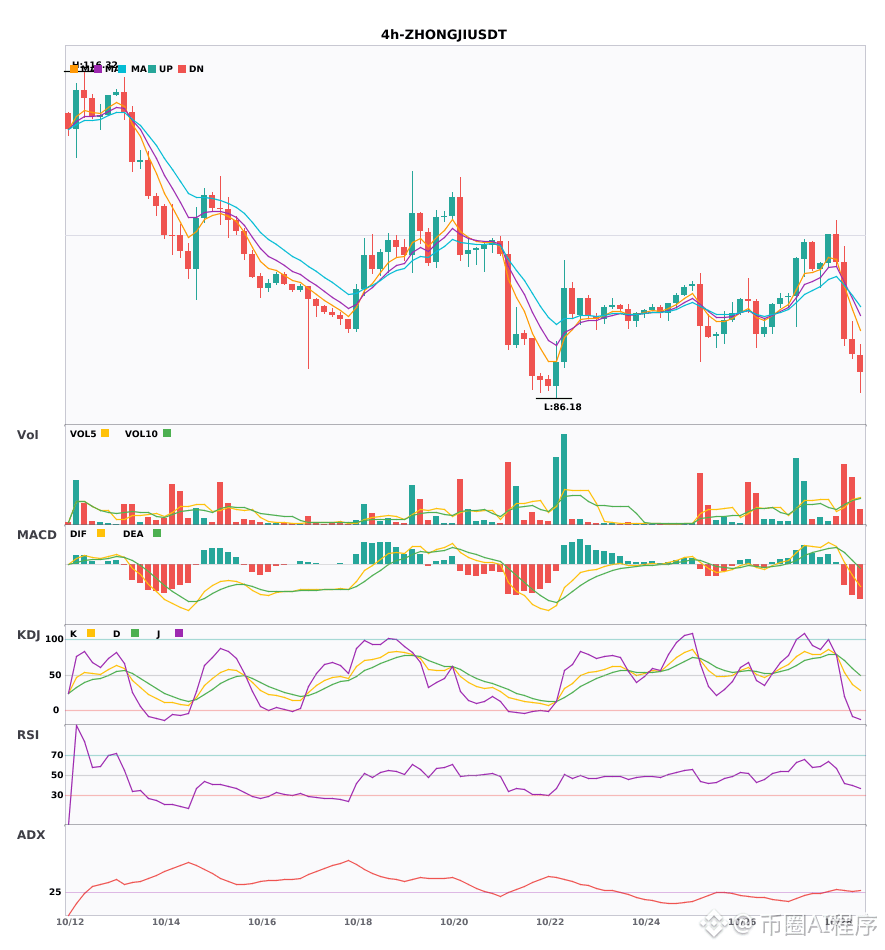
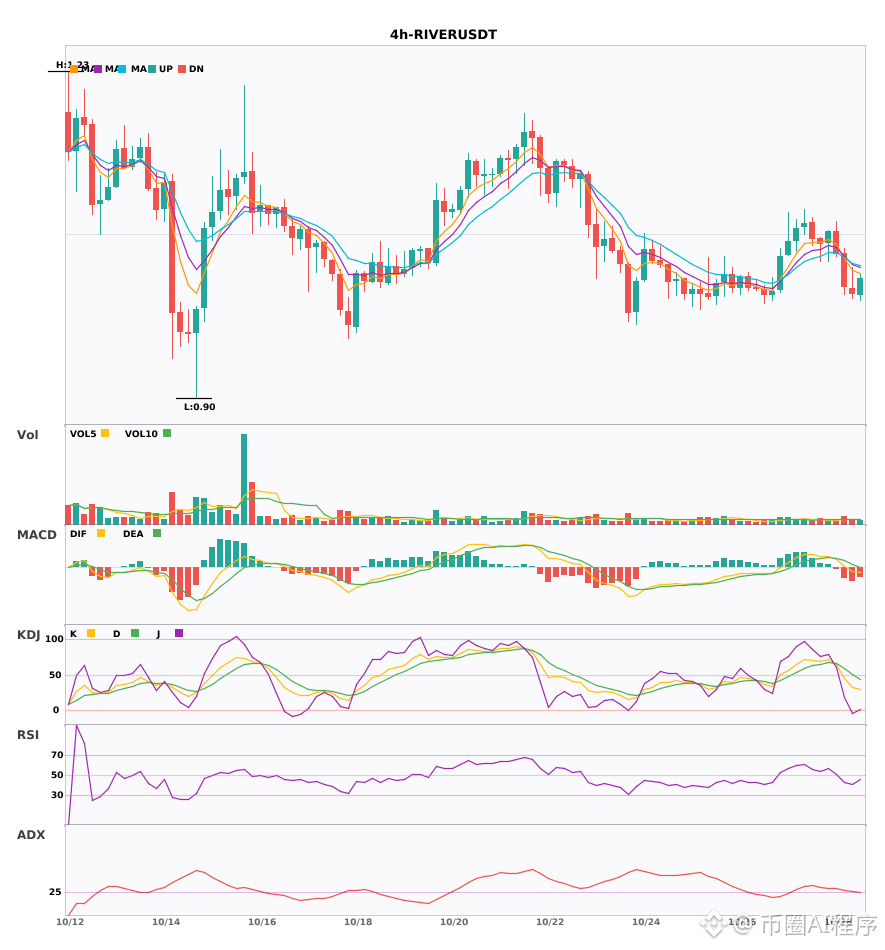
$ZHONGJI / $W / $RIVER 4-hour shorts + daily shorts aligned; multiple timeframes confirm a bearish reversal 🔥
════════════════════
🟢 $ZHONGJI 4-hour bearish signal
⚠️ Technical: Daily bearish alignment confirmed | 4-hour entry: MACD DIF falls below the zero line, trend turns bearish | EMA5 < EMA8 < EMA13, bearish alignment | Volume surge (2.9x)
════════════════════
🟢 $W 4-hour bearish signal
⚠️ Technical: Daily bearish alignment confirmed | 4-hour entry: MACD DIF falls below the zero line, trend turns bearish | EMA5 < EMA8 < EMA13, bearish alignment | KDJ showing weakness, bears in control (K: 28.4, D: 44.2) | Normal volume (1.3x)
════════════════════
🟢 $RIVER 4-hour bearish signal
⚠️ Technical: Daily bearish alignment confirmed | 4-hour entry: MACD DIF falls below the zero line, trend turns bearish | EMA5 < EMA8 < EMA13, bearish alignment | Normal volume (1.5x)
════════════════════
🔔 Follow for first-hand market movement alerts 🔔
#多周期共振 #ZHONGJI #W #RIVER
📌 When trading, pay attention to whether the candlestick pattern is consistent
$ZHONGJI / $W / $RIVER 4-hour shorts + daily shorts aligned; multiple timeframes confirm a bearish reversal 🔥
════════════════════
🟢 $ZHONGJI 4-hour bearish signal
⚠️ Technical: Daily bearish alignment confirmed | 4-hour entry: MACD DIF falls below the zero line, trend turns bearish | EMA5 < EMA8 < EMA13, bearish alignment | Volume surge (2.9x)
════════════════════
🟢 $W 4-hour bearish signal
⚠️ Technical: Daily bearish alignment confirmed | 4-hour entry: MACD DIF falls below the zero line, trend turns bearish | EMA5 < EMA8 < EMA13, bearish alignment | KDJ showing weakness, bears in control (K: 28.4, D: 44.2) | Normal volume (1.3x)
════════════════════
🟢 $RIVER 4-hour bearish signal
⚠️ Technical: Daily bearish alignment confirmed | 4-hour entry: MACD DIF falls below the zero line, trend turns bearish | EMA5 < EMA8 < EMA13, bearish alignment | Normal volume (1.5x)
════════════════════
🔔 Follow for first-hand market movement alerts 🔔
#多周期共振 #ZHONGJI #W #RIVER
📌 When trading, pay attention to whether the candlestick pattern is consistent
════════════════════
🟢 $ZHONGJI 4-hour bearish signal
⚠️ Technical: Daily bearish alignment confirmed | 4-hour entry: MACD DIF falls below the zero line, trend turns bearish | EMA5 < EMA8 < EMA13, bearish alignment | Volume surge (2.9x)
════════════════════
🟢 $W 4-hour bearish signal
⚠️ Technical: Daily bearish alignment confirmed | 4-hour entry: MACD DIF falls below the zero line, trend turns bearish | EMA5 < EMA8 < EMA13, bearish alignment | KDJ showing weakness, bears in control (K: 28.4, D: 44.2) | Normal volume (1.3x)
════════════════════
🟢 $RIVER 4-hour bearish signal
⚠️ Technical: Daily bearish alignment confirmed | 4-hour entry: MACD DIF falls below the zero line, trend turns bearish | EMA5 < EMA8 < EMA13, bearish alignment | Normal volume (1.5x)
════════════════════
🔔 Follow for first-hand market movement alerts 🔔
#多周期共振 #ZHONGJI #W #RIVER
📌 When trading, pay attention to whether the candlestick pattern is consistent
84
·
--
$W volume is 0.5x its weekly average. Here is why that matters more than price
Most traders see a plus 3.1 percent day on $W and think buyers are stepping in
I check the volume ratio first because price can drift on empty air
Right now $W has 1.9M in daily volume while its seven day average is double that
That means half the usual participation is actually trading this move
A green candle on low volume is usually just a lack of sellers rather than real demand
If you want to check this ratio in twenty seconds just look at your volume moving average on the daily chart
Compare today against the past seven bars to see if the crowd is actually here
What volume filter do you use before taking a trade
#W #TradingTips
$W volume is 0.5x its weekly average. Here is why that matters more than price
Most traders see a plus 3.1 percent day on $W and think buyers are stepping in
I check the volume ratio first because price can drift on empty air
Right now $W has 1.9M in daily volume while its seven day average is double that
That means half the usual participation is actually trading this move
A green candle on low volume is usually just a lack of sellers rather than real demand
If you want to check this ratio in twenty seconds just look at your volume moving average on the daily chart
Compare today against the past seven bars to see if the crowd is actually here
What volume filter do you use before taking a trade
#W #TradingTips
Most traders see a plus 3.1 percent day on $W and think buyers are stepping in
I check the volume ratio first because price can drift on empty air
Right now $W has 1.9M in daily volume while its seven day average is double that
That means half the usual participation is actually trading this move
A green candle on low volume is usually just a lack of sellers rather than real demand
If you want to check this ratio in twenty seconds just look at your volume moving average on the daily chart
Compare today against the past seven bars to see if the crowd is actually here
What volume filter do you use before taking a trade
#W #TradingTips
29
·
--
$W is up 3.7 percent today and I am passing on it
Volume is 0.5x average so nobody is actually funding this move
Only 2.1M dollars traded today means size moves this book and exits are not likely
I need to see an hourly close and hold above 0.01337 or a pullback that holds 0.01219 and bounces
It could keep running without you and a bad entry costs more than a missed move
Chasing $W here, or waiting for 0.01219
#W #RiskManagement
$W is up 3.7 percent today and I am passing on it
Volume is 0.5x average so nobody is actually funding this move
Only 2.1M dollars traded today means size moves this book and exits are not likely
I need to see an hourly close and hold above 0.01337 or a pullback that holds 0.01219 and bounces
It could keep running without you and a bad entry costs more than a missed move
Chasing $W here, or waiting for 0.01219
#W #RiskManagement
Volume is 0.5x average so nobody is actually funding this move
Only 2.1M dollars traded today means size moves this book and exits are not likely
I need to see an hourly close and hold above 0.01337 or a pullback that holds 0.01219 and bounces
It could keep running without you and a bad entry costs more than a missed move
Chasing $W here, or waiting for 0.01219
#W #RiskManagement
27

·
--
$W +5.89% | $ANIME +5.65% | $BEB +5.56%
#W climbs to $0.0129, up +5.89% on $2.0 M volume. Its cross‑chain messaging role via Wormhole keeps it in focus as bridges remain a hot topic.
#ANIME nudges higher to $0.00299000, gaining +5.65% with $3.6 M traded. The modest rise hints at renewed interest in niche meme‑driven projects.
#BEB jumps to $222.28, up +5.56% on a solid $5.6 M of volume. The price push suggests buyers are testing its recent technical breakout.
The volume disparity—BEB leading while W and ANIME trail—could signal where short‑term liquidity is concentrating.
#Write2Earn #Binance
$W +5.89% | $ANIME +5.65% | $BEB +5.56%
#W climbs to $0.0129, up +5.89% on $2.0 M volume. Its cross‑chain messaging role via Wormhole keeps it in focus as bridges remain a hot topic.
#ANIME nudges higher to $0.00299000, gaining +5.65% with $3.6 M traded. The modest rise hints at renewed interest in niche meme‑driven projects.
#BEB jumps to $222.28, up +5.56% on a solid $5.6 M of volume. The price push suggests buyers are testing its recent technical breakout.
The volume disparity—BEB leading while W and ANIME trail—could signal where short‑term liquidity is concentrating.
#Write2Earn #Binance
#W climbs to $0.0129, up +5.89% on $2.0 M volume. Its cross‑chain messaging role via Wormhole keeps it in focus as bridges remain a hot topic.
#ANIME nudges higher to $0.00299000, gaining +5.65% with $3.6 M traded. The modest rise hints at renewed interest in niche meme‑driven projects.
#BEB jumps to $222.28, up +5.56% on a solid $5.6 M of volume. The price push suggests buyers are testing its recent technical breakout.
The volume disparity—BEB leading while W and ANIME trail—could signal where short‑term liquidity is concentrating.
#Write2Earn #Binance
33


·
--
Bearish
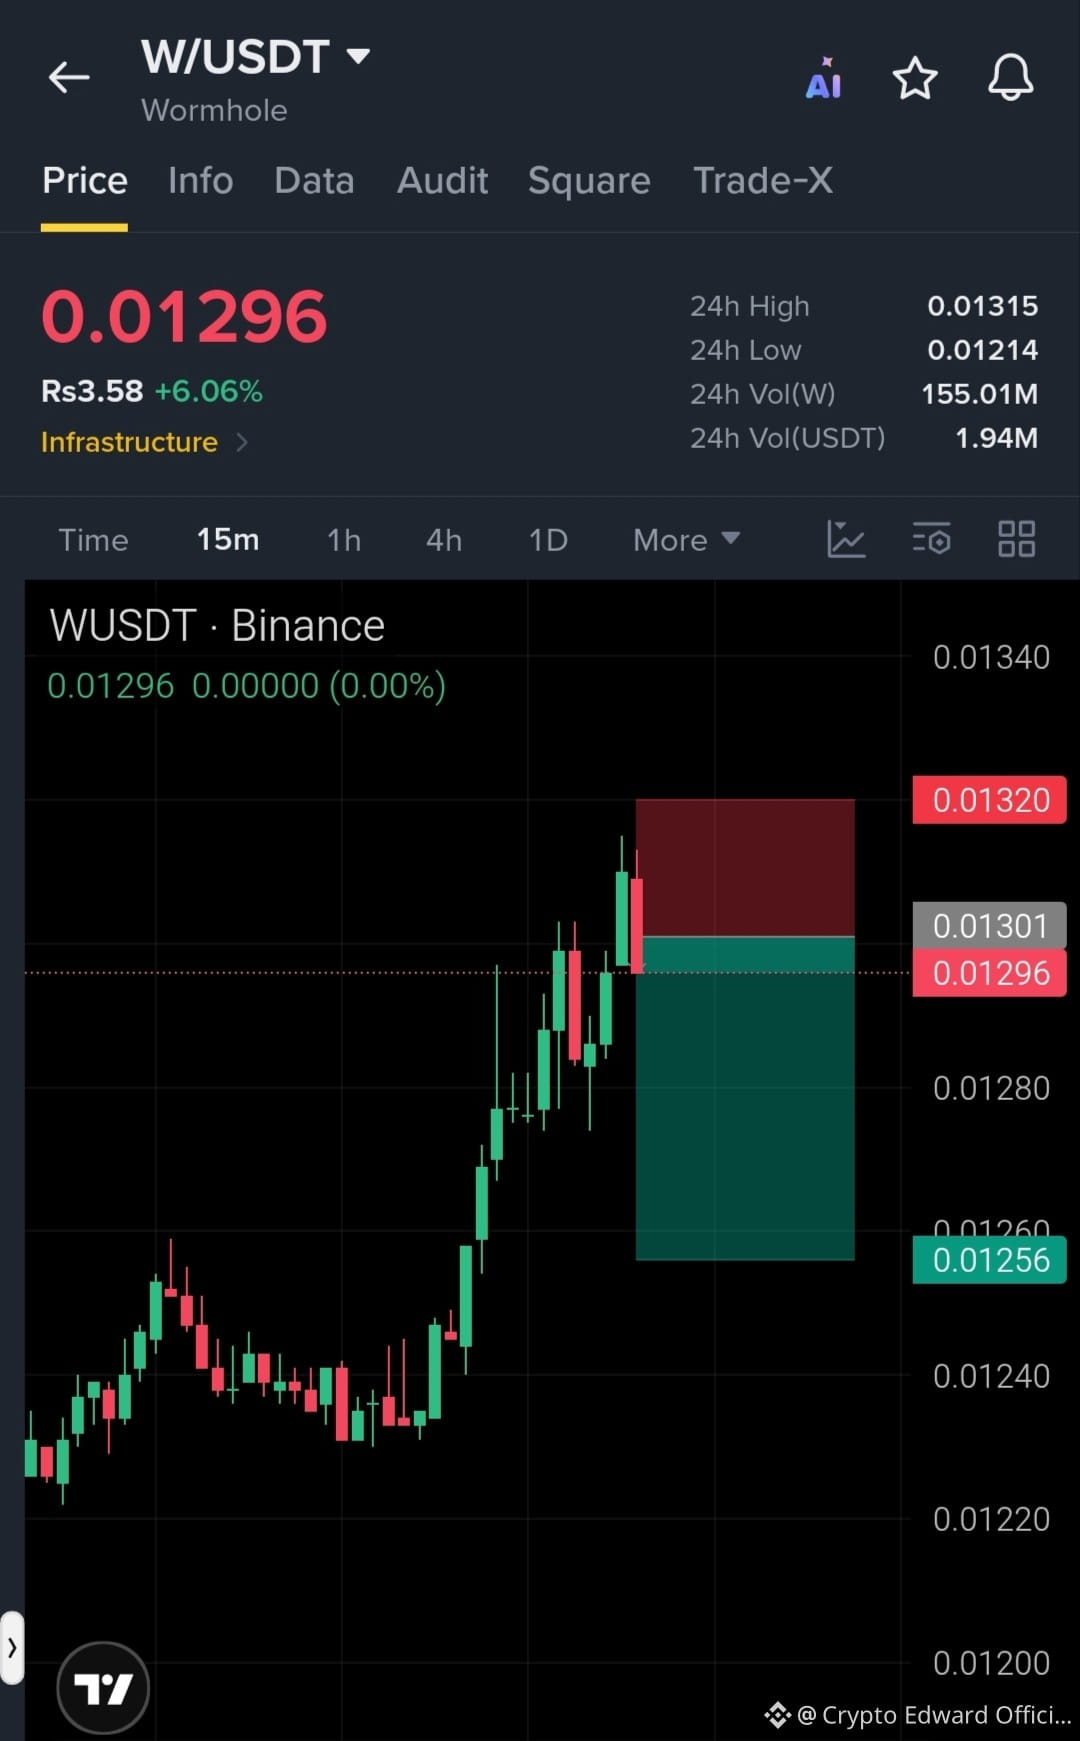
#W SHORT — Sellers Eye Lower Support!
🔴 ENTRY: 0.01290–0.01300
🎯 TP1: 0.01280
🎯 TP2: 0.01256
🎯 TP3: 0.01240
🛑 STOP-LOSS: 0.01320
$W is trading near 0.01296, close to resistance at 0.01301–0.01315. Rejection from this zone could push price toward 0.01256, while a breakout above 0.01315 may invalidate the short setup.
Risk Management: Keep leverage low and risk only 1–2% of capital per trade.
Trade Here On $W 👇
#W SHORT — Sellers Eye Lower Support!
🔴 ENTRY: 0.01290–0.01300
🎯 TP1: 0.01280
🎯 TP2: 0.01256
🎯 TP3: 0.01240
🛑 STOP-LOSS: 0.01320
$W is trading near 0.01296, close to resistance at 0.01301–0.01315. Rejection from this zone could push price toward 0.01256, while a breakout above 0.01315 may invalidate the short setup.
Risk Management: Keep leverage low and risk only 1–2% of capital per trade.
Trade Here On $W 👇
🔴 ENTRY: 0.01290–0.01300
🎯 TP1: 0.01280
🎯 TP2: 0.01256
🎯 TP3: 0.01240
🛑 STOP-LOSS: 0.01320
$W is trading near 0.01296, close to resistance at 0.01301–0.01315. Rejection from this zone could push price toward 0.01256, while a breakout above 0.01315 may invalidate the short setup.
Risk Management: Keep leverage low and risk only 1–2% of capital per trade.
Trade Here On $W 👇
1
53

·
--
$W is not bullish enough to scare the shorts yet. 🔥
It’s at $0.0129, up 7.51% today, but volume is just 0.1x its 20d average while funding sits at -0.018%. Shorts are paying into a move that added 5.4% in 4h.
Still chopping.
I’m not chasing here. If $W reclaims $0.013 cleanly, I’d watch for continuation, not pretend it’s a $BTC breakout. RSI 57 leaves room.
Watching how $W reacts at $0.013? 👀
#W #Crypto #Binance
$W is not bullish enough to scare the shorts yet. 🔥
It’s at $0.0129, up 7.51% today, but volume is just 0.1x its 20d average while funding sits at -0.018%. Shorts are paying into a move that added 5.4% in 4h.
Still chopping.
I’m not chasing here. If $W reclaims $0.013 cleanly, I’d watch for continuation, not pretend it’s a $BTC breakout. RSI 57 leaves room.
Watching how $W reacts at $0.013? 👀
#W #Crypto #Binance
It’s at $0.0129, up 7.51% today, but volume is just 0.1x its 20d average while funding sits at -0.018%. Shorts are paying into a move that added 5.4% in 4h.
Still chopping.
I’m not chasing here. If $W reclaims $0.013 cleanly, I’d watch for continuation, not pretend it’s a $BTC breakout. RSI 57 leaves room.
Watching how $W reacts at $0.013? 👀
#W #Crypto #Binance
5
·
--
$W 24h volume is 0.4x its weekly average and most traders are missing the trap
Price is up 5.1 percent today sitting at $0.01246 near the top of its range
Looks strong until you check the engine
Total 24h volume is only $1.5M which is less than half the normal seven day pace
When price creeps up on weak volume it usually means buyers are just exhausted rather than aggressive
You can check this ratio yourself on Binance by pulling up the daily volume bars and comparing the latest bar to the moving average line
Never trust a green candle that has no size behind it
What volume filter do you use before taking a trade
Do not take my word for it, tap $W and look at the candles
#W #TradingTips
$W 24h volume is 0.4x its weekly average and most traders are missing the trap
Price is up 5.1 percent today sitting at $0.01246 near the top of its range
Looks strong until you check the engine
Total 24h volume is only $1.5M which is less than half the normal seven day pace
When price creeps up on weak volume it usually means buyers are just exhausted rather than aggressive
You can check this ratio yourself on Binance by pulling up the daily volume bars and comparing the latest bar to the moving average line
Never trust a green candle that has no size behind it
What volume filter do you use before taking a trade
Do not take my word for it, tap $W and look at the candles
#W #TradingTips
Price is up 5.1 percent today sitting at $0.01246 near the top of its range
Looks strong until you check the engine
Total 24h volume is only $1.5M which is less than half the normal seven day pace
When price creeps up on weak volume it usually means buyers are just exhausted rather than aggressive
You can check this ratio yourself on Binance by pulling up the daily volume bars and comparing the latest bar to the moving average line
Never trust a green candle that has no size behind it
What volume filter do you use before taking a trade
Do not take my word for it, tap $W and look at the candles
#W #TradingTips
12

·
--
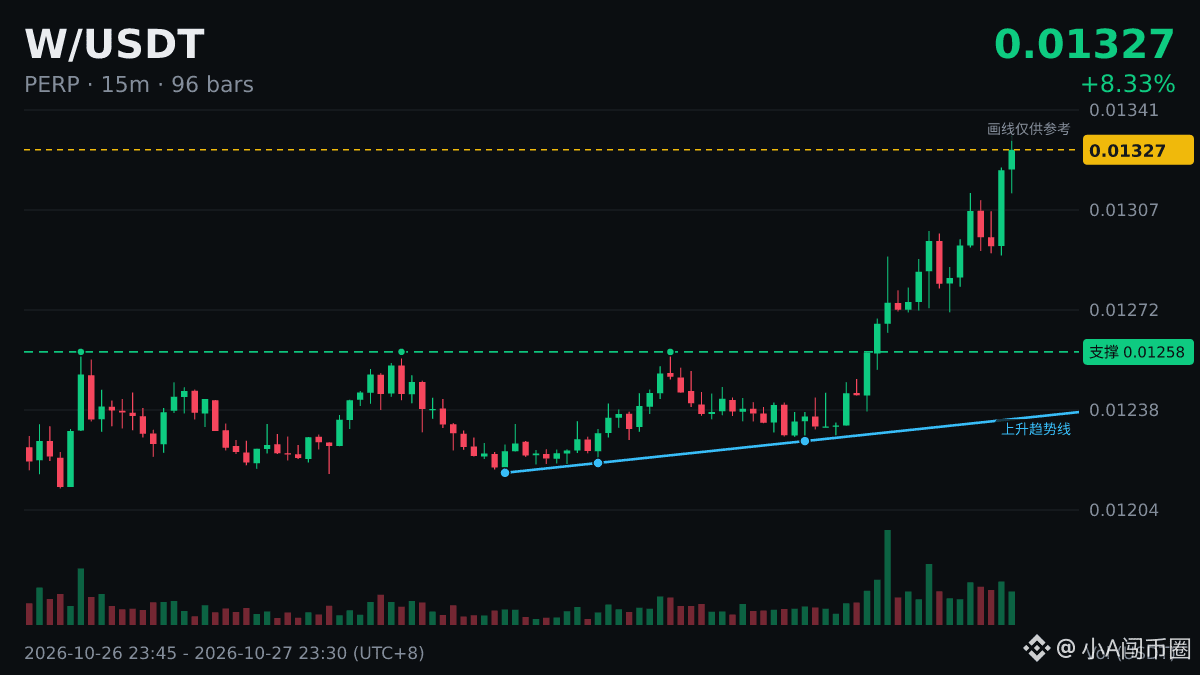
$W 24-hour high, current price 0.01332, previous high 0.01313.
After a new high, there are usually three common patterns:
① Pull back to the previous high without breaking below it, then move up another step: strongest
② Trade back and forth around the previous high: turnover; watch for direction
③ Fall straight back below the previous high and fail to reclaim it: false breakout
Currently above the previous high; first see whether it falls into ① or ②.
#W
$W 24-hour high, current price 0.01332, previous high 0.01313.
After a new high, there are usually three common patterns:
① Pull back to the previous high without breaking below it, then move up another step: strongest
② Trade back and forth around the previous high: turnover; watch for direction
③ Fall straight back below the previous high and fail to reclaim it: false breakout
Currently above the previous high; first see whether it falls into ① or ②.
#W
After a new high, there are usually three common patterns:
① Pull back to the previous high without breaking below it, then move up another step: strongest
② Trade back and forth around the previous high: turnover; watch for direction
③ Fall straight back below the previous high and fail to reclaim it: false breakout
Currently above the previous high; first see whether it falls into ① or ②.
#W
3
·
--
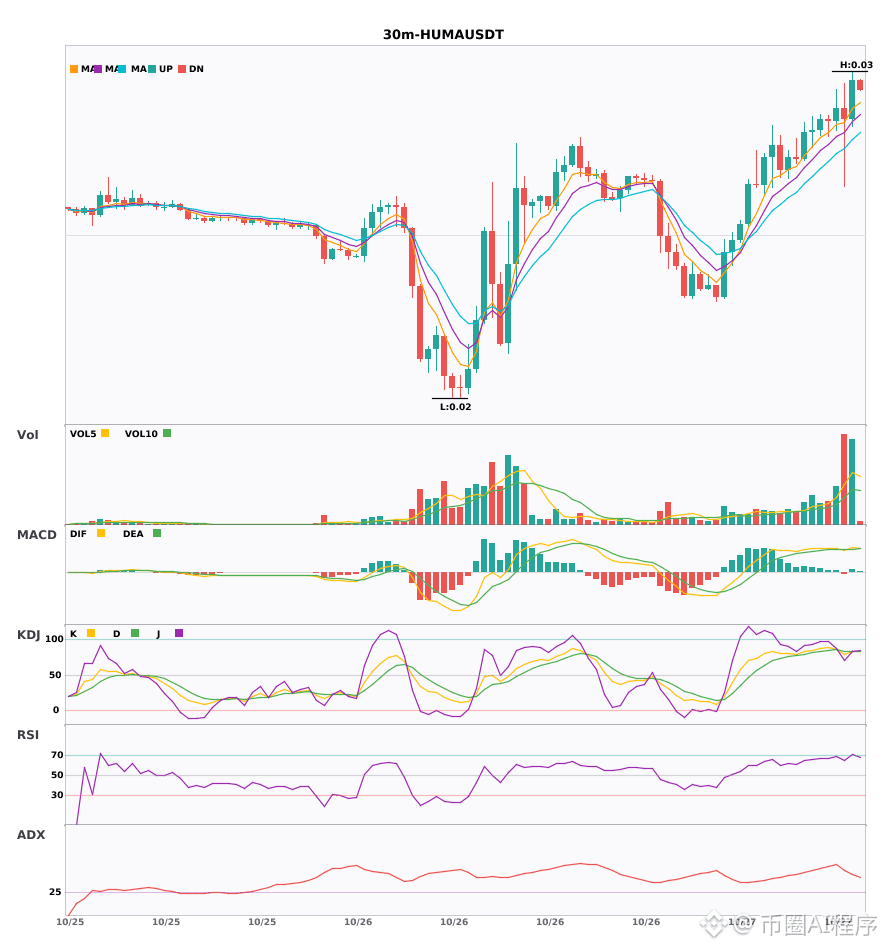
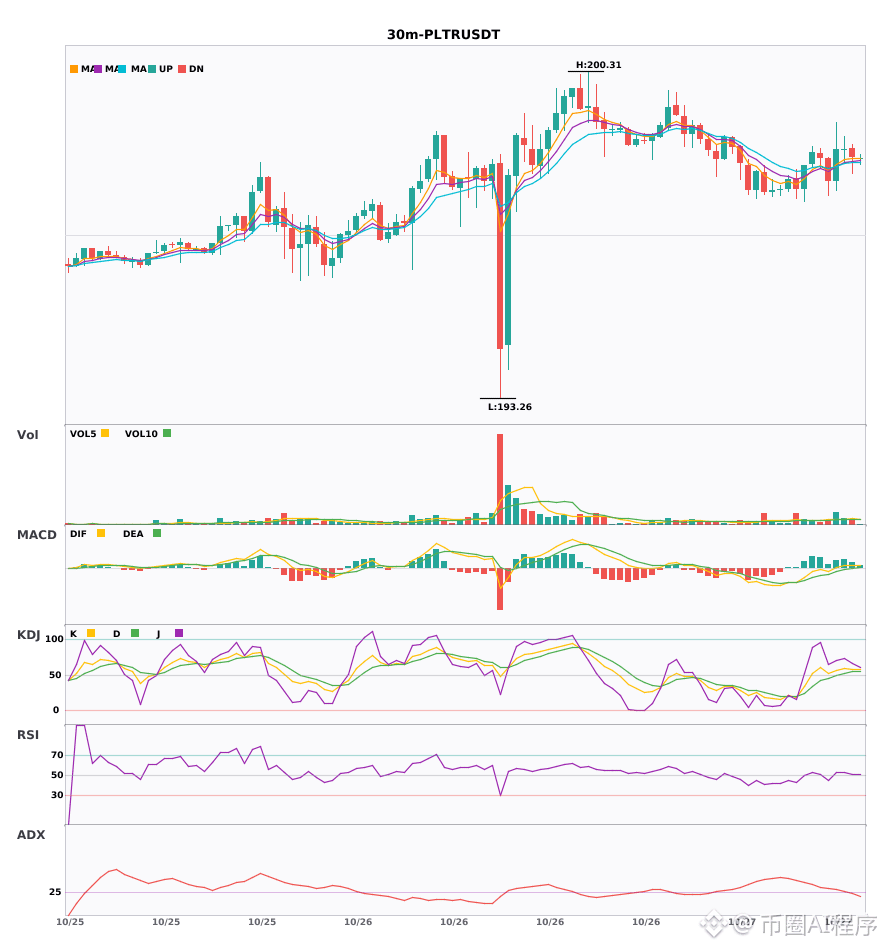
Multi-period resonance: $HUMA / $W / $PLTR 30-minute strength, 4-hour bullish trend confirmed🔥
════════════════════
🔴 $HUMA 30-minute bullish signal
⚠️Technical: 4-hour bullish resonance confirmed | 30-minute entry MACD golden cross above zero, bullish momentum released | EMA5 greater than EMA8 greater than EMA13 bullish alignment | KDJ golden cross, short-term bullish (K=83.3 D=83.2) | Volume surge (3.3x)
════════════════════
🔴 $W 30-minute bullish signal
⚠️Technical: 4-hour bullish resonance confirmed | 30-minute entry MACD golden cross above zero, bullish momentum released | EMA5 crosses above EMA8, short-term turning bullish | KDJ golden cross, short-term bullish (K=39.5 D=39.1) | Normal volume (1.2x)
════════════════════
🔴 $PLTR 30-minute bullish signal
⚠️Technical: 4-hour bullish resonance confirmed | 30-minute entry MACD bullish operation, trend relatively strong, momentum increasing | EMA5 greater than EMA8 greater than EMA13 bullish alignment | KDJ running strongly, bulls in advantage (K=59.5 D=52.6) | Volume expanded (2.2x)
════════════════════
🔔 Follow to get the first-hand market moves 🔔
#多周期共振 #HUMA #W #PLTR
📌 When trading, pay attention to whether the candlestick pattern matches
Multi-period resonance: $HUMA / $W / $PLTR 30-minute strength, 4-hour bullish trend confirmed🔥
════════════════════
🔴 $HUMA 30-minute bullish signal
⚠️Technical: 4-hour bullish resonance confirmed | 30-minute entry MACD golden cross above zero, bullish momentum released | EMA5 greater than EMA8 greater than EMA13 bullish alignment | KDJ golden cross, short-term bullish (K=83.3 D=83.2) | Volume surge (3.3x)
════════════════════
🔴 $W 30-minute bullish signal
⚠️Technical: 4-hour bullish resonance confirmed | 30-minute entry MACD golden cross above zero, bullish momentum released | EMA5 crosses above EMA8, short-term turning bullish | KDJ golden cross, short-term bullish (K=39.5 D=39.1) | Normal volume (1.2x)
════════════════════
🔴 $PLTR 30-minute bullish signal
⚠️Technical: 4-hour bullish resonance confirmed | 30-minute entry MACD bullish operation, trend relatively strong, momentum increasing | EMA5 greater than EMA8 greater than EMA13 bullish alignment | KDJ running strongly, bulls in advantage (K=59.5 D=52.6) | Volume expanded (2.2x)
════════════════════
🔔 Follow to get the first-hand market moves 🔔
#多周期共振 #HUMA #W #PLTR
📌 When trading, pay attention to whether the candlestick pattern matches
════════════════════
🔴 $HUMA 30-minute bullish signal
⚠️Technical: 4-hour bullish resonance confirmed | 30-minute entry MACD golden cross above zero, bullish momentum released | EMA5 greater than EMA8 greater than EMA13 bullish alignment | KDJ golden cross, short-term bullish (K=83.3 D=83.2) | Volume surge (3.3x)
════════════════════
🔴 $W 30-minute bullish signal
⚠️Technical: 4-hour bullish resonance confirmed | 30-minute entry MACD golden cross above zero, bullish momentum released | EMA5 crosses above EMA8, short-term turning bullish | KDJ golden cross, short-term bullish (K=39.5 D=39.1) | Normal volume (1.2x)
════════════════════
🔴 $PLTR 30-minute bullish signal
⚠️Technical: 4-hour bullish resonance confirmed | 30-minute entry MACD bullish operation, trend relatively strong, momentum increasing | EMA5 greater than EMA8 greater than EMA13 bullish alignment | KDJ running strongly, bulls in advantage (K=59.5 D=52.6) | Volume expanded (2.2x)
════════════════════
🔔 Follow to get the first-hand market moves 🔔
#多周期共振 #HUMA #W #PLTR
📌 When trading, pay attention to whether the candlestick pattern matches
8

·
--
Bullish
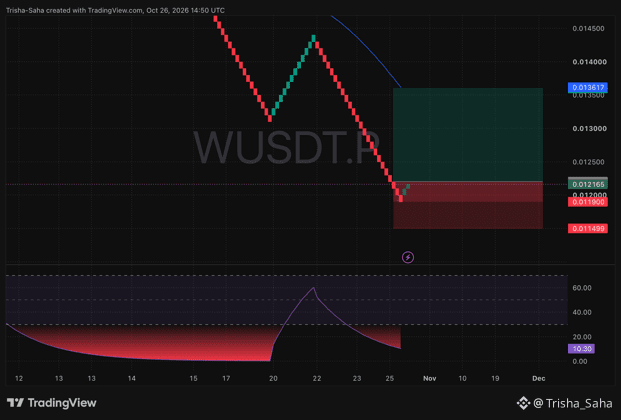
🧨 $W JUST HIT ROCK BOTTOM! VIOLENT SNAPBACK LOADING NOW! 🦅
📍 Trade Setup:
• Entry Zone: $0.012100 – $0.012200
• Stop Loss: $0.011499
• Target: $0.013617
• Sellers slammed into a brick wall at $0.011900, and buyers are already fighting back with fresh green candles off the floor.
• Our bottom momentum meter is sitting at an extreme 10.30, showing the downside is completely drained and ready to snap upward.
• We have a massive, wide-open gap with zero traffic all the way up to the blue moving average line right at $0.013617.
Slide your Stop Loss right up to Break-Even the moment this trade climbs +3% to +4% in profit to lock in a completely risk-free ride.
My entry is filled and I am riding this reversal from the bottom. Who else is catching this move with me? Drop a comment below! 👇
#W #WUSDT #CryptoTrading #Altcoins
{future}(WUSDT)
🧨 $W JUST HIT ROCK BOTTOM! VIOLENT SNAPBACK LOADING NOW! 🦅
📍 Trade Setup:
• Entry Zone: $0.012100 – $0.012200
• Stop Loss: $0.011499
• Target: $0.013617
• Sellers slammed into a brick wall at $0.011900, and buyers are already fighting back with fresh green candles off the floor.
• Our bottom momentum meter is sitting at an extreme 10.30, showing the downside is completely drained and ready to snap upward.
• We have a massive, wide-open gap with zero traffic all the way up to the blue moving average line right at $0.013617.
Slide your Stop Loss right up to Break-Even the moment this trade climbs +3% to +4% in profit to lock in a completely risk-free ride.
My entry is filled and I am riding this reversal from the bottom. Who else is catching this move with me? Drop a comment below! 👇
#W #WUSDT #CryptoTrading #Altcoins
📍 Trade Setup:
• Entry Zone: $0.012100 – $0.012200
• Stop Loss: $0.011499
• Target: $0.013617
• Sellers slammed into a brick wall at $0.011900, and buyers are already fighting back with fresh green candles off the floor.
• Our bottom momentum meter is sitting at an extreme 10.30, showing the downside is completely drained and ready to snap upward.
• We have a massive, wide-open gap with zero traffic all the way up to the blue moving average line right at $0.013617.
Slide your Stop Loss right up to Break-Even the moment this trade climbs +3% to +4% in profit to lock in a completely risk-free ride.
My entry is filled and I am riding this reversal from the bottom. Who else is catching this move with me? Drop a comment below! 👇
#W #WUSDT #CryptoTrading #Altcoins
206
Log in to explore more content
Join global crypto users on Binance Square
⚡️ Get latest and useful information about crypto.
💬 Trusted by the world’s largest crypto exchange.
👍 Discover real insights from verified creators.
Email / Phone number
Trending Topics
1
#BinanceReopensWithdrawalsForMoreAssets
758,185 views
4,158 Discussing
2
#Binance98PercentReplenished
134,228 views
1,567 Discussing
3
#USStocksSlipandCryptoMarketUnderBroadPressure
44 views
44 Discussing
4
#StrategySTRCResumesIssuanceAfterOver170Days
11,016 views
293 Discussing
5
#ADPUSPrivateEmployersAdd86000JobsInOctober
26,249 views
472 Discussing
6
#KazakhstanReportedlyInvests$100MInCryptoFunds
957 views
37 Discussing
7
#SouthKoreaSeeksCryptoTaxDelayUntil2029
15,575 views
198 Discussing
8
#USMidterms-WhatAreMarketsExpecting?
563,152 views
2,790 Discussing
9
#US10YearTreasuryYieldFallsTo4.845%
16,611 views
155 Discussing
10
#ZcashExpectsNU7ToMake$16MSproutZECInaccessible
1,086 views
18 Discussing