Binance Square
#spotsignal

spotsignal

866,261 views
1,314 Discussing
cat likes trading
·
--
Bullish
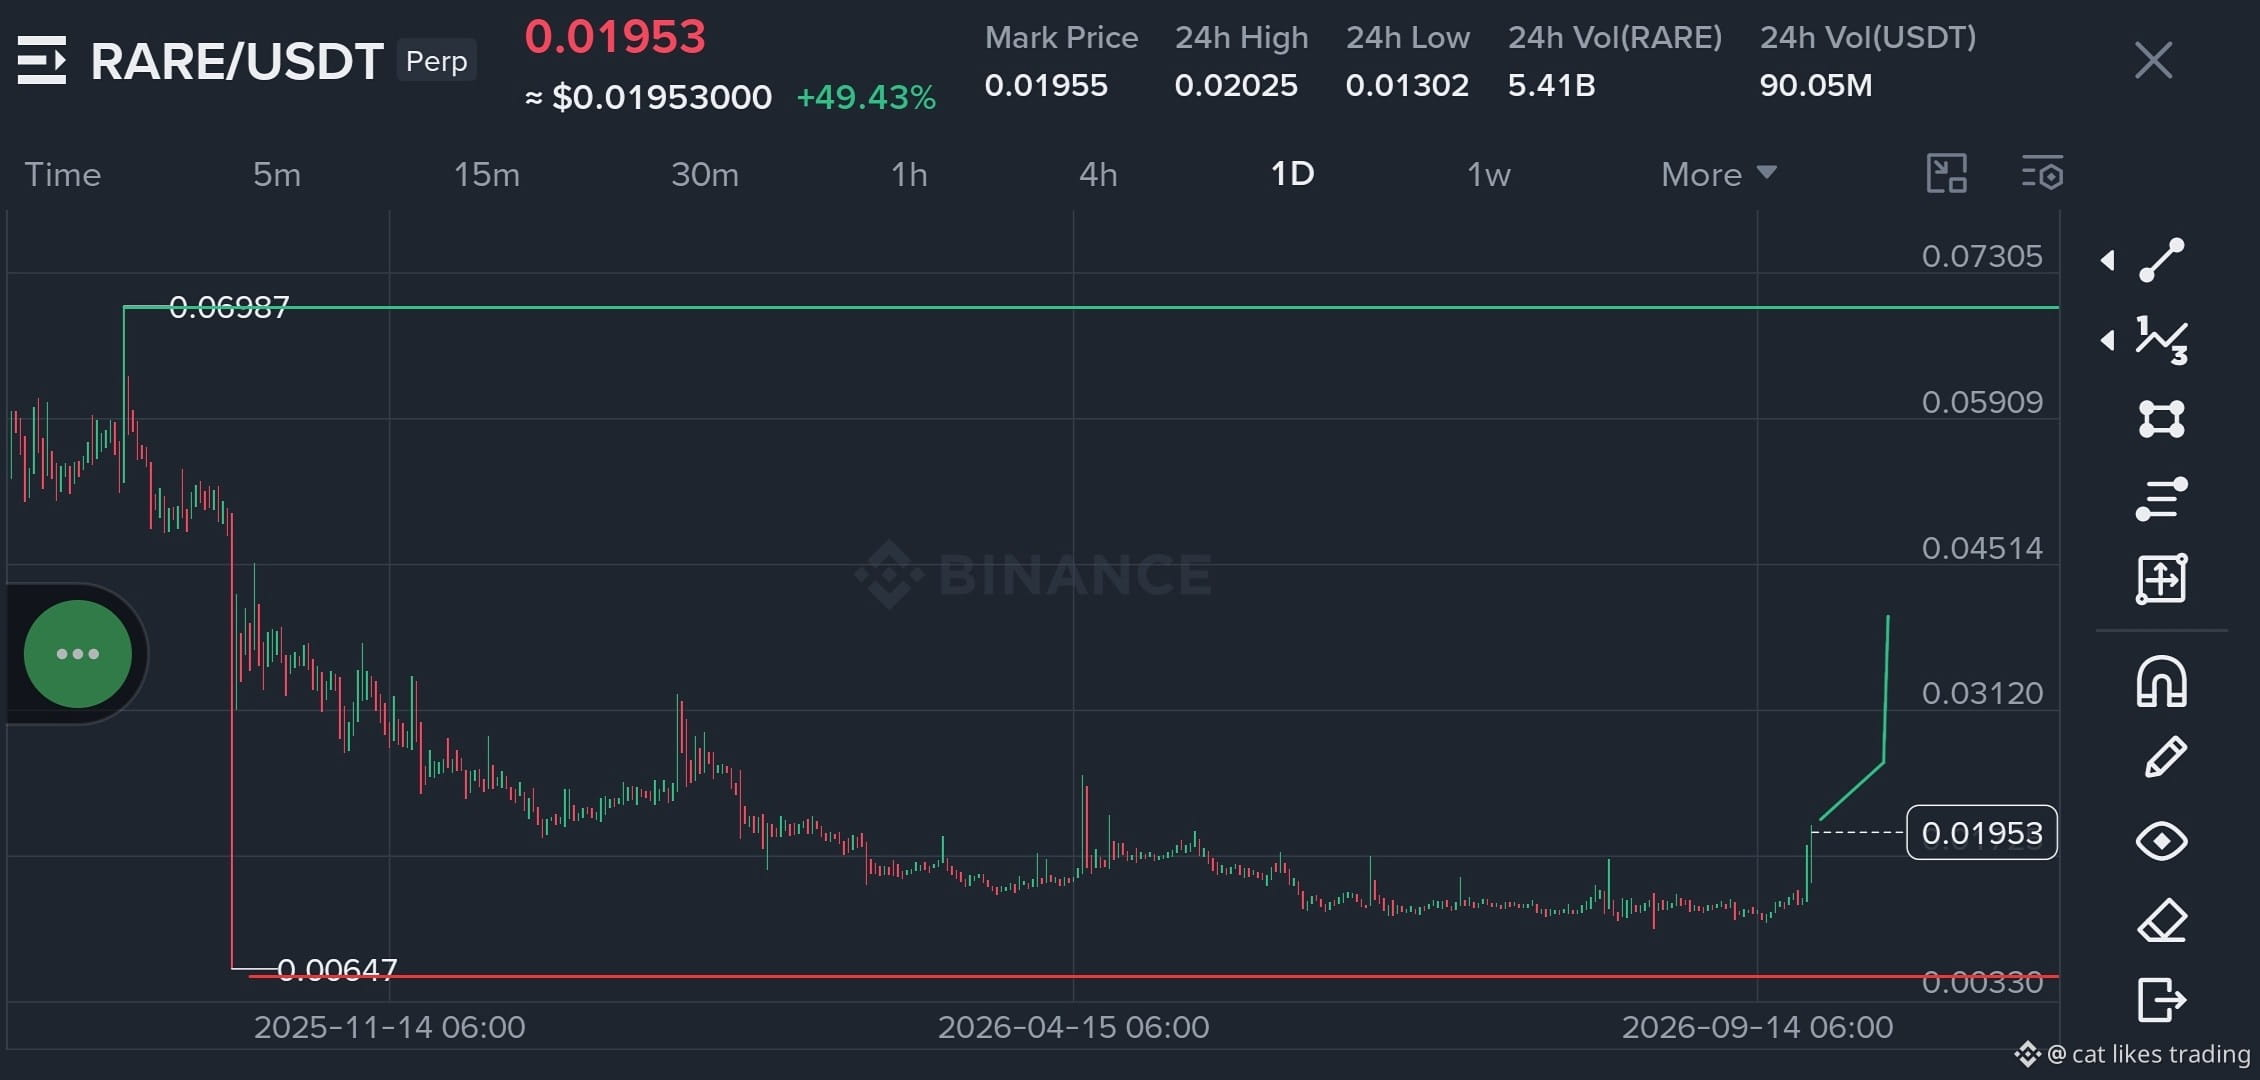
🚀 $RARE — $1 TARGET LOADING? 👀🔥 $RARE is showing strong momentum. I’m watching this one closely for a potential move toward $1. 💰 🟢 SPOT SIGNAL 🎯 Target: $1 💎 Big profit potential if momentum continues ⏳ Patience > FOMO DYOR & manage your risk. Never invest more than you can afford to lose. #RARE #crypto #SpotSignal
🚀 $RARE — $1 TARGET LOADING? 👀🔥

$RARE is showing strong momentum. I’m watching this one closely for a potential move toward $1. 💰

🟢 SPOT SIGNAL
🎯 Target: $1
💎 Big profit potential if momentum continues
⏳ Patience > FOMO

DYOR & manage your risk. Never invest more than you can afford to lose.

#RARE #crypto #SpotSignal
·
--
Bullish
🚨 $PROM — WAVE 2 COULD BE STARTING👀 PROM has finally broken out of its tightening triangle after a brief fakeout that shook out weaker holders. The price kept squeezing inside the pattern before making a cleaner breakout. Now, I’m watching for the next potential expansion. Wave 2 could be on the way. I'm buying here. 🎯 Targets: $5.90 → $6.20 → $7.00 → $7.60 → $9+ ❌ Invalidation: Daily close below $4.290 {spot}(PROMUSDT) Educational purposes only. NFA • DYOR Always follow proper risk management. #PROM #spotsignal
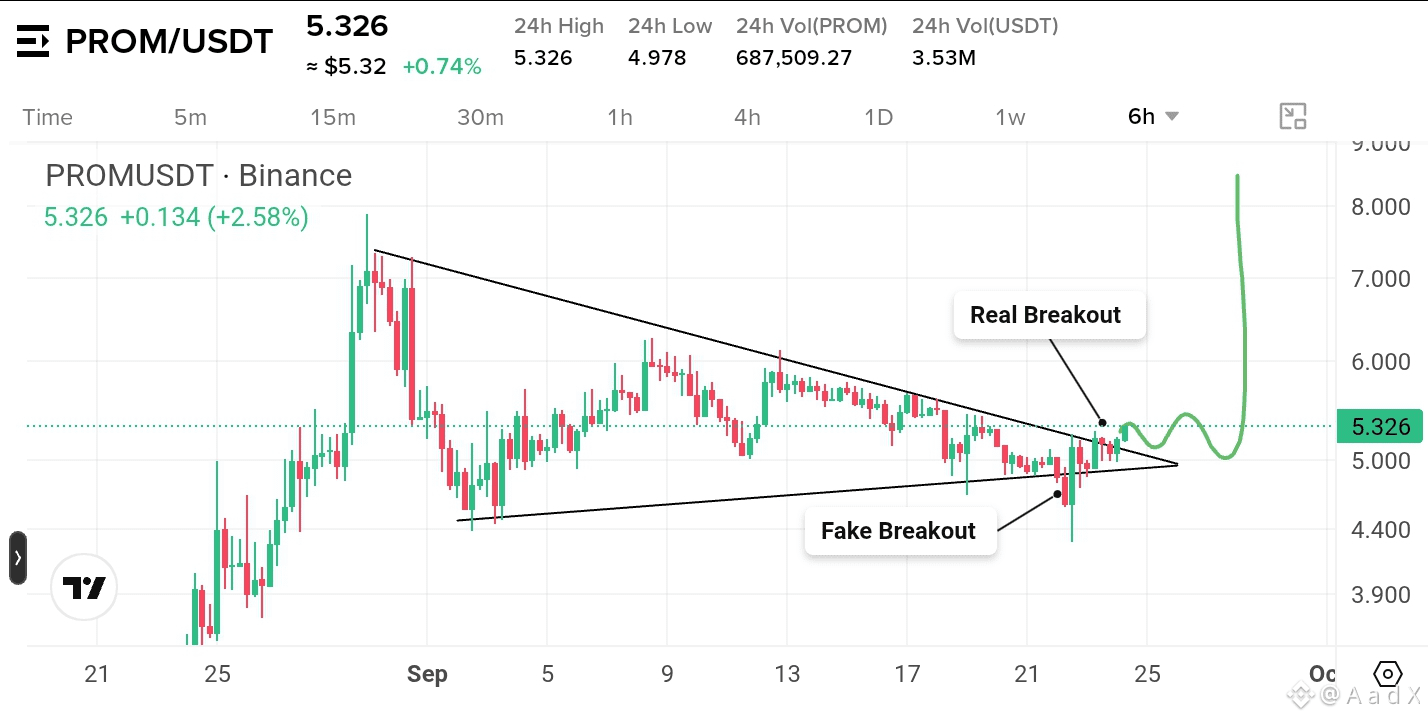
🚨 $PROM — WAVE 2 COULD BE STARTING👀

PROM has finally broken out of its tightening triangle after a brief fakeout that shook out weaker holders.

The price kept squeezing inside the pattern before making a cleaner breakout. Now, I’m watching for the next potential expansion.

Wave 2 could be on the way.

I'm buying here.

🎯 Targets: $5.90 → $6.20 → $7.00 → $7.60 → $9+

❌ Invalidation: Daily close below $4.290


Educational purposes only. NFA • DYOR Always follow proper risk management.

#PROM #spotsignal
·
--
Bullish
🚨 $CFX BREAKOUT DONE👀 After 4 months of selling and consolidation, CFX has finally broken its key resistance and is holding the breakout. We saw a lower low in August, followed by 2 rejections from resistance. This time, buyers broke through cleanly. From here, #CFX can continue directly higher or retest the breakout zone before the next leg up. Layer 1/Layer 2 coins are seeing strong rotation, and CFX is now showing the kind of structure I want to see. I previously shared $SAGA & $PHA , both reaching 2X from my entries. CFX is now on my radar for a similar expansion. Historically, strong CFX moves have delivered 3X–8X, and the current structure is showing similarities. SL: Daily close below $0.4320 Short-term: +30% to +50% Long-term: 2X–5X {spot}(CFXUSDT) I’m personally in. Patience matters — I’m holding for the bigger move. Educational purposes only. NFA • DYOR Always follow proper risk management. #SpotTrader #spotsignal
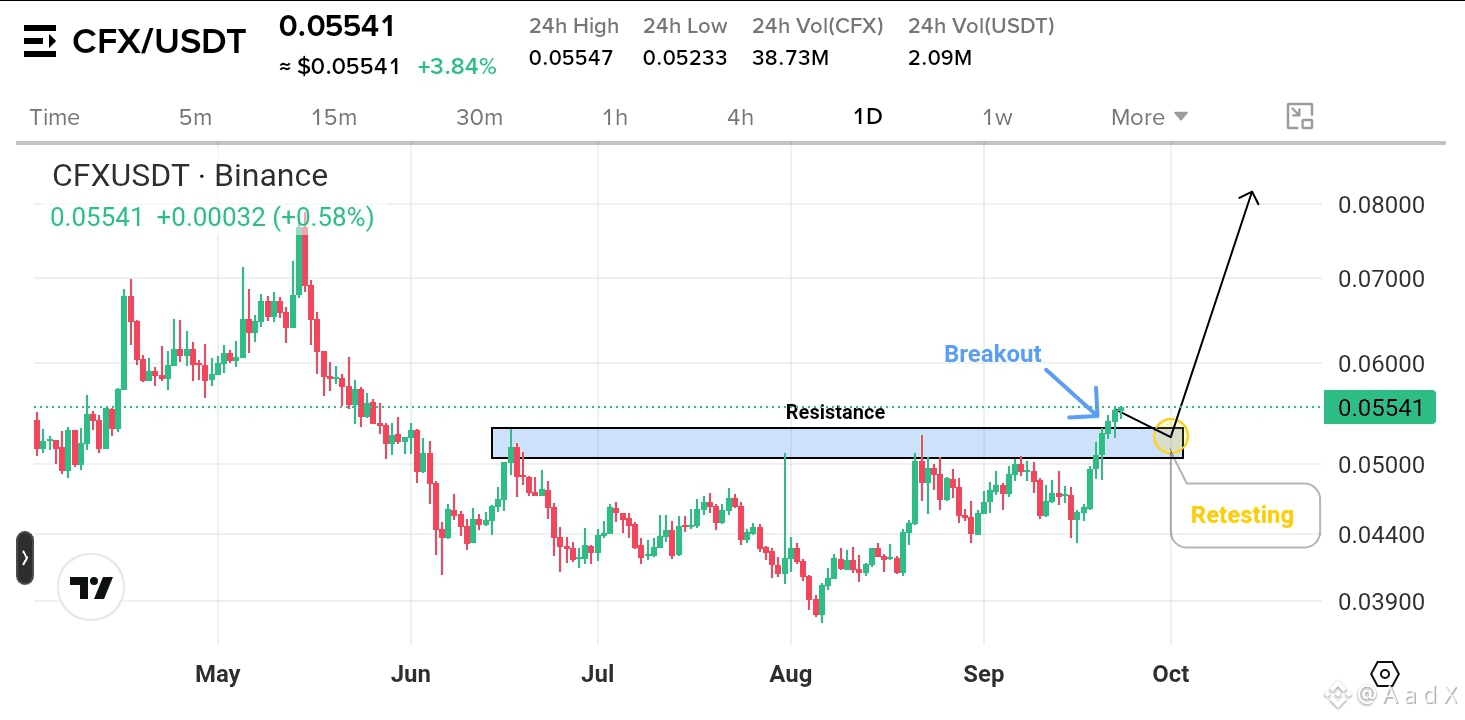
🚨 $CFX BREAKOUT DONE👀

After 4 months of selling and consolidation, CFX has finally broken its key resistance and is holding the breakout.

We saw a lower low in August, followed by 2 rejections from resistance. This time, buyers broke through cleanly.

From here, #CFX can continue directly higher or retest the breakout zone before the next leg up.

Layer 1/Layer 2 coins are seeing strong rotation, and CFX is now showing the kind of structure I want to see.

I previously shared $SAGA & $PHA , both reaching 2X from my entries. CFX is now on my radar for a similar expansion.

Historically, strong CFX moves have delivered 3X–8X, and the current structure is showing similarities.

SL: Daily close below $0.4320
Short-term: +30% to +50%
Long-term: 2X–5X


I’m personally in. Patience matters — I’m holding for the bigger move.

Educational purposes only. NFA • DYOR
Always follow proper risk management.

#SpotTrader #spotsignal
Where to Start? $BNB - A Spot-Market Option for Crypto Beginners BNB is one of the key tokens to consider for spot trading, especially if you are looking to enter cryptocurrency trading without leverage. $BNB plays a central role within the Binance ecosystem and BNB Chain, providing trading fee discounts and access to various ecosystem utilities on Binance. For Beginners, Spot Trading Comes First If you are new to crypto, jumping straight into futures and leverage trading is rarely advisable: Spot Market: You purchase and own the actual underlying asset to hold in your portfolio. Unlike leveraged trading, spot positions carry no risk of forced liquidation caused by adverse price swings. Futures Market: While futures allow traders to profit from both rising and falling markets, leverage amplifies potential losses just as fast as potential gains. For beginner market participants, starting with spot trading is typically the most prudent approach: select a few established assets, set a strict risk budget you are willing to invest, and build market familiarity over time. Core Rule: Focus first on capital preservation and risk management before attempting to scale returns. Are you starting out on the spot market, or did you dive straight into futures? #start #spotsignal #bnb
Where to Start?
$BNB - A Spot-Market Option for Crypto Beginners
BNB is one of the key tokens to consider for spot trading, especially if you are looking to enter cryptocurrency trading without leverage. $BNB plays a central role within the Binance ecosystem and BNB Chain, providing trading fee discounts and access to various ecosystem utilities on Binance.
For Beginners, Spot Trading Comes First If you are new to crypto, jumping straight into futures and leverage trading is rarely advisable:
Spot Market: You purchase and own the actual underlying asset to hold in your portfolio. Unlike leveraged trading, spot positions carry no risk of forced liquidation caused by adverse price swings.
Futures Market: While futures allow traders to profit from both rising and falling markets, leverage amplifies potential losses just as fast as potential gains.
For beginner market participants, starting with spot trading is typically the most prudent approach: select a few established assets, set a strict risk budget you are willing to invest, and build market familiarity over time.
Core Rule: Focus first on capital preservation and risk management before attempting to scale returns.
Are you starting out on the spot market, or did you dive straight into futures?
#start #spotsignal #bnb
·
--
Bearish
🔥 $SYN Is Massive Today! Will It Break $0.1612 Again? 🚀 {spot}(SYNUSDT) 👇 Massive +64% Pump! Is SYN Ready For Another Leg Up? Spot Signal! 👇 The chart for #SYN is looking absolutely explosive, sitting comfortably at the top of the gainers list with a jaw-dropping +64.63% surge today! After pumping violently to a local high of $0.1612, the price is undergoing a minor, healthy consolidation just below the upper Bollinger Band. With the 1-hour RSI sitting at a cooled-down, healthy 68.07, the token remains highly bullish with plenty of fuel left for another continuation wave. Please note the "Monitoring" tag on this asset, which means price action can be exceptionally fast and volatile! Here is the complete risk-managed setup for spot traders looking to capture the next pump: 🔍 Trading Plan (Spot Only): 📥 Entry Zone: $0.1250 - $0.1375 (Do not FOMO at the very top; accumulate around current price down towards the near-term support) 🎯 Take Profit 1: $0.1500 (Immediate psychological re-test) 🎯 Take Profit 2: $0.1610 (Recent local high target) 🎯 Take Profit 3: $0.1850+ (Macro breakout extension) 🚫 Stop Loss: $0.1120 (Based on a 1-hour candle close below the middle Bollinger band support) 💡 Pro Tip: Due to the Monitoring Tag, volatility will be extreme. To trade safely, do not go all-in with a single market order. Divide your capital into 2 to 3 staggered limit orders across the entry zone to secure a solid average price. 💬 What is your target? Will SYN smash past $0.16 this session, or is the pump over? Share your thoughts and charts in the comments below! 👇 #SYN #CryptoTrading #Altcoins #spotsignal #TechnicalAnalysis #BinanceSquare #CryptoGainer
🔥 $SYN Is Massive Today! Will It Break $0.1612 Again? 🚀


👇 Massive +64% Pump! Is SYN Ready For Another Leg Up? Spot Signal! 👇

The chart for #SYN is looking absolutely explosive, sitting comfortably at the top of the gainers list with a jaw-dropping +64.63% surge today! After pumping violently to a local high of $0.1612, the price is undergoing a minor, healthy consolidation just below the upper Bollinger Band. With the 1-hour RSI sitting at a cooled-down, healthy 68.07, the token remains highly bullish with plenty of fuel left for another continuation wave.

Please note the "Monitoring" tag on this asset, which means price action can be exceptionally fast and volatile!

Here is the complete risk-managed setup for spot traders looking to capture the next pump:

🔍 Trading Plan (Spot Only):

📥 Entry Zone: $0.1250 - $0.1375 (Do not FOMO at the very top; accumulate around current price down towards the near-term support)

🎯 Take Profit 1: $0.1500 (Immediate psychological re-test)

🎯 Take Profit 2: $0.1610 (Recent local high target)

🎯 Take Profit 3: $0.1850+ (Macro breakout extension)

🚫 Stop Loss: $0.1120 (Based on a 1-hour candle close below the middle Bollinger band support)

💡 Pro Tip: Due to the Monitoring Tag, volatility will be extreme. To trade safely, do not go all-in with a single market order. Divide your capital into 2 to 3 staggered limit orders across the entry zone to secure a solid average price.

💬 What is your target? Will SYN smash past $0.16 this session, or is the pump over? Share your thoughts and charts in the comments below! 👇

#SYN #CryptoTrading #Altcoins #spotsignal #TechnicalAnalysis #BinanceSquare #CryptoGainer
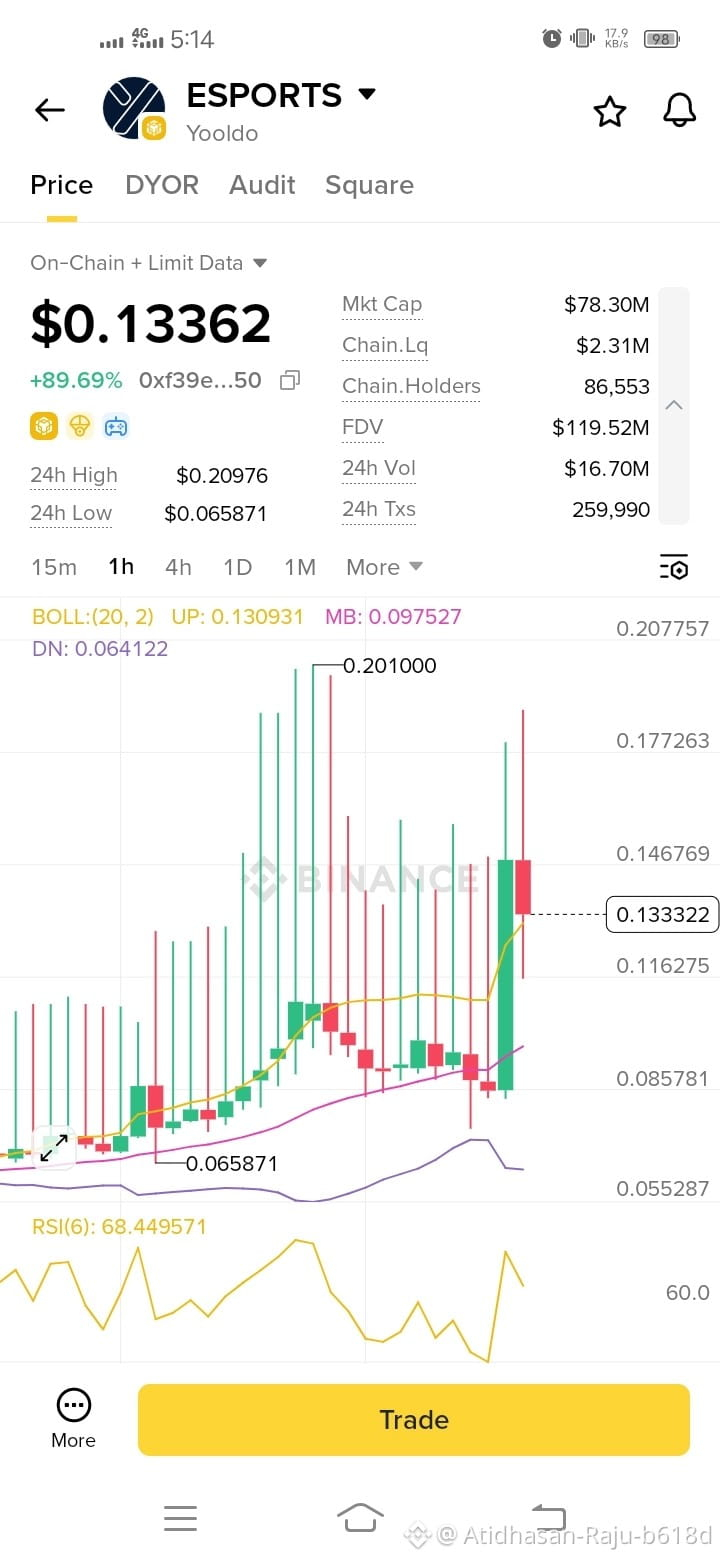
🔥 $ESPORTS Massive Breakout! Is It Time to Ride the Wave? 📈 Hey Binancians! 👋 Take a look at this chart. $ESPORTS (Yooldo) is showing highly volatile, bullish momentum with a massive +89.69% pump today! It recently pushed past the Middle Bollinger Band (MB: 0.0975) and is trading right around the Upper Band. The RSI (6) is sitting at 68.44, indicating strong buying pressure without being completely overbought yet. {alpha}(560xf39e4b21c84e737df08e2c3b32541d856f508e48) This looks like a solid setup for a Spot Swing Trade, but watch out for a potential retest before the next leg up! 🎯 Spot Trading Setup: Entry Zone: $0.1150 - $0.1280 (Look for entries on minor pullbacks) Take Profit 1 (TP1): $0.1460 Take Profit 2 (TP2): $0.1770 Take Profit 3 (TP3): $0.2000+ (Major resistance target) Stop Loss (SL): $0.0950 (Below the daily support and middle band) ⚠️ Risk Reminder: This asset is highly volatile with wide candlestick wicks. Stick to Spot trading and manage your risk carefully! What do you think? Is $ESPORTS hitting $0.25 next, or are we seeing a correction soon? Let me know your thoughts in the comments below! 👇💬 #esports #CryptoTrading #SpotSignal #TechnicalAnalysiss #BinanceSquareFamily
🔥 $ESPORTS Massive Breakout! Is It Time to Ride the Wave? 📈

Hey Binancians! 👋

Take a look at this chart. $ESPORTS (Yooldo) is showing highly volatile, bullish momentum with a massive +89.69% pump today! It recently pushed past the Middle Bollinger Band (MB: 0.0975) and is trading right around the Upper Band. The RSI (6) is sitting at 68.44, indicating strong buying pressure without being completely overbought yet.


This looks like a solid setup for a Spot Swing Trade, but watch out for a potential retest before the next leg up!

🎯 Spot Trading Setup:

Entry Zone: $0.1150 - $0.1280 (Look for entries on minor pullbacks)

Take Profit 1 (TP1): $0.1460

Take Profit 2 (TP2): $0.1770

Take Profit 3 (TP3): $0.2000+ (Major resistance target)

Stop Loss (SL): $0.0950 (Below the daily support and middle band)

⚠️ Risk Reminder: This asset is highly volatile with wide candlestick wicks. Stick to Spot trading and manage your risk carefully!

What do you think? Is $ESPORTS hitting $0.25 next, or are we seeing a correction soon? Let me know your thoughts in the comments below! 👇💬

#esports #CryptoTrading #SpotSignal #TechnicalAnalysiss #BinanceSquareFamily
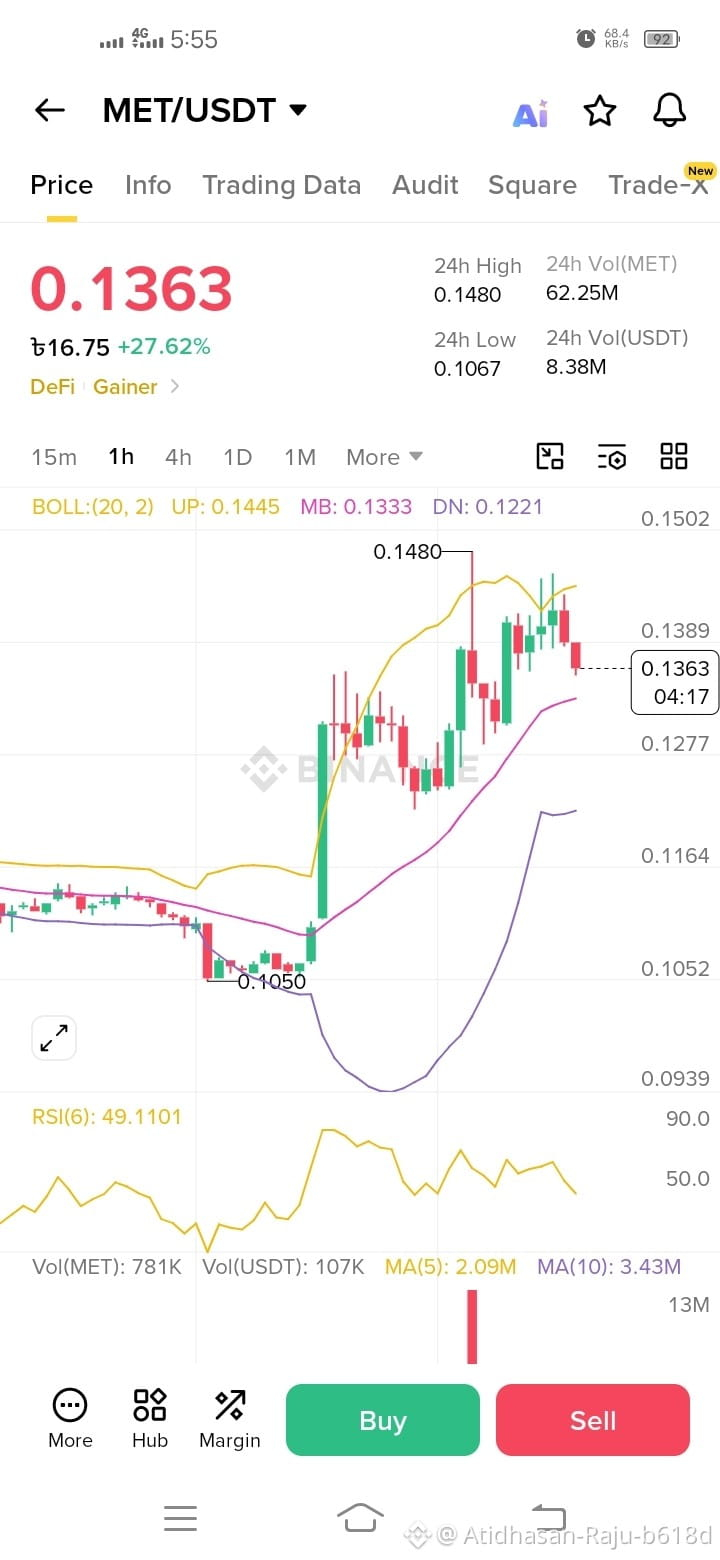
🔥 $MET /USDT Pullback Alert: Whales Are Quietly Loading Up again! 🔥👇 $MET {spot}(METUSDT) Healthy RSI Reset At $0.1363! Don't Miss This Spot Entry Setup! 👇The 1-hour chart for #MET (MET/USDT) is flashing an incredibly tight compression pattern, consolidating heavily right above its middle Bollinger Band ($0.1333)! After soaring over +27.62% and hitting a local high of $0.1480, the initial parabolic impulse has cooled down into a beautiful volatility squeeze, currently trading at $0.1363. With a massive 24-hour trading volume of 62.25M MET ($8.38M USDT), the asset has clearly captured institutional and whale-level interest. The 1-hour RSI has successfully reset to a perfectly healthy and neutral 49.11, giving the bulls massive fuel for another leg up without the risk of being overbought. If buyers can push the price to clear the upper Bollinger Band ($0.1445), a rapid continuation toward new highs is expected. Here is the complete risk-managed setup for spot traders looking to trade this momentum safely: 🔍 Trading Plan (Spot Only): 📥 Entry Zone: $0.1310 - $0.1360 (Scale into positions calmly inside this pullback consolidation zone rather than chasing green candles) 🎯 Take Profit 1: $0.1440 (Immediate upper Bollinger Band resistance re-test) 🎯 Take Profit 2: $0.1480 (Recent 24h high target) 🎯 Take Profit 3: $0.1600+ (Macro breakout expansion peak) 🚫 Stop Loss: $0.1210 (Based on an hourly candle close below the lower Bollinger Band structural support) 💡 Pro Tip: Squeeze plays following a massive volume surge offer exceptional risk-to-reward ratios. Do not deploy 100% of your planned capital via a market order during brief volatility spikes. Utilize staggered limit buy orders across the entry zone to manage your risk profiles efficiently. 💬 What is your target? Will $MET break upward and shatter past $0.150 this week, or face a deeper correction? Drop your thoughts below! 👇 #MET #cryptotrading #defi #SpotSignal #TechnicalAnalysis #BinanceSquare #BreakoutSqueeze
🔥 $MET /USDT Pullback Alert: Whales Are Quietly Loading Up again! 🔥👇 $MET

Healthy RSI Reset At $0.1363! Don't Miss This Spot Entry Setup!

👇The 1-hour chart for #MET (MET/USDT) is flashing an incredibly tight compression pattern, consolidating heavily right above its middle Bollinger Band ($0.1333)! After soaring over +27.62% and hitting a local high of $0.1480, the initial parabolic impulse has cooled down into a beautiful volatility squeeze, currently trading at $0.1363.

With a massive 24-hour trading volume of 62.25M MET ($8.38M USDT), the asset has clearly captured institutional and whale-level interest. The 1-hour RSI has successfully reset to a perfectly healthy and neutral 49.11, giving the bulls massive fuel for another leg up without the risk of being overbought. If buyers can push the price to clear the upper Bollinger Band ($0.1445), a rapid continuation toward new highs is expected.

Here is the complete risk-managed setup for spot traders looking to trade this momentum safely:

🔍 Trading Plan (Spot Only):
📥 Entry Zone: $0.1310 - $0.1360 (Scale into positions calmly inside this pullback consolidation zone rather than chasing green candles)
🎯 Take Profit 1: $0.1440 (Immediate upper Bollinger Band resistance re-test)
🎯 Take Profit 2: $0.1480 (Recent 24h high target)
🎯 Take Profit 3: $0.1600+ (Macro breakout expansion peak)
🚫 Stop Loss: $0.1210 (Based on an hourly candle close below the lower Bollinger Band structural support)

💡 Pro Tip: Squeeze plays following a massive volume surge offer exceptional risk-to-reward ratios. Do not deploy 100% of your planned capital via a market order during brief volatility spikes. Utilize staggered limit buy orders across the entry zone to manage your risk profiles efficiently.

💬 What is your target? Will $MET break upward and shatter past $0.150 this week, or face a deeper correction? Drop your thoughts below! 👇

#MET #cryptotrading #defi #SpotSignal #TechnicalAnalysis #BinanceSquare #BreakoutSqueeze
📉 $MYX Bottom Is In? Perfect Buy-The-Dip Opportunity! 🚀 {alpha}(560xd82544bf0dfe8385ef8fa34d67e6e4940cc63e16) 👇 Up +15.61% Off The Lows! Oversold Reversal Alert! Spot Setup Inside! 👇 The daily chart for #MYX (MYX Finance) is screaming a massive oversold relief bounce! After a long, aggressive downtrend that bottomed out at $0.1262, the price has finally printed a strong green daily reversal candle. The 1-day RSI is deeply oversold but curling up fiercely at 30.71, indicating that the intense selling momentum has completely exhausted itself and major buyers are stepping back in at a bargain. With a highly attractive market cap sitting right at $49.45M, this low-cap asset has immense vertical room to recover toward its moving averages. Here is the complete risk-managed setup for spot traders looking to ride this reversal: 🔍 Trading Plan (Spot Only): 📥 Entry Zone: $0.1380 - $0.1510 (Accumulate around the current market price or look for minor re-tests of the daily low floor) 🎯 Take Profit 1: $0.1850 (Immediate near-term key resistance) 🎯 Take Profit 2: $0.2250 (Major test line near the Middle Bollinger Band) 🎯 Take Profit 3: $0.2900+ (Macro trend reversal expansion peak) 🚫 Stop Loss: $0.1200 (Based on a daily candle close below the macro swing bottom) 💡 Pro Tip: Catching falling knives can be risky, but buying right when the daily RSI turns up from the 30-oversold line gives you one of the tightest and most mathematical risk-to-reward structures available. Stagger your buy orders inside the zone to balance your entry price. 💬 What is your target? Will MYX sustain this massive bottom bounce and rally past $0.20 this week, or make a new low? Drop your votes below! 👇 #MYX #MYXFinance #CryptoTrading #spotsignal #TechnicalAnalysis #BinanceSquare #OversoldBounce
📉 $MYX Bottom Is In? Perfect Buy-The-Dip Opportunity! 🚀


👇 Up +15.61% Off The Lows! Oversold Reversal Alert! Spot Setup Inside! 👇

The daily chart for #MYX (MYX Finance) is screaming a massive oversold relief bounce! After a long, aggressive downtrend that bottomed out at $0.1262, the price has finally printed a strong green daily reversal candle. The 1-day RSI is deeply oversold but curling up fiercely at 30.71, indicating that the intense selling momentum has completely exhausted itself and major buyers are stepping back in at a bargain.

With a highly attractive market cap sitting right at $49.45M, this low-cap asset has immense vertical room to recover toward its moving averages.

Here is the complete risk-managed setup for spot traders looking to ride this reversal:

🔍 Trading Plan (Spot Only):

📥 Entry Zone: $0.1380 - $0.1510 (Accumulate around the current market price or look for minor re-tests of the daily low floor)

🎯 Take Profit 1: $0.1850 (Immediate near-term key resistance)

🎯 Take Profit 2: $0.2250 (Major test line near the Middle Bollinger Band)

🎯 Take Profit 3: $0.2900+ (Macro trend reversal expansion peak)

🚫 Stop Loss: $0.1200 (Based on a daily candle close below the macro swing bottom)

💡 Pro Tip: Catching falling knives can be risky, but buying right when the daily RSI turns up from the 30-oversold line gives you one of the tightest and most mathematical risk-to-reward structures available. Stagger your buy orders inside the zone to balance your entry price.

💬 What is your target? Will MYX sustain this massive bottom bounce and rally past $0.20 this week, or make a new low? Drop your votes below! 👇

#MYX #MYXFinance #CryptoTrading #spotsignal #TechnicalAnalysis #BinanceSquare #OversoldBounce
🔥 $NVDAB Rallying Hard! Will It Break New Highs Next? 🚀 👇 Steady Bullish Continuation! NVDAB Spot Signal Inside! 👇 {spot}(NVDABUSDT) The chart for #NVDAB shows a very clean and strong bullish structure. After a sharp bounce from the $203.98 local bottom, the price has consistently printed green candles, cleanly breaking above the middle Bollinger Band ($208.68) and testing the upper band limit. Currently trading at 210.34, the 1-hour RSI is at a healthy 59.56, which indicates strong upward momentum with plenty of room left before hitting overbought conditions. Note the "bStocks" tag on this asset, meaning it follows unique market mechanics—making precise risk management essential! Here is the complete setup for spot traders looking to capture this continuation: 🔍 Trading Plan (Spot Only): 📥 Entry Zone: $206.50 - $210.50 (Accumulate around the current market price or look for small dips closer to the middle band support) 🎯 Take Profit 1: $215.00 (Immediate breakout target) 🎯 Take Profit 2: $222.00 (Mid-term psychological resistance) 🎯 Take Profit 3: $230.00+ (Macro bullish extension peak) 🚫 Stop Loss: $201.00 (Based on a 1-hour candle close below the recent swing support) 💡 Pro Tip: Bullish trends that find support above the middle Bollinger band tend to carry high continuation probability. To lower your risk, do not buy everything in a single order; divide your entries across the zone using limit orders. 💬 What do you think? Will $NVDAB crush past $211.53 this session, or pull back to retest the middle band? Let me know your trade predictions below! 👇 #NVDAB #CryptoTrading #bStocks #SpotSignal #TechnicalAnalysis #BinanceSquare #BullishTrend
🔥 $NVDAB Rallying Hard! Will It Break New Highs Next? 🚀

👇 Steady Bullish Continuation! NVDAB Spot Signal Inside! 👇


The chart for #NVDAB shows a very clean and strong bullish structure. After a sharp bounce from the $203.98 local bottom, the price has consistently printed green candles, cleanly breaking above the middle Bollinger Band ($208.68) and testing the upper band limit. Currently trading at 210.34, the 1-hour RSI is at a healthy 59.56, which indicates strong upward momentum with plenty of room left before hitting overbought conditions.

Note the "bStocks" tag on this asset, meaning it follows unique market mechanics—making precise risk management essential!

Here is the complete setup for spot traders looking to capture this continuation:

🔍 Trading Plan (Spot Only):

📥 Entry Zone: $206.50 - $210.50 (Accumulate around the current market price or look for small dips closer to the middle band support)

🎯 Take Profit 1: $215.00 (Immediate breakout target)

🎯 Take Profit 2: $222.00 (Mid-term psychological resistance)

🎯 Take Profit 3: $230.00+ (Macro bullish extension peak)

🚫 Stop Loss: $201.00 (Based on a 1-hour candle close below the recent swing support)

💡 Pro Tip: Bullish trends that find support above the middle Bollinger band tend to carry high continuation probability. To lower your risk, do not buy everything in a single order; divide your entries across the zone using limit orders.

💬 What do you think? Will $NVDAB crush past $211.53 this session, or pull back to retest the middle band? Let me know your trade predictions below! 👇

#NVDAB #CryptoTrading #bStocks #SpotSignal #TechnicalAnalysis #BinanceSquare #BullishTrend
🔥 $MEGA Pump Incoming? Massive Breakout Re-test Pattern! 🚀 👇 Up +16% Today! Is $MEGA Ready For Another Leg Up? Spot Signal! 👇 {spot}(MEGAUSDT) The chart for #MEGA is looking very healthy as it holds strong positions on the top gainers list with a +16.63% increase today! After surging to a local high of $0.07142, the price is undergoing a classic, healthy correction. It is currently finding solid structural support right at the middle Bollinger Band ($0.06245). With the hourly RSI resting at a neutral 46.56, the overbought pressure has fully cooled down, setting up a perfect springboard for the next leg up. Here is the complete risk-managed setup for spot traders: 🔍 Trading Plan (Spot Only): 📥 Entry Zone: $0.05900 - $0.06385 (Accumulate near the current price and down toward the MB support level) 🎯 Take Profit 1: $0.07100 (Immediate resistance re-test target) 🎯 Take Profit 2: $0.08200 (Mid-term psychological target) 🎯 Take Profit 3: $0.09500+ (Macro expansion target) 🚫 Stop Loss: $0.05300 (Based on an hourly candle close below the recent swing low) 💡 Pro Tip: Buying the re-test of a moving average during an uptrend offers a very high risk-to-reward ratio. To play it safe, divide your funds into 2 to 3 buy orders within the entry zone to secure a great average entry price. 💬 What is your target? Will MEGA comfortably smash past $0.075 this week, or break below support? Drop your predictions below! 👇 #MEGA #CryptoTrading #Altcoins #spotsignal #TechnicalAnalysis #BinanceSquare #Infrastructure
🔥 $MEGA Pump Incoming? Massive Breakout Re-test Pattern! 🚀

👇 Up +16% Today! Is $MEGA Ready For Another Leg Up? Spot Signal! 👇


The chart for #MEGA is looking very healthy as it holds strong positions on the top gainers list with a +16.63% increase today! After surging to a local high of $0.07142, the price is undergoing a classic, healthy correction. It is currently finding solid structural support right at the middle Bollinger Band ($0.06245). With the hourly RSI resting at a neutral 46.56, the overbought pressure has fully cooled down, setting up a perfect springboard for the next leg up.

Here is the complete risk-managed setup for spot traders:

🔍 Trading Plan (Spot Only):

📥 Entry Zone: $0.05900 - $0.06385 (Accumulate near the current price and down toward the MB support level)

🎯 Take Profit 1: $0.07100 (Immediate resistance re-test target)

🎯 Take Profit 2: $0.08200 (Mid-term psychological target)

🎯 Take Profit 3: $0.09500+ (Macro expansion target)

🚫 Stop Loss: $0.05300 (Based on an hourly candle close below the recent swing low)

💡 Pro Tip: Buying the re-test of a moving average during an uptrend offers a very high risk-to-reward ratio. To play it safe, divide your funds into 2 to 3 buy orders within the entry zone to secure a great average entry price.

💬 What is your target? Will MEGA comfortably smash past $0.075 this week, or break below support? Drop your predictions below! 👇

#MEGA #CryptoTrading #Altcoins #spotsignal #TechnicalAnalysis #BinanceSquare #Infrastructure
Log in to explore more content
Join global crypto users on Binance Square
⚡️ Get latest and useful information about crypto.
💬 Trusted by the world’s largest crypto exchange.
👍 Discover real insights from verified creators.
Email / Phone number