
#tradingsignal
tradingsignal
12.6M views
53,750 Discussing
Hot
Latest

·
--
🔥 SOPHUSDT LONG setup validated!
BIAS: LONG | COMBINED SCORE: 52.61
Entry: 0.00105 | SL: 0.00102883 | TP1: 0.00108176 | TP2: 0.00110293
Bullish breakout confirmed by massive volume spikes and price momentum.
⚠️ This is a setup, not a guaranteed result.
Question: Are you watching SOPH for a breakout?
$SOPH #TradingSignal #CryptoAnalysis
🔥 SOPHUSDT LONG setup validated!
BIAS: LONG | COMBINED SCORE: 52.61
Entry: 0.00105 | SL: 0.00102883 | TP1: 0.00108176 | TP2: 0.00110293
Bullish breakout confirmed by massive volume spikes and price momentum.
⚠️ This is a setup, not a guaranteed result.
Question: Are you watching SOPH for a breakout?
$SOPH #TradingSignal #CryptoAnalysis
BIAS: LONG | COMBINED SCORE: 52.61
Entry: 0.00105 | SL: 0.00102883 | TP1: 0.00108176 | TP2: 0.00110293
Bullish breakout confirmed by massive volume spikes and price momentum.
⚠️ This is a setup, not a guaranteed result.
Question: Are you watching SOPH for a breakout?
$SOPH #TradingSignal #CryptoAnalysis

384

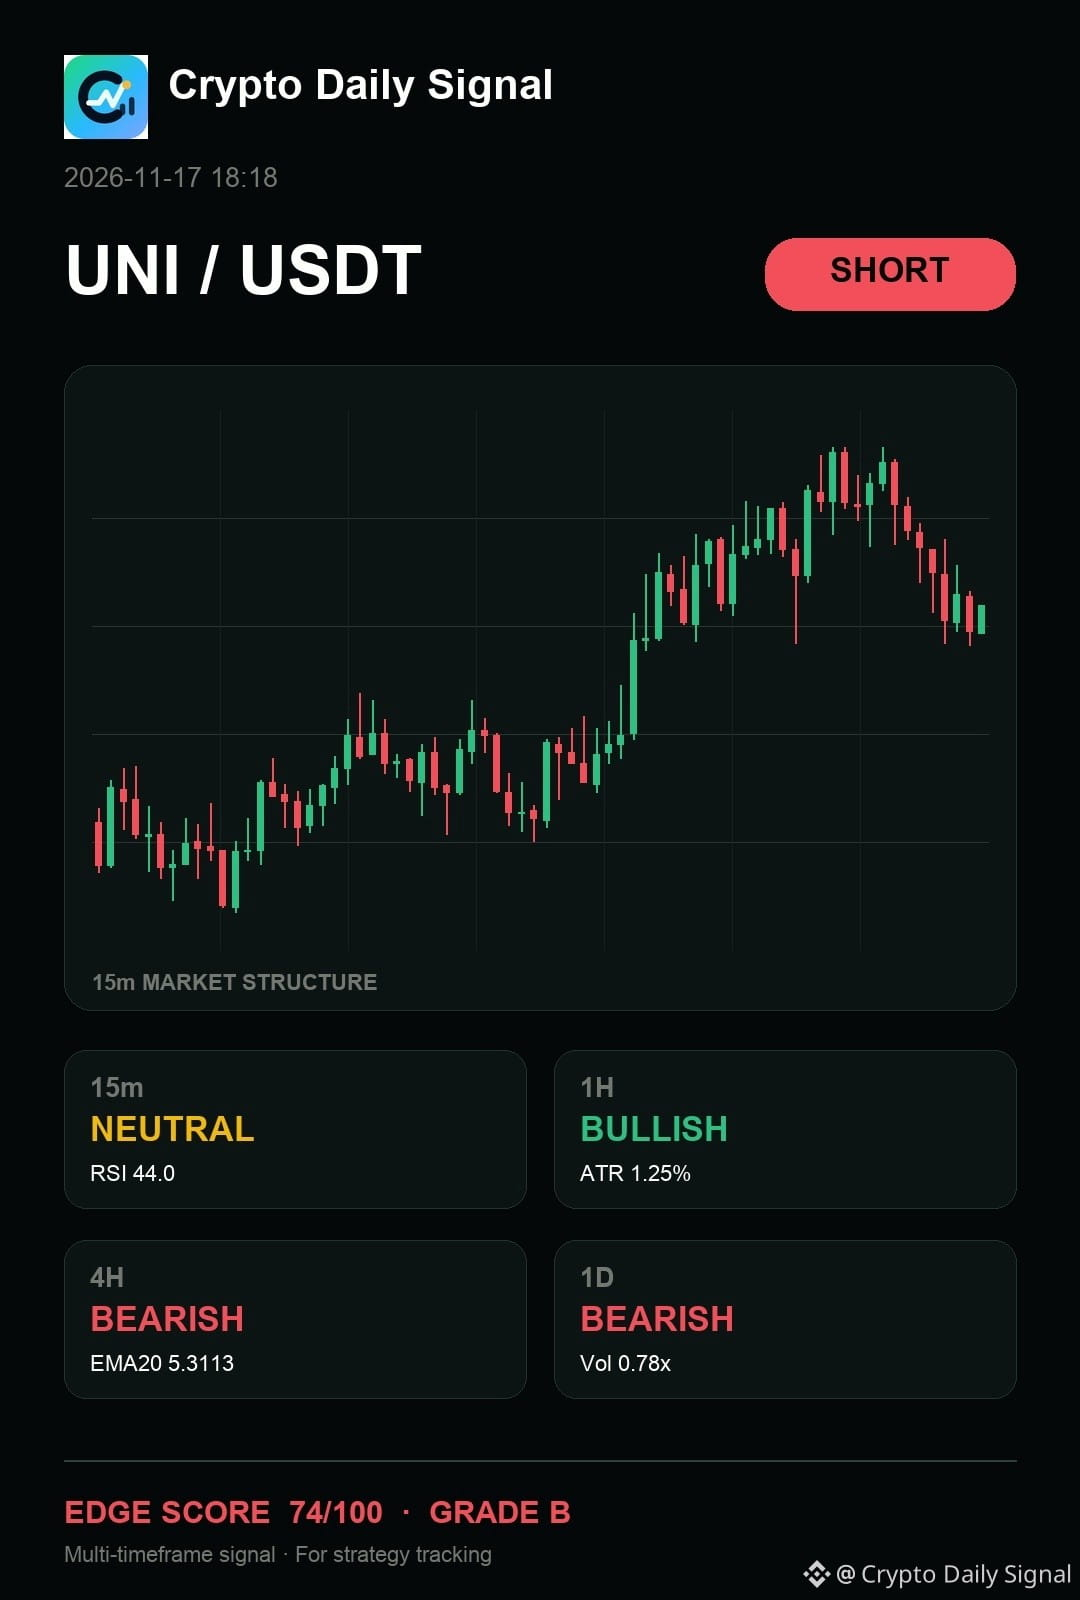
$UNI has not invalidated the short case because the daily and four-hour trends both point down despite short-term action being range-bound. The current rejection at the upper limit shows bearish intent, though a strong break above that short-term high would invalidate this view.
The map is useful only while the invalidation remains intact.
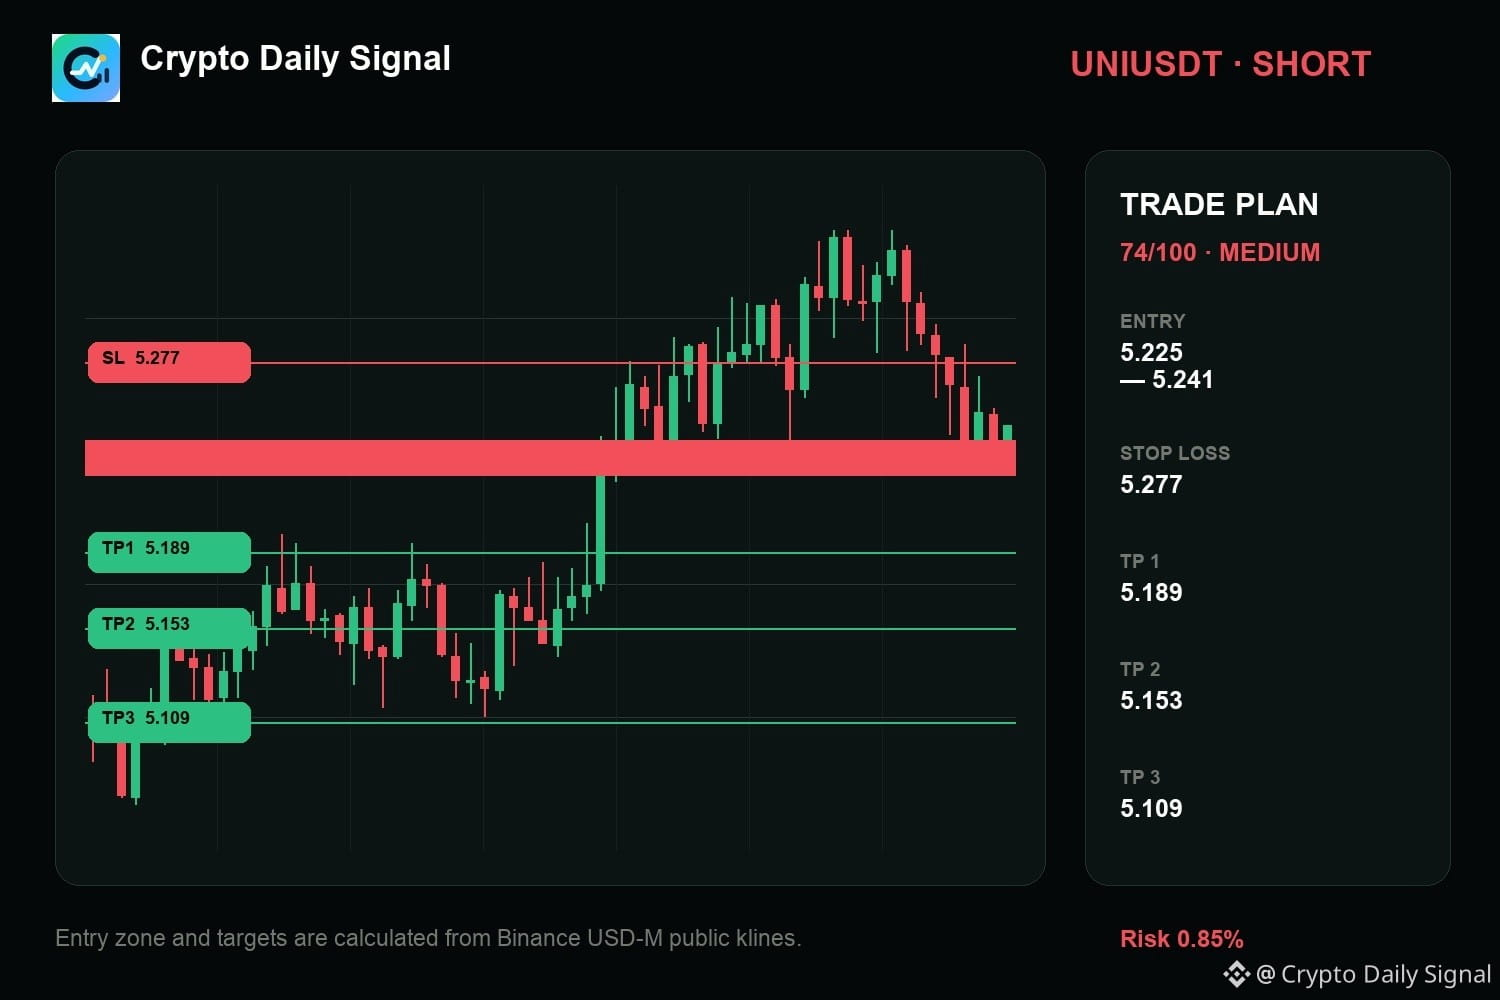
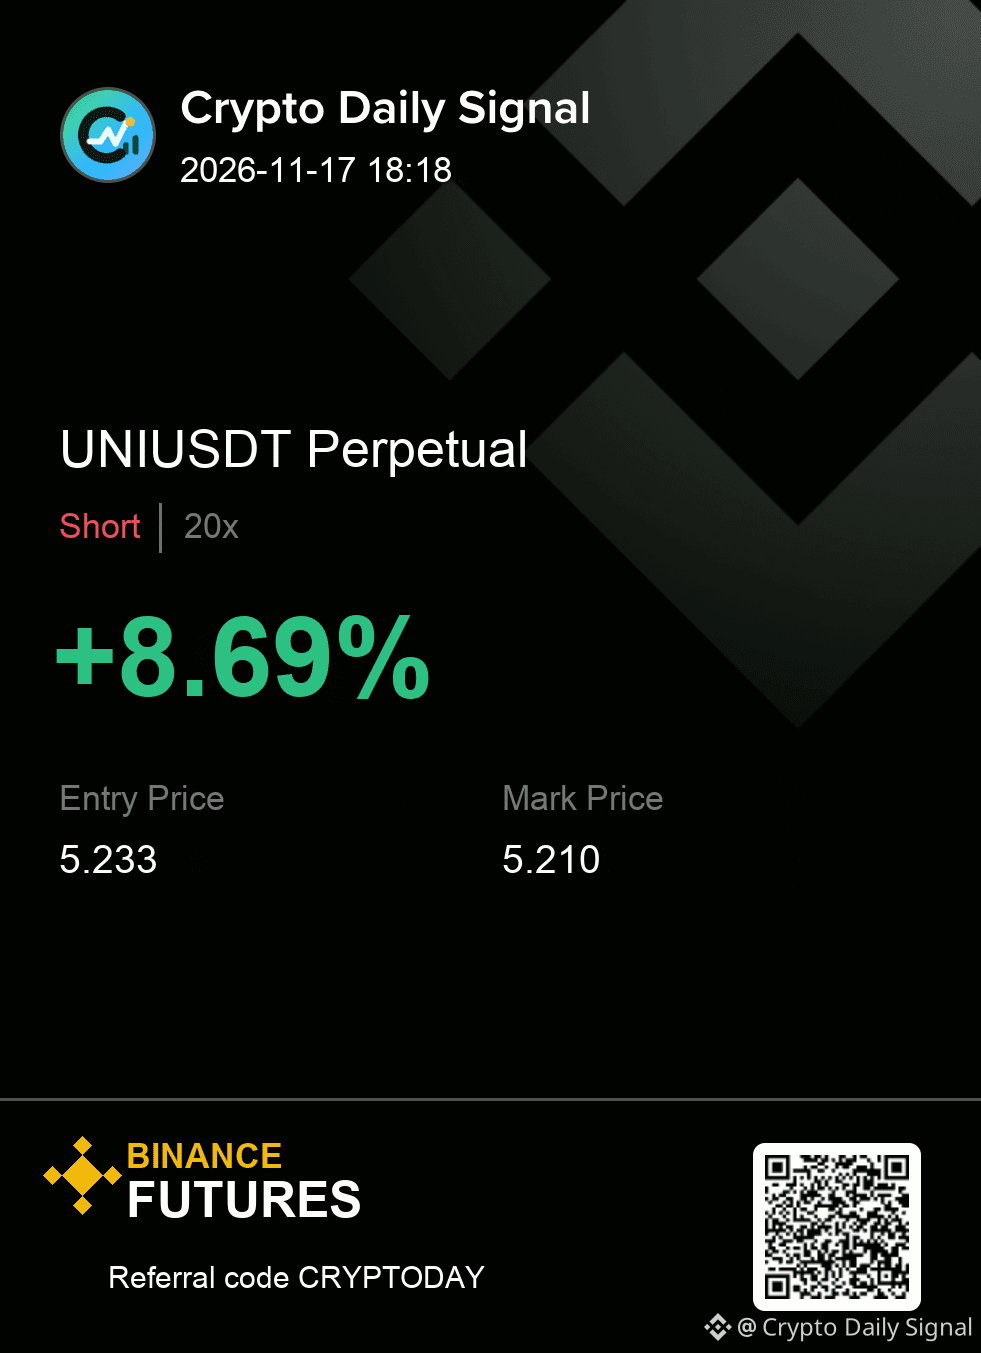
Execution plan (UNIUSDT — SHORT)
Entry: 5.225 - 5.241 | SL: 5.277
Take profit: 5.189 → 5.153 → 5.109
#TradingSignal
{future}(UNIUSDT)
$UNI has not invalidated the short case because the daily and four-hour trends both point down despite short-term action being range-bound. The current rejection at the upper limit shows bearish intent, though a strong break above that short-term high would invalidate this view.
The map is useful only while the invalidation remains intact.
Execution plan (UNIUSDT — SHORT)
Entry: 5.225 - 5.241 | SL: 5.277
Take profit: 5.189 → 5.153 → 5.109
#TradingSignal
The map is useful only while the invalidation remains intact.
Execution plan (UNIUSDT — SHORT)
Entry: 5.225 - 5.241 | SL: 5.277
Take profit: 5.189 → 5.153 → 5.109
#TradingSignal
10
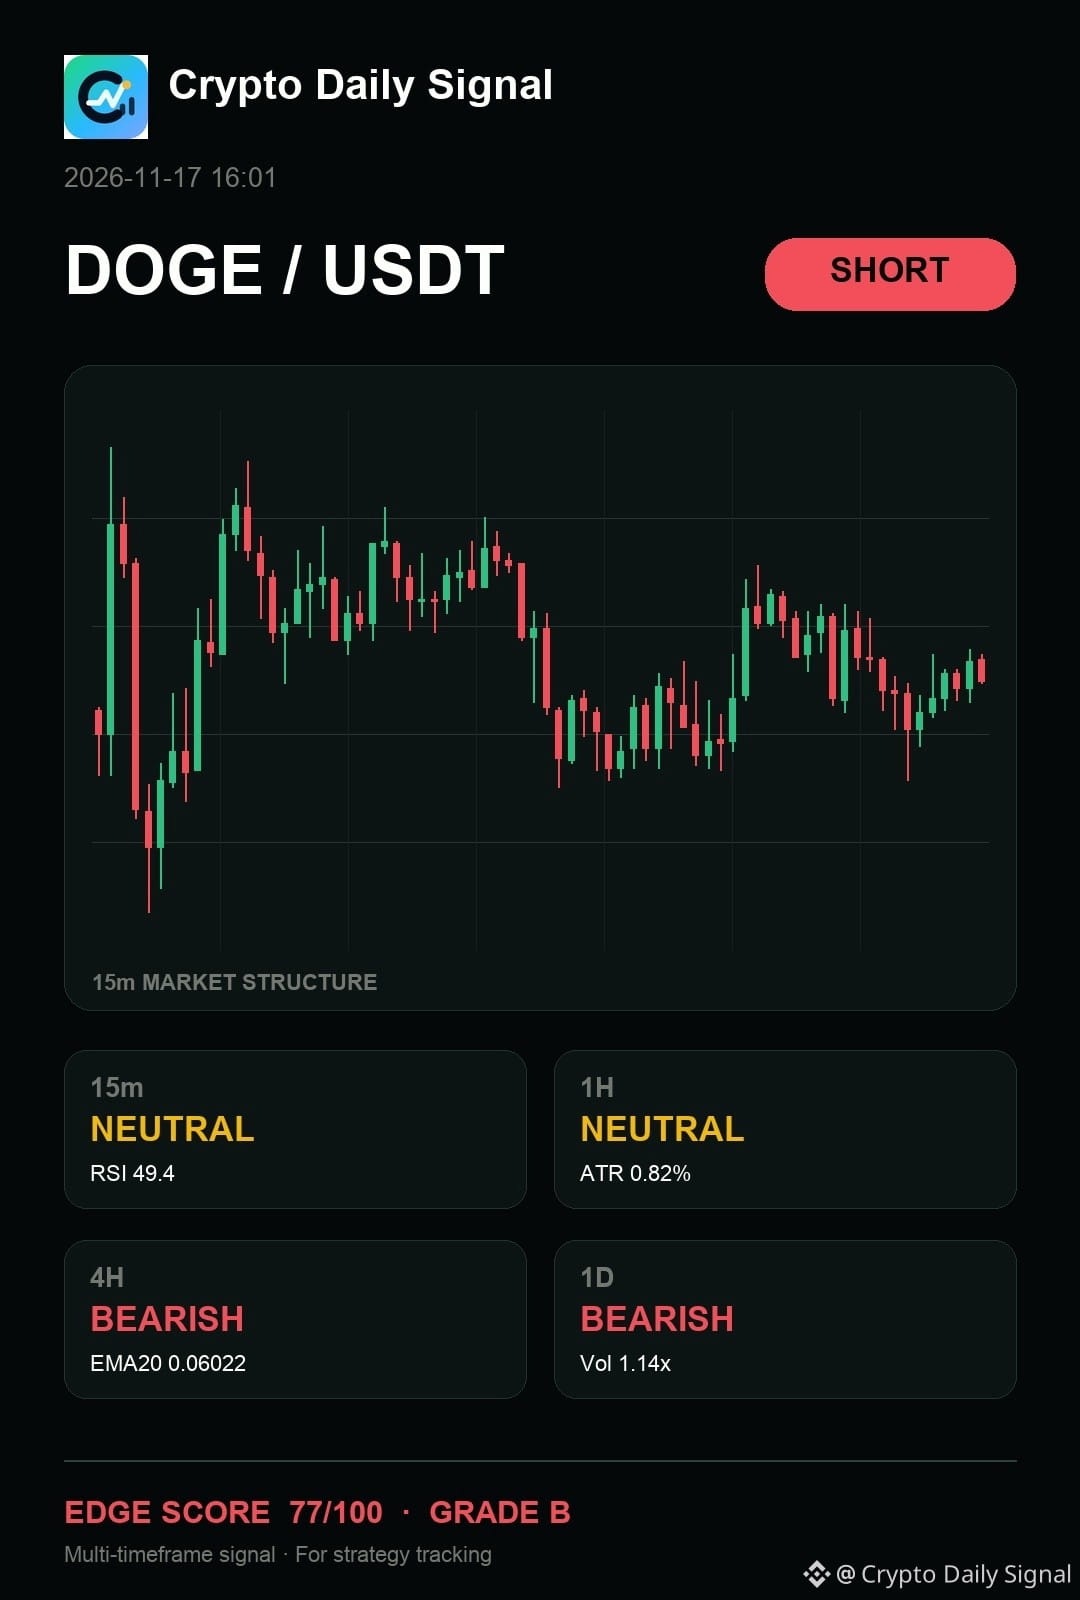
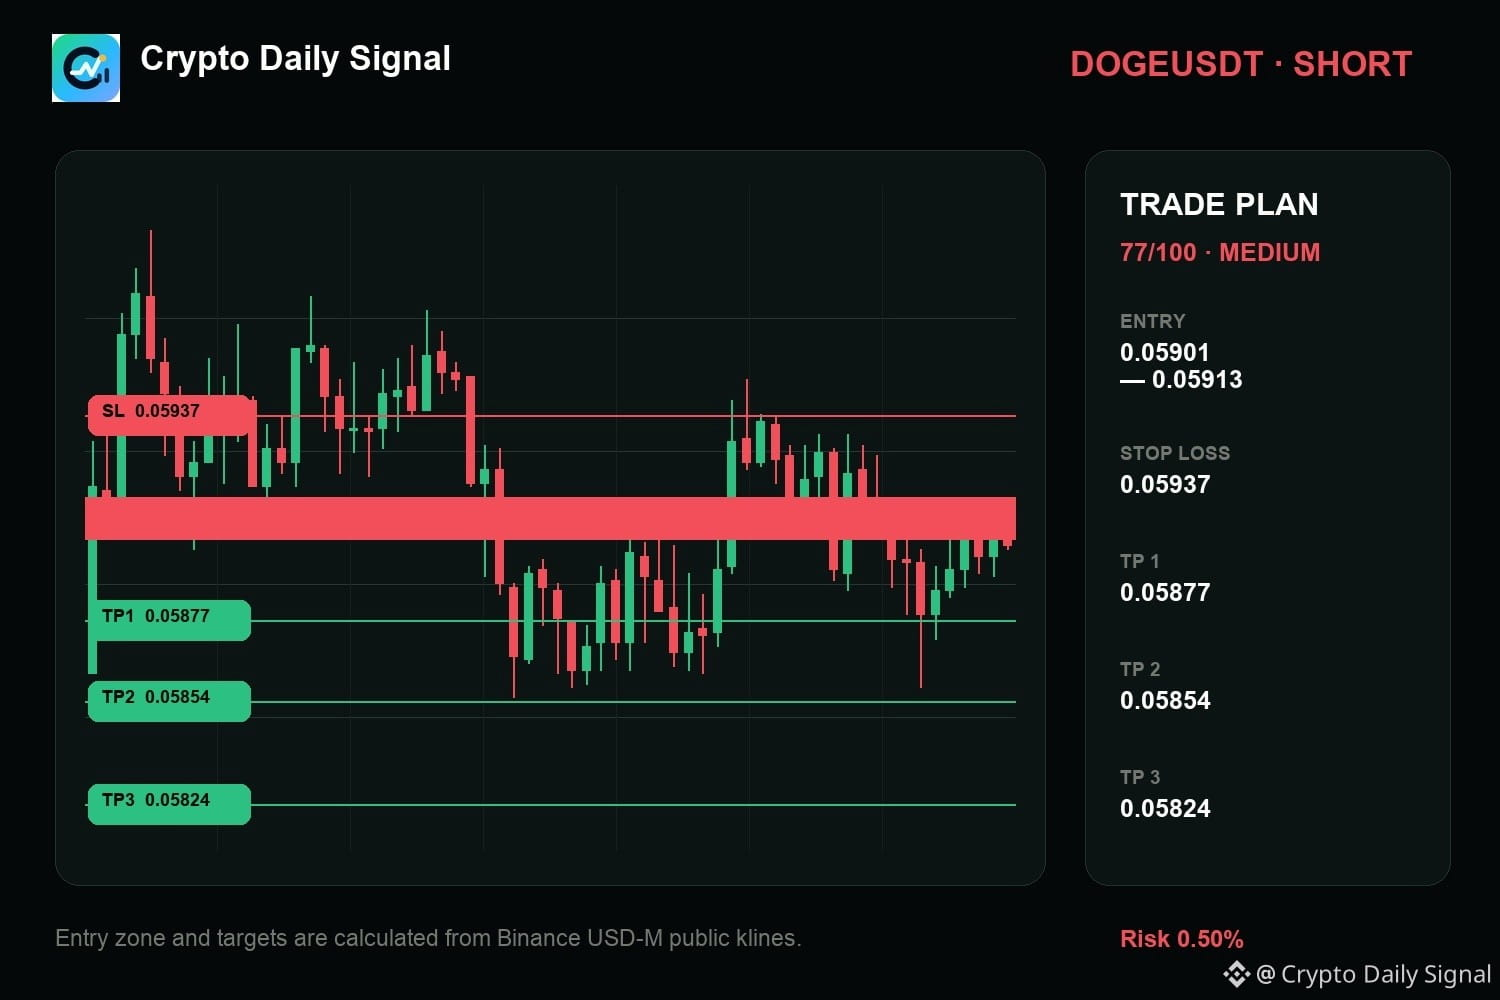
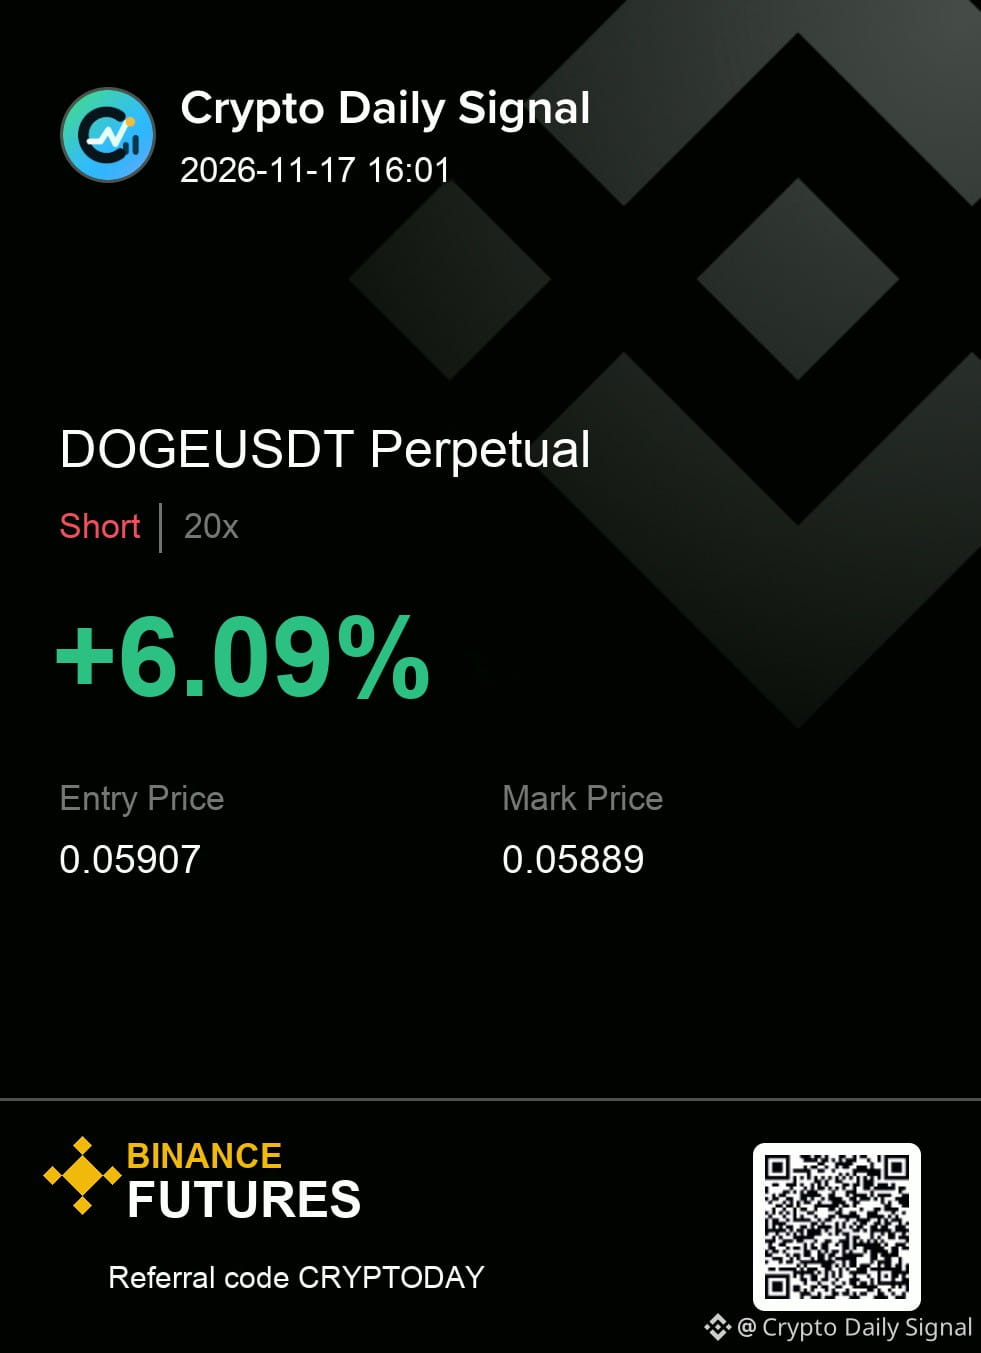
$DOGE — bro, here's my read: it still offers the cleaner bearish argument, but chasing lower highs right now just invites catching a move. The structure shows successive lower highs testing the range floor, and that fundamental bear bias remains intact. We need a decisive close under the current support level to make this short approach valid.
Levels — DOGEUSDT
Zone: 0.05901 - 0.05913
Cut: 0.05937
Scale: 0.05877 | 0.05854 | 0.05824
#TradingSignal
{future}(DOGEUSDT)
$DOGE — bro, here's my read: it still offers the cleaner bearish argument, but chasing lower highs right now just invites catching a move. The structure shows successive lower highs testing the range floor, and that fundamental bear bias remains intact. We need a decisive close under the current support level to make this short approach valid.
Levels — DOGEUSDT
Zone: 0.05901 - 0.05913
Cut: 0.05937
Scale: 0.05877 | 0.05854 | 0.05824
#TradingSignal
Levels — DOGEUSDT
Zone: 0.05901 - 0.05913
Cut: 0.05937
Scale: 0.05877 | 0.05854 | 0.05824
#TradingSignal
7
·
--
🔥 PHAUSDT LONG setup validated.
COMBINED SCORE: 43.4 | PERF: 56.32 | ATTN: 32.83 | MOMO: 42.54
Bullish breakout triggered. Entry: 0.0366. SL: 0.035925. TP1: 0.037612 | TP2: 0.038286.
24h price +18.77% | Volume spikes 15m +93.7% | OI rising 5m/15m.
This is a setup, not a guaranteed result.
Will PHA break TP2? 👀
#BinanceSquare
$PHA #TradingSignal #CryptoAnalysis
🔥 PHAUSDT LONG setup validated.
COMBINED SCORE: 43.4 | PERF: 56.32 | ATTN: 32.83 | MOMO: 42.54
Bullish breakout triggered. Entry: 0.0366. SL: 0.035925. TP1: 0.037612 | TP2: 0.038286.
24h price +18.77% | Volume spikes 15m +93.7% | OI rising 5m/15m.
This is a setup, not a guaranteed result.
Will PHA break TP2? 👀
#BinanceSquare
$PHA #TradingSignal #CryptoAnalysis
COMBINED SCORE: 43.4 | PERF: 56.32 | ATTN: 32.83 | MOMO: 42.54
Bullish breakout triggered. Entry: 0.0366. SL: 0.035925. TP1: 0.037612 | TP2: 0.038286.
24h price +18.77% | Volume spikes 15m +93.7% | OI rising 5m/15m.
This is a setup, not a guaranteed result.
Will PHA break TP2? 👀
#BinanceSquare
$PHA #TradingSignal #CryptoAnalysis

103

·
--
Bullish
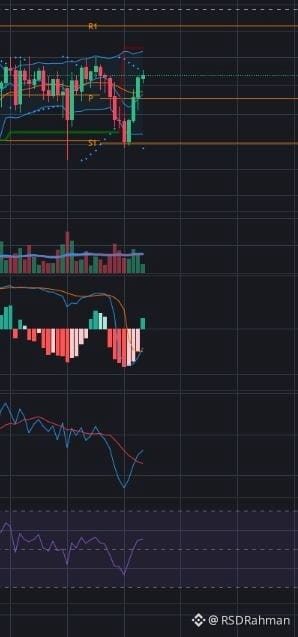
$JUP is strong bullish. Buyers are interested. It has rest bullish move. Target - $0.2717 and stop loss $0.2560 #JUP #bullish #TradingSignal
{spot}(JUPUSDT)
$JUP is strong bullish. Buyers are interested. It has rest bullish move. Target - $0.2717 and stop loss $0.2560 #JUP #bullish #TradingSignal
44
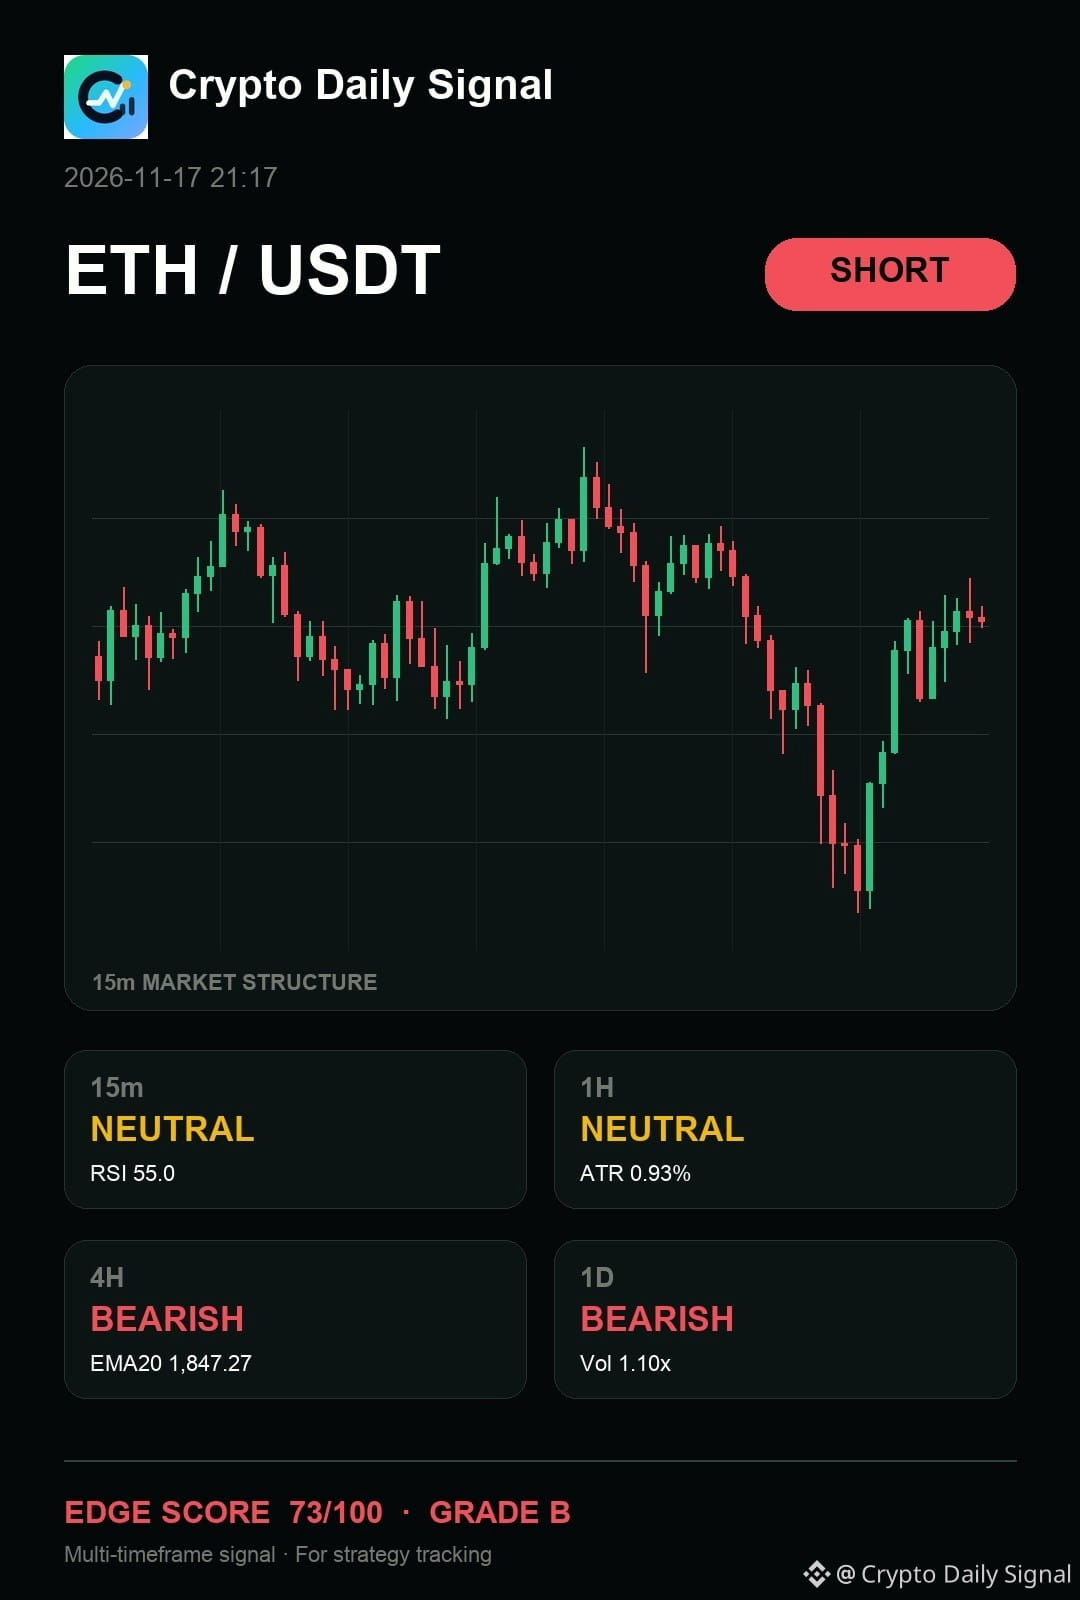
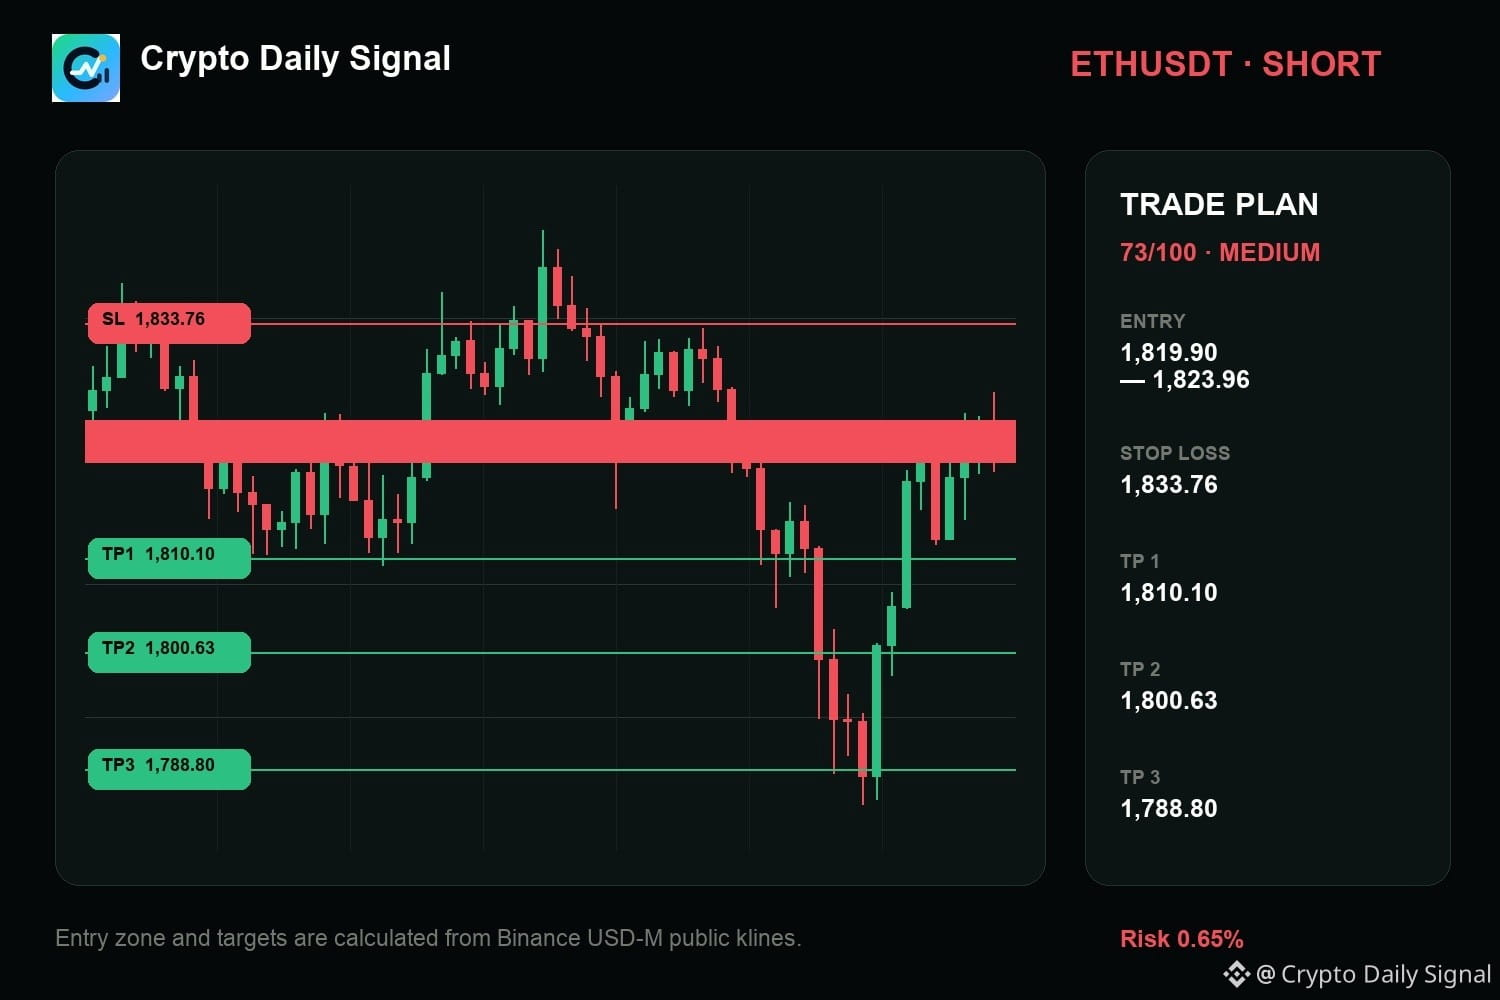
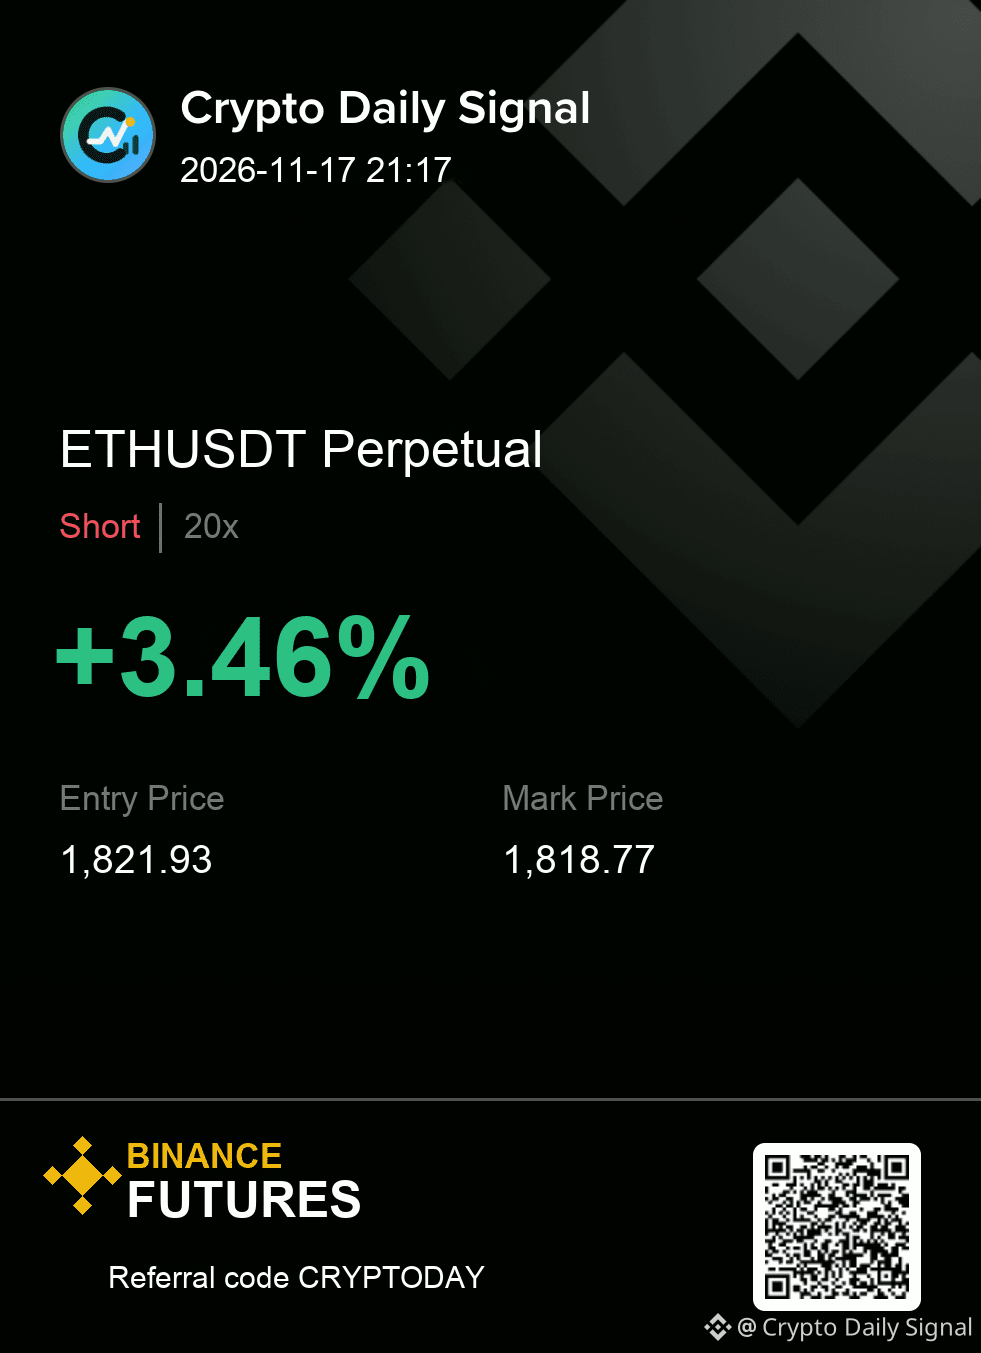
$ETH — look, my read is simple: it is one rejection away from a cleaner short as the latest moves show a failure to overcome the last high. The price is sitting below the established descending trendline, and both the four-hour and daily charts point to weakness. A decisive candle close beneath that trendline would confirm the move. Any strong push above the recent swing high would immediately challenge this downward view.
ETHUSDT | SHORT
Entry 1,819.90 - 1,823.96
Invalidation 1,833.76
Targets 1,810.10 / 1,800.63 / 1,788.80
#TradingSignal
{future}(ETHUSDT)
$ETH — look, my read is simple: it is one rejection away from a cleaner short as the latest moves show a failure to overcome the last high. The price is sitting below the established descending trendline, and both the four-hour and daily charts point to weakness. A decisive candle close beneath that trendline would confirm the move. Any strong push above the recent swing high would immediately challenge this downward view.
ETHUSDT | SHORT
Entry 1,819.90 - 1,823.96
Invalidation 1,833.76
Targets 1,810.10 / 1,800.63 / 1,788.80
#TradingSignal
ETHUSDT | SHORT
Entry 1,819.90 - 1,823.96
Invalidation 1,833.76
Targets 1,810.10 / 1,800.63 / 1,788.80
#TradingSignal
6
·
--
🔥 BLESSUSDT SHORT SETUP
Combined score: 43.55. Bias: SHORT.
Entry: 0.010241 | SL: 0.010463 | TP1: 0.00990851 | TP2: 0.00968686
24h price -21.62%. Volume spikes: 5m +169%, 15m +205%. Bearish pressure active.
⚠️ This is a trading setup, not a guaranteed result.
Question: Are you watching BLESS for a break below TP2?
#CryptoAnalysis
$BLESS #TradingSignal #CryptoAnalysis
🔥 BLESSUSDT SHORT SETUP
Combined score: 43.55. Bias: SHORT.
Entry: 0.010241 | SL: 0.010463 | TP1: 0.00990851 | TP2: 0.00968686
24h price -21.62%. Volume spikes: 5m +169%, 15m +205%. Bearish pressure active.
⚠️ This is a trading setup, not a guaranteed result.
Question: Are you watching BLESS for a break below TP2?
#CryptoAnalysis
$BLESS #TradingSignal #CryptoAnalysis
Combined score: 43.55. Bias: SHORT.
Entry: 0.010241 | SL: 0.010463 | TP1: 0.00990851 | TP2: 0.00968686
24h price -21.62%. Volume spikes: 5m +169%, 15m +205%. Bearish pressure active.
⚠️ This is a trading setup, not a guaranteed result.
Question: Are you watching BLESS for a break below TP2?
#CryptoAnalysis
$BLESS #TradingSignal #CryptoAnalysis
5
·
--
🔥 V4 validated short setup for 龙虾USDT.
⚠️ This is a setup, not a guaranteed result.
Entry: 0.01592
SL: 0.016344
TP1: 0.015284
TP2: 0.014859
Structure: BEARISH_PRESSURE
Has the momentum shift confirmed the downtrend?
$ #TradingSignal #CryptoAnalysis
🔥 V4 validated short setup for 龙虾USDT.
⚠️ This is a setup, not a guaranteed result.
Entry: 0.01592
SL: 0.016344
TP1: 0.015284
TP2: 0.014859
Structure: BEARISH_PRESSURE
Has the momentum shift confirmed the downtrend?
$ #TradingSignal #CryptoAnalysis
⚠️ This is a setup, not a guaranteed result.
Entry: 0.01592
SL: 0.016344
TP1: 0.015284
TP2: 0.014859
Structure: BEARISH_PRESSURE
Has the momentum shift confirmed the downtrend?
$ #TradingSignal #CryptoAnalysis

3
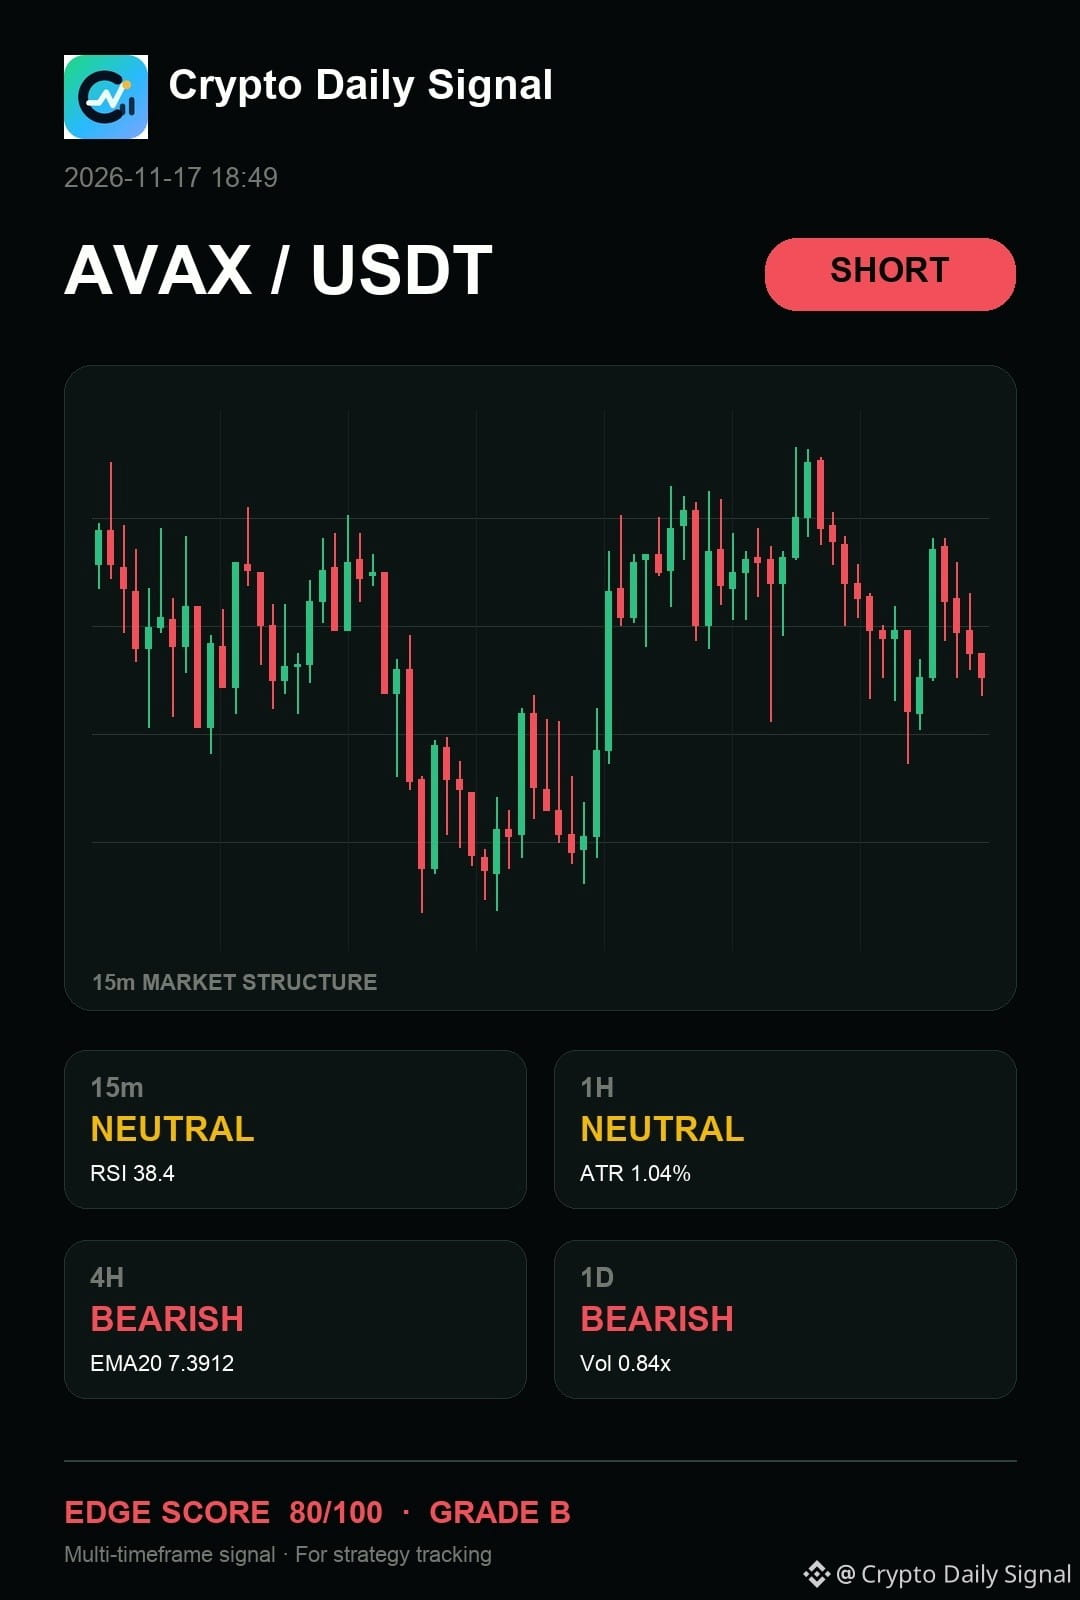
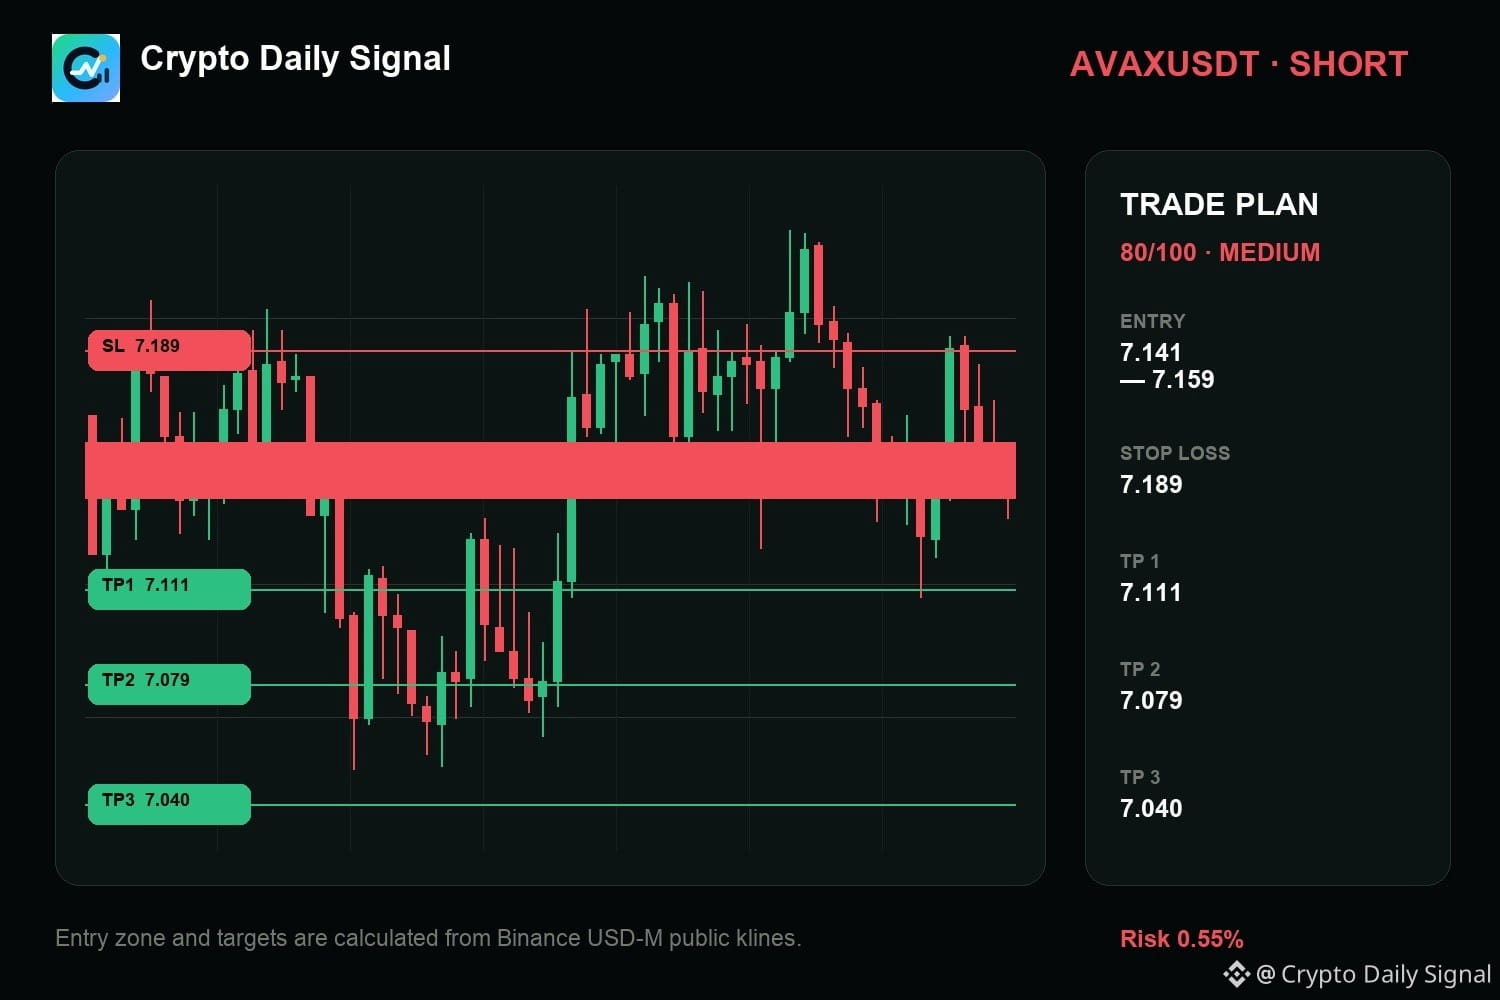
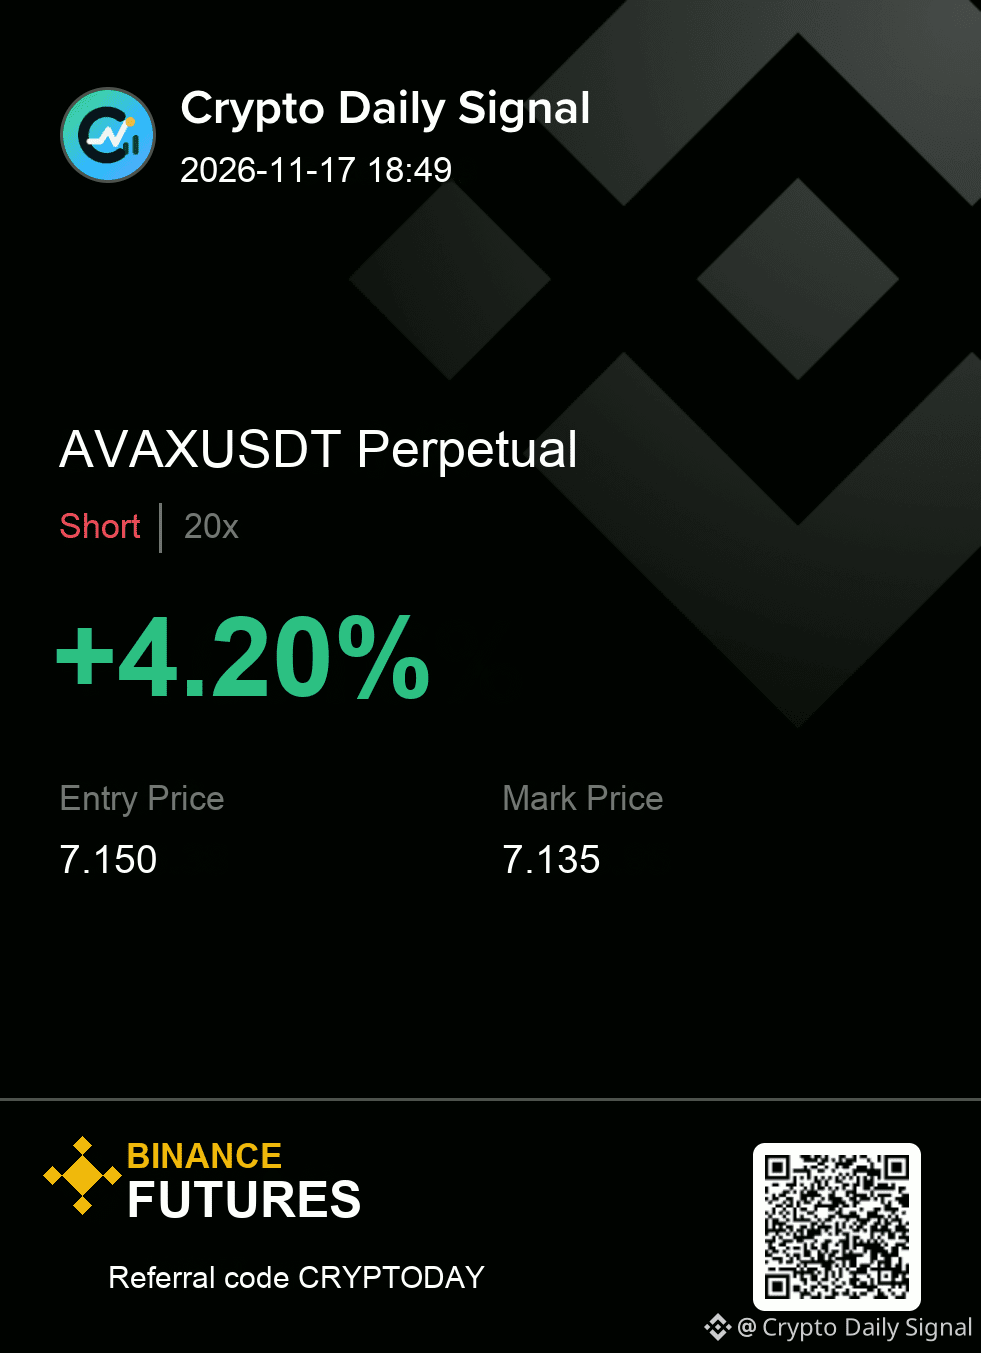
$AVAX — okay, my read still says it requires patience before the short is actionable. The price is showing a clear rejection wick near its upper boundary, supporting the bearish tone from the four-hour chart. A decisive close below the recent short-term range floor would confirm the directional thesis.
My levels for AVAXUSDT — SHORT
Entry zone 7.141 - 7.159
Risk line 7.189
Targets 7.111 / 7.079 / 7.040
Clean enough to execute, or still too early for you?
#TradingSignal
{future}(AVAXUSDT)
$AVAX — okay, my read still says it requires patience before the short is actionable. The price is showing a clear rejection wick near its upper boundary, supporting the bearish tone from the four-hour chart. A decisive close below the recent short-term range floor would confirm the directional thesis.
My levels for AVAXUSDT — SHORT
Entry zone 7.141 - 7.159
Risk line 7.189
Targets 7.111 / 7.079 / 7.040
Clean enough to execute, or still too early for you?
#TradingSignal
My levels for AVAXUSDT — SHORT
Entry zone 7.141 - 7.159
Risk line 7.189
Targets 7.111 / 7.079 / 7.040
Clean enough to execute, or still too early for you?
#TradingSignal
5
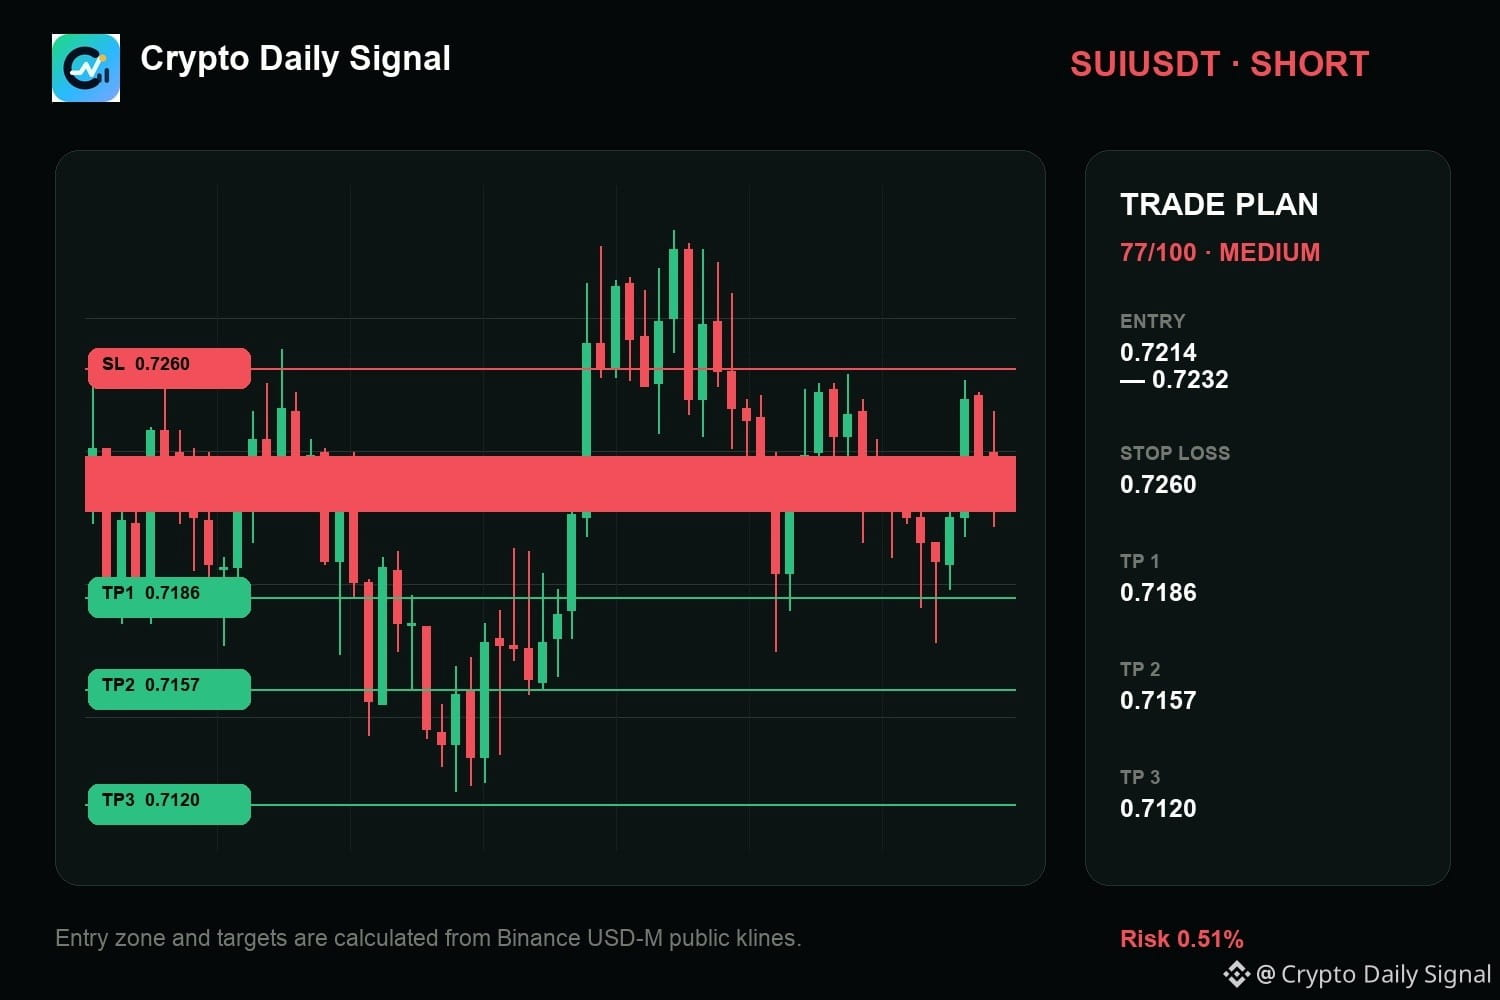
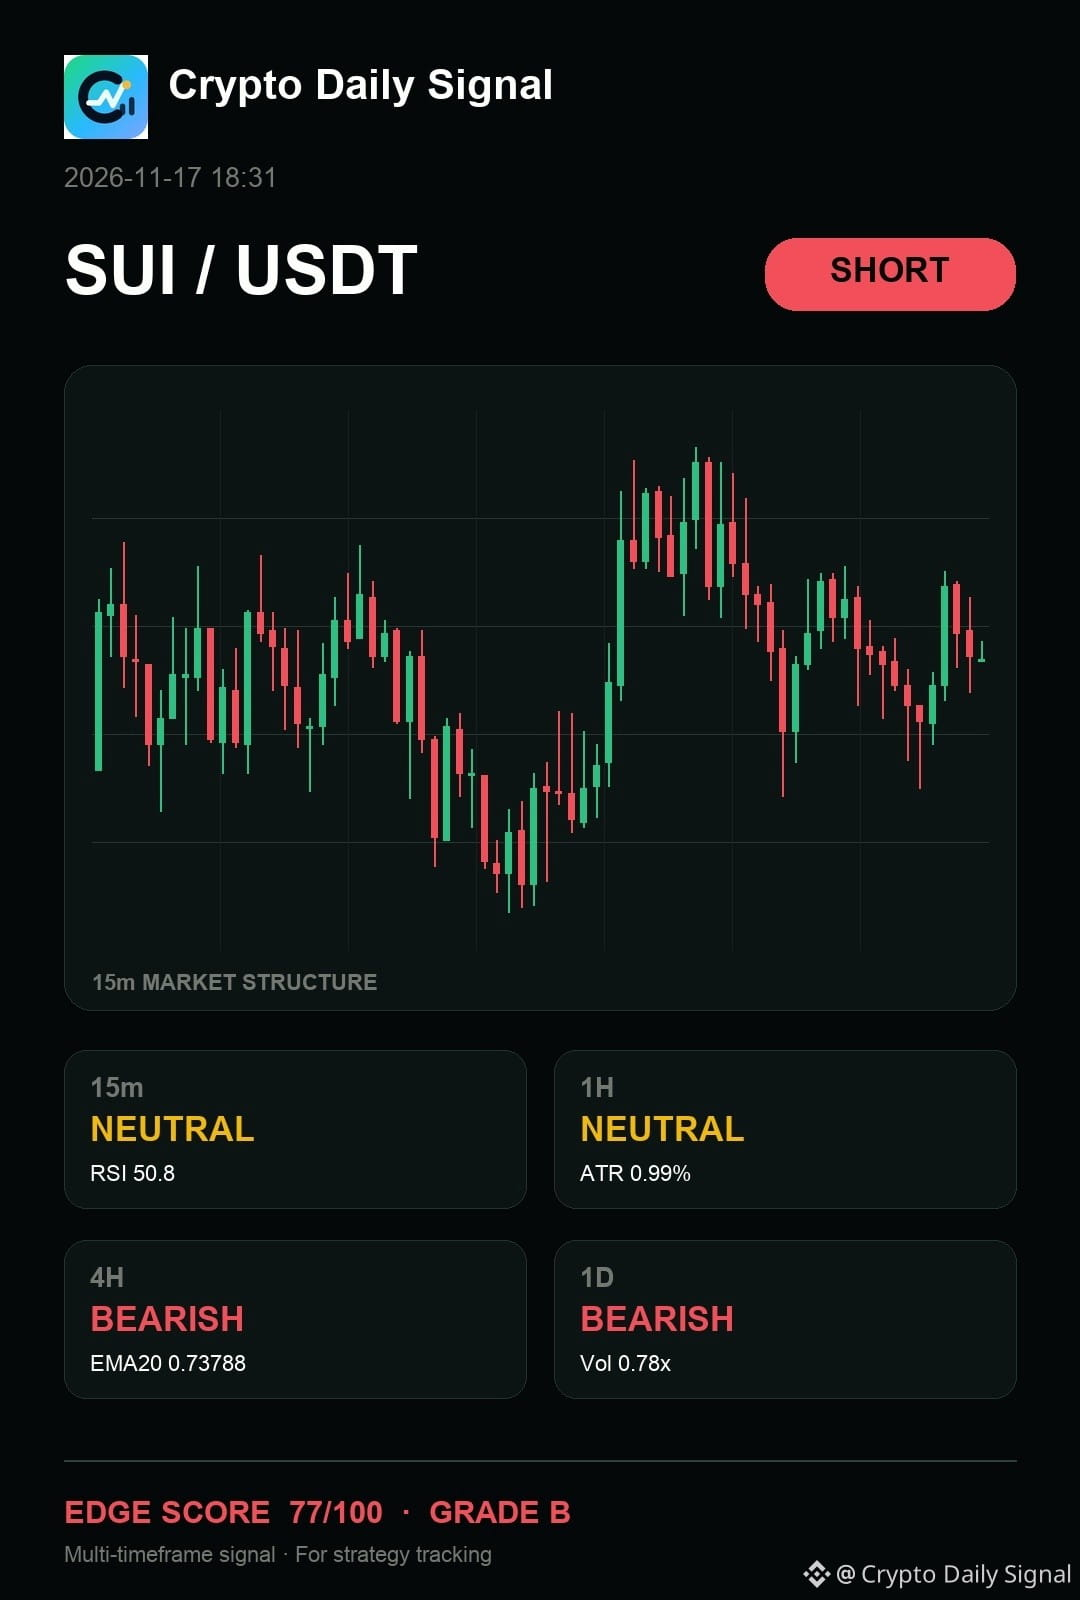
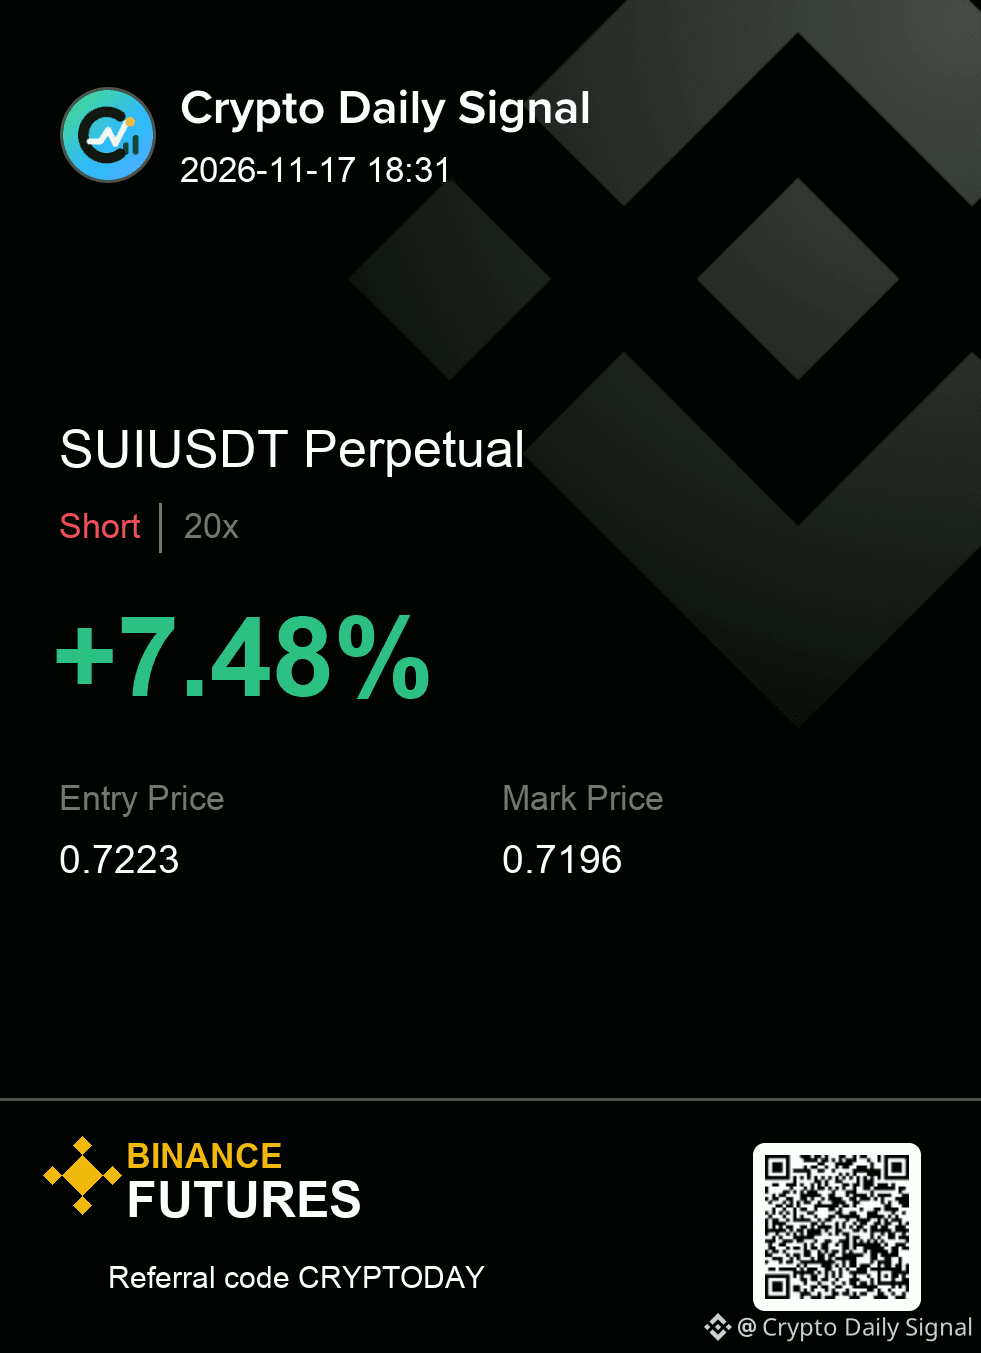
$SUI remains a short watch for me because the current consolidation doesn't offer a clean entry, and trying to catch a dip feels too early. The recent candles show buyers are struggling to clear the prior swing high, suggesting overhead pressure is present in this tight band. A convincing drop below the range bottom would be the trigger to look for action.
Does the structure look clean enough, or would you leave this one alone?
SUIUSDT SHORT
IN 0.7214 - 0.7232
OUT 0.7260
TP 0.7186 · 0.7157 · 0.7120
#TradingSignal
{future}(SUIUSDT)
$SUI remains a short watch for me because the current consolidation doesn't offer a clean entry, and trying to catch a dip feels too early. The recent candles show buyers are struggling to clear the prior swing high, suggesting overhead pressure is present in this tight band. A convincing drop below the range bottom would be the trigger to look for action.
Does the structure look clean enough, or would you leave this one alone?
SUIUSDT SHORT
IN 0.7214 - 0.7232
OUT 0.7260
TP 0.7186 · 0.7157 · 0.7120
#TradingSignal
Does the structure look clean enough, or would you leave this one alone?
SUIUSDT SHORT
IN 0.7214 - 0.7232
OUT 0.7260
TP 0.7186 · 0.7157 · 0.7120
#TradingSignal
7
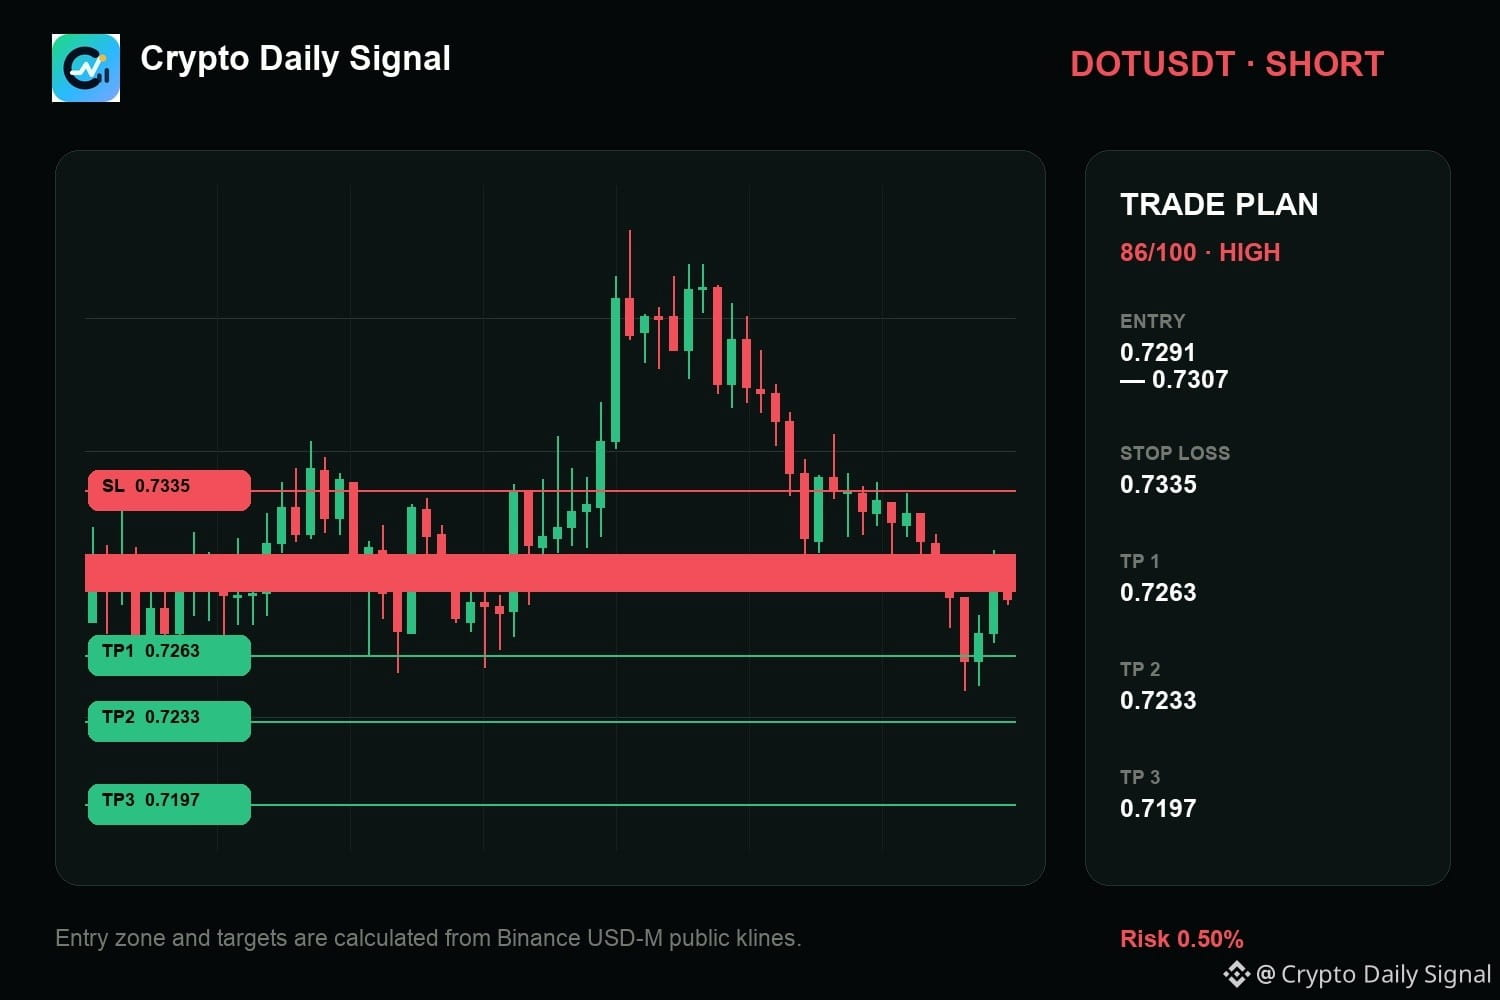
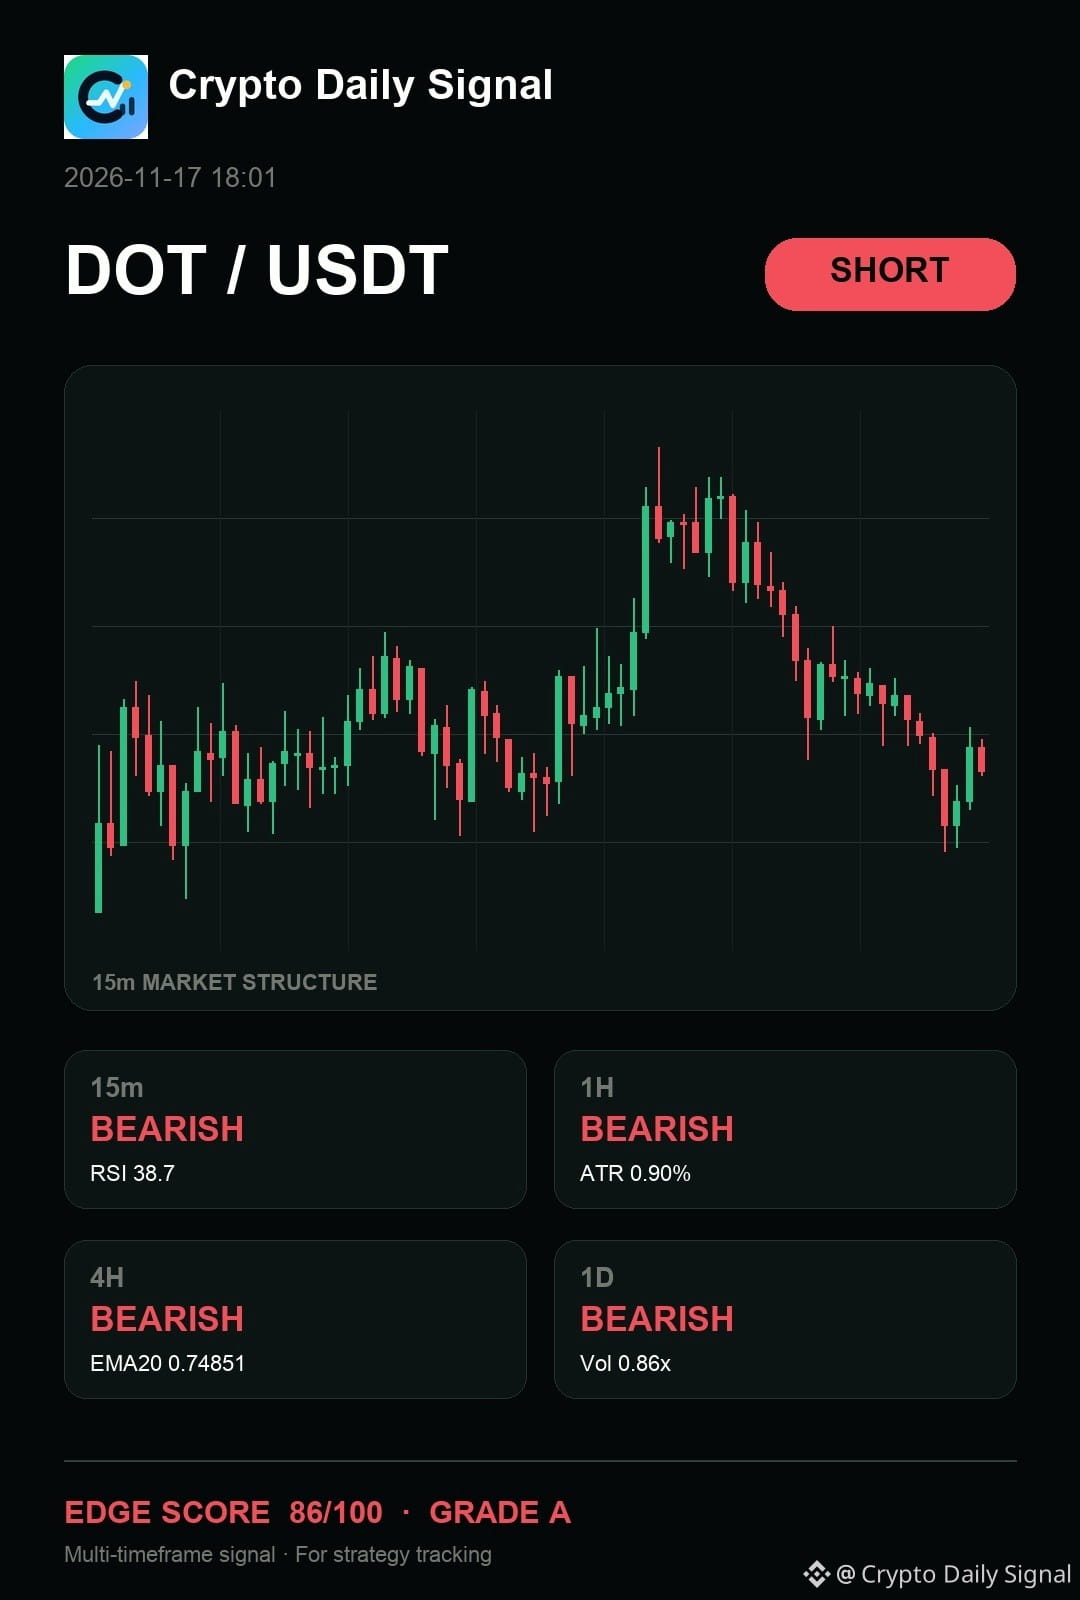
$DOT continues to favor the short case as the price tests the ceiling of its recent range. The candles show clear rejection action against higher bids, and the structure is built on lower highs against the backdrop of a downtrend across the daily chart. A decisive drop below recent support would make the bearish view stronger. A push past the last high would invalidate the current bearish angle.
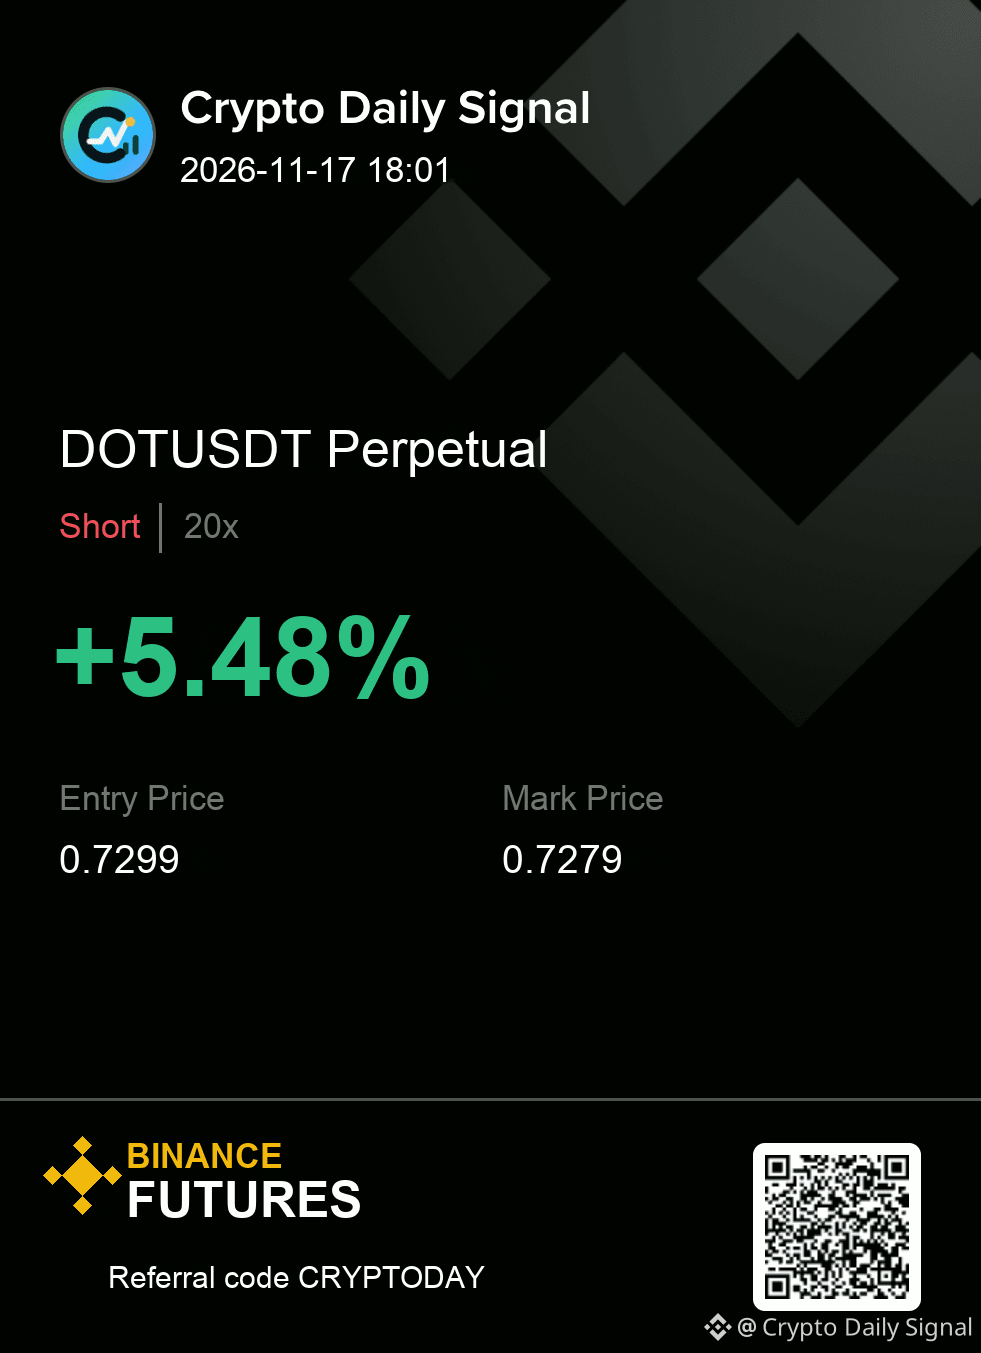
Trade Plan — DOTUSDT SHORT
Entry: 0.7291 - 0.7307
Stop Loss: 0.7335
TP1: 0.7263 | TP2: 0.7233 | TP3: 0.7197
#TradingSignal
{future}(DOTUSDT)
$DOT continues to favor the short case as the price tests the ceiling of its recent range. The candles show clear rejection action against higher bids, and the structure is built on lower highs against the backdrop of a downtrend across the daily chart. A decisive drop below recent support would make the bearish view stronger. A push past the last high would invalidate the current bearish angle.
Trade Plan — DOTUSDT SHORT
Entry: 0.7291 - 0.7307
Stop Loss: 0.7335
TP1: 0.7263 | TP2: 0.7233 | TP3: 0.7197
#TradingSignal
Trade Plan — DOTUSDT SHORT
Entry: 0.7291 - 0.7307
Stop Loss: 0.7335
TP1: 0.7263 | TP2: 0.7233 | TP3: 0.7197
#TradingSignal
3
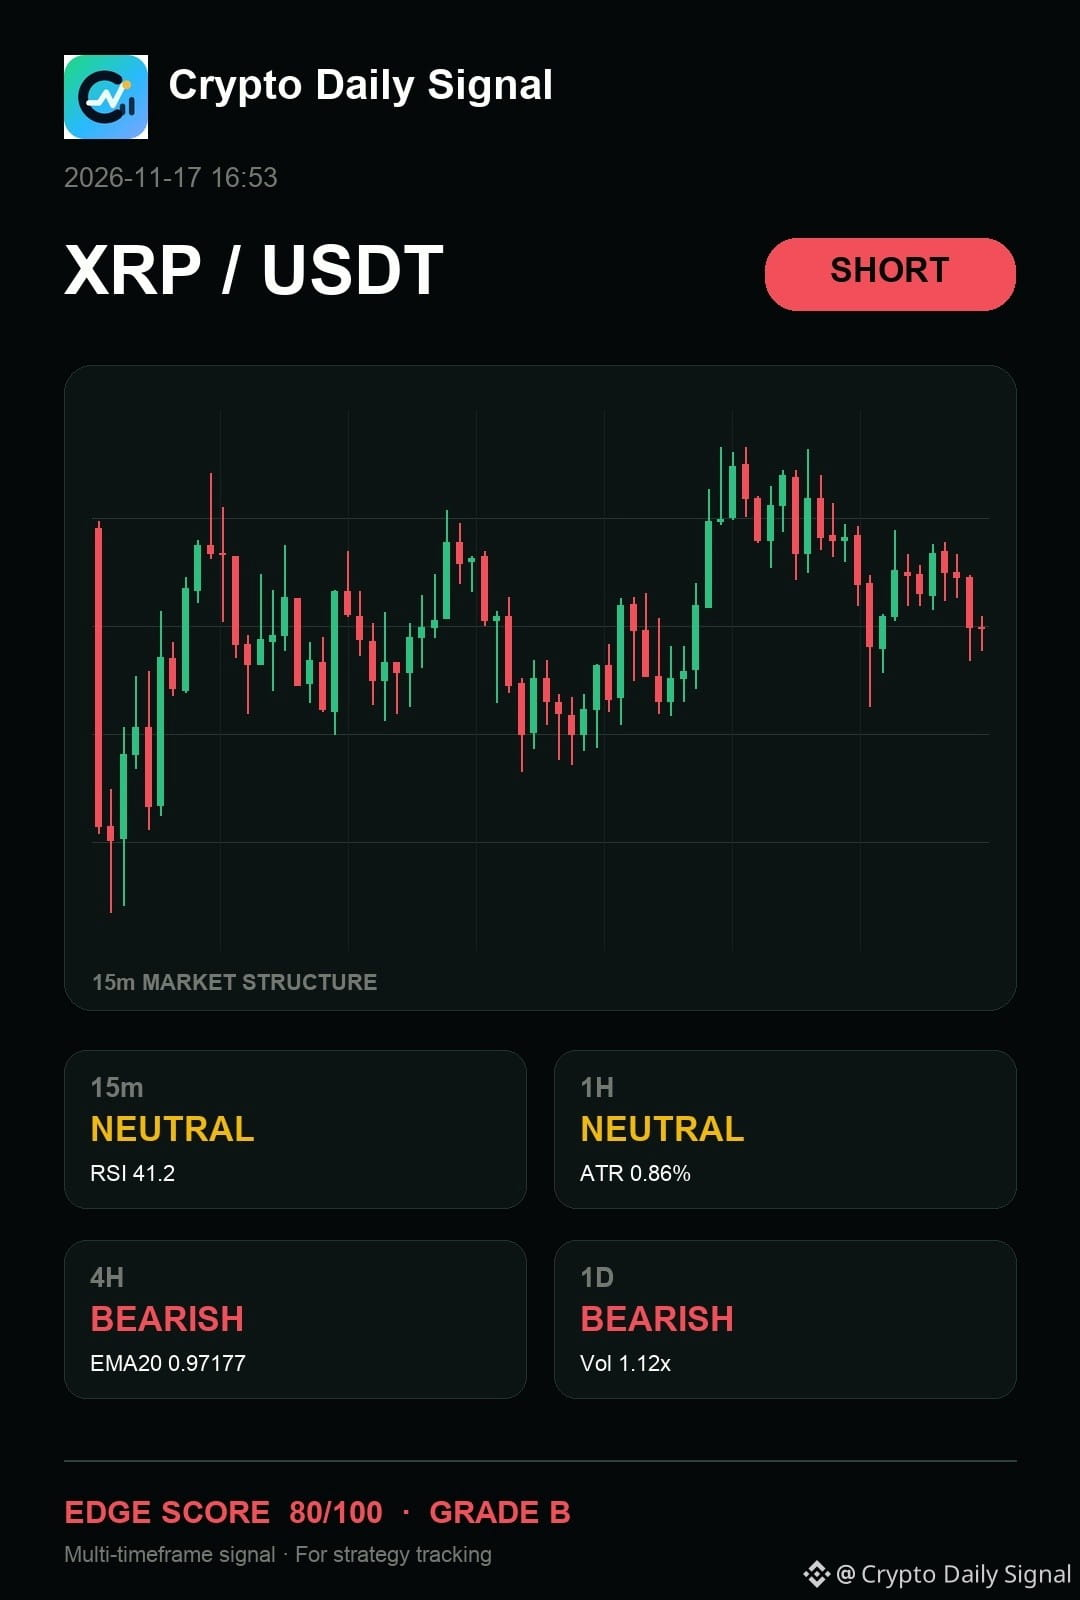
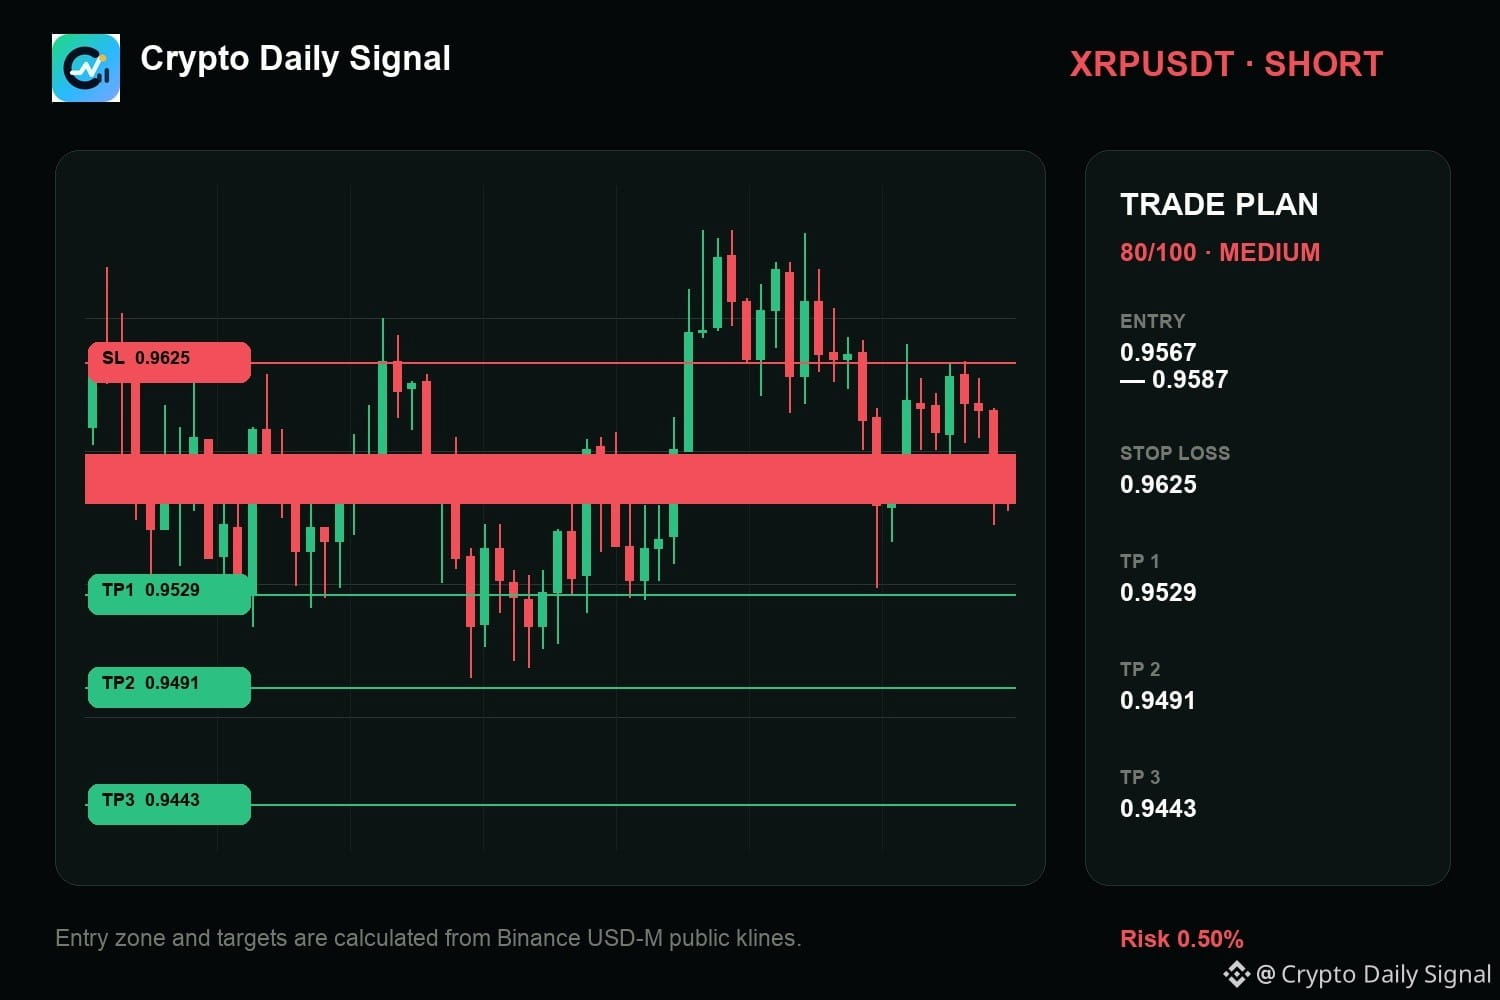
$XRP — tbh, I keep coming back to how it still offers the cleaner bearish argument as recent price formations show clearer failures to push above recent peaks. The four-hour and daily charts both show a downtrend, pointing toward selling pressure. A decisive break below the short-term swing low would make this trade more robust.
The map is useful only while the invalidation remains intact.
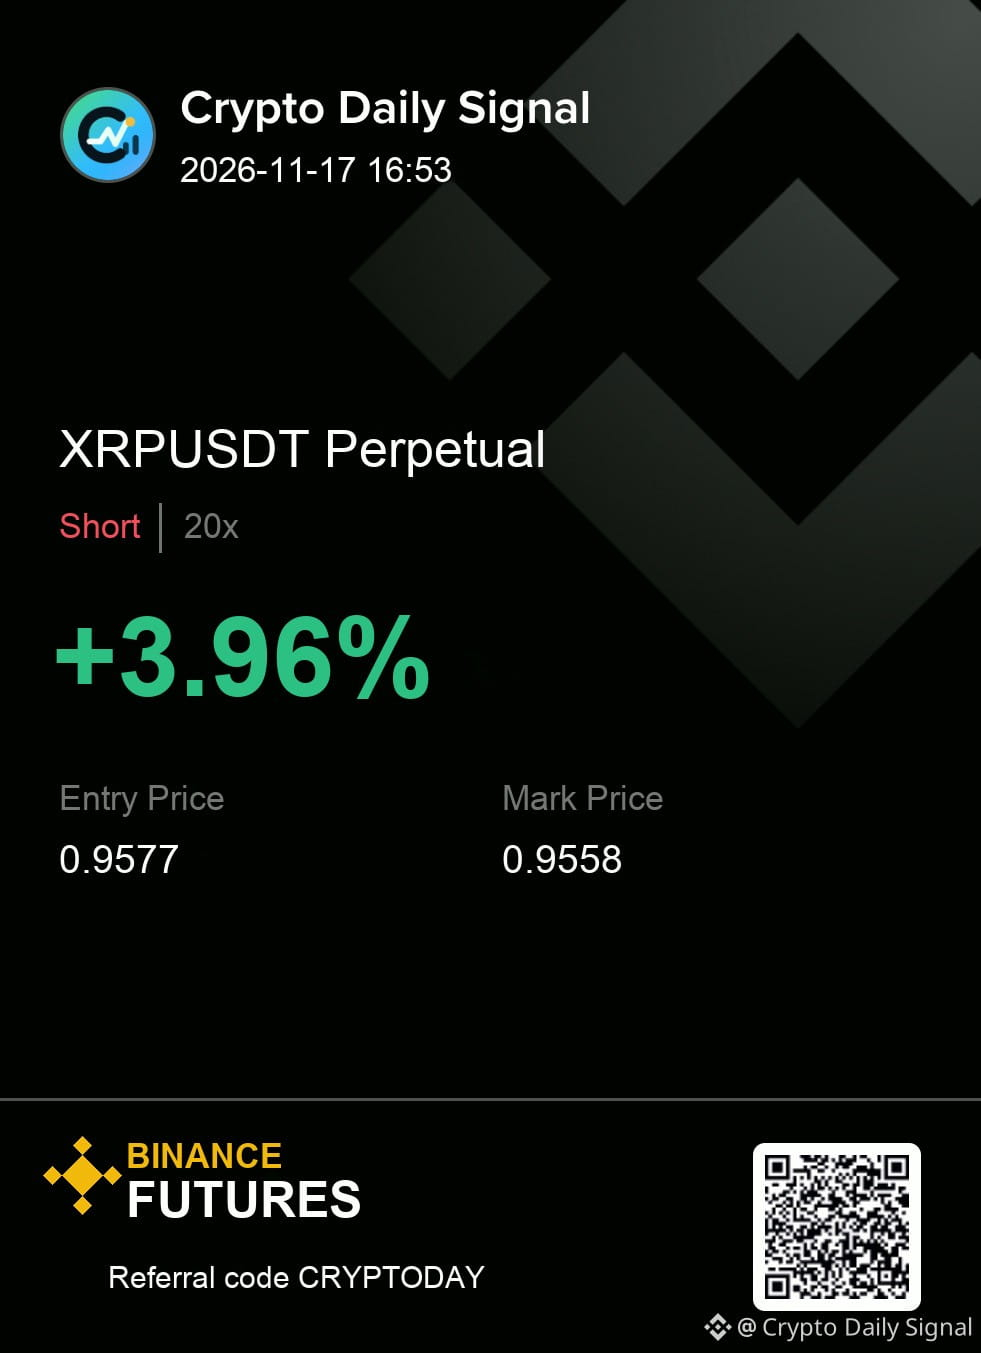
Levels — XRPUSDT
Zone: 0.9567 - 0.9587
Cut: 0.9625
Scale: 0.9529 | 0.9491 | 0.9443
#TradingSignal
{future}(XRPUSDT)
$XRP — tbh, I keep coming back to how it still offers the cleaner bearish argument as recent price formations show clearer failures to push above recent peaks. The four-hour and daily charts both show a downtrend, pointing toward selling pressure. A decisive break below the short-term swing low would make this trade more robust.
The map is useful only while the invalidation remains intact.
Levels — XRPUSDT
Zone: 0.9567 - 0.9587
Cut: 0.9625
Scale: 0.9529 | 0.9491 | 0.9443
#TradingSignal
The map is useful only while the invalidation remains intact.
Levels — XRPUSDT
Zone: 0.9567 - 0.9587
Cut: 0.9625
Scale: 0.9529 | 0.9491 | 0.9443
#TradingSignal
7
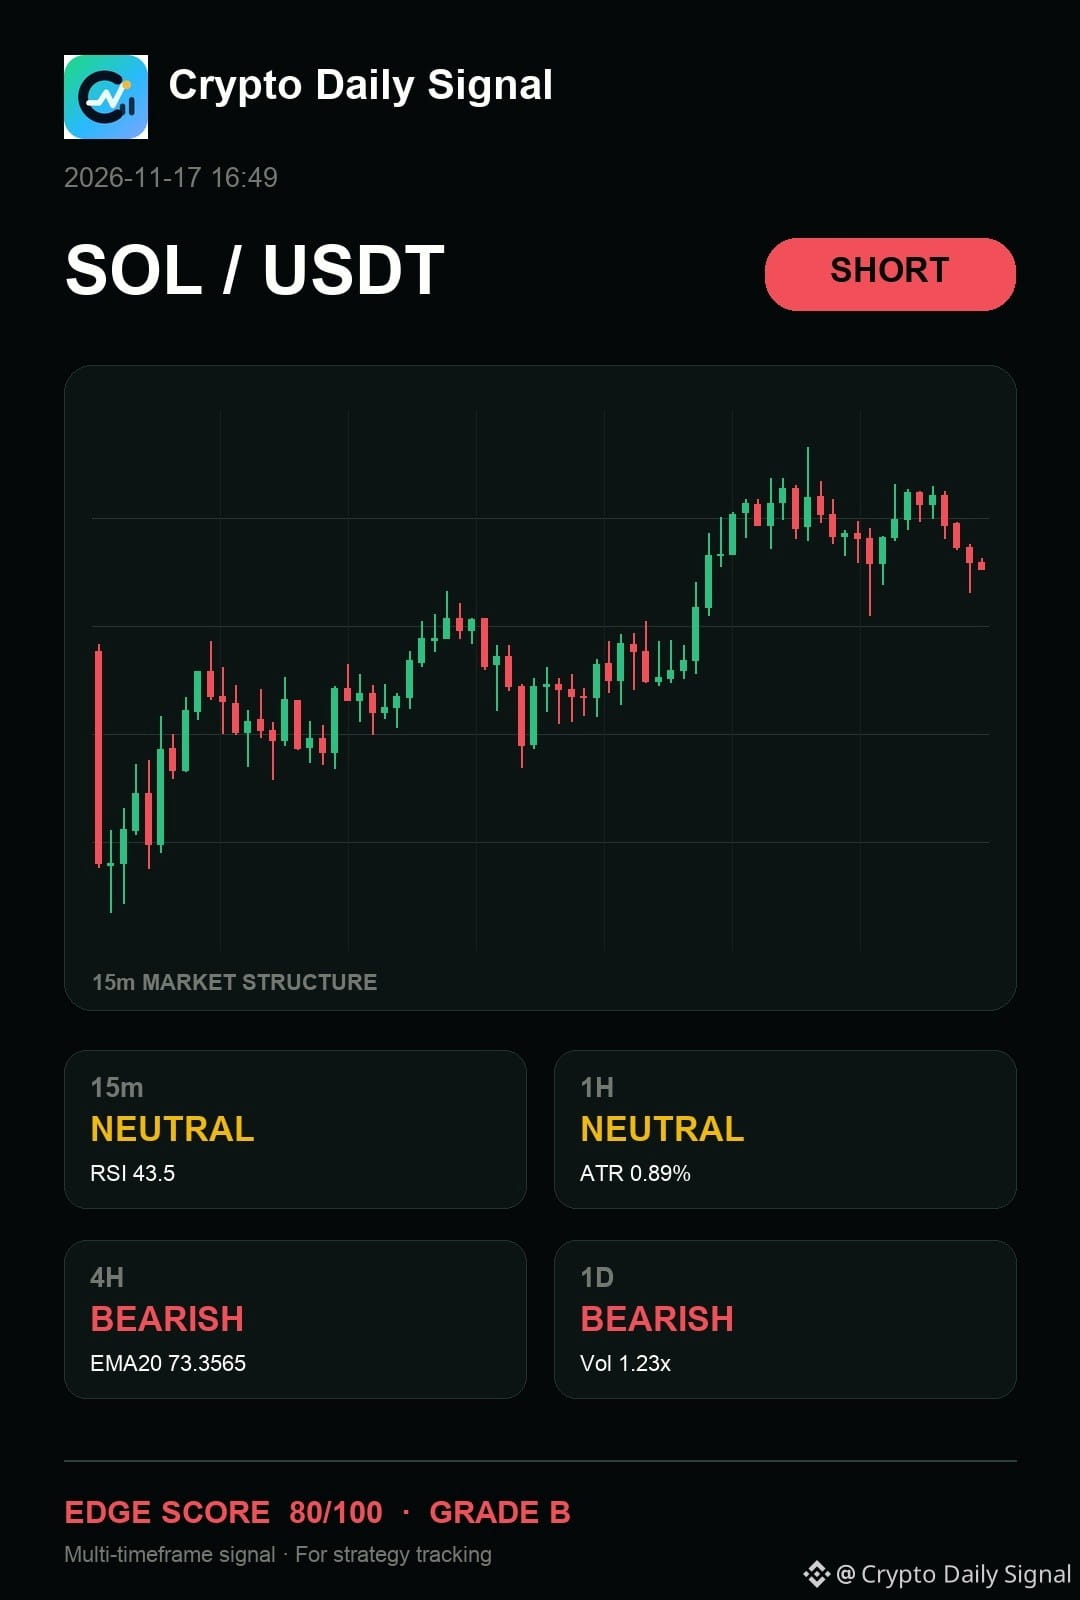
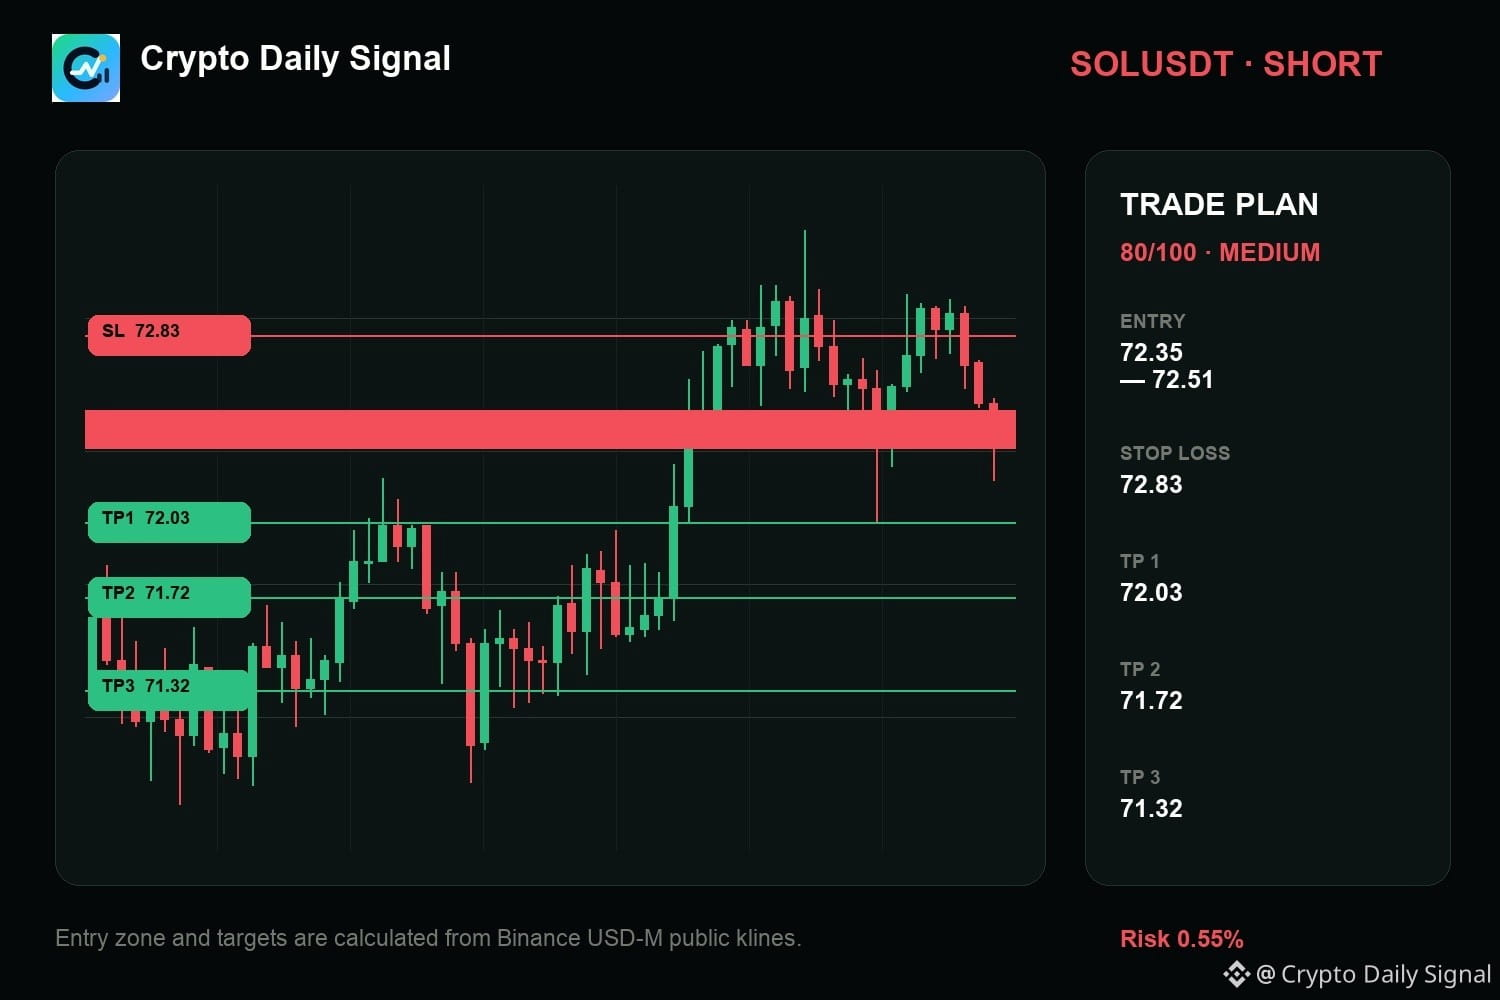
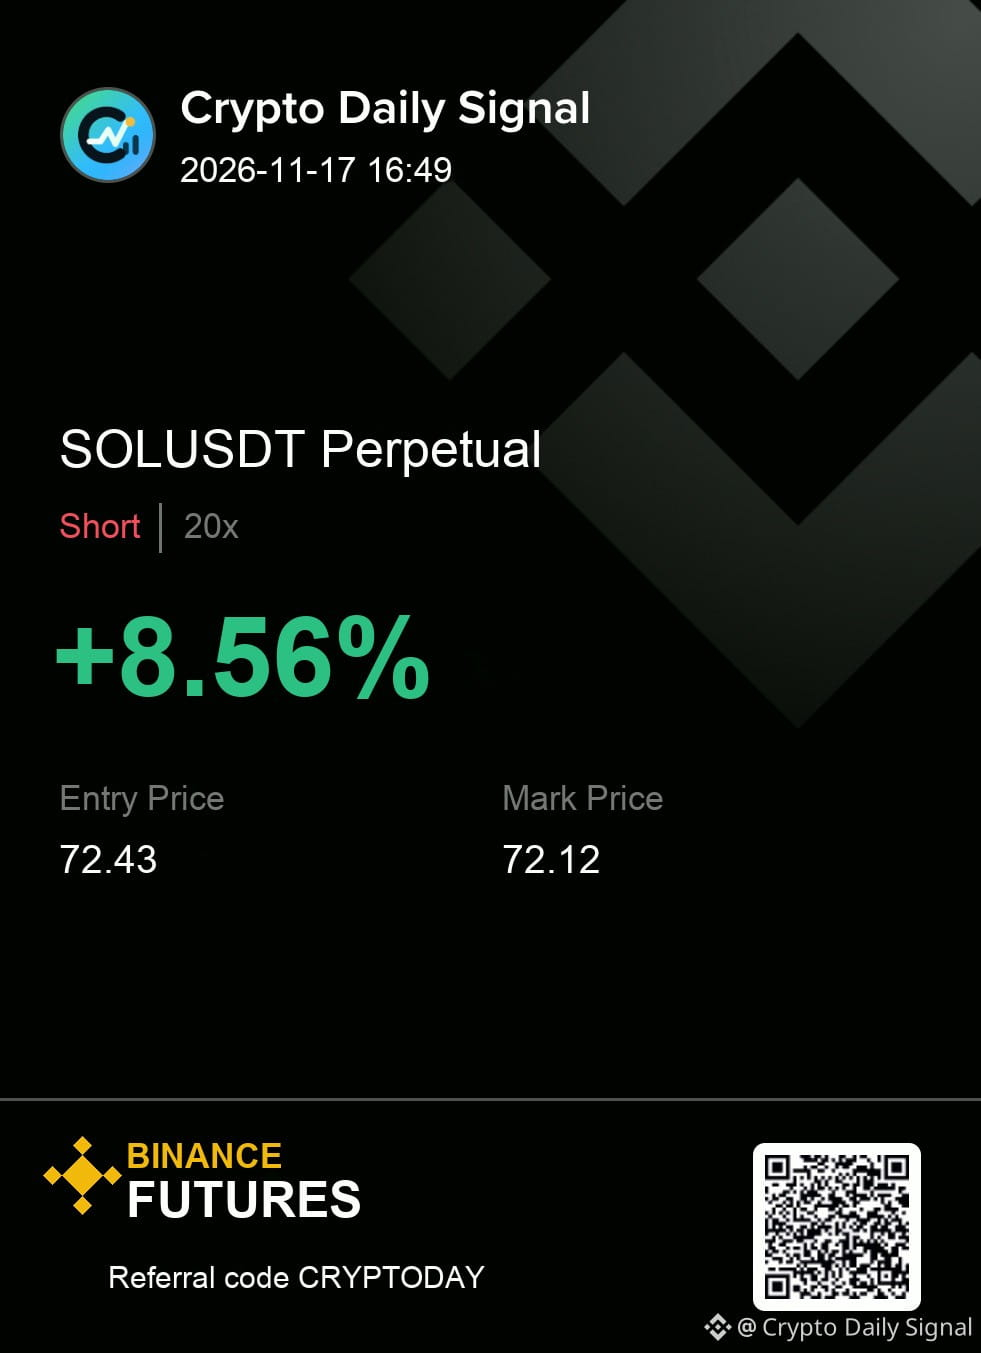
$SOL is one rejection away from a cleaner short. The price action is currently squeezed within a tight range, but the daily and four-hour trends point down, which supports selling pressure. A decisive break above the recent short-term high would undo this view; conversely, a close below the immediate low confirms the bearish setup.
SHORT plan for SOLUSDT
72.35 - 72.51 entry | 72.83 stop
72.03 → 71.72 → 71.32
#TradingSignal
{future}(SOLUSDT)
$SOL is one rejection away from a cleaner short. The price action is currently squeezed within a tight range, but the daily and four-hour trends point down, which supports selling pressure. A decisive break above the recent short-term high would undo this view; conversely, a close below the immediate low confirms the bearish setup.
SHORT plan for SOLUSDT
72.35 - 72.51 entry | 72.83 stop
72.03 → 71.72 → 71.32
#TradingSignal
SHORT plan for SOLUSDT
72.35 - 72.51 entry | 72.83 stop
72.03 → 71.72 → 71.32
#TradingSignal
4
·
--
🔥 BTW SHORT SETUP ACTIVATED
Bias: Short | Combined Score: 64.62
Entry: 0.3358 | SL: 0.341149 | TP1: 0.327777 | TP2: 0.322429
24h price -31.52% | Volume spikes +230.5% (5m) | Bearish breakdown structure
This is a trading setup, not a guaranteed result.
Will BTW respect the bearish targets? 📉
#BTWUSDT #CryptoAnalysis
$BTW #TradingSignal #CryptoAnalysis
🔥 BTW SHORT SETUP ACTIVATED
Bias: Short | Combined Score: 64.62
Entry: 0.3358 | SL: 0.341149 | TP1: 0.327777 | TP2: 0.322429
24h price -31.52% | Volume spikes +230.5% (5m) | Bearish breakdown structure
This is a trading setup, not a guaranteed result.
Will BTW respect the bearish targets? 📉
#BTWUSDT #CryptoAnalysis
$BTW #TradingSignal #CryptoAnalysis
Bias: Short | Combined Score: 64.62
Entry: 0.3358 | SL: 0.341149 | TP1: 0.327777 | TP2: 0.322429
24h price -31.52% | Volume spikes +230.5% (5m) | Bearish breakdown structure
This is a trading setup, not a guaranteed result.
Will BTW respect the bearish targets? 📉
#BTWUSDT #CryptoAnalysis
$BTW #TradingSignal #CryptoAnalysis

375
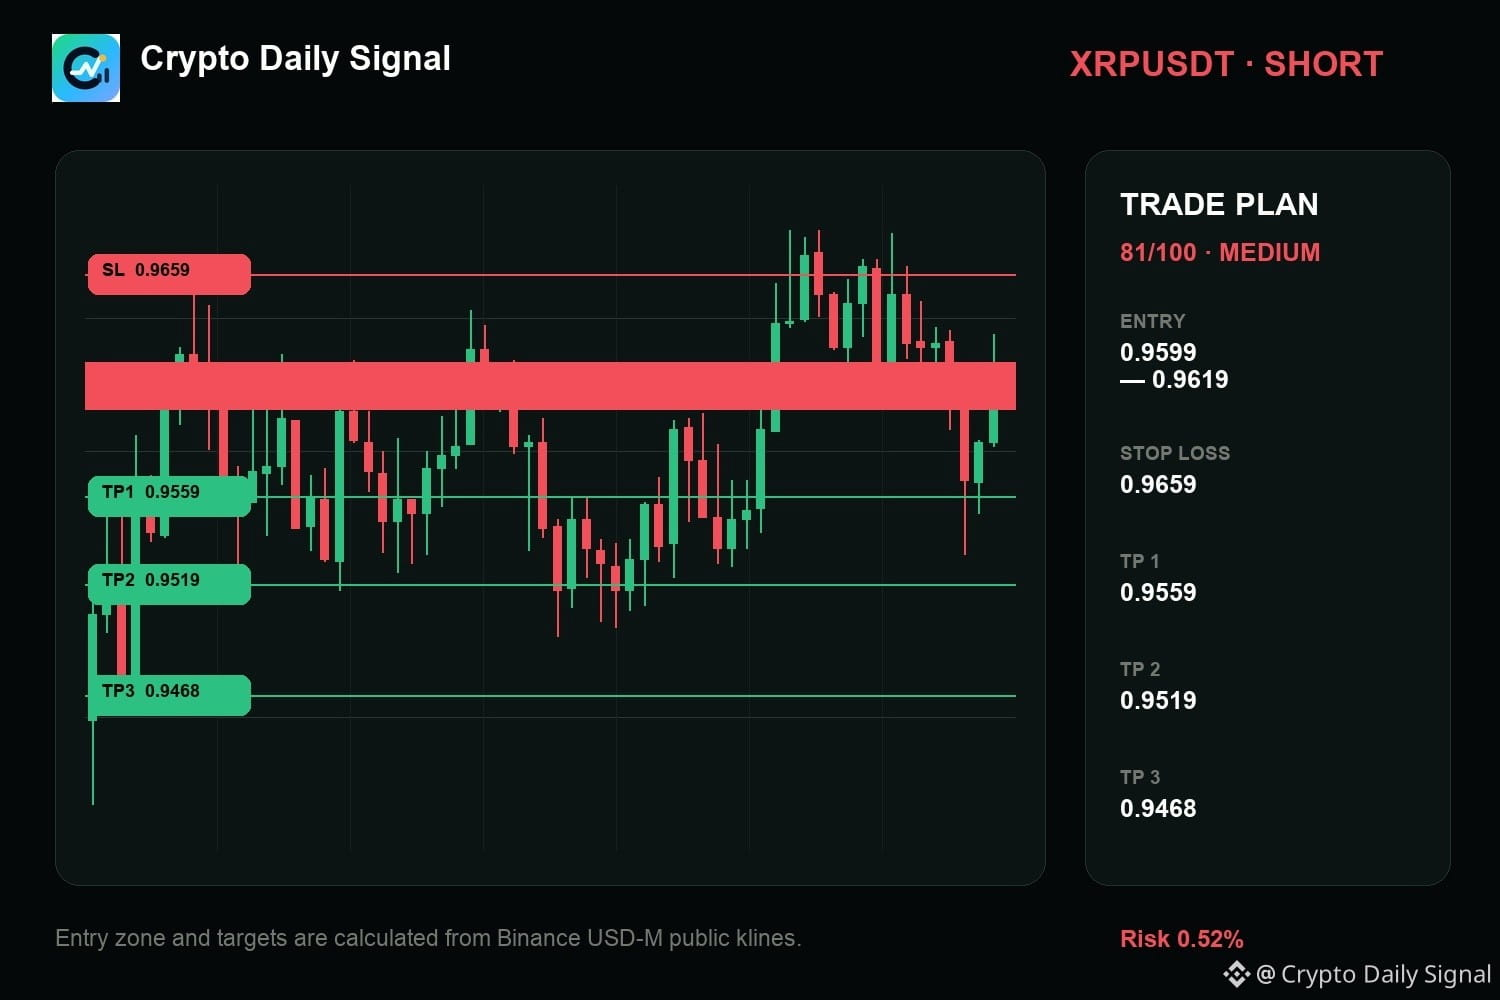
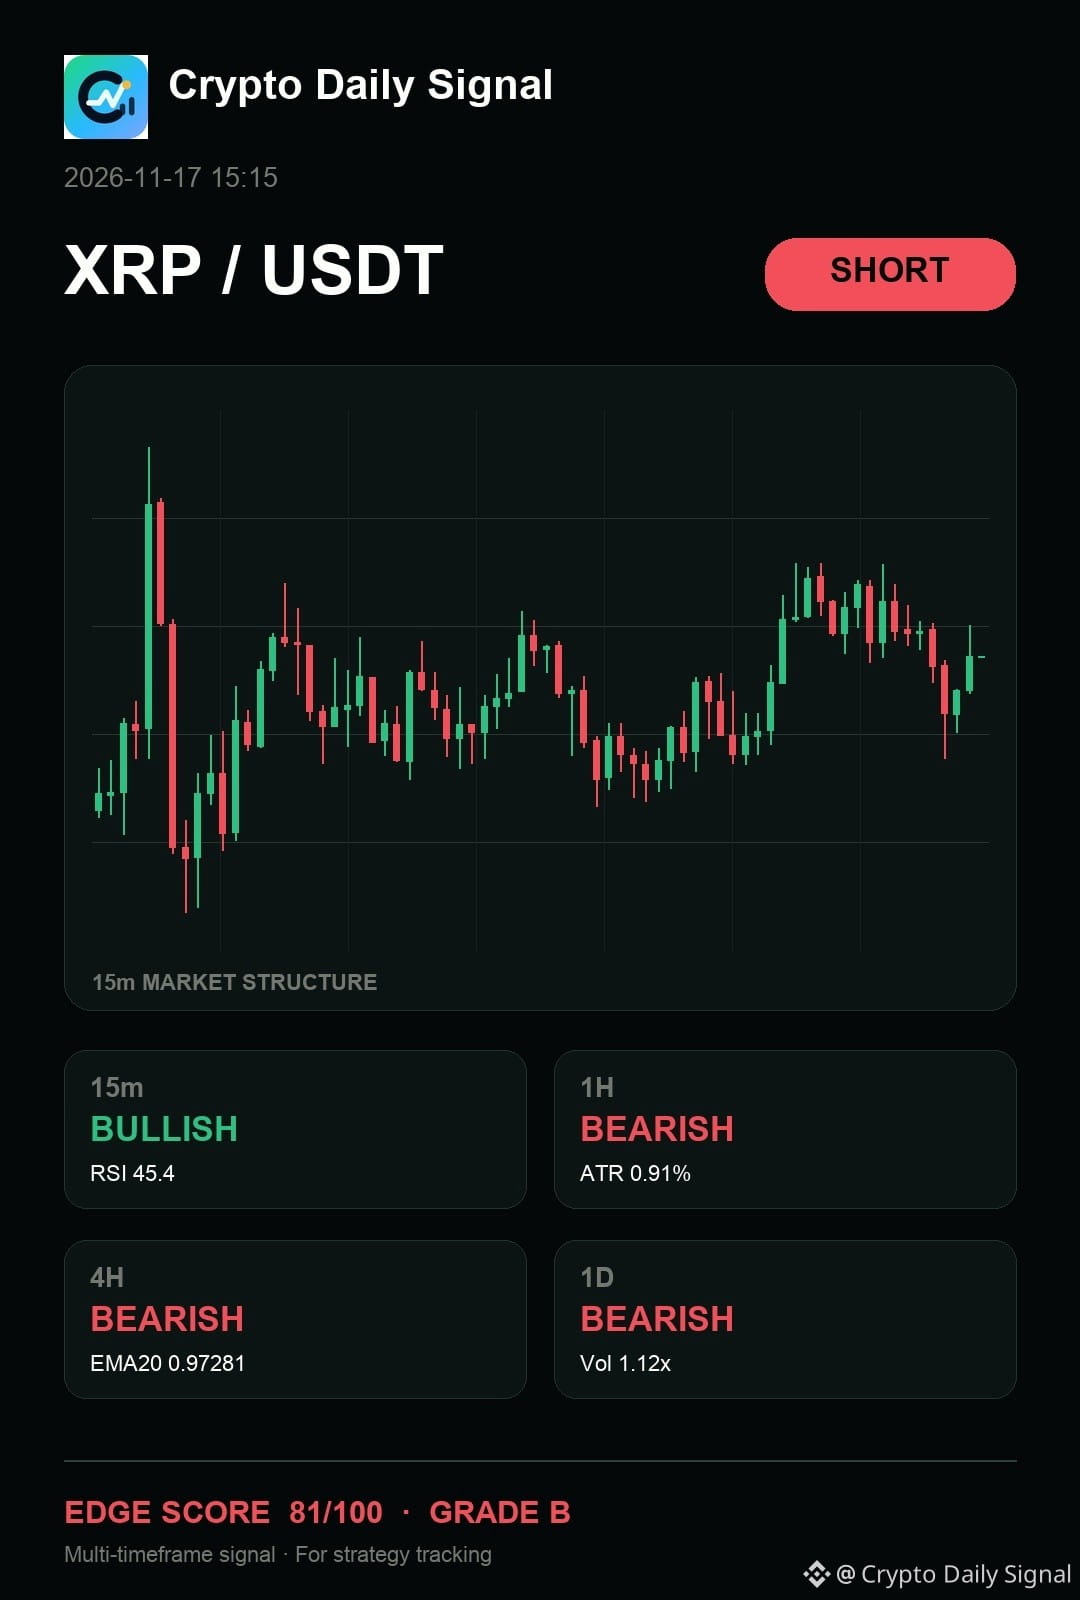
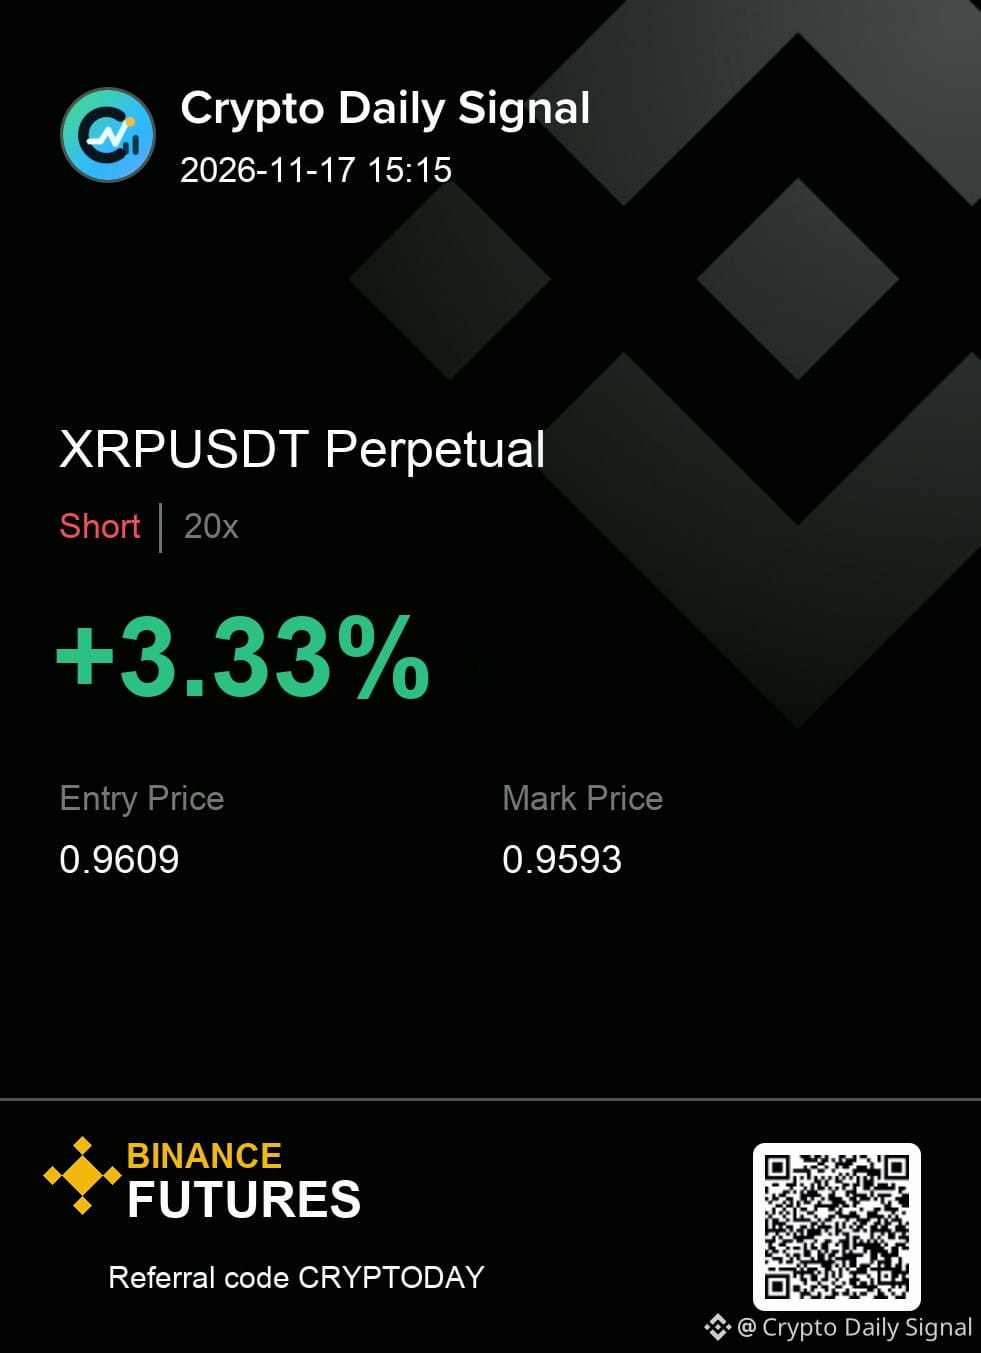
$XRP keeps the bearish thesis active as the broader daily trend remains down, even while the short-term action shows signs of buying pressure. We are seeing successive lower highs forming on the shorter views, suggesting sellers are still in control despite recent wicks pushing against resistance. The bearish picture holds unless it decisively closes above the recent short-term ceiling.
XRPUSDT SHORT
IN 0.9599 - 0.9619
OUT 0.9659
TP 0.9559 · 0.9519 · 0.9468
#TradingSignal
{future}(XRPUSDT)
$XRP keeps the bearish thesis active as the broader daily trend remains down, even while the short-term action shows signs of buying pressure. We are seeing successive lower highs forming on the shorter views, suggesting sellers are still in control despite recent wicks pushing against resistance. The bearish picture holds unless it decisively closes above the recent short-term ceiling.
XRPUSDT SHORT
IN 0.9599 - 0.9619
OUT 0.9659
TP 0.9559 · 0.9519 · 0.9468
#TradingSignal
XRPUSDT SHORT
IN 0.9599 - 0.9619
OUT 0.9659
TP 0.9559 · 0.9519 · 0.9468
#TradingSignal
6
·
--
🔥 EVAA LONG SETUP
Combined Score: 74.47 | Performance: 100%
Entry: 3.8935 | SL: 3.8229 | TP1: 3.9994 | TP2: 4.0701
Bullish breakout confirmed by massive volume spikes and strong price momentum.
⚠️ This is a trading setup, not a guaranteed result.
Question: Are you ready to ride this breakout? 📈
#CryptoAnalysis
$EVAA #TradingSignal #CryptoAnalysis
🔥 EVAA LONG SETUP
Combined Score: 74.47 | Performance: 100%
Entry: 3.8935 | SL: 3.8229 | TP1: 3.9994 | TP2: 4.0701
Bullish breakout confirmed by massive volume spikes and strong price momentum.
⚠️ This is a trading setup, not a guaranteed result.
Question: Are you ready to ride this breakout? 📈
#CryptoAnalysis
$EVAA #TradingSignal #CryptoAnalysis
Combined Score: 74.47 | Performance: 100%
Entry: 3.8935 | SL: 3.8229 | TP1: 3.9994 | TP2: 4.0701
Bullish breakout confirmed by massive volume spikes and strong price momentum.
⚠️ This is a trading setup, not a guaranteed result.
Question: Are you ready to ride this breakout? 📈
#CryptoAnalysis
$EVAA #TradingSignal #CryptoAnalysis

349
·
--
🔥 V4 validated short setup on AIOTUSDT.
Combined score 75.87 with perfect 100 performance. Strong volume spikes confirm bearish pressure. Structure shows a breakdown with momentum shifting down.
Entry: 0.07999 | SL: 0.082025 | TP1: 0.076938 | TP2: 0.074903
⚠️ This is a setup, not a guaranteed result.
Question: Will AIOT hold below 0.08?
#BinanceSquare
$AIOT #TradingSignal #CryptoAnalysis
🔥 V4 validated short setup on AIOTUSDT.
Combined score 75.87 with perfect 100 performance. Strong volume spikes confirm bearish pressure. Structure shows a breakdown with momentum shifting down.
Entry: 0.07999 | SL: 0.082025 | TP1: 0.076938 | TP2: 0.074903
⚠️ This is a setup, not a guaranteed result.
Question: Will AIOT hold below 0.08?
#BinanceSquare
$AIOT #TradingSignal #CryptoAnalysis
Combined score 75.87 with perfect 100 performance. Strong volume spikes confirm bearish pressure. Structure shows a breakdown with momentum shifting down.
Entry: 0.07999 | SL: 0.082025 | TP1: 0.076938 | TP2: 0.074903
⚠️ This is a setup, not a guaranteed result.
Question: Will AIOT hold below 0.08?
#BinanceSquare
$AIOT #TradingSignal #CryptoAnalysis

115
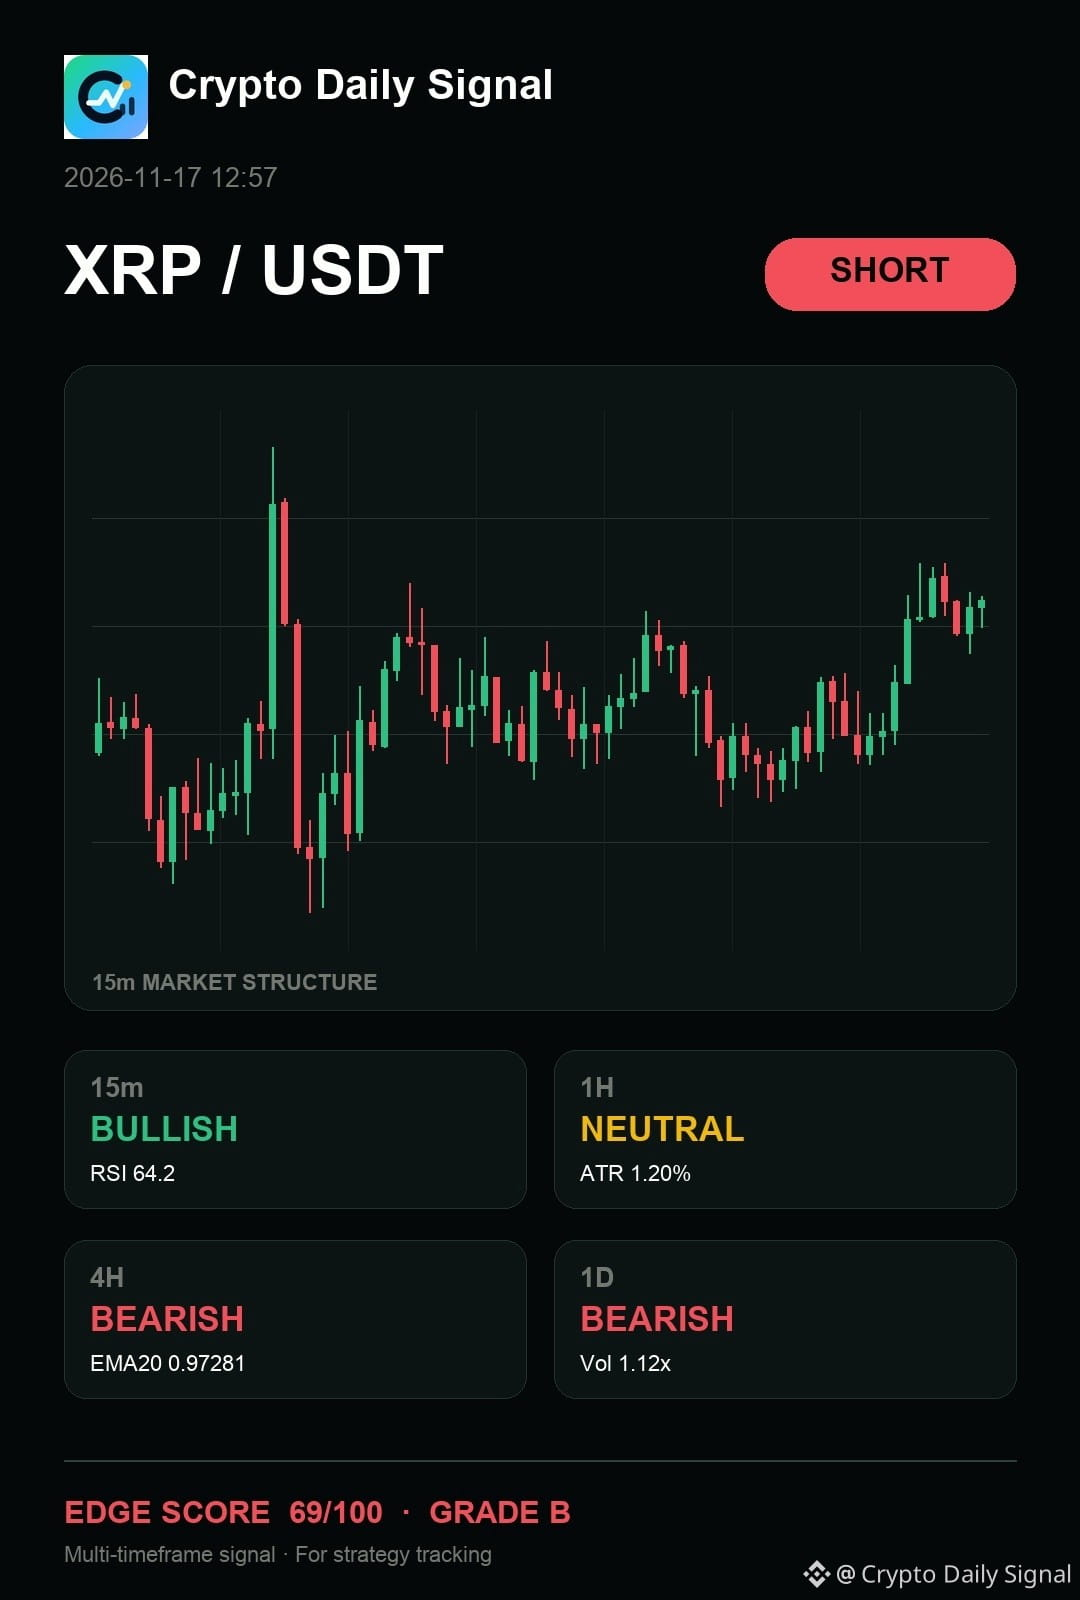
$XRP — look, my read is simple: it needs the sell-side reaction to confirm this tight range bottoming out. The lower highs coming in on the shorter timeframes suggest some weakness despite the near-neutral hourly picture. A solid close beneath the current trading floor would signal the start of downward movement, but a strong push back over the recent high cancels the short premise.
The levels matter more than the prediction. Size it accordingly.
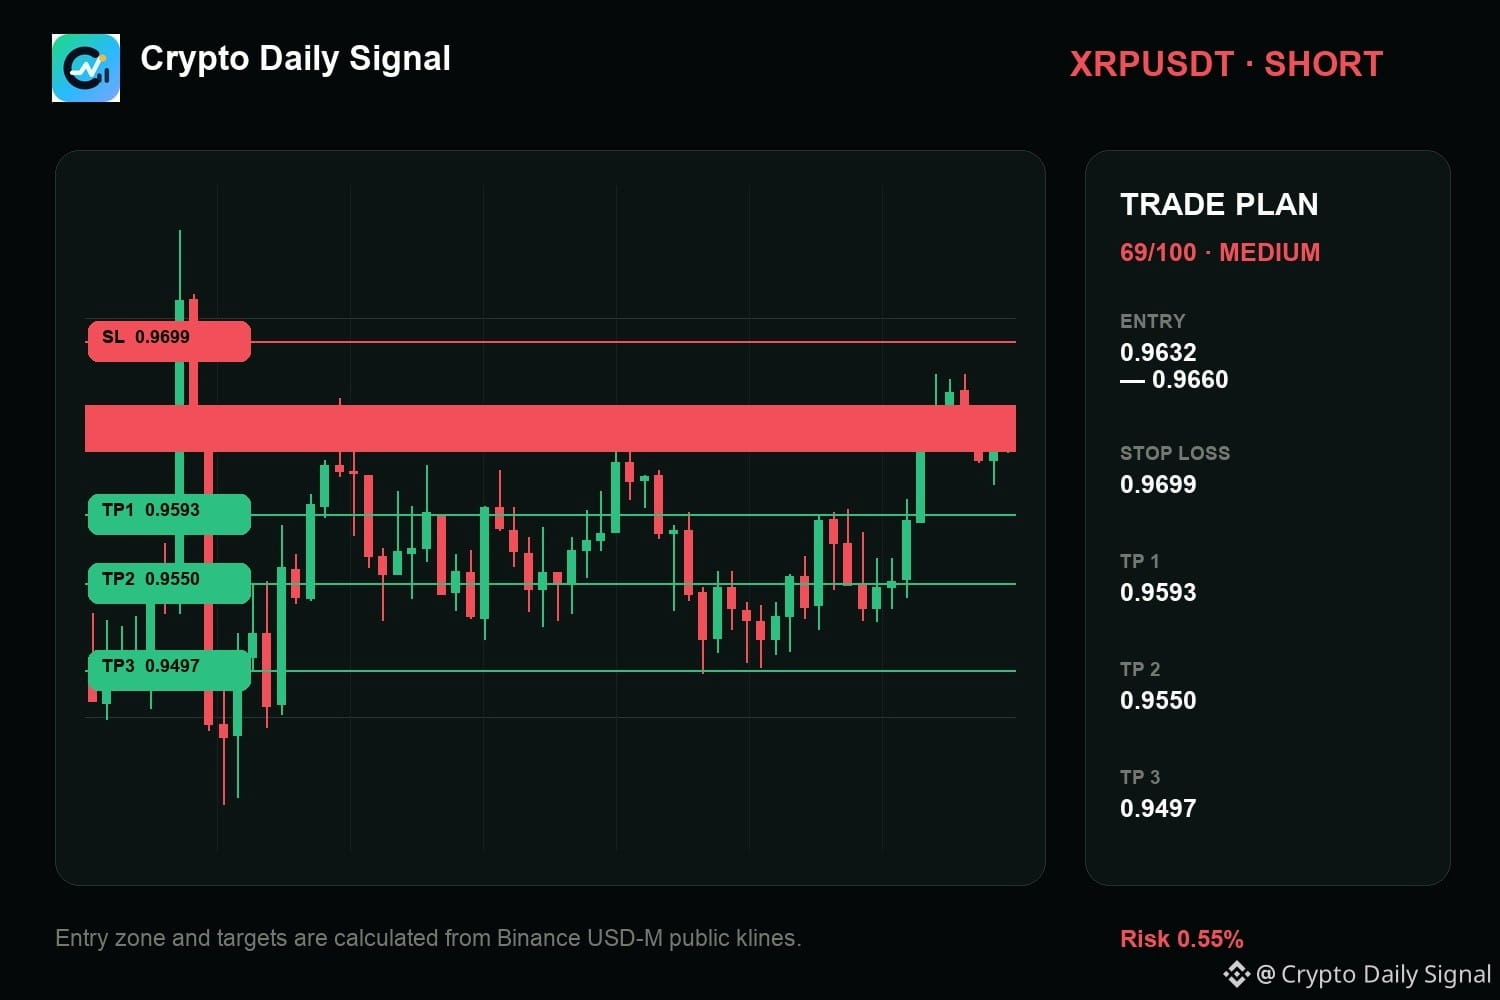
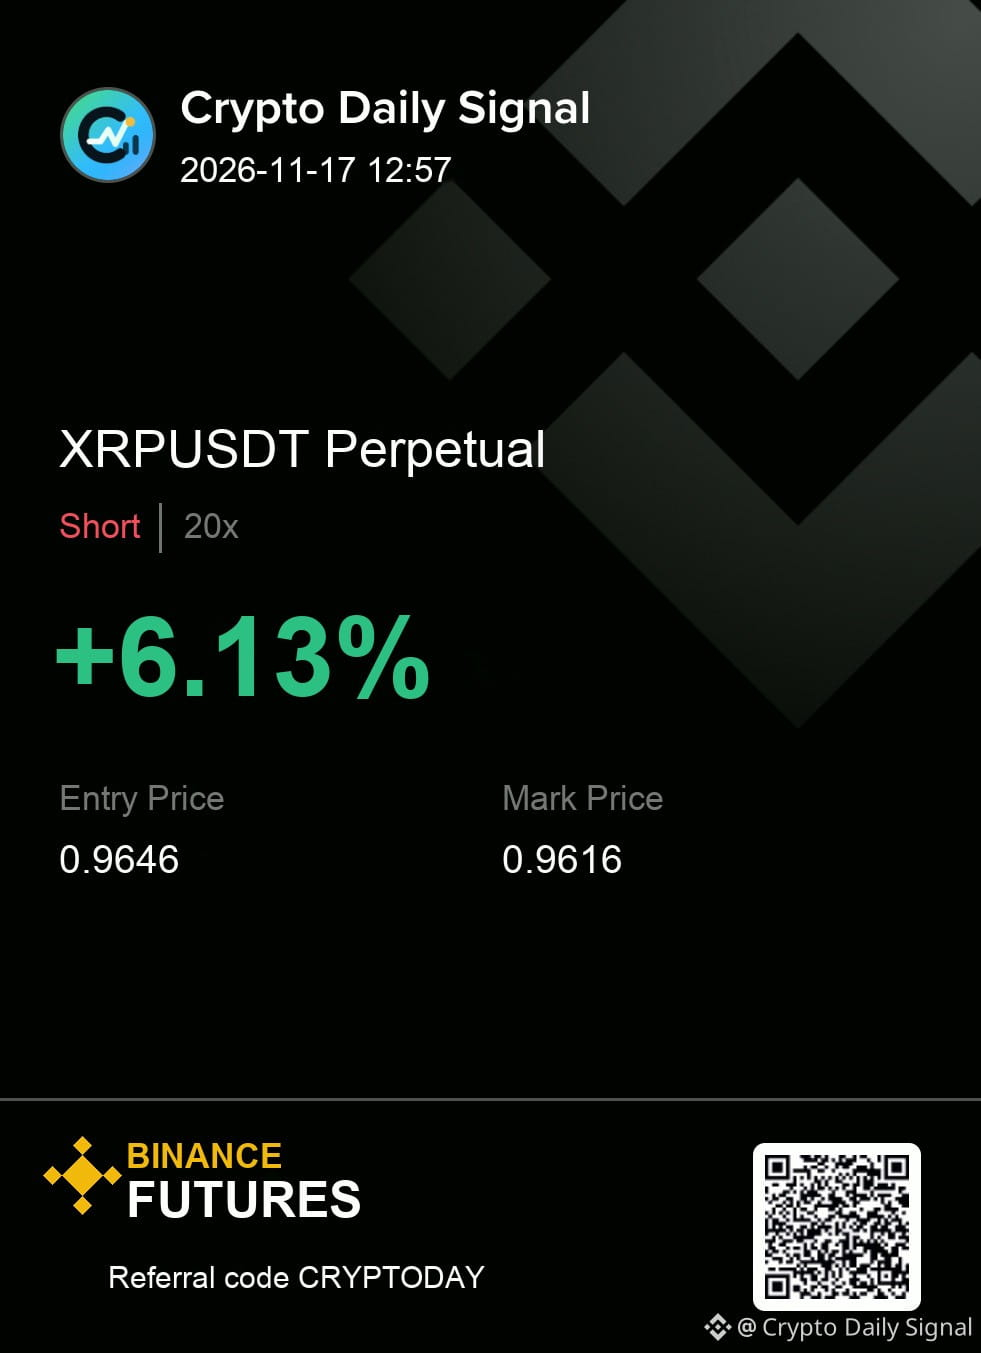
Execution plan (XRPUSDT — SHORT)
Entry: 0.9632 - 0.9660 | SL: 0.9699
Take profit: 0.9593 → 0.9550 → 0.9497
#TradingSignal
{future}(XRPUSDT)
$XRP — look, my read is simple: it needs the sell-side reaction to confirm this tight range bottoming out. The lower highs coming in on the shorter timeframes suggest some weakness despite the near-neutral hourly picture. A solid close beneath the current trading floor would signal the start of downward movement, but a strong push back over the recent high cancels the short premise.
The levels matter more than the prediction. Size it accordingly.
Execution plan (XRPUSDT — SHORT)
Entry: 0.9632 - 0.9660 | SL: 0.9699
Take profit: 0.9593 → 0.9550 → 0.9497
#TradingSignal
The levels matter more than the prediction. Size it accordingly.
Execution plan (XRPUSDT — SHORT)
Entry: 0.9632 - 0.9660 | SL: 0.9699
Take profit: 0.9593 → 0.9550 → 0.9497
#TradingSignal
17
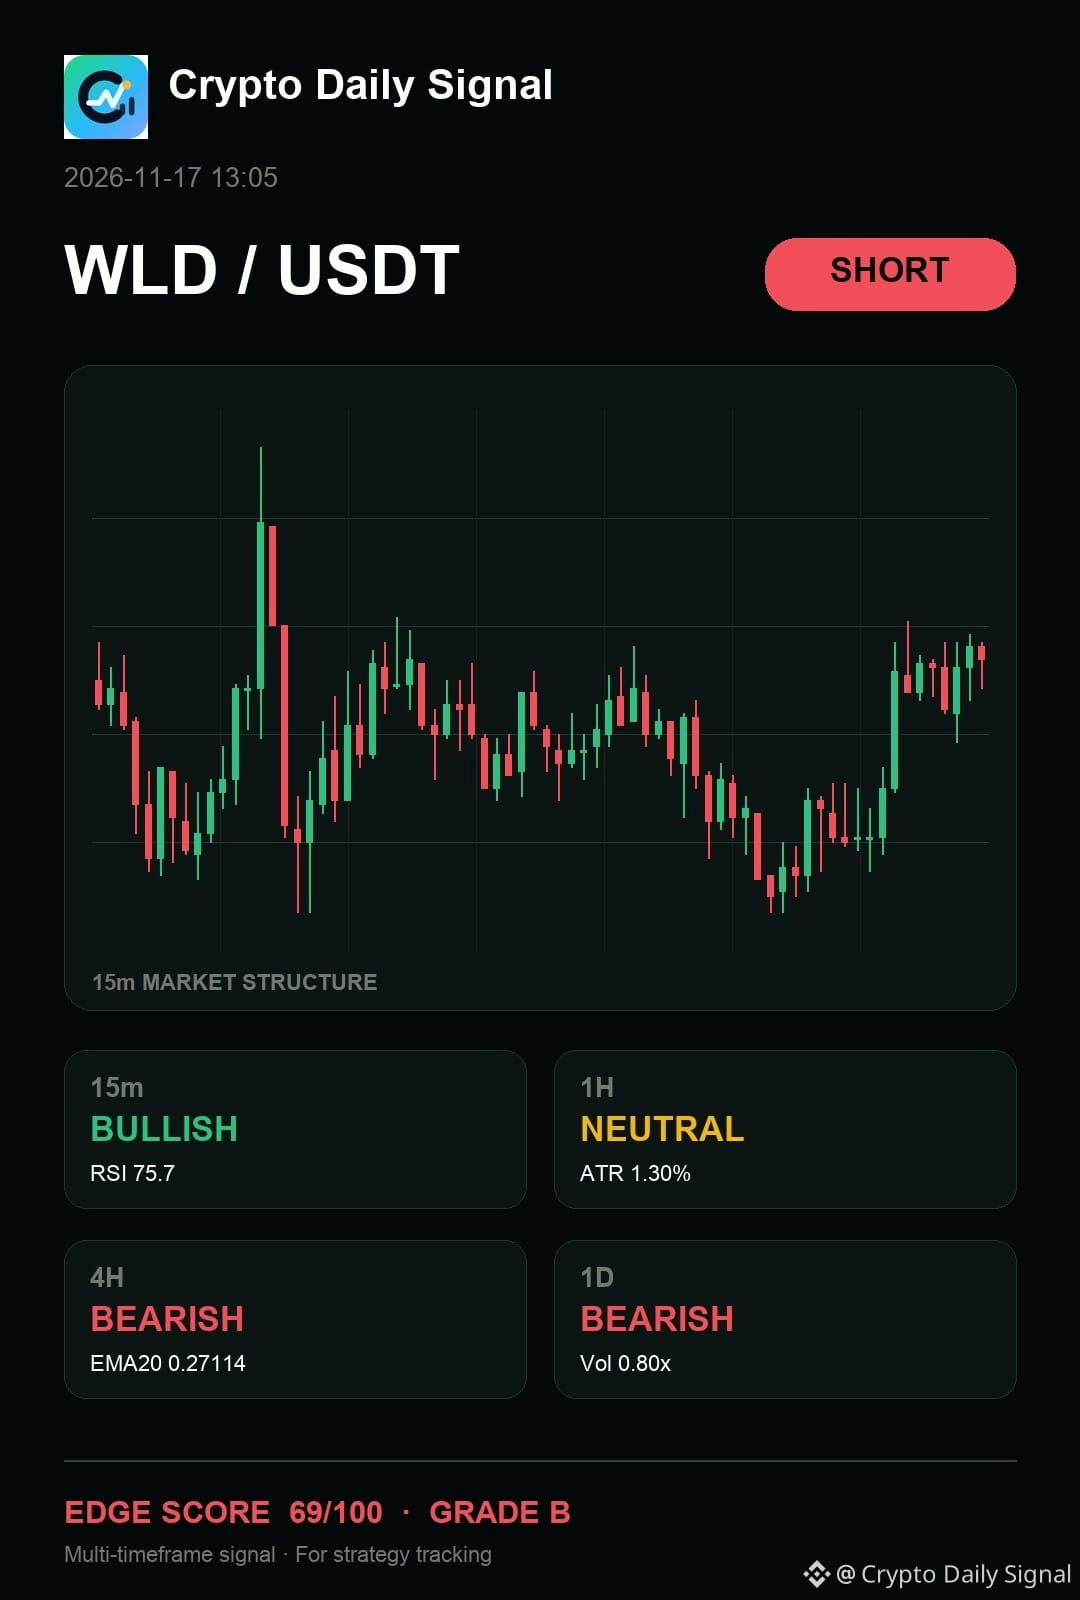
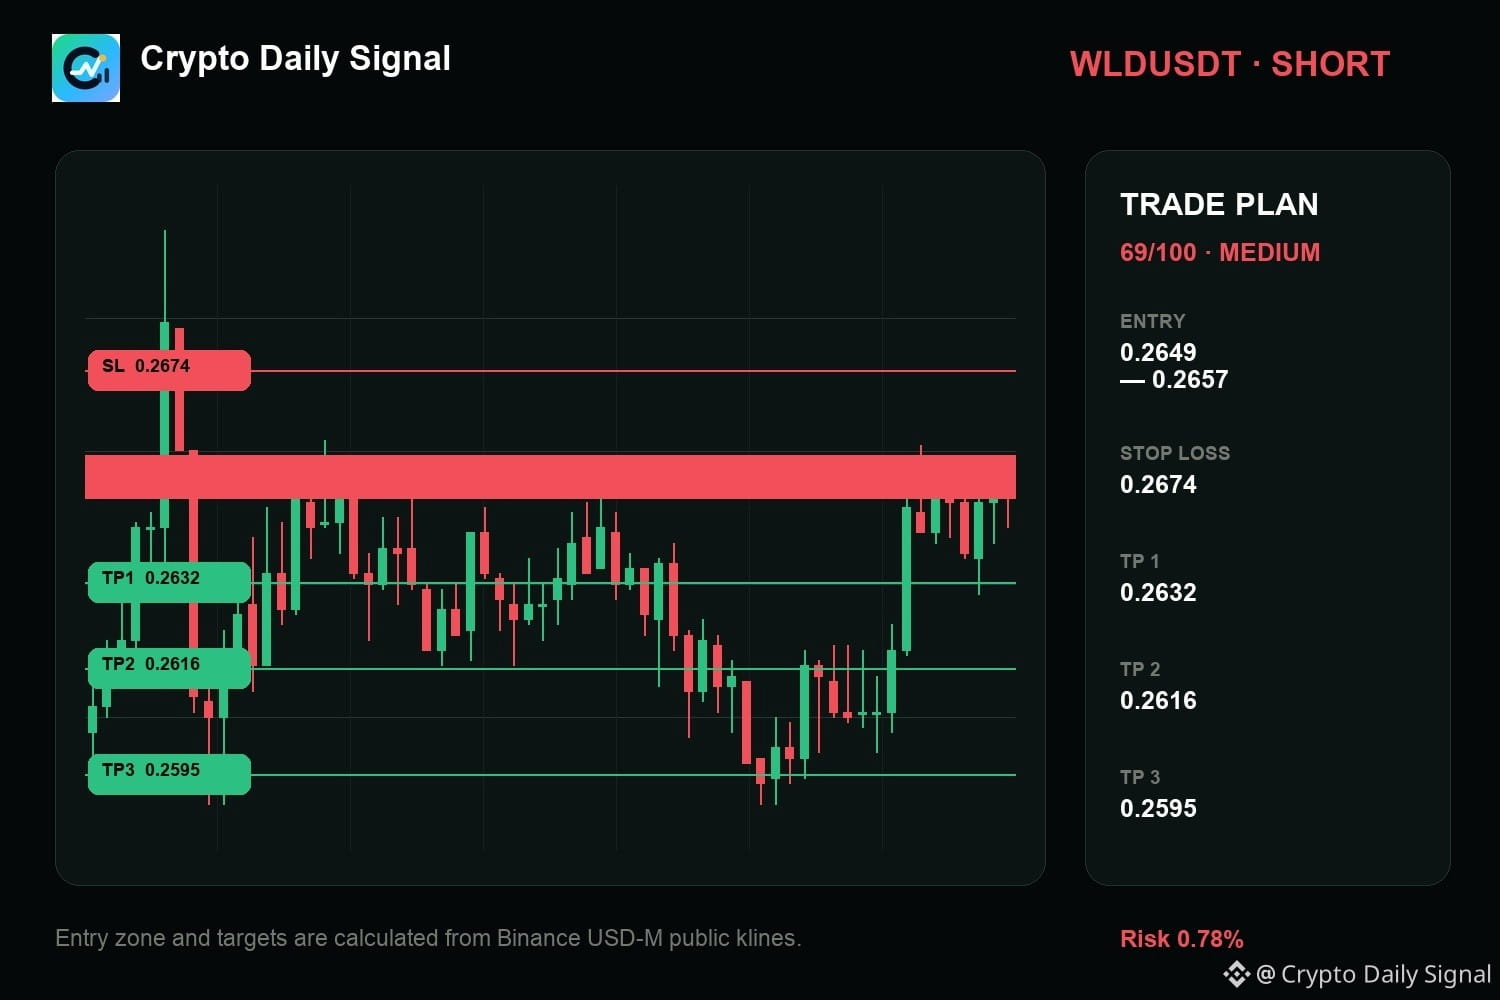
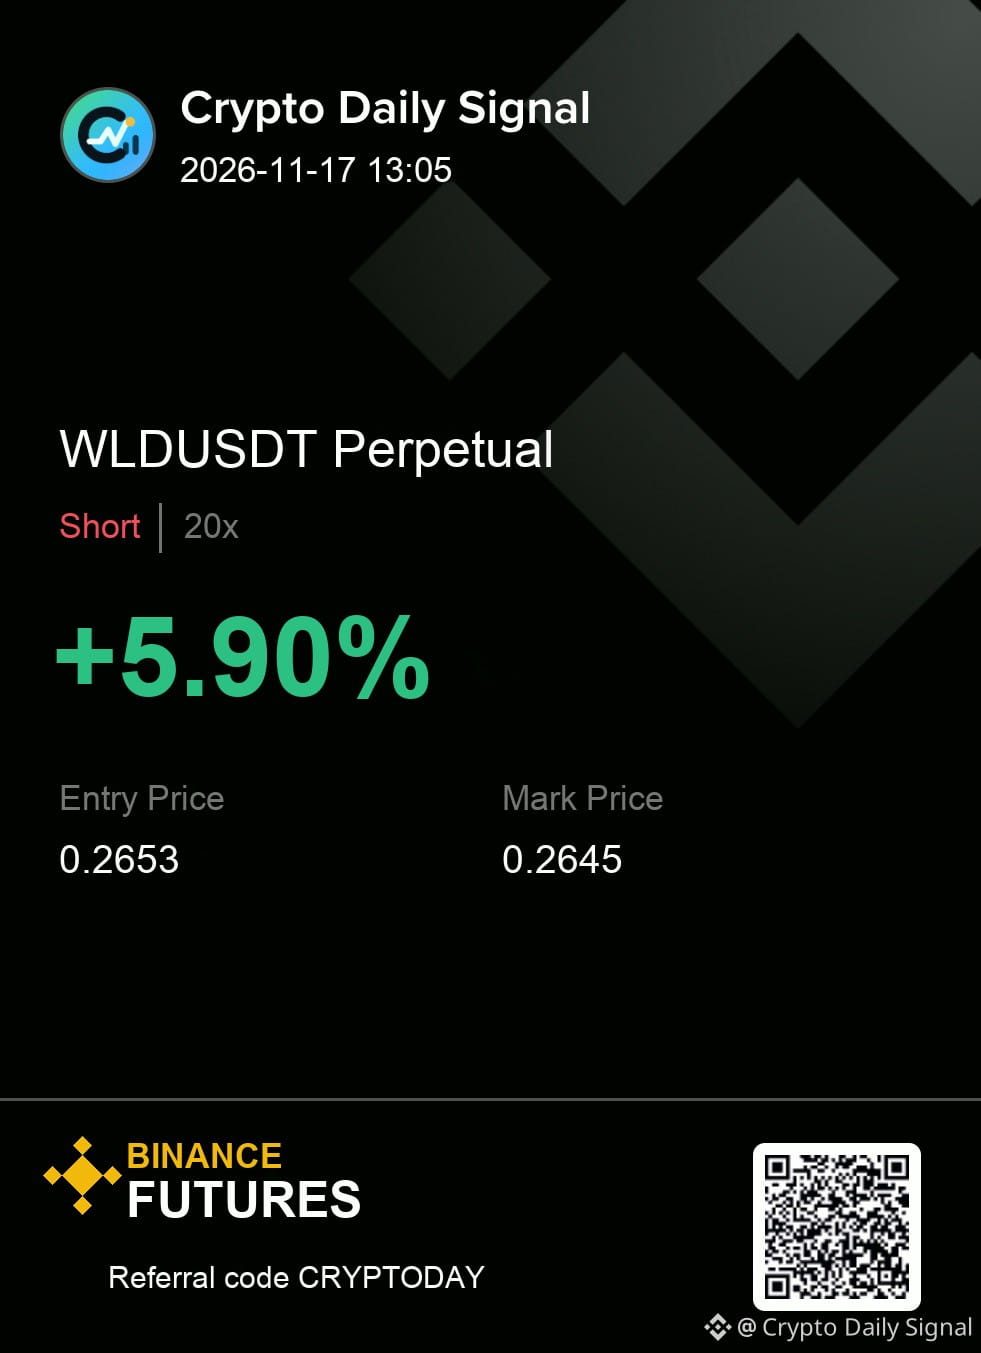
$WLD — bro, here's my read: it still has a valid bearish path because the pattern shows sequential lower highs and lower lows. The four-hour bias remains clearly downward despite some short-term buying pops. A break below the recent short-term range floor confirms this direction.
Clean enough to execute, or still too early for you?
Levels — WLDUSDT
Zone: 0.2649 - 0.2657
Cut: 0.2674
Scale: 0.2632 | 0.2616 | 0.2595
#TradingSignal
{future}(WLDUSDT)
$WLD — bro, here's my read: it still has a valid bearish path because the pattern shows sequential lower highs and lower lows. The four-hour bias remains clearly downward despite some short-term buying pops. A break below the recent short-term range floor confirms this direction.
Clean enough to execute, or still too early for you?
Levels — WLDUSDT
Zone: 0.2649 - 0.2657
Cut: 0.2674
Scale: 0.2632 | 0.2616 | 0.2595
#TradingSignal
Clean enough to execute, or still too early for you?
Levels — WLDUSDT
Zone: 0.2649 - 0.2657
Cut: 0.2674
Scale: 0.2632 | 0.2616 | 0.2595
#TradingSignal
7
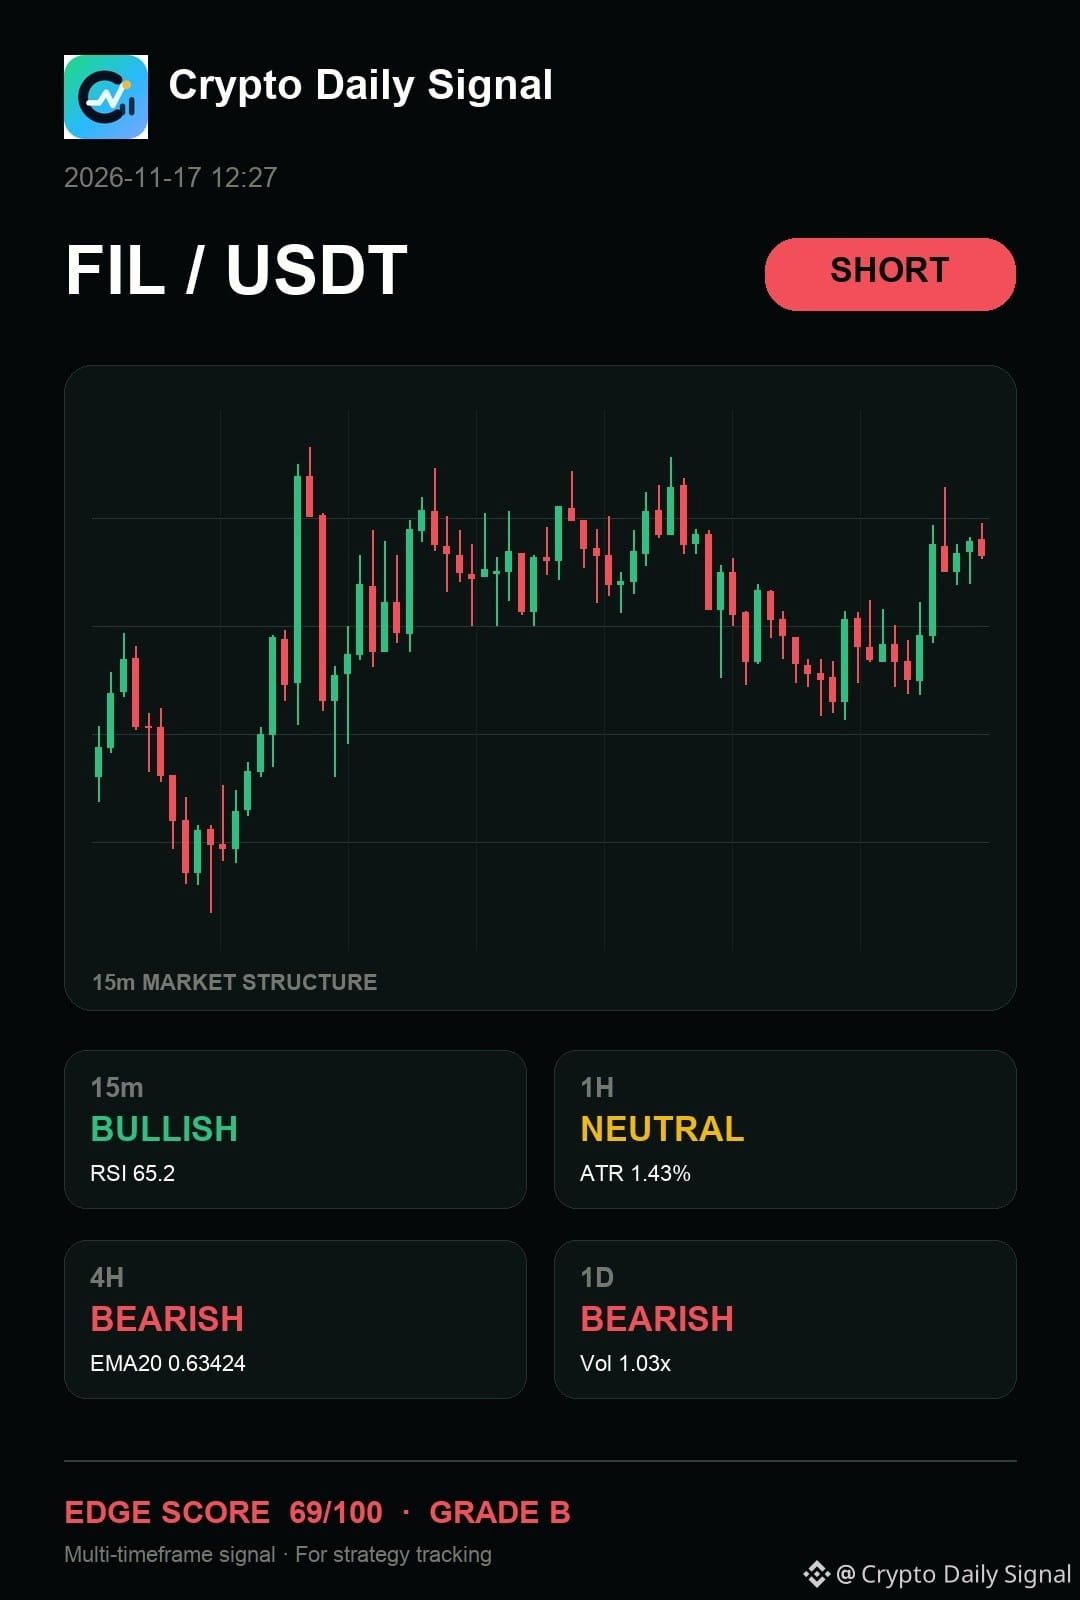
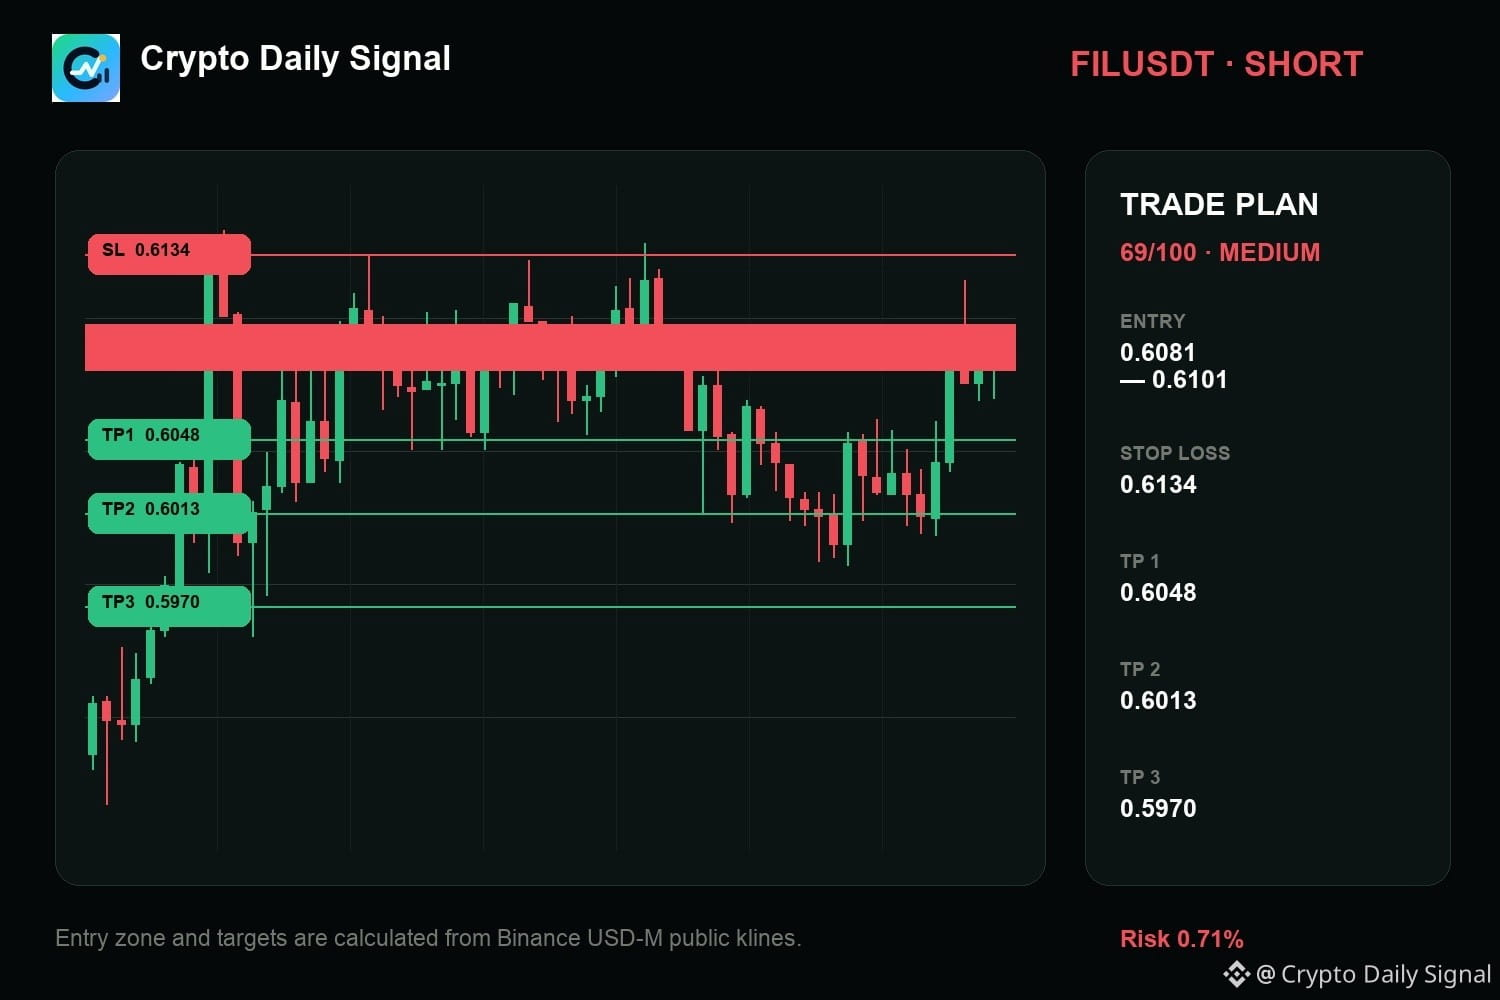
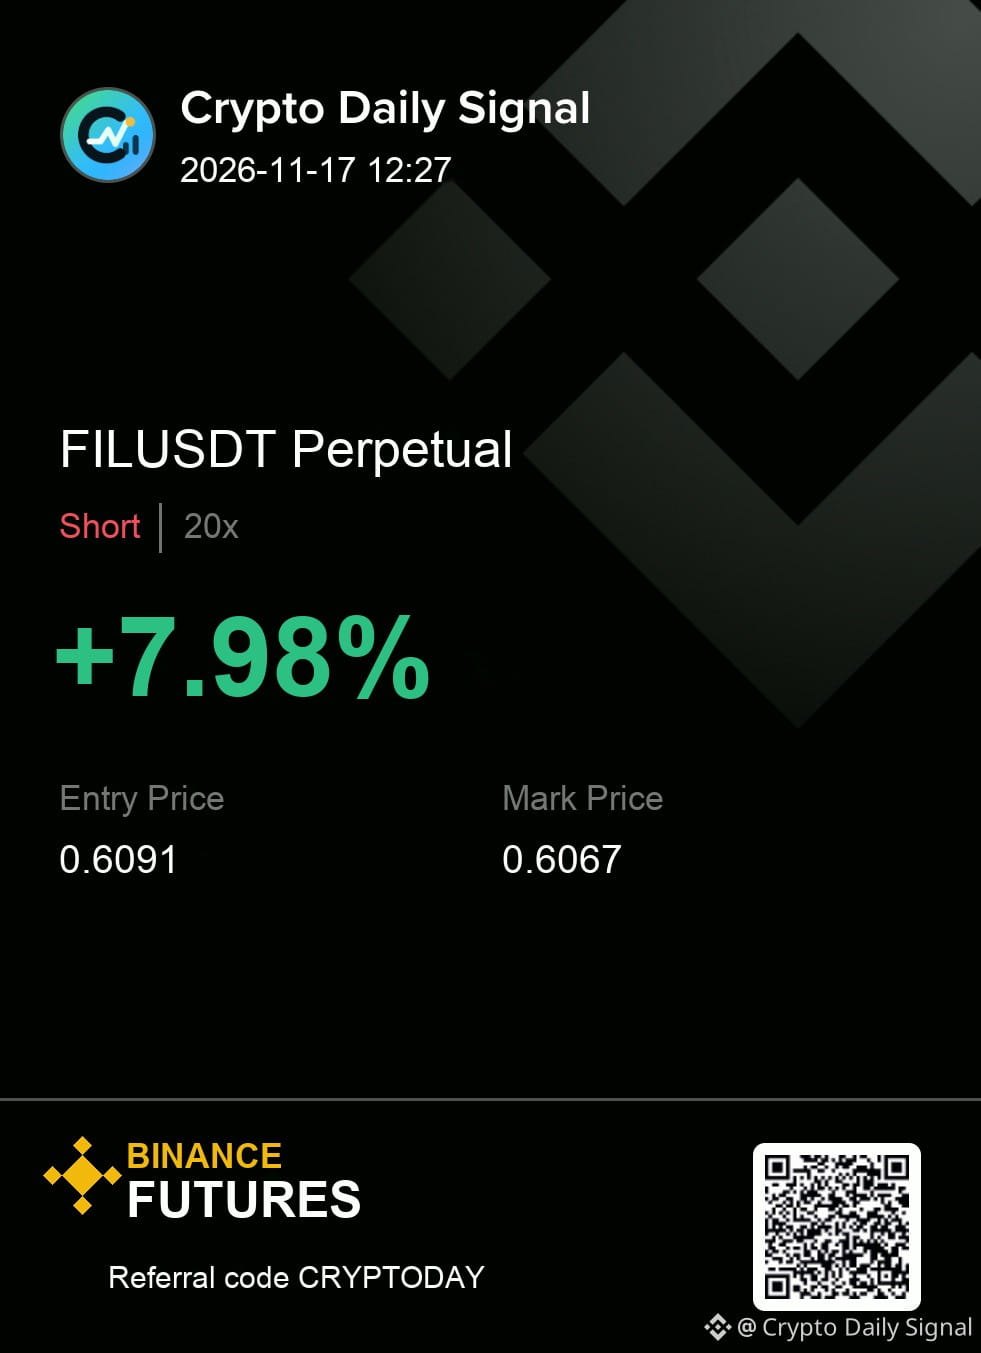
$FIL — real talk, I am treating it like it needs the sell-side reaction to confirm the fading short-term momentum. While the short-term trading range shows some rejection at the top, the larger picture on the daily and four-hour charts stays bearish. A clean close under the current range floor is what I need to see before making a move.
Levels — FILUSDT
Zone: 0.6081 - 0.6101
Cut: 0.6134
Scale: 0.6048 | 0.6013 | 0.5970
No chase outside the zone; the stop defines the whole idea.
#TradingSignal
{future}(FILUSDT)
$FIL — real talk, I am treating it like it needs the sell-side reaction to confirm the fading short-term momentum. While the short-term trading range shows some rejection at the top, the larger picture on the daily and four-hour charts stays bearish. A clean close under the current range floor is what I need to see before making a move.
Levels — FILUSDT
Zone: 0.6081 - 0.6101
Cut: 0.6134
Scale: 0.6048 | 0.6013 | 0.5970
No chase outside the zone; the stop defines the whole idea.
#TradingSignal
Levels — FILUSDT
Zone: 0.6081 - 0.6101
Cut: 0.6134
Scale: 0.6048 | 0.6013 | 0.5970
No chase outside the zone; the stop defines the whole idea.
#TradingSignal
30
Log in to explore more content
Join global crypto users on Binance Square
⚡️ Get latest and useful information about crypto.
💬 Trusted by the world’s largest crypto exchange.
👍 Discover real insights from verified creators.
Email / Phone number
Trending Topics
1
#NvidiaEarningsTonight:AIStocks’NextMove?
47,709 views
742 Discussing
2
#A Packed Week of Earnings and Data Tests Markets
115,795 views
585 Discussing
3
#AnthropicIPOTestsInvestorAppetiteForAI
252,113 views
2,469 Discussing
4
#NvidiaBoardNotConsideringHuang’sReturnasCEO
66,214 views
687 Discussing
5
#KOSPIFalls2.59%ToLowestCloseSinceFebruary
6,802 views
118 Discussing
6
#AnthropicClearedToListOnNasdaqAsANT
9,640 views
120 Discussing
7
#WhatInvestmentSignalsDo13FFilingsReveal?
39,287 views
518 Discussing
8
#TetherCapitalMakesStrategicInvestmentInStables
1,909 views
24 Discussing
9
#EvernorthRecords$505MImpairmentOnPreListingXRP
1,022 views
16 Discussing
10
#GoldmanSachsReports$1.22BInEtherETFHoldings
723 views
15 Discussing