
#pievers
pievers
47,545 views
128 Discussing
Hot
Latest

·
--
Bearish
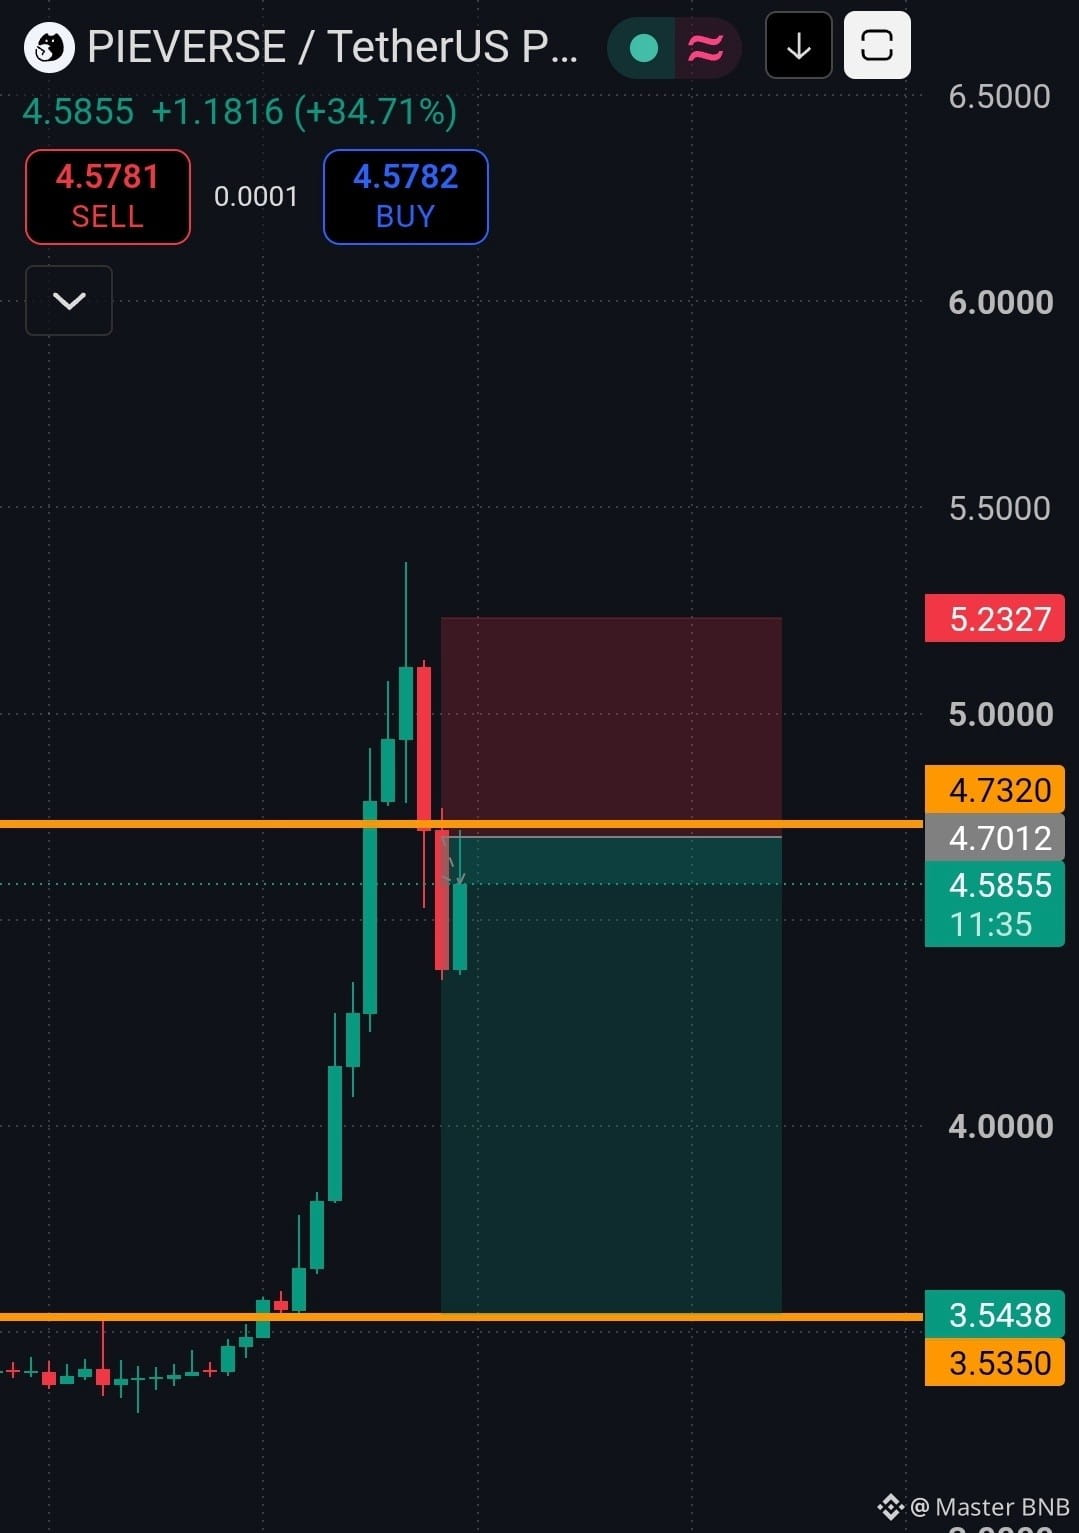
$PIEVERSE open big short alert 🚨
entry price 4.5963
tp 4$
tp 3.500
stop loss 5.200
#Pieverse❤️❤️ #Pievers
{future}(PIEVERSEUSDT)
$PIEVERSE open big short alert 🚨
entry price 4.5963
tp 4$
tp 3.500
stop loss 5.200
#Pieverse❤️❤️ #Pievers
entry price 4.5963
tp 4$
tp 3.500
stop loss 5.200
#Pieverse❤️❤️ #Pievers
NancyLoner:
Go and rest this boy
2
4
2.8k

Article
🚀🚀🚀 BINANCE SQUARE CRYPTO MARKET UPDATE
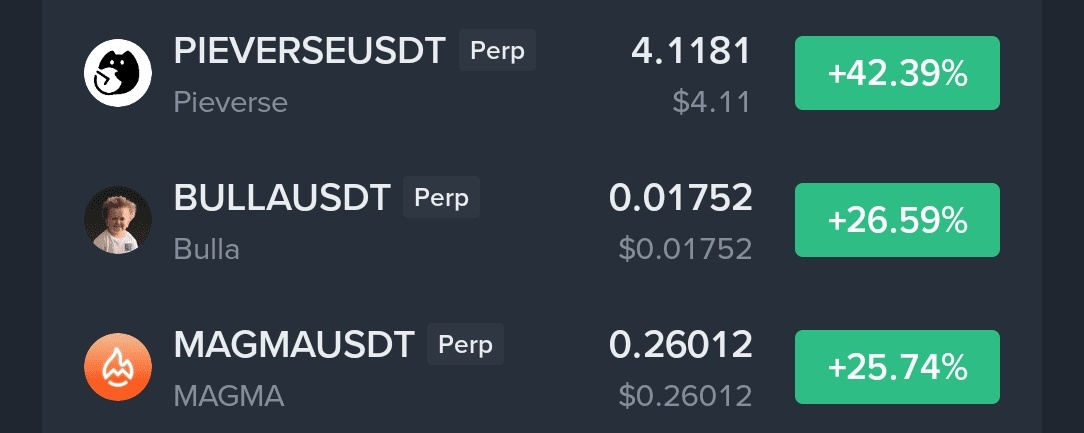
🚀 📅 22 November 2026🟠 1. $PIEVERSE – Strong Bullish Momentum
**Current reference price:** Approximately $3.57 USDT
**24-hour change:** +20.11%
**Candle:** 🟢 Strong bullish candle
**Potential upside:** +5% to +8%
**Potential downside:** -4% to -7%
PIEVERSE has demonstrated impressive upward momentum, attracting attention from traders looking for short-term opportunities. Its strong daily performance suggests that buyers have been active, but rapid price increases can also encourage profit-taking. Traders should avoid entering simply because the candle is green. A confirmed breakout with sustained volume would provide a stronger indication of continued buying interest.
🕯️ 2. PIEVERSE – Buying Strategy
A possible bullish scenario could develop if PIEVERSE maintains support and continues forming higher lows. Traders may watch whether price holds above nearby support zones and whether green candles close near their highs. If buying volume strengthens, a further upward movement may become possible. However, after a substantial rally, entering too late can expose traders to sudden reversals. Consider waiting for a pullback or a confirmed breakout rather than chasing the market.
📉 3. PIEVERSE – Selling and Risk Outlook
The bearish scenario becomes more relevant if price loses support and begins producing consecutive red candles. A rejection near resistance could trigger short-term selling, especially if traders decide to secure profits after the recent rally. A downside movement of approximately 4% to 7% is a risk scenario, not a fixed target. Traders should monitor candle closes, volume changes, and market conditions before making decisions.
🟡 4. PIEVERSE – Market Psychology
Strong rallies often create excitement and fear of missing out. This emotional pressure can lead traders to buy near local highs without considering their risk. Professional trading requires a different mindset: observe the chart, identify confirmation, and calculate potential losses before entering. PIEVERSE may continue higher, but no candle can guarantee the next movement. Discipline is more valuable than excitement.
🟢 5. $BULLA – Moderate Positive Activity
**Current reference price:** Approximately $0.01484 USDT
**24-hour change:** +4.73%
**Candle:** 🟢 Mild bullish candle
**Potential upside:** +4% to +7%
**Potential downside:** -5% to -8%
BULLA is showing positive movement, although its momentum appears more moderate than PIEVERSE. This type of price action may attract traders searching for a possible continuation pattern. Nevertheless, a modest daily gain does not automatically mean a strong trend is established. Traders should check whether buyers can maintain control and whether volume supports the upward movement.
📊 6. BULLA – Buying Outlook
For a bullish setup, traders may watch for price to remain above a recent support area while forming higher lows. A breakout above resistance accompanied by increased volume could indicate renewed buying interest. If the market continues to strengthen, BULLA may attempt an additional upward move. The illustrative upside range is 4% to 7%, provided that momentum and market conditions remain supportive.
🔴 7. BULLA – Selling Outlook
If BULLA fails to hold support, selling pressure may increase. Red candles with expanding volume could indicate that sellers are becoming more active. In that situation, traders should avoid assuming that every dip is a buying opportunity. A possible downside scenario of 5% to 8% highlights the importance of protecting capital. A planned exit is better than an emotional decision made during a sudden decline.
🕯️ 8. BULLA – Candle Confirmation
A bullish engulfing candle or a strong green candle closing above resistance may offer useful confirmation. Conversely, a long upper wick near resistance can signal rejection and possible profit-taking. Traders should examine candle patterns alongside volume and broader market direction. One candle alone is not sufficient evidence. Confirmation across multiple timeframes can help reduce impulsive trading decisions.
💡 9. BULLA – Trading Discipline
BULLA's positive movement may encourage short-term traders to become overly confident. However, even coins showing moderate gains can experience sharp reversals. Avoid increasing position size simply because the previous trade was profitable. Consistent traders focus on repeatable strategies, not on winning every market move. Protecting capital allows traders to remain active when better opportunities appear.
🔵 10. $MAGMA – Bullish Momentum Watch
**Current reference price:** Approximately $0.24917 USDT
**24-hour change:** +19.45%
**Candle:** 🟢 Strong bullish candle
**Potential upside:** +6% to +10%
**Potential downside:** -5% to -8%
MAGMA has recorded a strong daily advance, placing it among the more active tokens in today's watchlist. Its movement suggests that market participants have been paying attention to the asset. However, strong momentum can attract both new buyers and profit-taking sellers. Traders should monitor whether the price can consolidate rather than immediately entering after a large green candle.
📈 11. MAGMA – Buying Scenario
A bullish continuation could develop if MAGMA holds a support zone and forms a stable consolidation pattern. A breakout above the recent high, supported by increasing volume, may strengthen the bullish outlook. Traders may consider waiting for a retest instead of buying during an extended candle. The potential upside scenario of 6% to 10% depends on continued momentum and should not be treated as a guaranteed return.
⚠️ 12. MAGMA – Downside Scenario
After a strong rally, MAGMA may experience a correction as early buyers take profits. If price falls below support and red candles become dominant, the bullish structure could weaken. A downside scenario of 5% to 8% is possible during a sharp reversal. Traders should define their invalidation level before entering and avoid holding an unsuccessful trade simply because they expect a recovery.
🕯️ 13. MAGMA – Candle and Volume Analysis
The most important signal is not simply the size of the green candle but whether buyers can sustain the move. A strong candle with high volume may indicate conviction, while a large candle with weakening volume can signal exhaustion. Long upper wicks may show resistance. Traders should observe candle closes and volume changes before deciding whether momentum is continuing or fading.
🔥 14. Comparing the Three Tokens
PIEVERSE and MAGMA are displaying stronger daily gains, while BULLA is showing a more moderate positive move. Higher momentum can create greater opportunity, but it can also increase volatility and downside exposure. Traders should not automatically choose the coin with the largest percentage gain. Liquidity, spread, trading volume, and personal risk tolerance are equally important when evaluating potential setups.
📊 15. Illustrative Upside and Downside Ratio
PIEVERSE: +5% to +8% potential versus -4% to -7% risk.
BULLA: +4% to +7% potential versus -5% to -8% risk.
MAGMA: +6% to +10% potential versus -5% to -8% risk.
These ranges are illustrative market scenarios, not verified price targets or recommendations. The actual risk-to-reward ratio depends on the entry price, stop-loss placement, and exit plan. Always calculate the ratio using your own trade setup before placing an order.
🧭 16. Support and Resistance
Support is an area where buyers may attempt to prevent further declines. Resistance is an area where selling pressure may interrupt an upward movement. Traders should identify these zones using recent highs, lows, and candle closes. Avoid treating support and resistance as exact prices. Markets can briefly move beyond a level before reversing, so confirmation matters.
📉 17. Bitcoin and Overall Market Direction
Altcoins rarely operate independently of the broader cryptocurrency market. A sudden Bitcoin decline can weaken PIEVERSE, BULLA, and MAGMA even when their individual charts appear bullish. Before opening a position, check Bitcoin's trend, market volatility, and overall trading sentiment. A strong altcoin setup becomes more vulnerable when the wider market is experiencing heavy selling pressure.
🛡️ 18. Risk Management for Binance Traders
Never risk money you cannot afford to lose. Traders should determine their position size according to the distance between entry and stop-loss. Avoid using excessive leverage, especially when trading volatile tokens. A small market movement can create a large loss in leveraged positions. Responsible trading begins with capital protection, not with the pursuit of maximum profit.
🎯 19. Short-Term Trading Plan
A practical approach is to wait for confirmation, enter only when the setup matches your strategy, and define an exit before placing the order. Traders may use spot trading to avoid liquidation risk associated with leverage. For futures, understand funding fees, liquidation prices, and margin requirements. Never enter a trade without knowing where the idea becomes invalid.
🧠 20. Avoid FOMO and Emotional Decisions
Fear of missing out can push traders into buying after a token has already made a large move. Fear can also cause premature selling during a normal pullback. Both reactions can damage a trading plan. Stay calm, follow your strategy, and remember that missing one opportunity is better than taking an unplanned loss.
📚 21. Trading Education – Learn from Every Candle
Candlestick charts provide information about price movement, but they do not predict the future with certainty. Green candles show upward movement during the selected period, while red candles show downward movement. Wicks reveal the range reached before the candle closed. Combining candles with volume, trend analysis, and risk management creates a more complete trading picture.
🌟 22. Motivation for Crypto Traders
Success in trading is not measured by one profitable day. It comes from patience, preparation, and the ability to manage losses. Every experienced trader has faced difficult market conditions. The difference is learning from mistakes instead of repeating them. Stay focused on improvement, protect your capital, and build confidence through disciplined decisions.
🔔 23. Binance Square Community Discussion
Which token are you watching today: $PIEVERSE, $BULLA, or $MAGMA? Are you waiting for a bullish breakout, planning to buy a confirmed pullback, or staying cautious until the market stabilizes? Share your chart observations and trading ideas respectfully. Always conduct your own research before making any buying or selling decision.
🟢 24. Final Market Outlook
Today's watchlist shows positive momentum across all three tokens, with PIEVERSE and MAGMA recording stronger gains and BULLA displaying a more moderate advance. The bullish scenarios remain dependent on support, volume, and broader market conditions. A correction is always possible after a rapid rally. Traders should prioritize confirmation and avoid assuming that recent gains will continue indefinitely.
🏆 25. Conclusion – Trade Smart, Stay Strong
Dear Binancians, the crypto market rewards patience more consistently than impulsive decisions. Watch the candles, respect support and resistance, and manage your risk before entering any trade. Whether you choose buying, selling, or waiting, make your decision through research and discipline. Stay motivated, continue learning, and never allow one trade to control your financial future.
**Trade responsibly. Protect your capital. Keep learning.**
#BinanceSquare #Pievers #BULLA #MAGMAUSD #CryptoMarket #TradingEducation #KumailAbbasAkmal #KumailAkmalTraders
{future}(MAGMAUSDT)
{future}(BULLAUSDT)
{future}(PIEVERSEUSDT)
🚀🚀🚀 BINANCE SQUARE CRYPTO MARKET UPDATE 🚀 📅 22 November 2026
🟠 1. $PIEVERSE – Strong Bullish Momentum
**Current reference price:** Approximately $3.57 USDT
**24-hour change:** +20.11%
**Candle:** 🟢 Strong bullish candle
**Potential upside:** +5% to +8%
**Potential downside:** -4% to -7%
PIEVERSE has demonstrated impressive upward momentum, attracting attention from traders looking for short-term opportunities. Its strong daily performance suggests that buyers have been active, but rapid price increases can also encourage profit-taking. Traders should avoid entering simply because the candle is green. A confirmed breakout with sustained volume would provide a stronger indication of continued buying interest.
🕯️ 2. PIEVERSE – Buying Strategy
A possible bullish scenario could develop if PIEVERSE maintains support and continues forming higher lows. Traders may watch whether price holds above nearby support zones and whether green candles close near their highs. If buying volume strengthens, a further upward movement may become possible. However, after a substantial rally, entering too late can expose traders to sudden reversals. Consider waiting for a pullback or a confirmed breakout rather than chasing the market.
📉 3. PIEVERSE – Selling and Risk Outlook
The bearish scenario becomes more relevant if price loses support and begins producing consecutive red candles. A rejection near resistance could trigger short-term selling, especially if traders decide to secure profits after the recent rally. A downside movement of approximately 4% to 7% is a risk scenario, not a fixed target. Traders should monitor candle closes, volume changes, and market conditions before making decisions.
🟡 4. PIEVERSE – Market Psychology
Strong rallies often create excitement and fear of missing out. This emotional pressure can lead traders to buy near local highs without considering their risk. Professional trading requires a different mindset: observe the chart, identify confirmation, and calculate potential losses before entering. PIEVERSE may continue higher, but no candle can guarantee the next movement. Discipline is more valuable than excitement.
🟢 5. $BULLA – Moderate Positive Activity
**Current reference price:** Approximately $0.01484 USDT
**24-hour change:** +4.73%
**Candle:** 🟢 Mild bullish candle
**Potential upside:** +4% to +7%
**Potential downside:** -5% to -8%
BULLA is showing positive movement, although its momentum appears more moderate than PIEVERSE. This type of price action may attract traders searching for a possible continuation pattern. Nevertheless, a modest daily gain does not automatically mean a strong trend is established. Traders should check whether buyers can maintain control and whether volume supports the upward movement.
📊 6. BULLA – Buying Outlook
For a bullish setup, traders may watch for price to remain above a recent support area while forming higher lows. A breakout above resistance accompanied by increased volume could indicate renewed buying interest. If the market continues to strengthen, BULLA may attempt an additional upward move. The illustrative upside range is 4% to 7%, provided that momentum and market conditions remain supportive.
🔴 7. BULLA – Selling Outlook
If BULLA fails to hold support, selling pressure may increase. Red candles with expanding volume could indicate that sellers are becoming more active. In that situation, traders should avoid assuming that every dip is a buying opportunity. A possible downside scenario of 5% to 8% highlights the importance of protecting capital. A planned exit is better than an emotional decision made during a sudden decline.
🕯️ 8. BULLA – Candle Confirmation
A bullish engulfing candle or a strong green candle closing above resistance may offer useful confirmation. Conversely, a long upper wick near resistance can signal rejection and possible profit-taking. Traders should examine candle patterns alongside volume and broader market direction. One candle alone is not sufficient evidence. Confirmation across multiple timeframes can help reduce impulsive trading decisions.
💡 9. BULLA – Trading Discipline
BULLA's positive movement may encourage short-term traders to become overly confident. However, even coins showing moderate gains can experience sharp reversals. Avoid increasing position size simply because the previous trade was profitable. Consistent traders focus on repeatable strategies, not on winning every market move. Protecting capital allows traders to remain active when better opportunities appear.
🔵 10. $MAGMA – Bullish Momentum Watch
**Current reference price:** Approximately $0.24917 USDT
**24-hour change:** +19.45%
**Candle:** 🟢 Strong bullish candle
**Potential upside:** +6% to +10%
**Potential downside:** -5% to -8%
MAGMA has recorded a strong daily advance, placing it among the more active tokens in today's watchlist. Its movement suggests that market participants have been paying attention to the asset. However, strong momentum can attract both new buyers and profit-taking sellers. Traders should monitor whether the price can consolidate rather than immediately entering after a large green candle.
📈 11. MAGMA – Buying Scenario
A bullish continuation could develop if MAGMA holds a support zone and forms a stable consolidation pattern. A breakout above the recent high, supported by increasing volume, may strengthen the bullish outlook. Traders may consider waiting for a retest instead of buying during an extended candle. The potential upside scenario of 6% to 10% depends on continued momentum and should not be treated as a guaranteed return.
⚠️ 12. MAGMA – Downside Scenario
After a strong rally, MAGMA may experience a correction as early buyers take profits. If price falls below support and red candles become dominant, the bullish structure could weaken. A downside scenario of 5% to 8% is possible during a sharp reversal. Traders should define their invalidation level before entering and avoid holding an unsuccessful trade simply because they expect a recovery.
🕯️ 13. MAGMA – Candle and Volume Analysis
The most important signal is not simply the size of the green candle but whether buyers can sustain the move. A strong candle with high volume may indicate conviction, while a large candle with weakening volume can signal exhaustion. Long upper wicks may show resistance. Traders should observe candle closes and volume changes before deciding whether momentum is continuing or fading.
🔥 14. Comparing the Three Tokens
PIEVERSE and MAGMA are displaying stronger daily gains, while BULLA is showing a more moderate positive move. Higher momentum can create greater opportunity, but it can also increase volatility and downside exposure. Traders should not automatically choose the coin with the largest percentage gain. Liquidity, spread, trading volume, and personal risk tolerance are equally important when evaluating potential setups.
📊 15. Illustrative Upside and Downside Ratio
PIEVERSE: +5% to +8% potential versus -4% to -7% risk.
BULLA: +4% to +7% potential versus -5% to -8% risk.
MAGMA: +6% to +10% potential versus -5% to -8% risk.
These ranges are illustrative market scenarios, not verified price targets or recommendations. The actual risk-to-reward ratio depends on the entry price, stop-loss placement, and exit plan. Always calculate the ratio using your own trade setup before placing an order.
🧭 16. Support and Resistance
Support is an area where buyers may attempt to prevent further declines. Resistance is an area where selling pressure may interrupt an upward movement. Traders should identify these zones using recent highs, lows, and candle closes. Avoid treating support and resistance as exact prices. Markets can briefly move beyond a level before reversing, so confirmation matters.
📉 17. Bitcoin and Overall Market Direction
Altcoins rarely operate independently of the broader cryptocurrency market. A sudden Bitcoin decline can weaken PIEVERSE, BULLA, and MAGMA even when their individual charts appear bullish. Before opening a position, check Bitcoin's trend, market volatility, and overall trading sentiment. A strong altcoin setup becomes more vulnerable when the wider market is experiencing heavy selling pressure.
🛡️ 18. Risk Management for Binance Traders
Never risk money you cannot afford to lose. Traders should determine their position size according to the distance between entry and stop-loss. Avoid using excessive leverage, especially when trading volatile tokens. A small market movement can create a large loss in leveraged positions. Responsible trading begins with capital protection, not with the pursuit of maximum profit.
🎯 19. Short-Term Trading Plan
A practical approach is to wait for confirmation, enter only when the setup matches your strategy, and define an exit before placing the order. Traders may use spot trading to avoid liquidation risk associated with leverage. For futures, understand funding fees, liquidation prices, and margin requirements. Never enter a trade without knowing where the idea becomes invalid.
🧠 20. Avoid FOMO and Emotional Decisions
Fear of missing out can push traders into buying after a token has already made a large move. Fear can also cause premature selling during a normal pullback. Both reactions can damage a trading plan. Stay calm, follow your strategy, and remember that missing one opportunity is better than taking an unplanned loss.
📚 21. Trading Education – Learn from Every Candle
Candlestick charts provide information about price movement, but they do not predict the future with certainty. Green candles show upward movement during the selected period, while red candles show downward movement. Wicks reveal the range reached before the candle closed. Combining candles with volume, trend analysis, and risk management creates a more complete trading picture.
🌟 22. Motivation for Crypto Traders
Success in trading is not measured by one profitable day. It comes from patience, preparation, and the ability to manage losses. Every experienced trader has faced difficult market conditions. The difference is learning from mistakes instead of repeating them. Stay focused on improvement, protect your capital, and build confidence through disciplined decisions.
🔔 23. Binance Square Community Discussion
Which token are you watching today: $PIEVERSE , $BULLA , or $MAGMA ? Are you waiting for a bullish breakout, planning to buy a confirmed pullback, or staying cautious until the market stabilizes? Share your chart observations and trading ideas respectfully. Always conduct your own research before making any buying or selling decision.
🟢 24. Final Market Outlook
Today's watchlist shows positive momentum across all three tokens, with PIEVERSE and MAGMA recording stronger gains and BULLA displaying a more moderate advance. The bullish scenarios remain dependent on support, volume, and broader market conditions. A correction is always possible after a rapid rally. Traders should prioritize confirmation and avoid assuming that recent gains will continue indefinitely.
🏆 25. Conclusion – Trade Smart, Stay Strong
Dear Binancians, the crypto market rewards patience more consistently than impulsive decisions. Watch the candles, respect support and resistance, and manage your risk before entering any trade. Whether you choose buying, selling, or waiting, make your decision through research and discipline. Stay motivated, continue learning, and never allow one trade to control your financial future.
**Trade responsibly. Protect your capital. Keep learning.**
#BinanceSquare #Pievers #BULLA #MAGMAUSD #CryptoMarket #TradingEducation #KumailAbbasAkmal #KumailAkmalTraders
**Current reference price:** Approximately $3.57 USDT
**24-hour change:** +20.11%
**Candle:** 🟢 Strong bullish candle
**Potential upside:** +5% to +8%
**Potential downside:** -4% to -7%
PIEVERSE has demonstrated impressive upward momentum, attracting attention from traders looking for short-term opportunities. Its strong daily performance suggests that buyers have been active, but rapid price increases can also encourage profit-taking. Traders should avoid entering simply because the candle is green. A confirmed breakout with sustained volume would provide a stronger indication of continued buying interest.
🕯️ 2. PIEVERSE – Buying Strategy
A possible bullish scenario could develop if PIEVERSE maintains support and continues forming higher lows. Traders may watch whether price holds above nearby support zones and whether green candles close near their highs. If buying volume strengthens, a further upward movement may become possible. However, after a substantial rally, entering too late can expose traders to sudden reversals. Consider waiting for a pullback or a confirmed breakout rather than chasing the market.
📉 3. PIEVERSE – Selling and Risk Outlook
The bearish scenario becomes more relevant if price loses support and begins producing consecutive red candles. A rejection near resistance could trigger short-term selling, especially if traders decide to secure profits after the recent rally. A downside movement of approximately 4% to 7% is a risk scenario, not a fixed target. Traders should monitor candle closes, volume changes, and market conditions before making decisions.
🟡 4. PIEVERSE – Market Psychology
Strong rallies often create excitement and fear of missing out. This emotional pressure can lead traders to buy near local highs without considering their risk. Professional trading requires a different mindset: observe the chart, identify confirmation, and calculate potential losses before entering. PIEVERSE may continue higher, but no candle can guarantee the next movement. Discipline is more valuable than excitement.
🟢 5. $BULLA – Moderate Positive Activity
**Current reference price:** Approximately $0.01484 USDT
**24-hour change:** +4.73%
**Candle:** 🟢 Mild bullish candle
**Potential upside:** +4% to +7%
**Potential downside:** -5% to -8%
BULLA is showing positive movement, although its momentum appears more moderate than PIEVERSE. This type of price action may attract traders searching for a possible continuation pattern. Nevertheless, a modest daily gain does not automatically mean a strong trend is established. Traders should check whether buyers can maintain control and whether volume supports the upward movement.
📊 6. BULLA – Buying Outlook
For a bullish setup, traders may watch for price to remain above a recent support area while forming higher lows. A breakout above resistance accompanied by increased volume could indicate renewed buying interest. If the market continues to strengthen, BULLA may attempt an additional upward move. The illustrative upside range is 4% to 7%, provided that momentum and market conditions remain supportive.
🔴 7. BULLA – Selling Outlook
If BULLA fails to hold support, selling pressure may increase. Red candles with expanding volume could indicate that sellers are becoming more active. In that situation, traders should avoid assuming that every dip is a buying opportunity. A possible downside scenario of 5% to 8% highlights the importance of protecting capital. A planned exit is better than an emotional decision made during a sudden decline.
🕯️ 8. BULLA – Candle Confirmation
A bullish engulfing candle or a strong green candle closing above resistance may offer useful confirmation. Conversely, a long upper wick near resistance can signal rejection and possible profit-taking. Traders should examine candle patterns alongside volume and broader market direction. One candle alone is not sufficient evidence. Confirmation across multiple timeframes can help reduce impulsive trading decisions.
💡 9. BULLA – Trading Discipline
BULLA's positive movement may encourage short-term traders to become overly confident. However, even coins showing moderate gains can experience sharp reversals. Avoid increasing position size simply because the previous trade was profitable. Consistent traders focus on repeatable strategies, not on winning every market move. Protecting capital allows traders to remain active when better opportunities appear.
🔵 10. $MAGMA – Bullish Momentum Watch
**Current reference price:** Approximately $0.24917 USDT
**24-hour change:** +19.45%
**Candle:** 🟢 Strong bullish candle
**Potential upside:** +6% to +10%
**Potential downside:** -5% to -8%
MAGMA has recorded a strong daily advance, placing it among the more active tokens in today's watchlist. Its movement suggests that market participants have been paying attention to the asset. However, strong momentum can attract both new buyers and profit-taking sellers. Traders should monitor whether the price can consolidate rather than immediately entering after a large green candle.
📈 11. MAGMA – Buying Scenario
A bullish continuation could develop if MAGMA holds a support zone and forms a stable consolidation pattern. A breakout above the recent high, supported by increasing volume, may strengthen the bullish outlook. Traders may consider waiting for a retest instead of buying during an extended candle. The potential upside scenario of 6% to 10% depends on continued momentum and should not be treated as a guaranteed return.
⚠️ 12. MAGMA – Downside Scenario
After a strong rally, MAGMA may experience a correction as early buyers take profits. If price falls below support and red candles become dominant, the bullish structure could weaken. A downside scenario of 5% to 8% is possible during a sharp reversal. Traders should define their invalidation level before entering and avoid holding an unsuccessful trade simply because they expect a recovery.
🕯️ 13. MAGMA – Candle and Volume Analysis
The most important signal is not simply the size of the green candle but whether buyers can sustain the move. A strong candle with high volume may indicate conviction, while a large candle with weakening volume can signal exhaustion. Long upper wicks may show resistance. Traders should observe candle closes and volume changes before deciding whether momentum is continuing or fading.
🔥 14. Comparing the Three Tokens
PIEVERSE and MAGMA are displaying stronger daily gains, while BULLA is showing a more moderate positive move. Higher momentum can create greater opportunity, but it can also increase volatility and downside exposure. Traders should not automatically choose the coin with the largest percentage gain. Liquidity, spread, trading volume, and personal risk tolerance are equally important when evaluating potential setups.
📊 15. Illustrative Upside and Downside Ratio
PIEVERSE: +5% to +8% potential versus -4% to -7% risk.
BULLA: +4% to +7% potential versus -5% to -8% risk.
MAGMA: +6% to +10% potential versus -5% to -8% risk.
These ranges are illustrative market scenarios, not verified price targets or recommendations. The actual risk-to-reward ratio depends on the entry price, stop-loss placement, and exit plan. Always calculate the ratio using your own trade setup before placing an order.
🧭 16. Support and Resistance
Support is an area where buyers may attempt to prevent further declines. Resistance is an area where selling pressure may interrupt an upward movement. Traders should identify these zones using recent highs, lows, and candle closes. Avoid treating support and resistance as exact prices. Markets can briefly move beyond a level before reversing, so confirmation matters.
📉 17. Bitcoin and Overall Market Direction
Altcoins rarely operate independently of the broader cryptocurrency market. A sudden Bitcoin decline can weaken PIEVERSE, BULLA, and MAGMA even when their individual charts appear bullish. Before opening a position, check Bitcoin's trend, market volatility, and overall trading sentiment. A strong altcoin setup becomes more vulnerable when the wider market is experiencing heavy selling pressure.
🛡️ 18. Risk Management for Binance Traders
Never risk money you cannot afford to lose. Traders should determine their position size according to the distance between entry and stop-loss. Avoid using excessive leverage, especially when trading volatile tokens. A small market movement can create a large loss in leveraged positions. Responsible trading begins with capital protection, not with the pursuit of maximum profit.
🎯 19. Short-Term Trading Plan
A practical approach is to wait for confirmation, enter only when the setup matches your strategy, and define an exit before placing the order. Traders may use spot trading to avoid liquidation risk associated with leverage. For futures, understand funding fees, liquidation prices, and margin requirements. Never enter a trade without knowing where the idea becomes invalid.
🧠 20. Avoid FOMO and Emotional Decisions
Fear of missing out can push traders into buying after a token has already made a large move. Fear can also cause premature selling during a normal pullback. Both reactions can damage a trading plan. Stay calm, follow your strategy, and remember that missing one opportunity is better than taking an unplanned loss.
📚 21. Trading Education – Learn from Every Candle
Candlestick charts provide information about price movement, but they do not predict the future with certainty. Green candles show upward movement during the selected period, while red candles show downward movement. Wicks reveal the range reached before the candle closed. Combining candles with volume, trend analysis, and risk management creates a more complete trading picture.
🌟 22. Motivation for Crypto Traders
Success in trading is not measured by one profitable day. It comes from patience, preparation, and the ability to manage losses. Every experienced trader has faced difficult market conditions. The difference is learning from mistakes instead of repeating them. Stay focused on improvement, protect your capital, and build confidence through disciplined decisions.
🔔 23. Binance Square Community Discussion
Which token are you watching today: $PIEVERSE , $BULLA , or $MAGMA ? Are you waiting for a bullish breakout, planning to buy a confirmed pullback, or staying cautious until the market stabilizes? Share your chart observations and trading ideas respectfully. Always conduct your own research before making any buying or selling decision.
🟢 24. Final Market Outlook
Today's watchlist shows positive momentum across all three tokens, with PIEVERSE and MAGMA recording stronger gains and BULLA displaying a more moderate advance. The bullish scenarios remain dependent on support, volume, and broader market conditions. A correction is always possible after a rapid rally. Traders should prioritize confirmation and avoid assuming that recent gains will continue indefinitely.
🏆 25. Conclusion – Trade Smart, Stay Strong
Dear Binancians, the crypto market rewards patience more consistently than impulsive decisions. Watch the candles, respect support and resistance, and manage your risk before entering any trade. Whether you choose buying, selling, or waiting, make your decision through research and discipline. Stay motivated, continue learning, and never allow one trade to control your financial future.
**Trade responsibly. Protect your capital. Keep learning.**
#BinanceSquare #Pievers #BULLA #MAGMAUSD #CryptoMarket #TradingEducation #KumailAbbasAkmal #KumailAkmalTraders
21

·
--
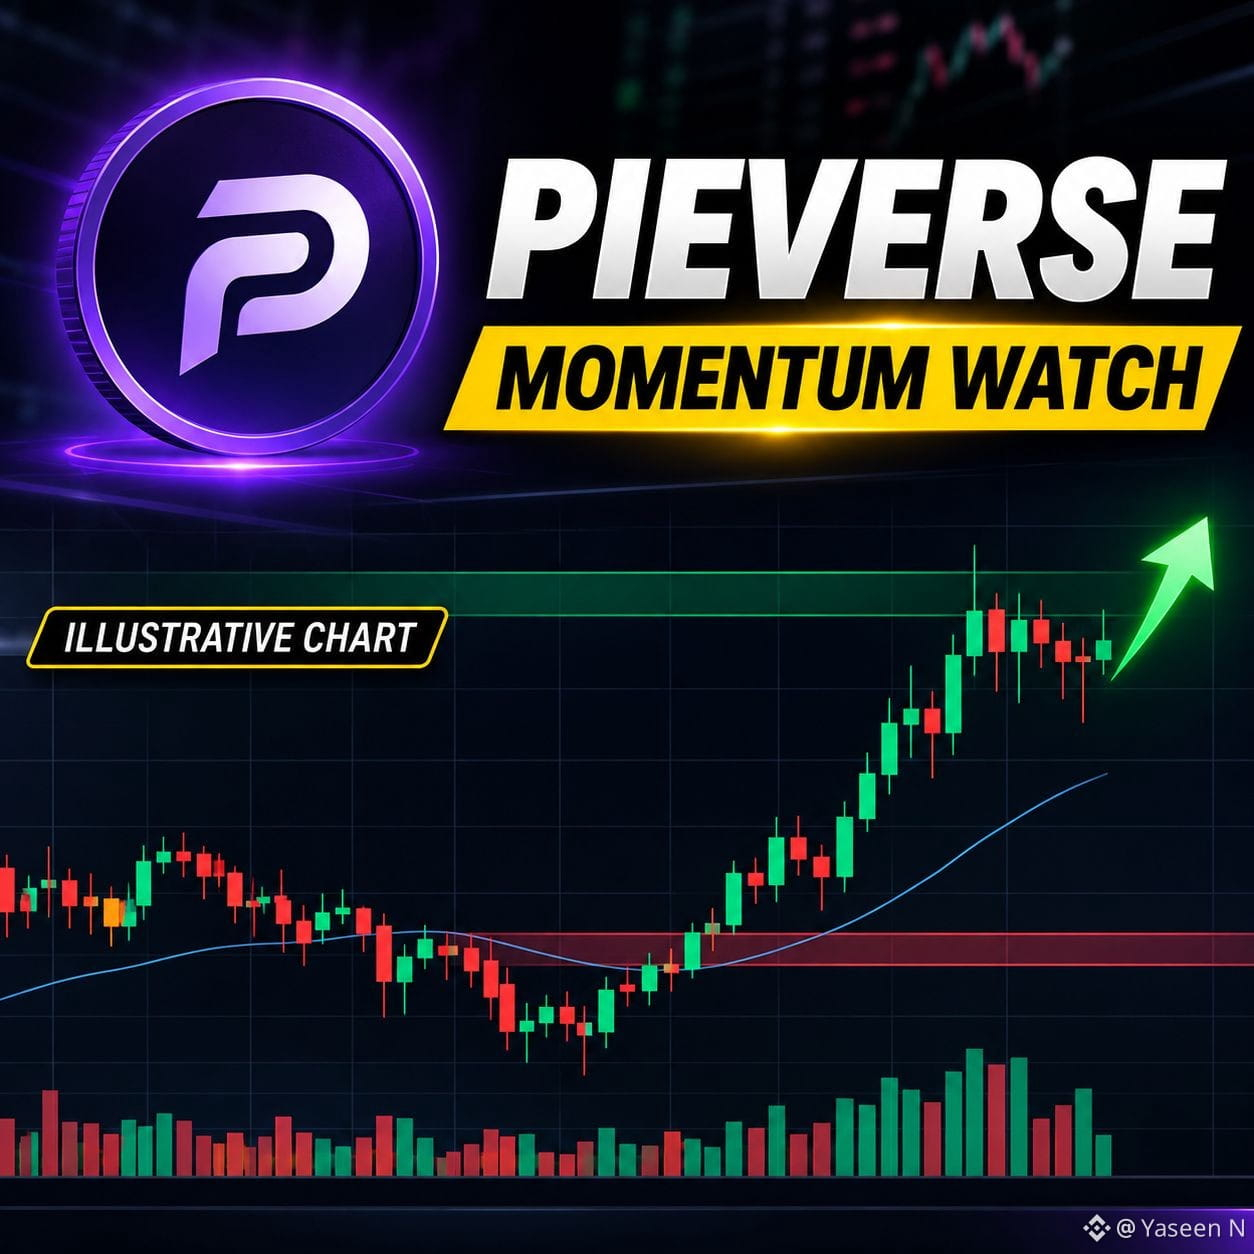
🔥 PIEVERSE Is Catching Market Attention!
PIEVERSE is making waves with a strong surge in market activity.
The key question now is whether this momentum can continue or sellers will step in.
Watch trading volume, momentum and market reaction before drawing conclusions.#BTCRemainsUnderPressureAfterHawkishFOMCMinutes #pievers $PIEVERSE
{future}(PIEVERSEUSDT)
🔥 PIEVERSE Is Catching Market Attention!
PIEVERSE is making waves with a strong surge in market activity.
The key question now is whether this momentum can continue or sellers will step in.
Watch trading volume, momentum and market reaction before drawing conclusions.#BTCRemainsUnderPressureAfterHawkishFOMCMinutes #pievers $PIEVERSE
PIEVERSE is making waves with a strong surge in market activity.
The key question now is whether this momentum can continue or sellers will step in.
Watch trading volume, momentum and market reaction before drawing conclusions.#BTCRemainsUnderPressureAfterHawkishFOMCMinutes #pievers $PIEVERSE
332

·
--
$PIEVERSE
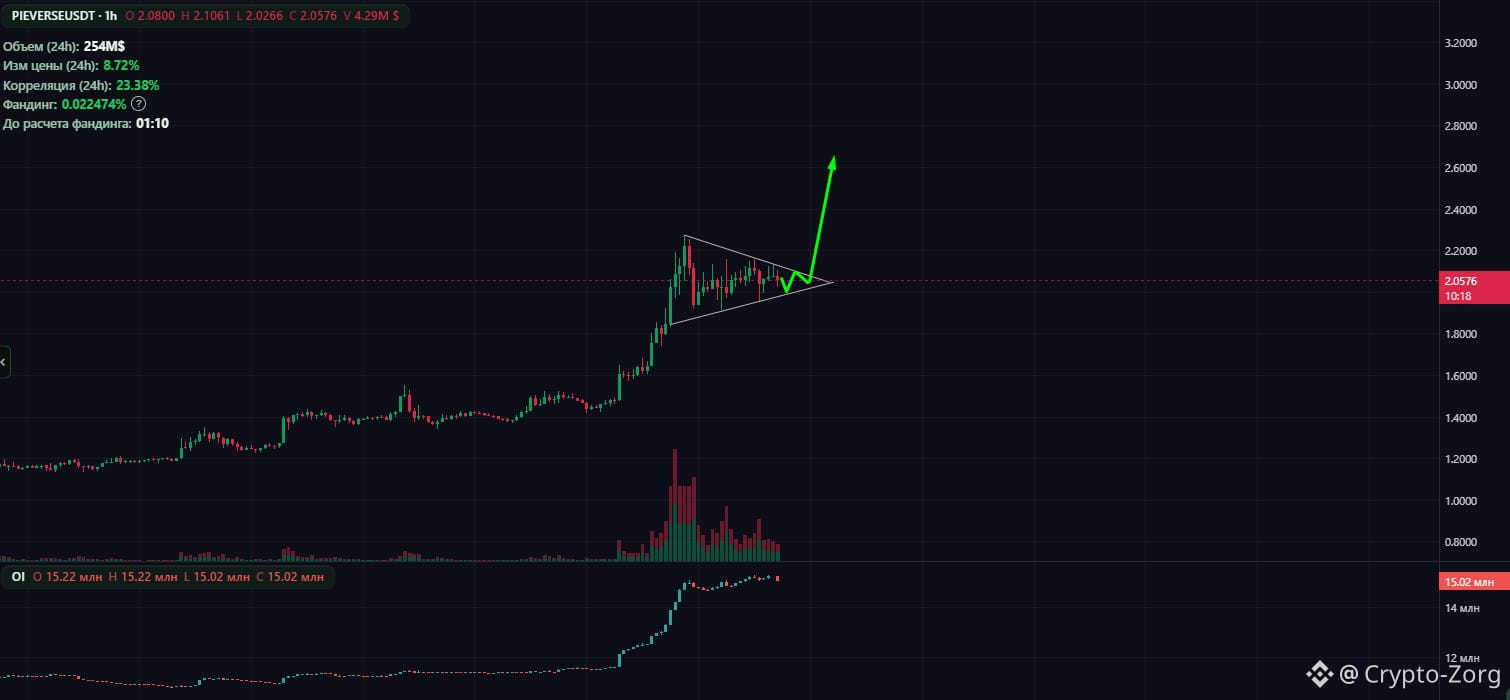
The coin is trading at all-time highs, so there’s a good chance we’ll see a strong breakout to the upside from this consolidation.
Before moving up, the price may make a short squeeze to shake out the longs who are building positions during this accumulation. So for now, I’ve entered with half of my usual position size. I’ll add the rest once the breakout happens. If I get stopped out by a move to the downside, I’ll re-enter when (or if) the price returns to the consolidation range.
#Pievers #PIEVERSEUSDT
{future}(PIEVERSEUSDT)
$PIEVERSE
The coin is trading at all-time highs, so there’s a good chance we’ll see a strong breakout to the upside from this consolidation.
Before moving up, the price may make a short squeeze to shake out the longs who are building positions during this accumulation. So for now, I’ve entered with half of my usual position size. I’ll add the rest once the breakout happens. If I get stopped out by a move to the downside, I’ll re-enter when (or if) the price returns to the consolidation range.
#Pievers #PIEVERSEUSDT
The coin is trading at all-time highs, so there’s a good chance we’ll see a strong breakout to the upside from this consolidation.
Before moving up, the price may make a short squeeze to shake out the longs who are building positions during this accumulation. So for now, I’ve entered with half of my usual position size. I’ll add the rest once the breakout happens. If I get stopped out by a move to the downside, I’ll re-enter when (or if) the price returns to the consolidation range.
#Pievers #PIEVERSEUSDT
865

·
--
$PIEVERSE
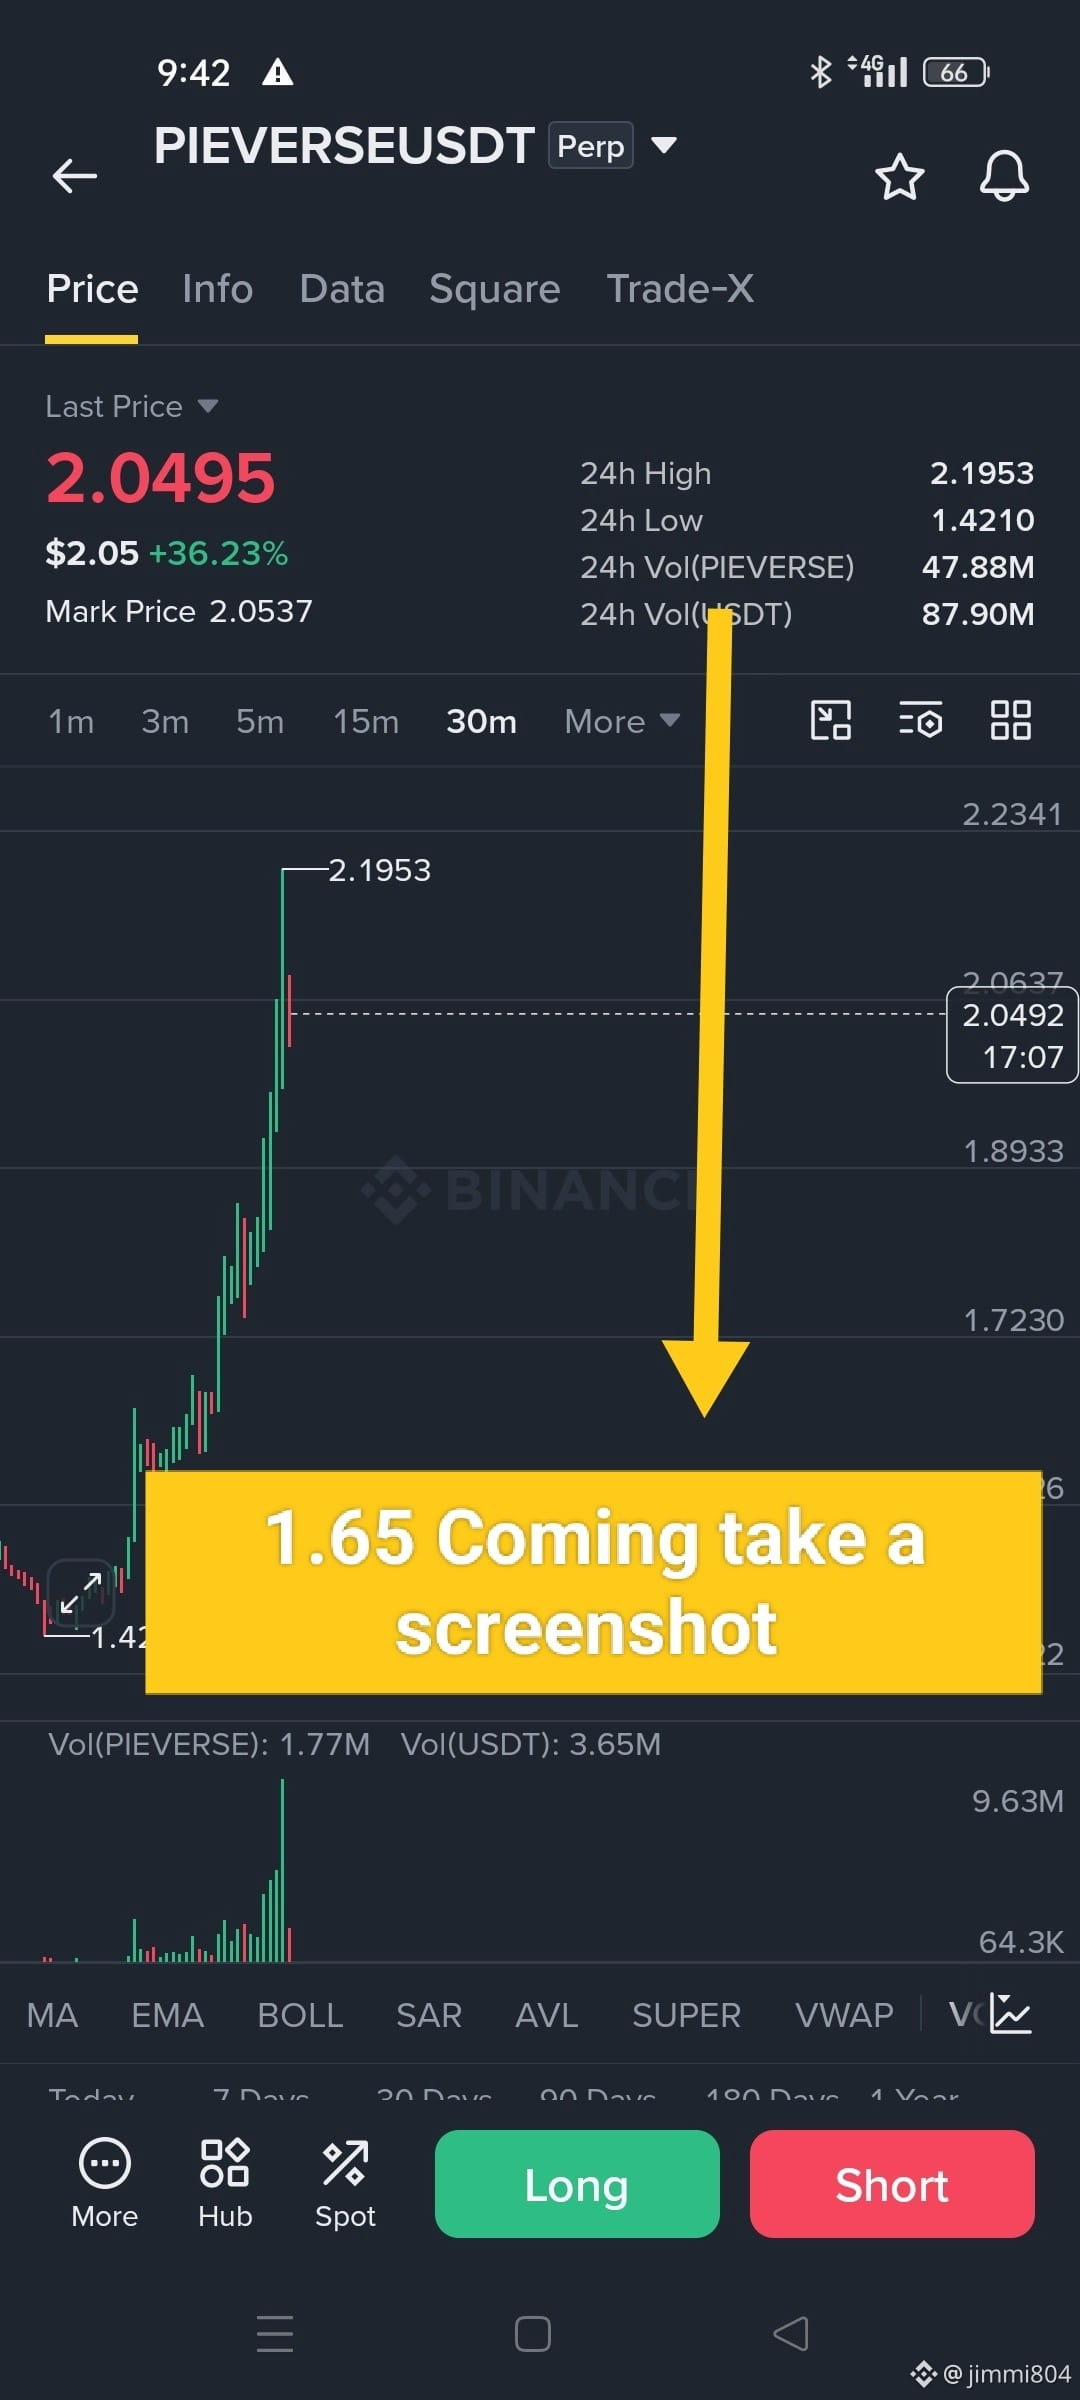
Short coming
⚡READ FULL POST⚡
LONG & SHORT double setup
I have tracked the whale's stop-loss level. The #Pievers coin is expected to reach this point: 100 and 10%.
If you want to short, use 1x leverage with only 30% of your capital. Keep the remaining capital for DCA (adding to the active trade).
* Short setup: Final target at 1.65.
* Long setup: Look for a long entry around 1.60 if a valid setup appears. Target zone: 1.65–1.55.
I have provided both long and short setups.
Please appreciate my hard work! And I sincerely request you to use 1x leverage only. The targets are big, and even without leverage, the profit will be worth it.
#Write2Earn
$PIEVERSE
Short coming
⚡READ FULL POST⚡
LONG & SHORT double setup
I have tracked the whale's stop-loss level. The #Pievers coin is expected to reach this point: 100 and 10%.
If you want to short, use 1x leverage with only 30% of your capital. Keep the remaining capital for DCA (adding to the active trade).
* Short setup: Final target at 1.65.
* Long setup: Look for a long entry around 1.60 if a valid setup appears. Target zone: 1.65–1.55.
I have provided both long and short setups.
Please appreciate my hard work! And I sincerely request you to use 1x leverage only. The targets are big, and even without leverage, the profit will be worth it.
#Write2Earn
Short coming
⚡READ FULL POST⚡
LONG & SHORT double setup
I have tracked the whale's stop-loss level. The #Pievers coin is expected to reach this point: 100 and 10%.
If you want to short, use 1x leverage with only 30% of your capital. Keep the remaining capital for DCA (adding to the active trade).
* Short setup: Final target at 1.65.
* Long setup: Look for a long entry around 1.60 if a valid setup appears. Target zone: 1.65–1.55.
I have provided both long and short setups.
Please appreciate my hard work! And I sincerely request you to use 1x leverage only. The targets are big, and even without leverage, the profit will be worth it.
#Write2Earn
35
5
24
17.6k

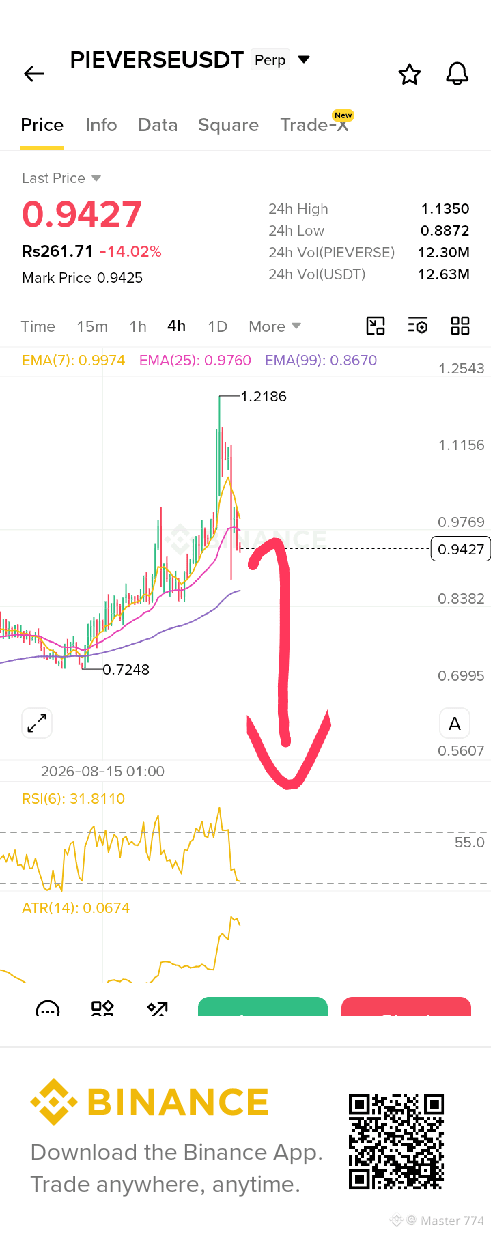
$PIEVERSE long trade 🤑
trade with me 📈📈
entry -1.35-1.41
sl-1.3200
TP-1.5250
#BinanceReopensWithdrawalsForMoreAssets #Pievers #cryptosignals #Binance #AnthropicIPOValuationDoubts
{future}(PIEVERSEUSDT)
$PIEVERSE long trade 🤑
trade with me 📈📈
entry -1.35-1.41
sl-1.3200
TP-1.5250
#BinanceReopensWithdrawalsForMoreAssets #Pievers #cryptosignals #Binance #AnthropicIPOValuationDoubts
trade with me 📈📈
entry -1.35-1.41
sl-1.3200
TP-1.5250
#BinanceReopensWithdrawalsForMoreAssets #Pievers #cryptosignals #Binance #AnthropicIPOValuationDoubts
1
111


·
--
Bearish
📢 $PIEVERSE /USDT — SELL SHORT 📉
💰 Pair: PIEVERSE/USDT Perp
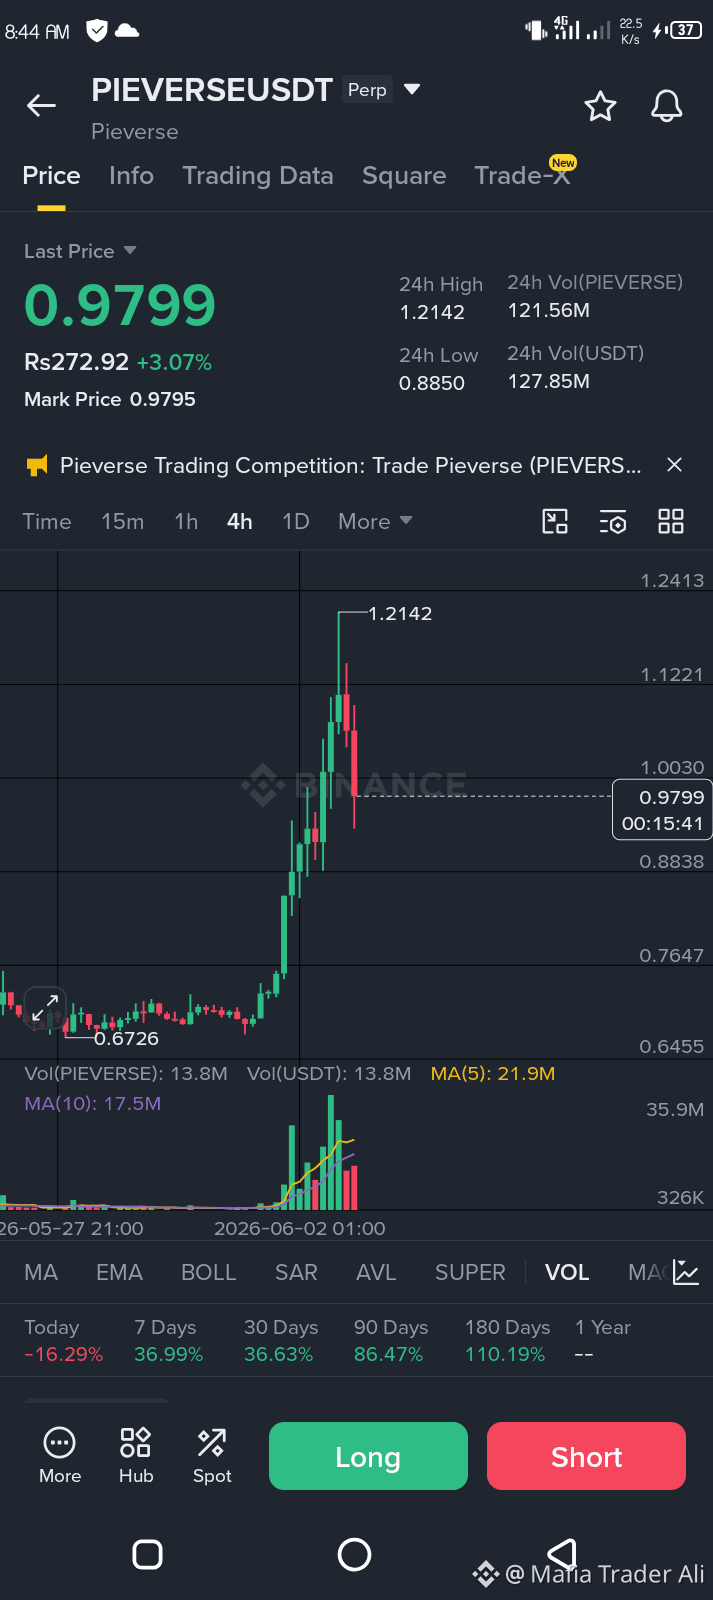
🎯 Entry: 0.9800 – 1.0200
🏁 TP1: 0.8850
🏁 TP2: 0.7800
🏁 TP3: 0.6800-
🛑 SL: 1.0850
⚠️ Risk: 1-2%
{future}(PIEVERSEUSDT)
The price has formed a sharp lower high rejection after hitting its 24h high at 1.2142, and heavy red distribution candles are stepping in. Look for short entries on minor relief bounces as the short-term market structure turns heavily bearish.#Pievers
📢 $PIEVERSE /USDT — SELL SHORT 📉
💰 Pair: PIEVERSE/USDT Perp
🎯 Entry: 0.9800 – 1.0200
🏁 TP1: 0.8850
🏁 TP2: 0.7800
🏁 TP3: 0.6800-
🛑 SL: 1.0850
⚠️ Risk: 1-2%
The price has formed a sharp lower high rejection after hitting its 24h high at 1.2142, and heavy red distribution candles are stepping in. Look for short entries on minor relief bounces as the short-term market structure turns heavily bearish.#Pievers
💰 Pair: PIEVERSE/USDT Perp
🎯 Entry: 0.9800 – 1.0200
🏁 TP1: 0.8850
🏁 TP2: 0.7800
🏁 TP3: 0.6800-
🛑 SL: 1.0850
⚠️ Risk: 1-2%
The price has formed a sharp lower high rejection after hitting its 24h high at 1.2142, and heavy red distribution candles are stepping in. Look for short entries on minor relief bounces as the short-term market structure turns heavily bearish.#Pievers
228

·
--
Bullish
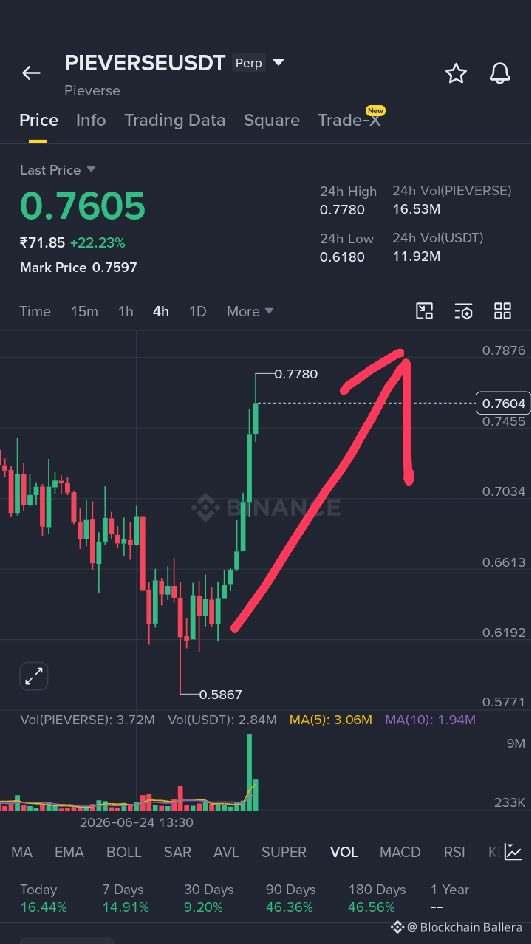
$PIEVERSE calendar cat launched, the market is just starting up—later it needs to surge with volume and rise by dozens of points. Quick, go long !!immediately open long 🟢 position #Pievers keep long 👇👇 target $0.82
{future}(PIEVERSEUSDT)
i am also watching $VELVET & $RE
$PIEVERSE calendar cat launched, the market is just starting up—later it needs to surge with volume and rise by dozens of points. Quick, go long !!immediately open long 🟢 position #Pievers keep long 👇👇 target $0.82
i am also watching $VELVET & $RE
i am also watching $VELVET & $RE
2
1
508

·
--
Bullish
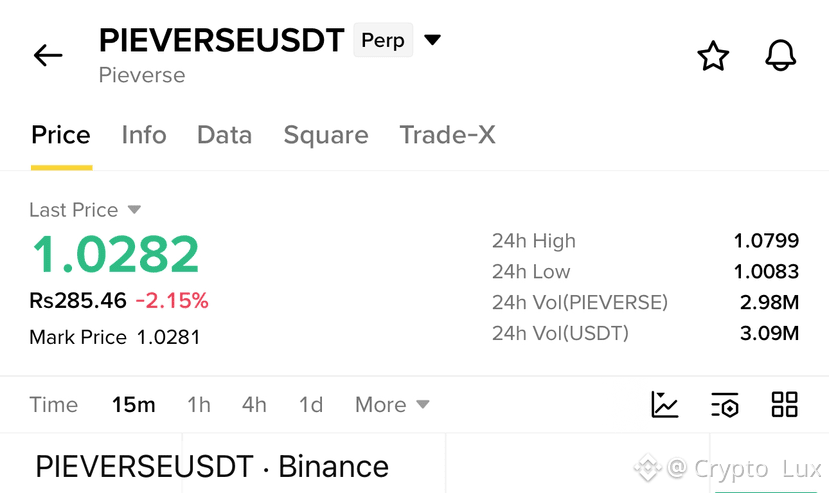
$PIEVERSE — LONG
ENTRY: 1.0282
TP1: 1.0500
TP2: 1.1000
TP3: 1.1500
SL: 1.0000
The recovery is showing solid strength. Bulls may drive price toward the next breakout level.
{future}(PIEVERSEUSDT)
#ZECHitsANewAllTimeHigh #LululemonTumbles20%OnWeakGuidance #BitcoinETFsBiggestDailyInflowSinceJanuary #pievers
$PIEVERSE — LONG
ENTRY: 1.0282
TP1: 1.0500
TP2: 1.1000
TP3: 1.1500
SL: 1.0000
The recovery is showing solid strength. Bulls may drive price toward the next breakout level.
#ZECHitsANewAllTimeHigh #LululemonTumbles20%OnWeakGuidance #BitcoinETFsBiggestDailyInflowSinceJanuary #pievers
ENTRY: 1.0282
TP1: 1.0500
TP2: 1.1000
TP3: 1.1500
SL: 1.0000
The recovery is showing solid strength. Bulls may drive price toward the next breakout level.
#ZECHitsANewAllTimeHigh #LululemonTumbles20%OnWeakGuidance #BitcoinETFsBiggestDailyInflowSinceJanuary #pievers
60

·
--
Bullish
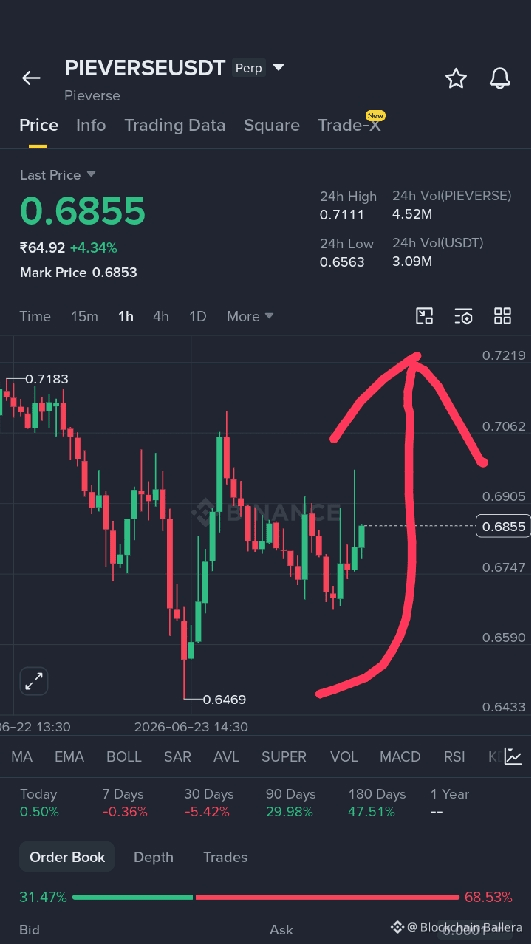
$PIEVERSE strong momentum with solid buying pressure. Buyers in control. immediately open long 🟢 position #Pievers keep long 👆👆 Targets: 0.72
{future}(PIEVERSEUSDT)
i am also watching $BB & $ID
$PIEVERSE strong momentum with solid buying pressure. Buyers in control. immediately open long 🟢 position #Pievers keep long 👆👆 Targets: 0.72
i am also watching $BB & $ID
i am also watching $BB & $ID
310
·
--
Today Signal
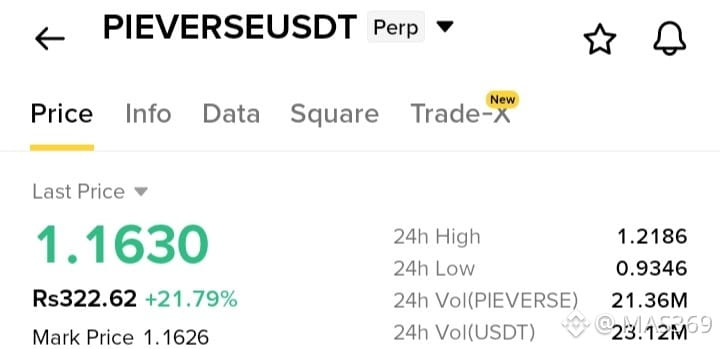
Signal Type #long
Coin $PIEVERSE
#PIEVERS Looking bullish here.
Entry $1.10 to $1.18
Target Price
$1.251
$1.361
$1.51
Stop Loss $1.06
Trade at You Risk.
No Claim, No Blame.
{future}(PIEVERSEUSDT)
#Signal. #solonapumping #ETH🔥🔥🔥🔥🔥🔥
Today Signal
Signal Type #long
Coin $PIEVERSE
#PIEVERS Looking bullish here.
Entry $1.10 to $1.18
Target Price
$1.251
$1.361
$1.51
Stop Loss $1.06
Trade at You Risk.
No Claim, No Blame.
#Signal. #solonapumping #ETH🔥🔥🔥🔥🔥🔥
Signal Type #long
Coin $PIEVERSE
#PIEVERS Looking bullish here.
Entry $1.10 to $1.18
Target Price
$1.251
$1.361
$1.51
Stop Loss $1.06
Trade at You Risk.
No Claim, No Blame.
#Signal. #solonapumping #ETH🔥🔥🔥🔥🔥🔥
12
·
--
Bullish
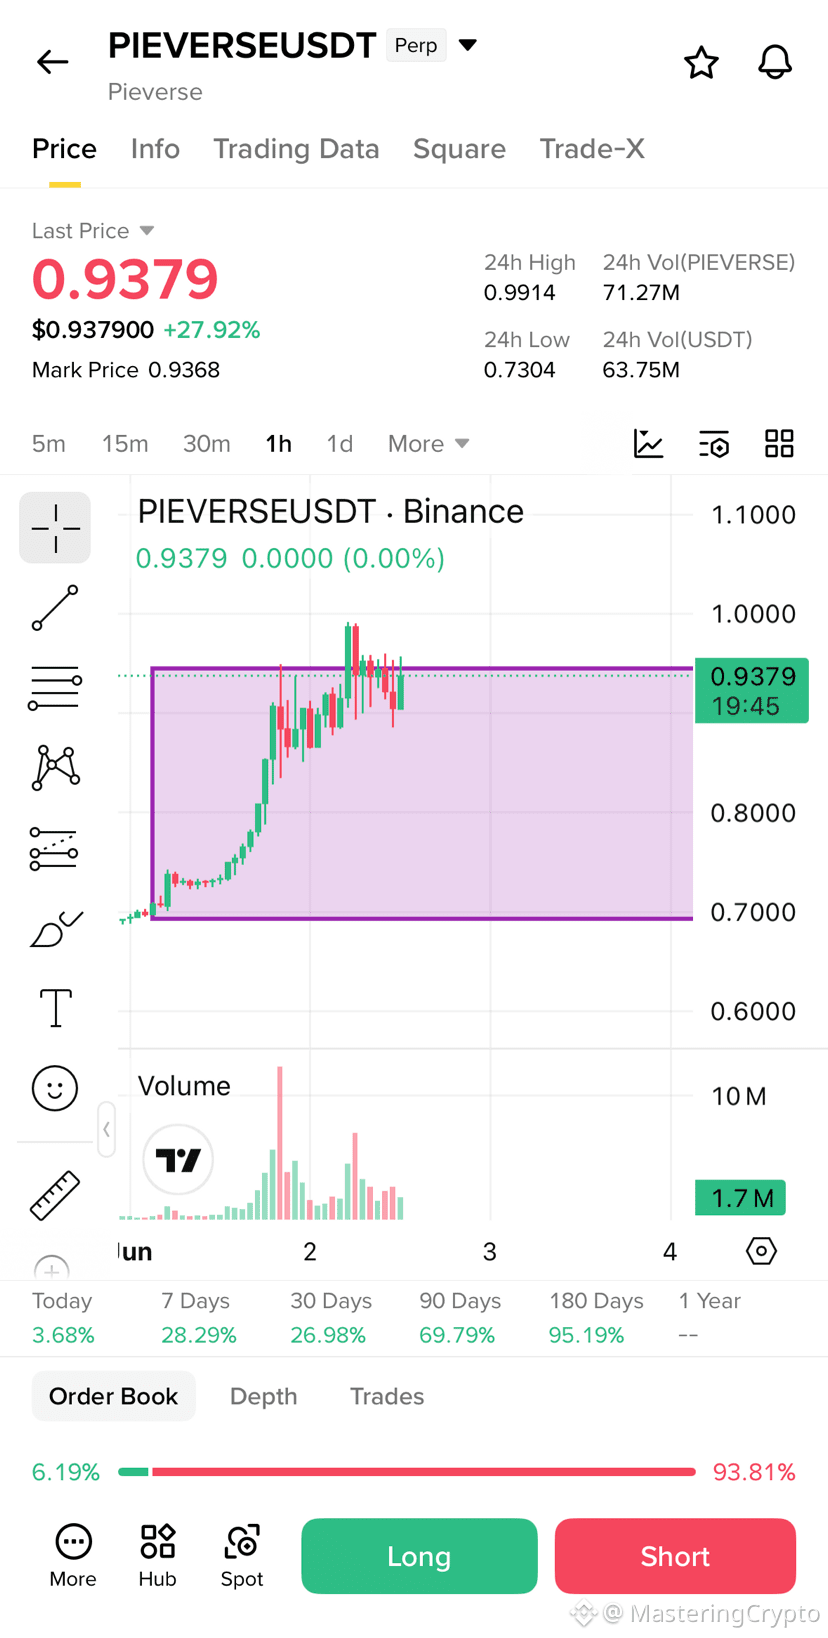
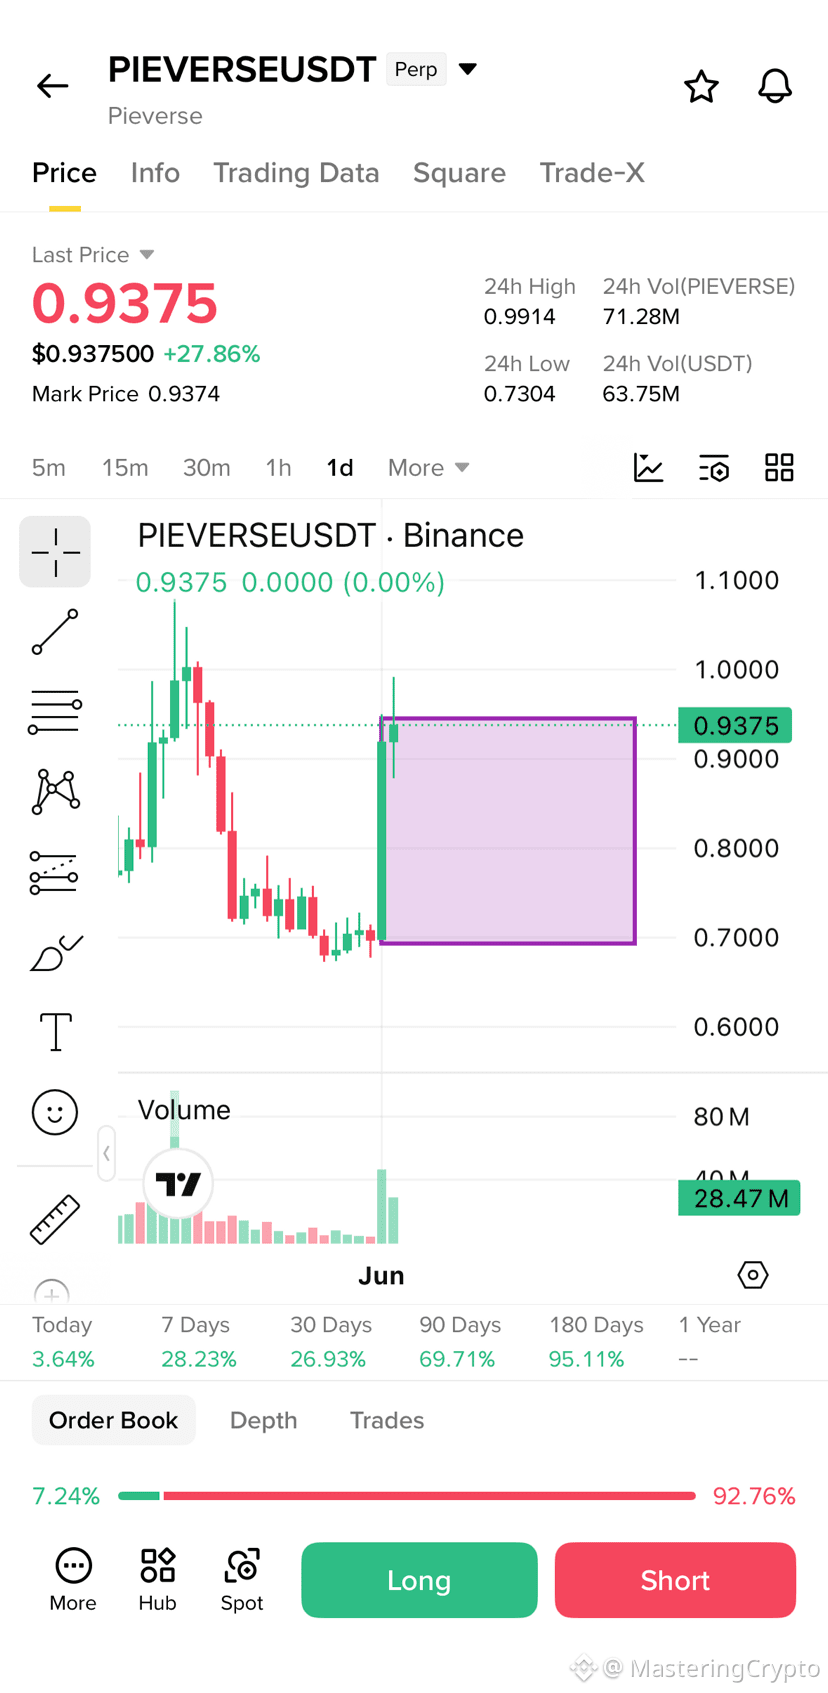
Is $PIEVERSE about to go parabolic⁉️⁉️
Adding for you 1H&1D Charts down 👇
After marking the Previous Day highs&lows prices, there are Two possible options to happen and I’m positive about the first‼️
Option 1: Break above the resistance line, or as you can see at the charts below, break above the Previous day highest price‼️🎯
Option 2 : we will see more and more rejections to the resistance line, and have a decline and more lower lows‼️🥲
$PIEVERSE #pievers
{future}(PIEVERSEUSDT)
Is $PIEVERSE about to go parabolic⁉️⁉️
Adding for you 1H&1D Charts down 👇
After marking the Previous Day highs&lows prices, there are Two possible options to happen and I’m positive about the first‼️
Option 1: Break above the resistance line, or as you can see at the charts below, break above the Previous day highest price‼️🎯
Option 2 : we will see more and more rejections to the resistance line, and have a decline and more lower lows‼️🥲
$PIEVERSE #pievers
Adding for you 1H&1D Charts down 👇
After marking the Previous Day highs&lows prices, there are Two possible options to happen and I’m positive about the first‼️
Option 1: Break above the resistance line, or as you can see at the charts below, break above the Previous day highest price‼️🎯
Option 2 : we will see more and more rejections to the resistance line, and have a decline and more lower lows‼️🥲
$PIEVERSE #pievers
1
1
173

$IRYS During the day, all day, the only thing that went down a little was the alarm-clock cat$PIEVERSE , dropping from 4.5 to around 2.35. This is a... Next is $NAORIS , the quantum-resistant theme, up more than 40%. Major cryptocurrencies like Ethereum and Bitcoin had to wait until the evening session to see any trading volume. Given the situation, what more can we hope for? Preserving capital is more important than anything else.#Pievers e
{future}(NAORISUSDT)
$IRYS During the day, all day, the only thing that went down a little was the alarm-clock cat$PIEVERSE , dropping from 4.5 to around 2.35. This is a... Next is $NAORIS , the quantum-resistant theme, up more than 40%. Major cryptocurrencies like Ethereum and Bitcoin had to wait until the evening session to see any trading volume. Given the situation, what more can we hope for? Preserving capital is more important than anything else.#Pievers e
Future master1
·
--
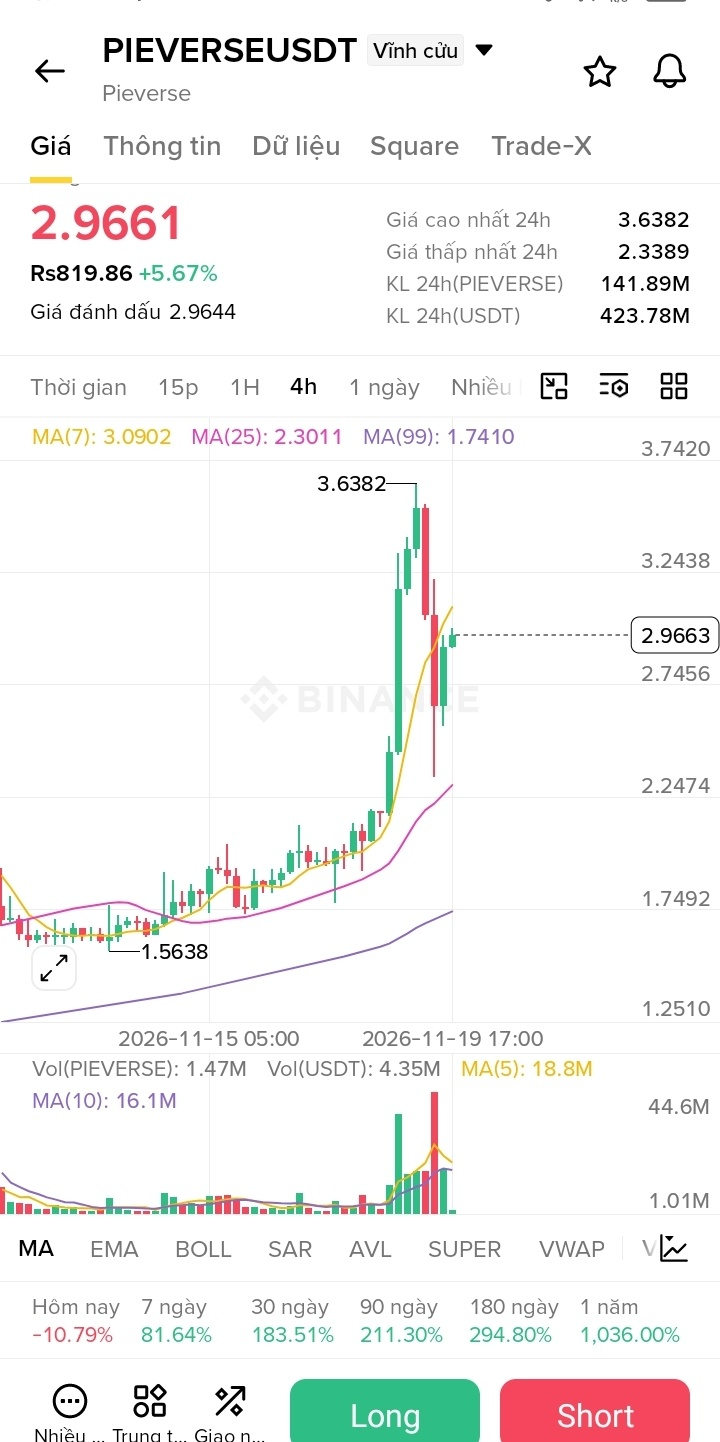
BearishHộ Thánh's morning short position successfully took profit at $2.5! If you haven't managed to follow along, don't feel bad—the second small upward move, on low volume, is now luring buyers in; three whales have already been caught in the trap 😅. Hộ Tử is determined to enter a short position at the current price. Just like last time, this one's sure to bring in 9999.9999%!
$PIEVERSE
$PIEVERSE
1
445
·
--
Bullish
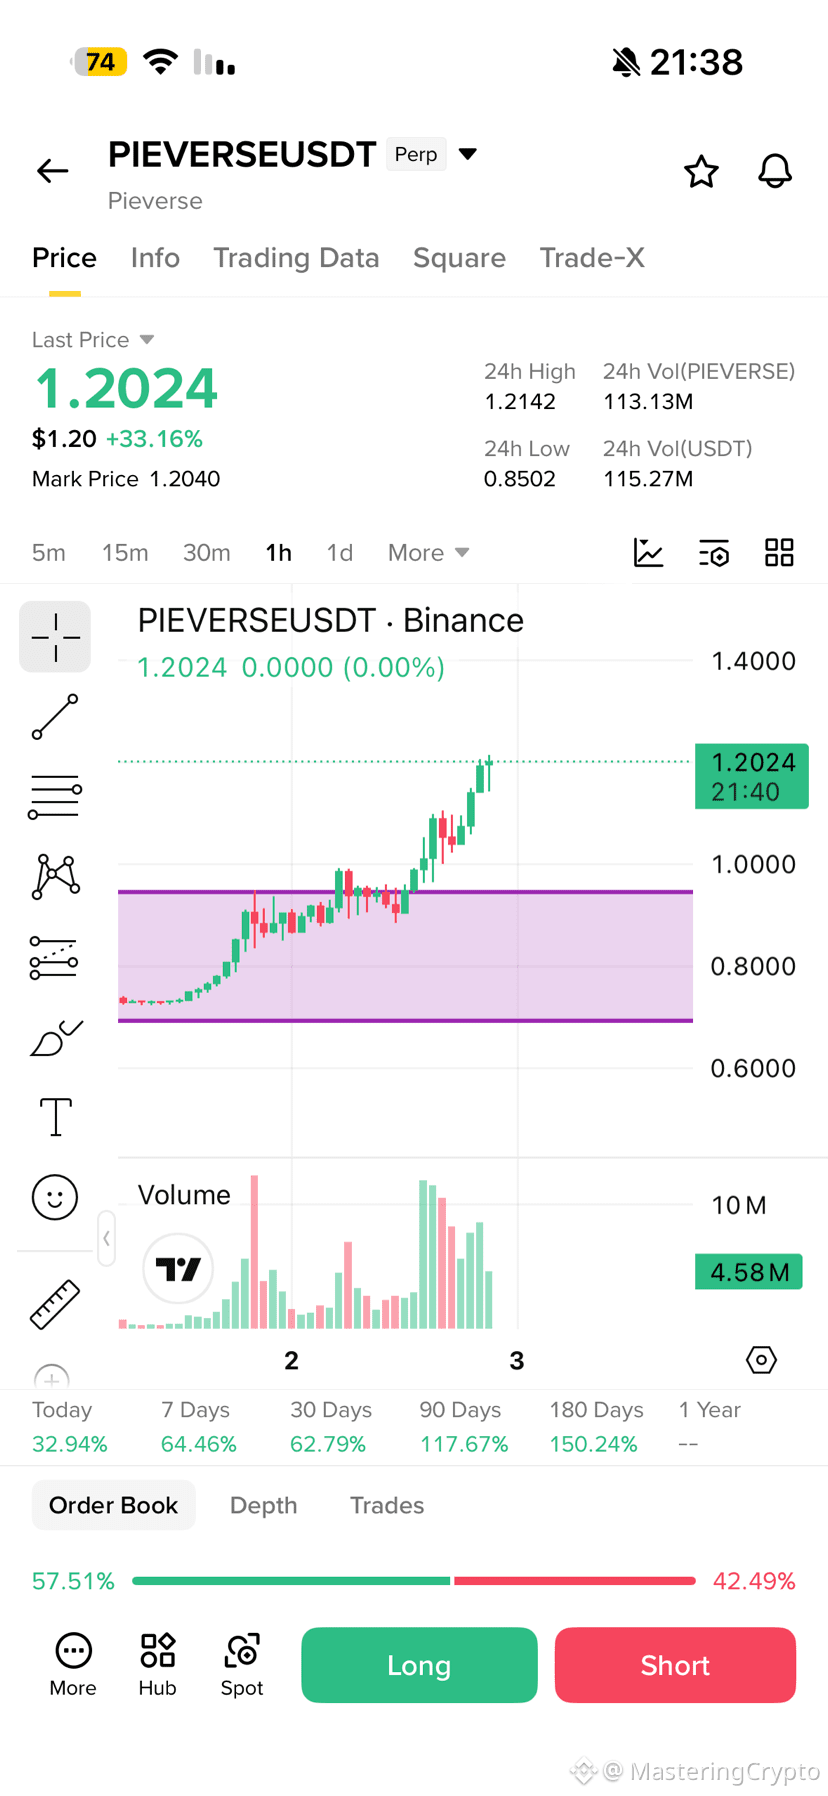
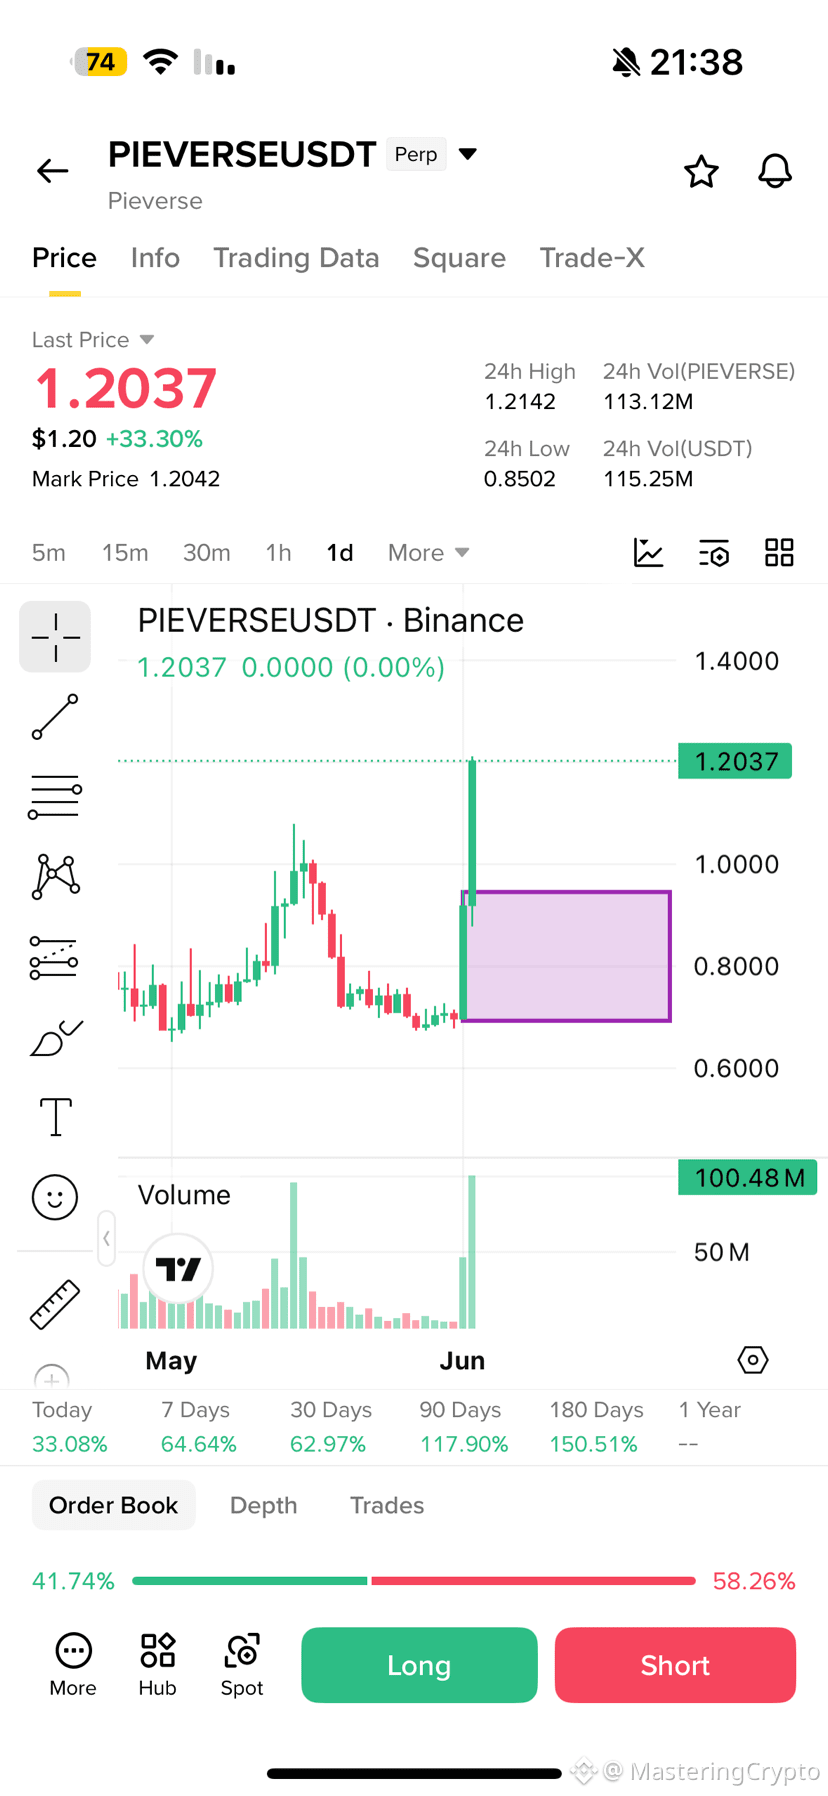
What did i say you guys⁉️😳
I’ve said that $PIEVERSE will go parabolic, and this is exactly what happened‼️🎯
Look at the price of $PIEVERSE at this very moment, at the charts 👇‼️🎯
Just look at the accuracy of this trade, the One’s who did listen to me, happy for you guys🫶🙌
Press that follow bottom to see more prediction trades ‼️🎯
#pievers $PIEVERSE
{future}(PIEVERSEUSDT)
What did i say you guys⁉️😳
I’ve said that $PIEVERSE will go parabolic, and this is exactly what happened‼️🎯
Look at the price of $PIEVERSE at this very moment, at the charts 👇‼️🎯
Just look at the accuracy of this trade, the One’s who did listen to me, happy for you guys🫶🙌
Press that follow bottom to see more prediction trades ‼️🎯
#pievers $PIEVERSE
I’ve said that $PIEVERSE will go parabolic, and this is exactly what happened‼️🎯
Look at the price of $PIEVERSE at this very moment, at the charts 👇‼️🎯
Just look at the accuracy of this trade, the One’s who did listen to me, happy for you guys🫶🙌
Press that follow bottom to see more prediction trades ‼️🎯
#pievers $PIEVERSE
MasteringCrypto
·
--
BullishIs $PIEVERSE about to go parabolic⁉️⁉️
Adding for you 1H&1D Charts down 👇
After marking the Previous Day highs&lows prices, there are Two possible options to happen and I’m positive about the first‼️
Option 1: Break above the resistance line, or as you can see at the charts below, break above the Previous day highest price‼️🎯
Option 2 : we will see more and more rejections to the resistance line, and have a decline and more lower lows‼️🥲
$PIEVERSE #pievers
Adding for you 1H&1D Charts down 👇
After marking the Previous Day highs&lows prices, there are Two possible options to happen and I’m positive about the first‼️
Option 1: Break above the resistance line, or as you can see at the charts below, break above the Previous day highest price‼️🎯
Option 2 : we will see more and more rejections to the resistance line, and have a decline and more lower lows‼️🥲
$PIEVERSE #pievers
1
92
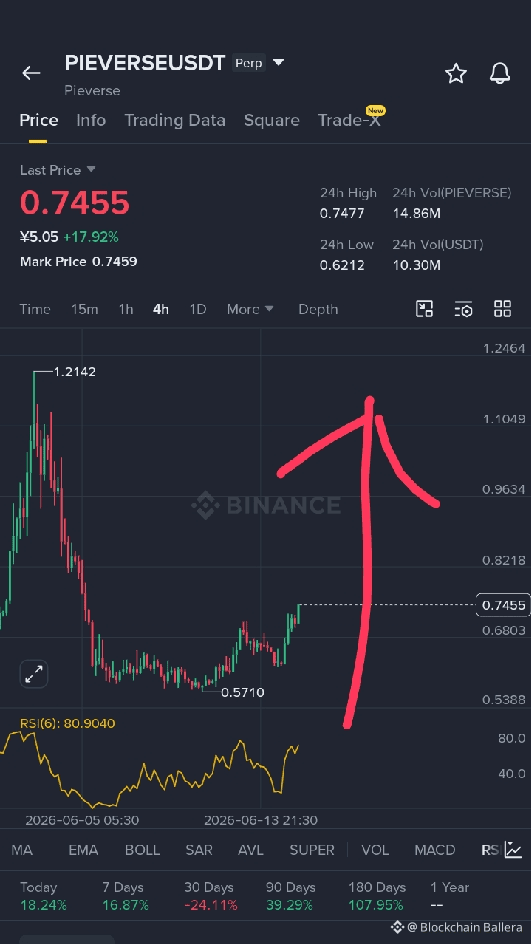
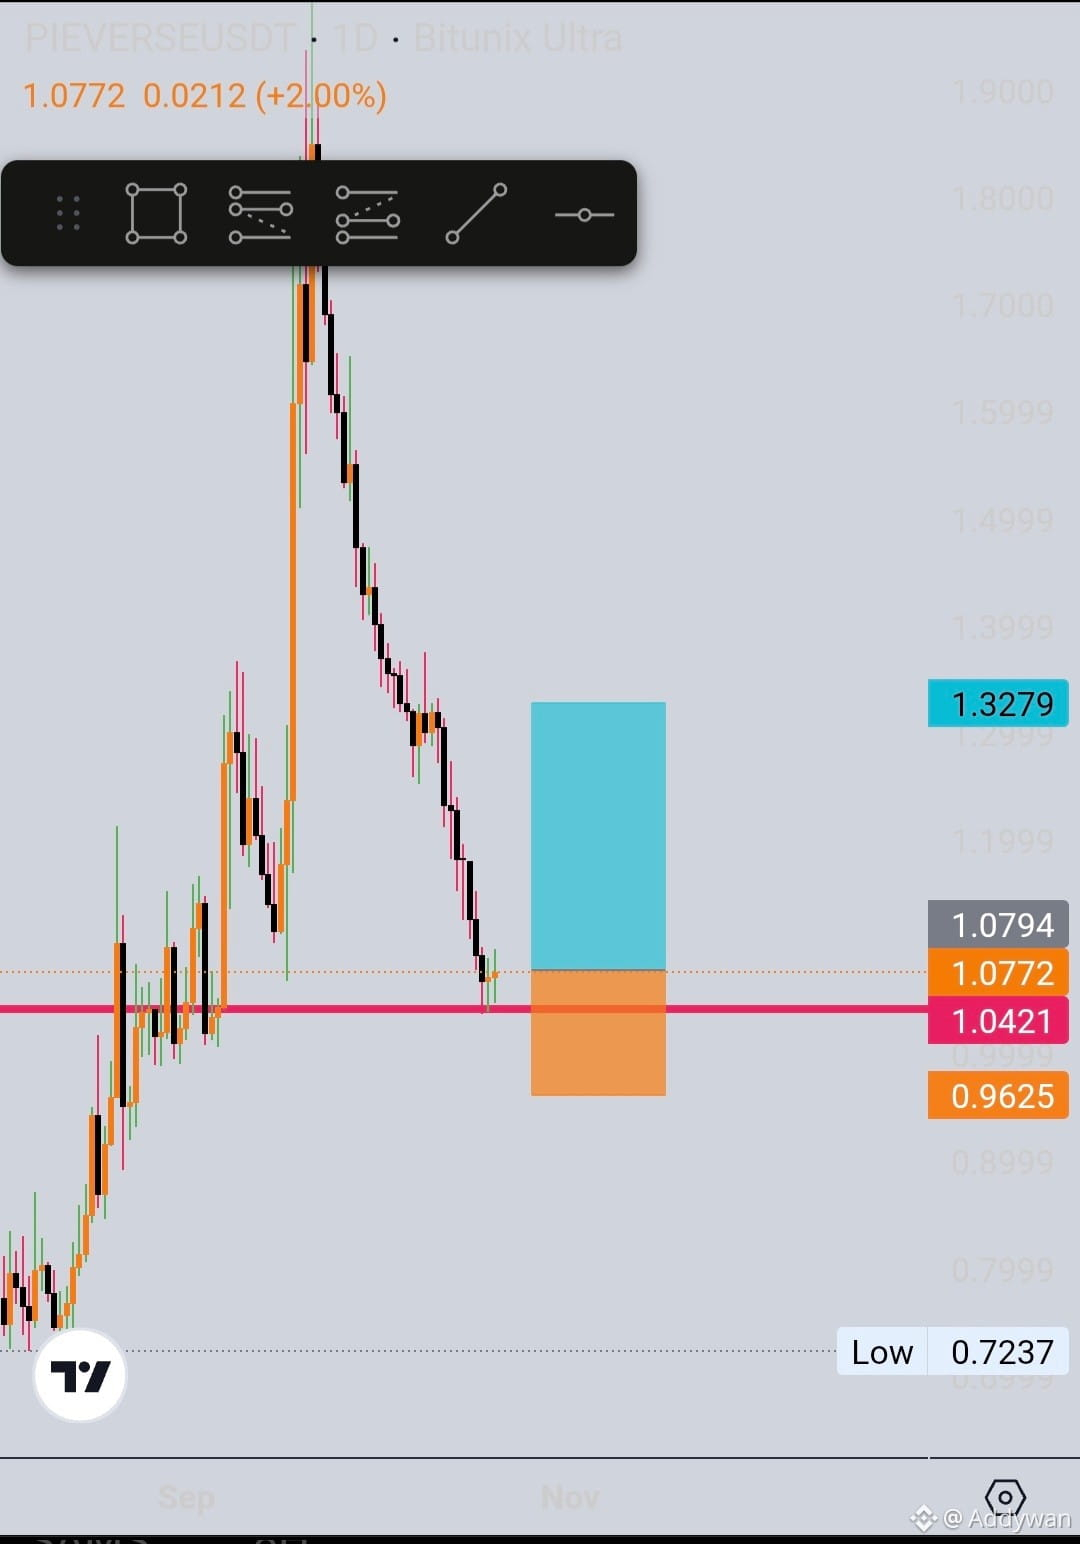
$PIEVERSE is showing strong bullish continuation after a clean breakout from the 0.62 accumulation base , immediately open long 🟢 position #Pievers keep long 👇👇 target $0.90
{future}(PIEVERSEUSDT)
i am also watching $VVV & $JUP
$PIEVERSE is showing strong bullish continuation after a clean breakout from the 0.62 accumulation base , immediately open long 🟢 position #Pievers keep long 👇👇 target $0.90
i am also watching $VVV & $JUP
i am also watching $VVV & $JUP
220

·
--
Bullish
273

Log in to explore more content
Join global crypto users on Binance Square
⚡️ Get latest and useful information about crypto.
💬 Trusted by the world’s largest crypto exchange.
👍 Discover real insights from verified creators.
Email / Phone number
Trending Topics
1
#BTCReboundsAbove$60KAmidWhaleDipBuying
85,366 views
371 Discussing
2
#SolanaSets2027RoadmapToDoubleComputeCapacity
70,140 views
1,080 Discussing
3
#CaliforniaNvidiaProbeExaminesPotentialCriminalViolations
18,959 views
150 Discussing
4
#BlackRockLaunchesHKDollarDigitalLiquidityFund
58,535 views
813 Discussing
5
#NvidiaLoses$2.7TrillionInMonthAndAHalf
81,314 views
319 Discussing
6
#GlobalStocksFaceLongestLosingStreakSince2023
587,455 views
3,541 Discussing
7
#BlackRockIBITPostsRecord$541MSingleDayOutflow
99,388 views
186 Discussing
8
#AnthropicPlungesTowardIPOPriceonDay2
327,126 views
2,379 Discussing
9
#TwentyOneCapitalAdds172.25BTC
176,603 views
1,691 Discussing
10
#HKBillWouldExcludeTokenizedDepositsFromVirtualAssets
19,023 views
109 Discussing