MAS369

Crypto Strategist, Trader, Daily Spot Future Signal Provider and Community Builder. Trade at Your Oun Risk, My all content is only for educational purpose.
Open Trade
Frequent Trader
4.1 Years
20 Following
37 Followers
18 Liked
Posts
Portfolio
PINNED
·
--
In the crypto market, having a top-tier setup is only 20% of the equation; the remaining 80% lies in how you manage the trade after execution. Even with the best signals, many traders turn profitable setups into losses due to the absence of a structured exit plan, improper stop-loss adjustments, or emotional hesitation during volatility. With years of experience navigating order flow liquidity and managing institutional-grade positions, I provide more than just market analysis—I assist you in managing your trades with high precision through the most challenging market conditions. Follow me For More
In the crypto market, having a top-tier setup is only 20% of the equation; the remaining 80% lies in how you manage the trade after execution.

Even with the best signals, many traders turn profitable setups into losses due to the absence of a structured exit plan, improper stop-loss adjustments, or emotional hesitation during volatility.

With years of experience navigating order flow liquidity and managing institutional-grade positions, I provide more than just market analysis—I assist you in managing your trades with high precision through the most challenging market conditions.

Follow me For More
·
--
Bullish
·
--
Bullish
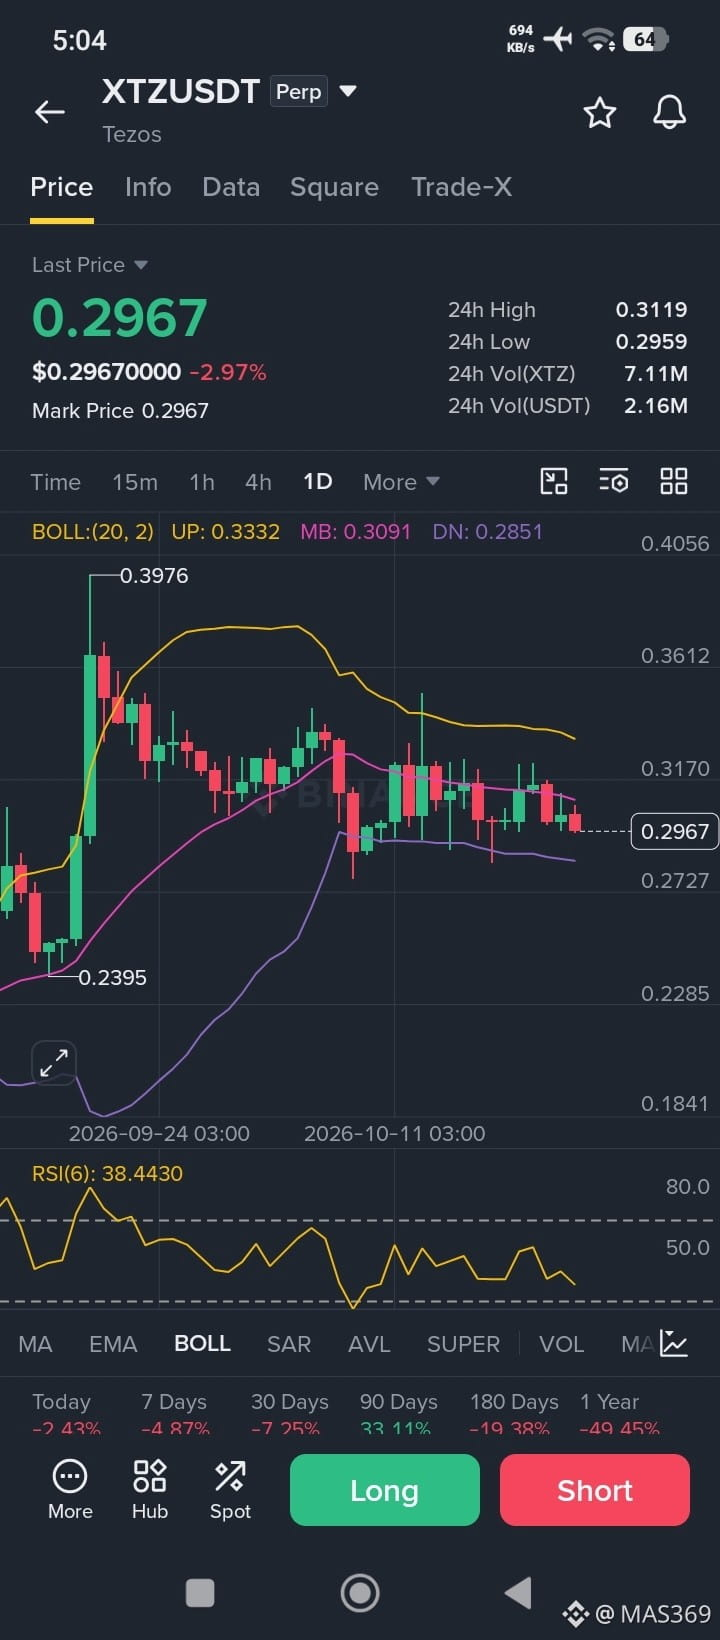
💥 Futures ✅ Long #Signal. $XTZ #XTZ /USDT Entry zone : 0.288866 - 0.297800 Take Profits : 0.299274 0.308163 0.317052 0.325942 0.334831 Stop loss :0.276954 Leverage: 10x {future}(XTZUSDT)
💥 Futures

✅ Long #Signal. $XTZ

#XTZ /USDT

Entry zone : 0.288866 - 0.297800

Take Profits :

0.299274
0.308163
0.317052
0.325942
0.334831

Stop loss :0.276954

Leverage: 10x
·
--
Bullish
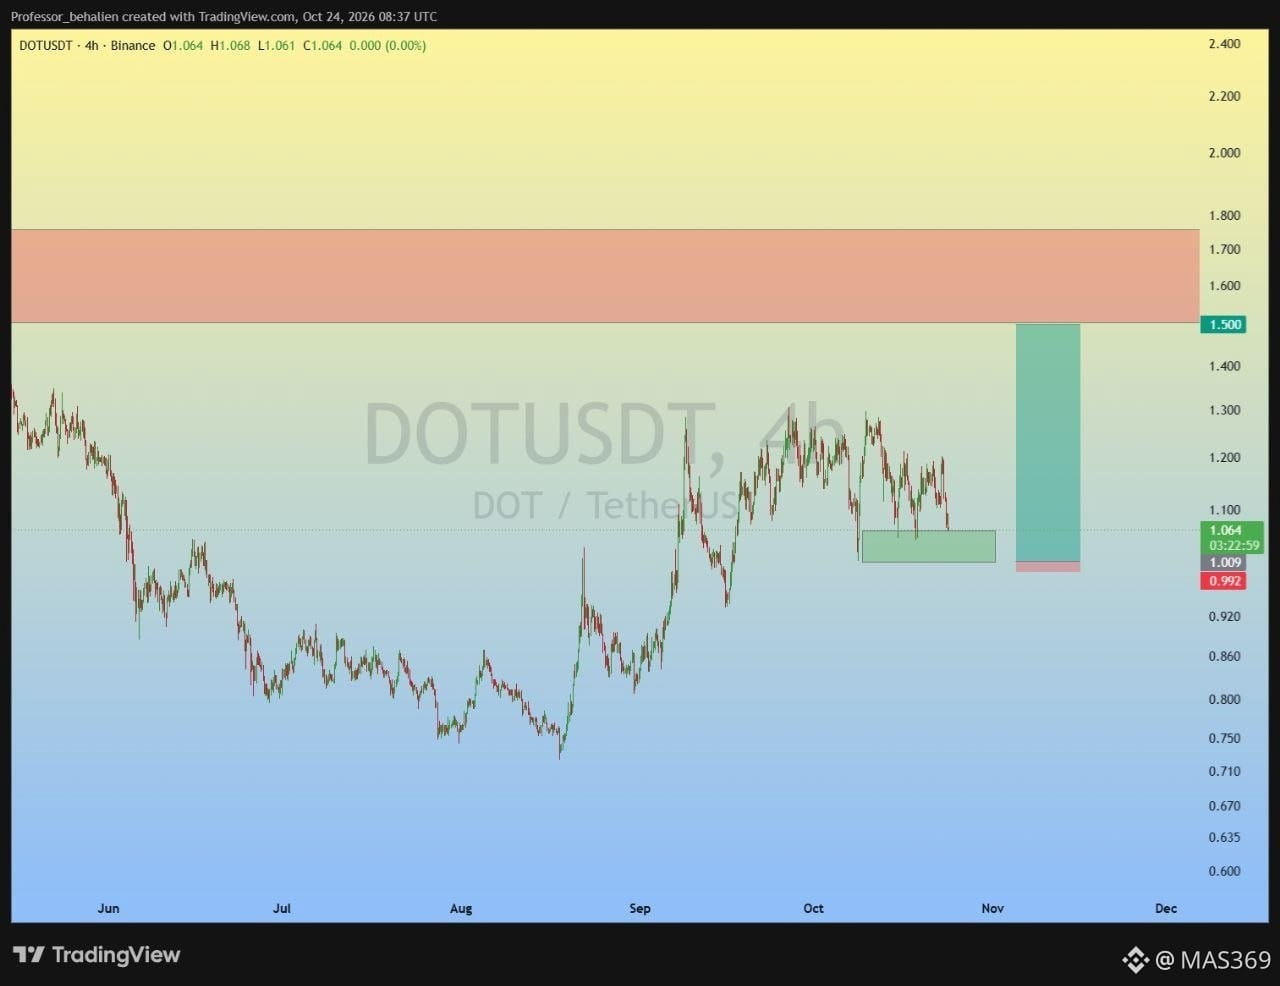
🔵 Polkadot ($DOT /USDT) TECHNICAL SETUP & RISK-MANAGED LONG SIGNAL ------------------------------------ 🎯 Execution Parameters (DOT/USDT) ------------------------------------ • Direction: LONG • Current Price: $1.060 • Entry Zone: $1.010 – $1.060 • Targets:   1️⃣ Target 1: $1.110   2️⃣ Target 2: $1.150   3️⃣ Target 3: $1.240   4️⃣ Target 4: $1.500 (Major Supply Resistance) • Invalidation Stop-Loss: $0.980 (Strict Invalidation) {future}(DOTUSDT) #dotcoin #Signal.
🔵 Polkadot ($DOT /USDT) TECHNICAL SETUP & RISK-MANAGED LONG SIGNAL

------------------------------------
🎯 Execution Parameters (DOT/USDT)
------------------------------------
• Direction: LONG
• Current Price: $1.060
• Entry Zone: $1.010 – $1.060
• Targets:
1️⃣ Target 1: $1.110
2️⃣ Target 2: $1.150
3️⃣ Target 3: $1.240
4️⃣ Target 4: $1.500 (Major Supply Resistance)
• Invalidation Stop-Loss: $0.980 (Strict Invalidation)
#dotcoin #Signal.
·
--
Bullish
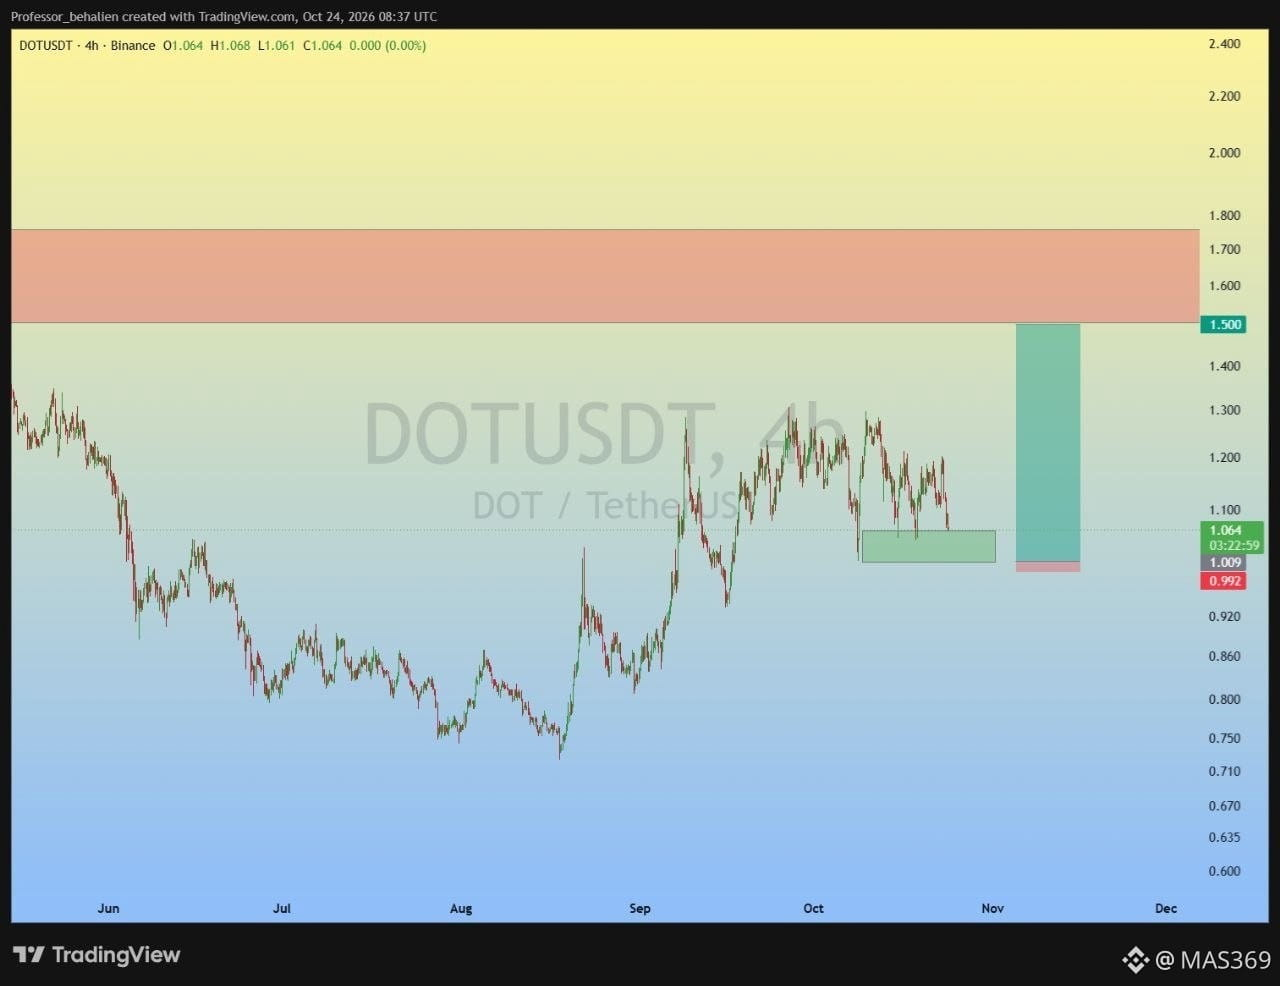
🔵 Polkadot ($DOT /USDT) TECHNICAL SETUP & RISK-MANAGED LONG SIGNAL Polkadot ($DOT ) is currently trading at $1.060, holding above a local demand cluster. Given the ongoing macroeconomic tensions, elevated crude oil volatility, and geopolitical friction in the Middle East, current market conditions are highly volatile and atypical. Under these conditions, employing an ultra-tight, systematic stop-loss is crucial. This approach enforces an asymmetric risk-to-reward ratio: either absorbing a minimal, pre-calculated loss or capturing significant upside expansion. ------------------------------------ 🎯 Execution Parameters (DOT/USDT) ------------------------------------ • Direction: LONG • Current Price: $1.060 • Entry Zone: $1.010 – $1.060 • Targets:   1️⃣ Target 1: $1.110   2️⃣ Target 2: $1.150   3️⃣ Target 3: $1.240   4️⃣ Target 4: $1.500 (Major Supply Resistance) • Invalidation Stop-Loss: $0.980 (Strict Invalidation) ------------------------------------ 🛡️ Risk Management Guidelines ------------------------------------ While a wider stop-loss could be used under normal conditions, the current macro backdrop warrants strict capital preservation. Position size and margin leverage must be strictly controlled to ensure that a stop-out results in negligible drawdown. Capital preservation precedes profitability. Trade with strict discipline. {future}(DOTUSDT) #DOTUSD #Signal🚥. #SİGNAL
🔵 Polkadot ($DOT /USDT) TECHNICAL SETUP & RISK-MANAGED LONG SIGNAL

Polkadot ($DOT ) is currently trading at $1.060, holding above a local demand cluster. Given the ongoing macroeconomic tensions, elevated crude oil volatility, and geopolitical friction in the Middle East, current market conditions are highly volatile and atypical.

Under these conditions, employing an ultra-tight, systematic stop-loss is crucial. This approach enforces an asymmetric risk-to-reward ratio: either absorbing a minimal, pre-calculated loss or capturing significant upside expansion.

------------------------------------
🎯 Execution Parameters (DOT/USDT)
------------------------------------
• Direction: LONG
• Current Price: $1.060
• Entry Zone: $1.010 – $1.060
• Targets:
1️⃣ Target 1: $1.110
2️⃣ Target 2: $1.150
3️⃣ Target 3: $1.240
4️⃣ Target 4: $1.500 (Major Supply Resistance)
• Invalidation Stop-Loss: $0.980 (Strict Invalidation)

------------------------------------
🛡️ Risk Management Guidelines
------------------------------------
While a wider stop-loss could be used under normal conditions, the current macro backdrop warrants strict capital preservation. Position size and margin leverage must be strictly controlled to ensure that a stop-out results in negligible drawdown.

Capital preservation precedes profitability. Trade with strict discipline.
#DOTUSD #Signal🚥. #SİGNAL
·
--
Bullish
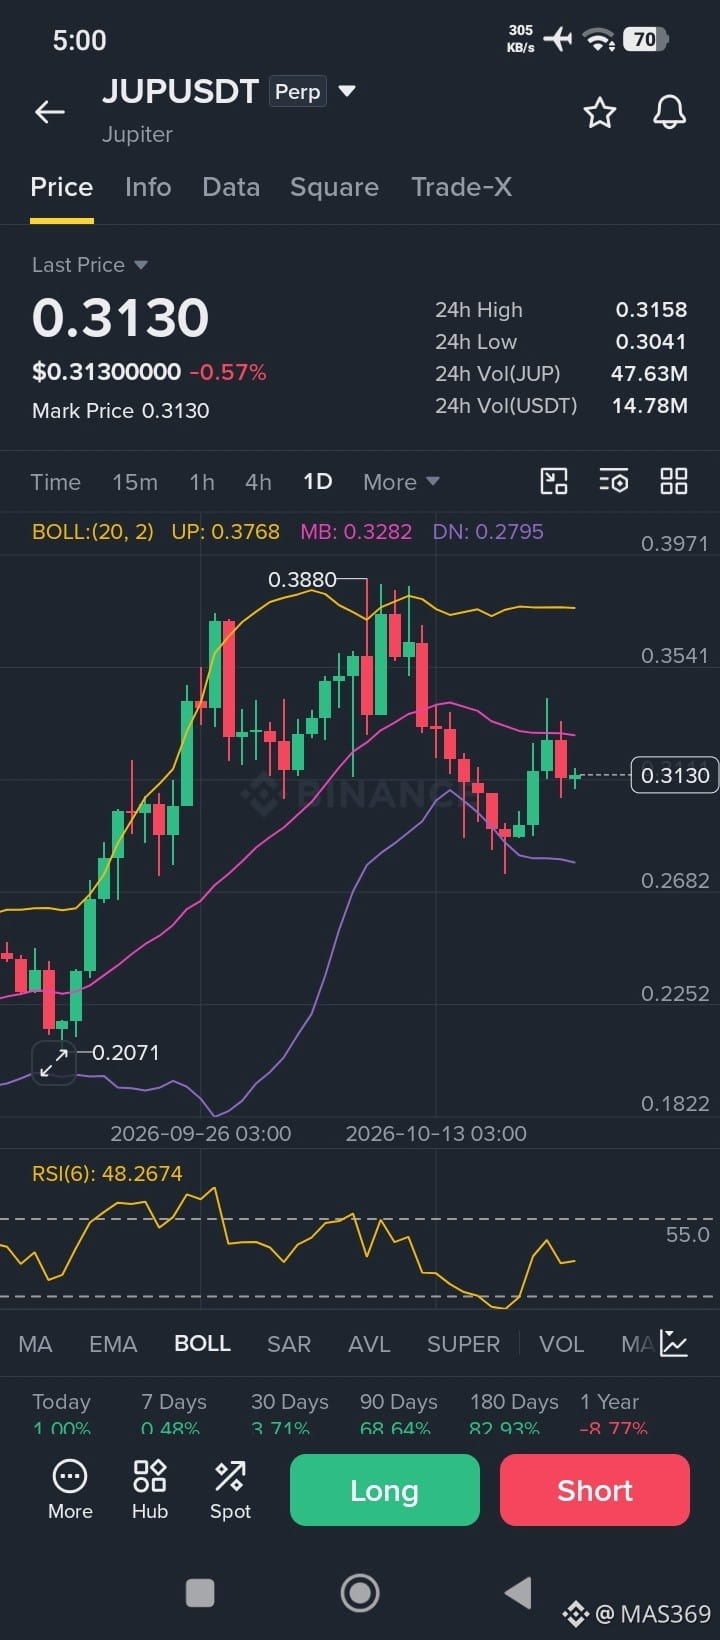
Killer Signal 2256 $JUP /USDT (2-5x) Direction: LONG ENTRY: 0.3020 - 0.3050 TARGETS: 0.3200 – 0.3350 – 0.3550 - 0.3750 - 0.4000 - 0.4250 - 0.4600 - 0.5000 STOP LOSS: 0.2750 4H FVG confluent with ascending trendline support and horizontal levels at entry. {future}(JUPUSDT) #Signal🚥.
Killer Signal 2256
$JUP /USDT (2-5x)
Direction: LONG
ENTRY: 0.3020 - 0.3050

TARGETS: 0.3200 – 0.3350 – 0.3550 - 0.3750 - 0.4000 - 0.4250 - 0.4600 - 0.5000

STOP LOSS: 0.2750

4H FVG confluent with ascending trendline support and horizontal levels at entry.
#Signal🚥.
·
--
Bullish
MAS369
·
--
Bullish
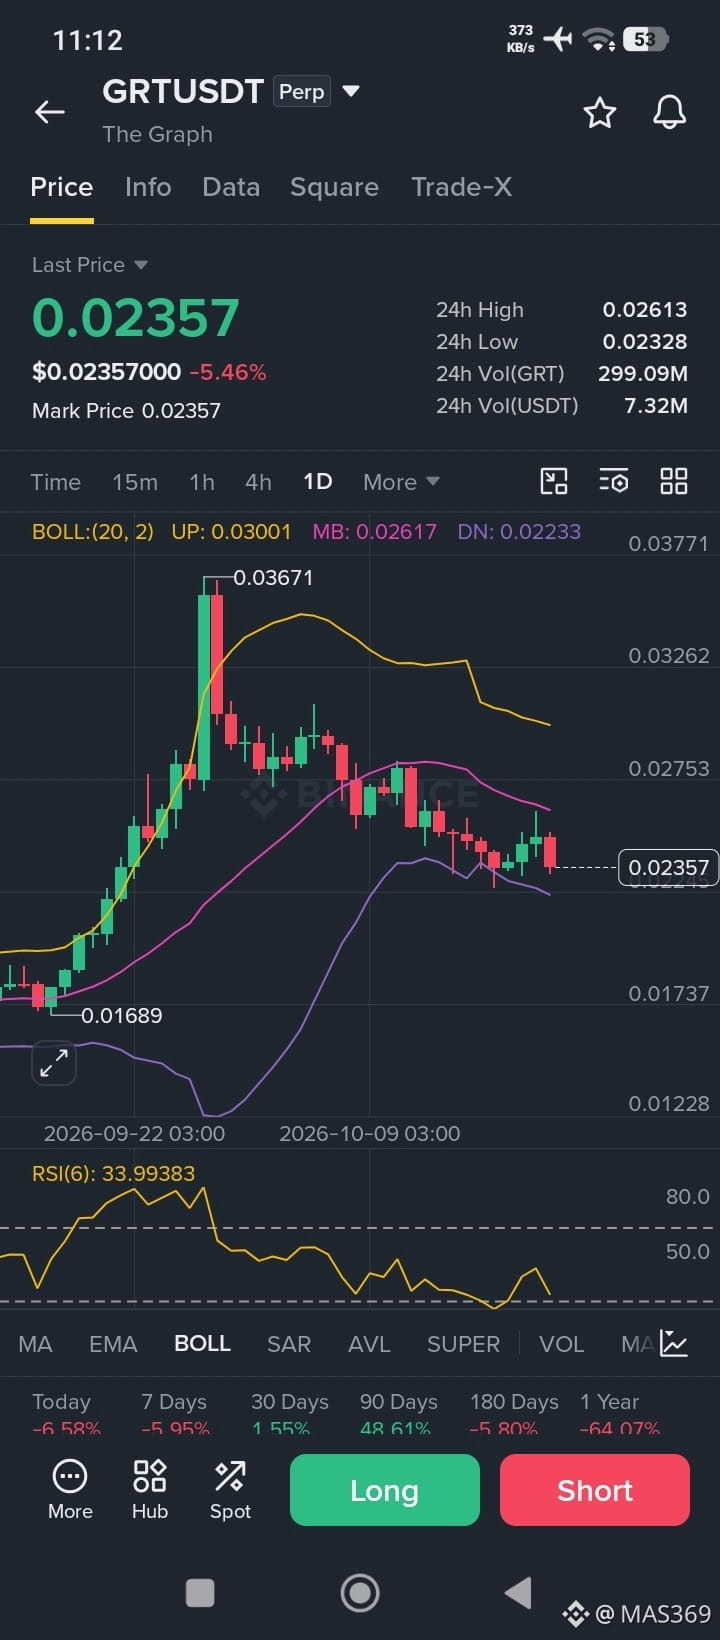
$GRT Long Setup
📩 #GRTUSDT 15M | MACD Cross
📈 Long Entry Zone: 0.02363-0.02371
⚡ Leverage: 25x

🎯 Strategy Details:
Target 1: 0.02385
Target 2: 0.02407
Target 3: 0.02443
Target 4: 0.02504

🔺 Stop-Loss: 0.02249
💡 After reaching the first target you can put the rest of the position to breakeven.

📊 Price action on the fifteen-minute frame reflects steady bearish commitment. Buying pressure intensified as the histogram flipped into positive territory. Momentum remains healthy with room before reaching extreme overbought conditions. Place defensive stops below the setup zone; anticipate swift execution toward the nearest target.

#Signal🚥. #signalfutures
·
--
Bearish
$DOT #SHORT📉 #Signal🚥. 📩 #DOTUSDT 15M | EMA Cross 📉 Short Entry Zone: 1.119-1.123 ⚡ Leverage: 15x 🎯 Strategy Details: Target 1: 1.113 Target 2: 1.102 Target 3: 1.085 Target 4: 1.056 🔺 Stop-Loss: 1.177 💡 After reaching the first target you can put the rest of the position to breakeven. 📊 Price action on the fifteen-minute frame reflects steady bearish commitment. A fast exponential crossover has triggered fresh selling interest. The oscillator shows constructive selling pressure without capitulation. Risk is strictly managed above the entry area; expect a rapid move to secure initial profits. {future}(DOTUSDT) #signalsfutures
$DOT #SHORT📉
#Signal🚥.
📩 #DOTUSDT 15M | EMA Cross
📉 Short Entry Zone: 1.119-1.123
⚡ Leverage: 15x

🎯 Strategy Details:
Target 1: 1.113
Target 2: 1.102
Target 3: 1.085
Target 4: 1.056

🔺 Stop-Loss: 1.177
💡 After reaching the first target you can put the rest of the position to breakeven.

📊 Price action on the fifteen-minute frame reflects steady bearish commitment. A fast exponential crossover has triggered fresh selling interest. The oscillator shows constructive selling pressure without capitulation. Risk is strictly managed above the entry area; expect a rapid move to secure initial profits.
#signalsfutures
·
--
Bullish
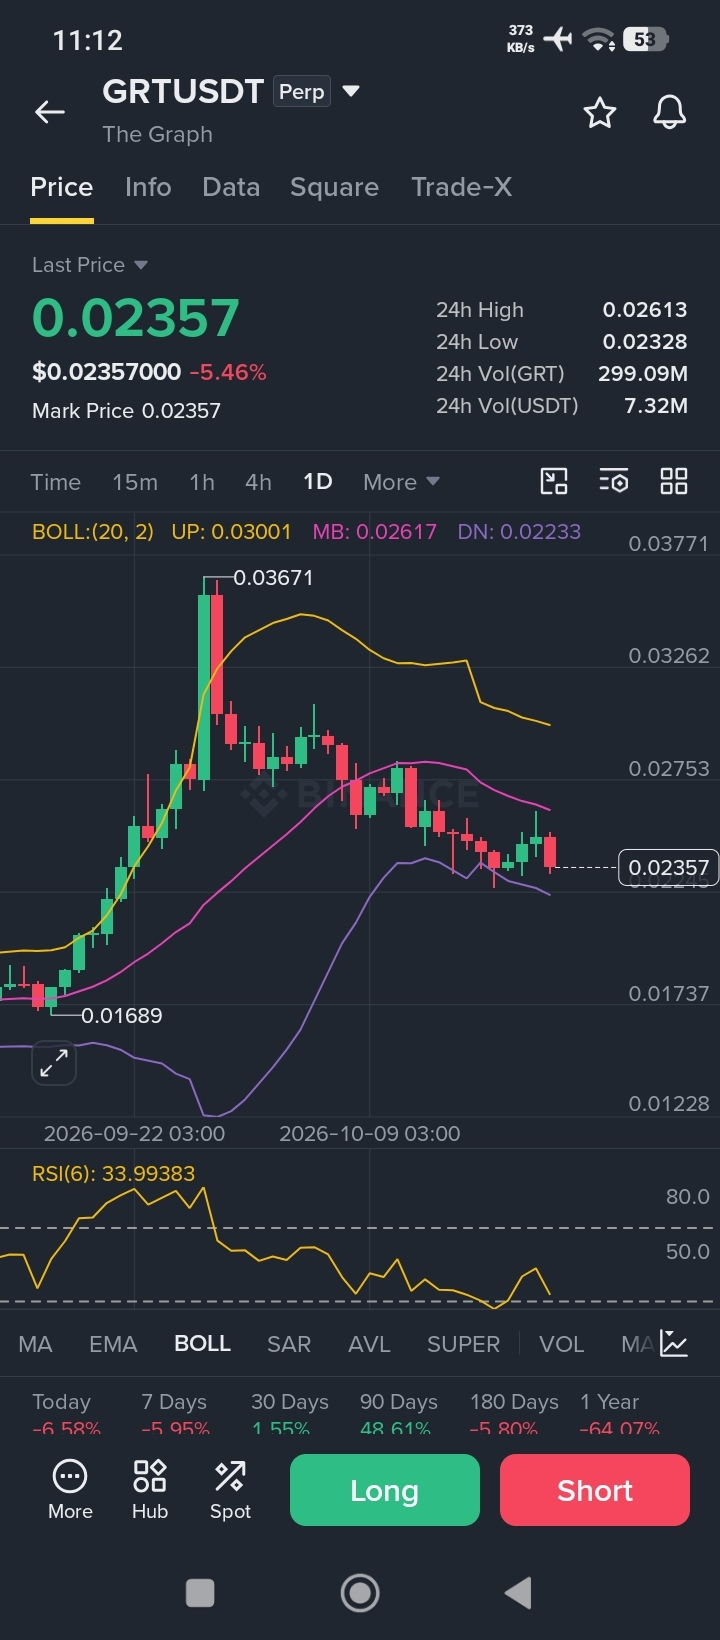
$GRT Long Setup 📩 #GRTUSDT 15M | MACD Cross 📈 Long Entry Zone: 0.02363-0.02371 ⚡ Leverage: 25x 🎯 Strategy Details: Target 1: 0.02385 Target 2: 0.02407 Target 3: 0.02443 Target 4: 0.02504 🔺 Stop-Loss: 0.02249 💡 After reaching the first target you can put the rest of the position to breakeven. 📊 Price action on the fifteen-minute frame reflects steady bearish commitment. Buying pressure intensified as the histogram flipped into positive territory. Momentum remains healthy with room before reaching extreme overbought conditions. Place defensive stops below the setup zone; anticipate swift execution toward the nearest target. {future}(GRTUSDT) #Signal🚥. #signalfutures
$GRT Long Setup
📩 #GRTUSDT 15M | MACD Cross
📈 Long Entry Zone: 0.02363-0.02371
⚡ Leverage: 25x

🎯 Strategy Details:
Target 1: 0.02385
Target 2: 0.02407
Target 3: 0.02443
Target 4: 0.02504

🔺 Stop-Loss: 0.02249
💡 After reaching the first target you can put the rest of the position to breakeven.

📊 Price action on the fifteen-minute frame reflects steady bearish commitment. Buying pressure intensified as the histogram flipped into positive territory. Momentum remains healthy with room before reaching extreme overbought conditions. Place defensive stops below the setup zone; anticipate swift execution toward the nearest target.
#Signal🚥. #signalfutures
·
--
Bullish
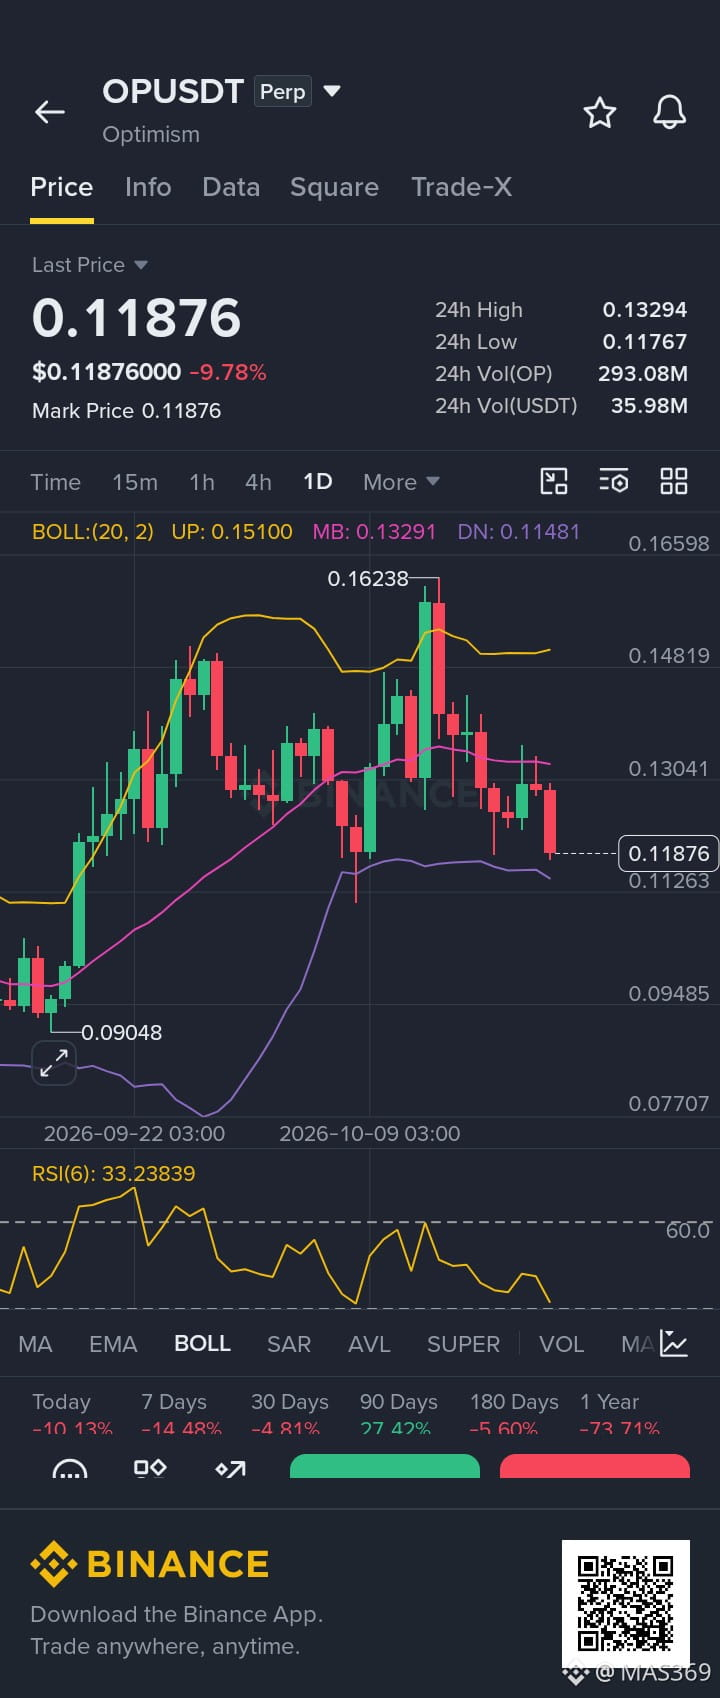
$OP 📩 #OP USDT 15M | MACD Cross 📈 Long Entry Zone: 0.119-0.11936 ⚡ Leverage: 25x 🎯 Strategy Details: Target 1: 0.12007 Target 2: 0.12121 Target 3: 0.12299 Target 4: 0.12609 🔺 Stop-Loss: 0.11322 💡 After reaching the first target you can put the rest of the position to breakeven. 📊 Price action on the fifteen-minute frame reflects steady bearish commitment. The momentum oscillator turned positive, confirming a bullish divergence. Buyers maintain control as the momentum gauge sits in a sustainable zone. Place defensive stops below the setup zone; anticipate swift execution toward the nearest target. {future}(OPUSDT) #Signal🚥. #Signal.
$OP
📩 #OP USDT 15M | MACD Cross
📈 Long Entry Zone: 0.119-0.11936
⚡ Leverage: 25x

🎯 Strategy Details:
Target 1: 0.12007
Target 2: 0.12121
Target 3: 0.12299
Target 4: 0.12609

🔺 Stop-Loss: 0.11322
💡 After reaching the first target you can put the rest of the position to breakeven.

📊 Price action on the fifteen-minute frame reflects steady bearish commitment. The momentum oscillator turned positive, confirming a bullish divergence. Buyers maintain control as the momentum gauge sits in a sustainable zone. Place defensive stops below the setup zone; anticipate swift execution toward the nearest target.
#Signal🚥. #Signal.
·
--
Bearish
Congrats To Followers #AAVE/USDT All targets achieved 😎 Profit: 42.9249% 📈 Period: 1 day 9 hr ⏰ Follow me for more signal. #Signal🚥. $AAVE {future}(AAVEUSDT)
Congrats To Followers
#AAVE/USDT All targets achieved 😎
Profit: 42.9249% 📈
Period: 1 day 9 hr ⏰
Follow me for more signal.
#Signal🚥. $AAVE
MAS369
·
--
Bearish
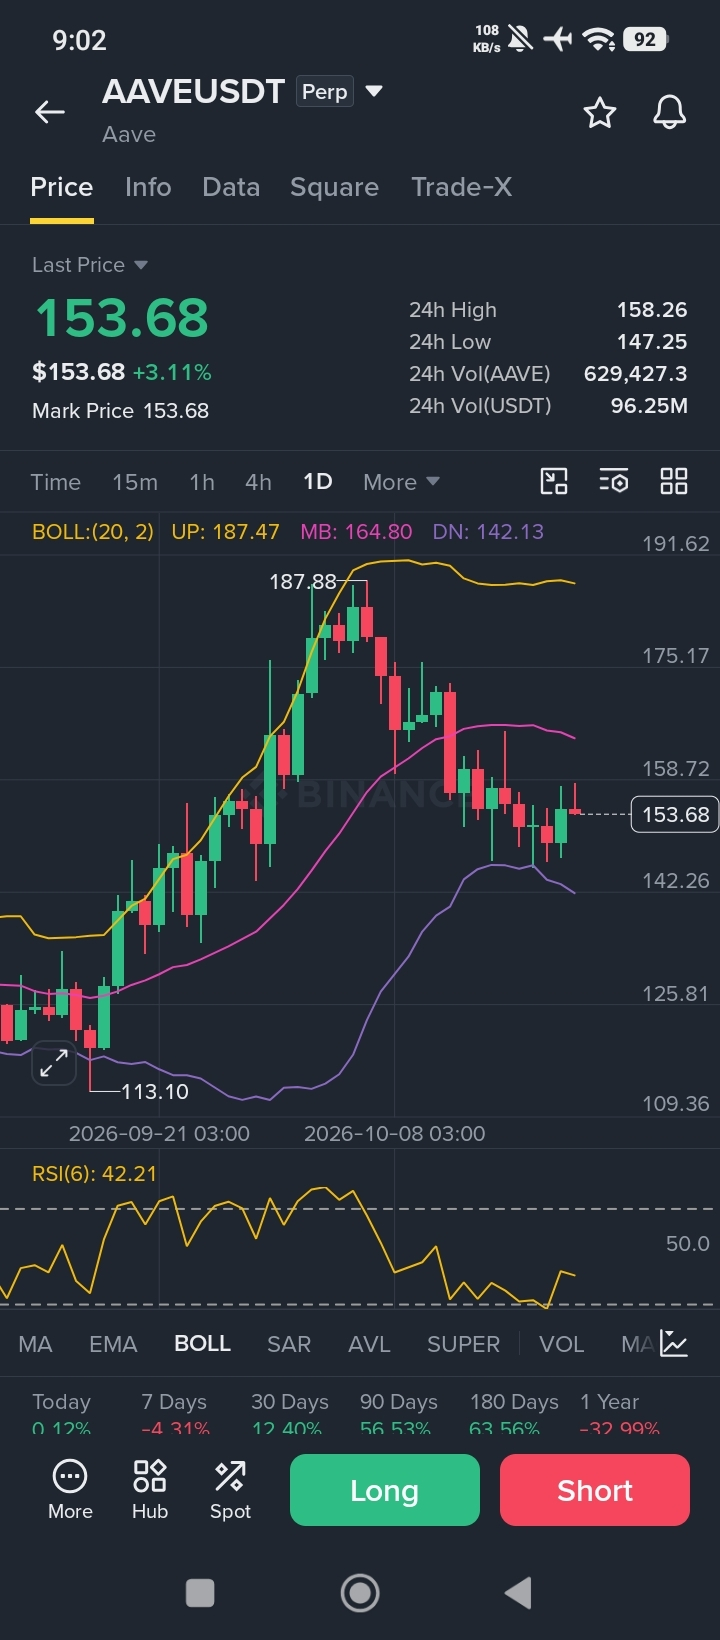
📩 $AAVE /Usdt 15M | EMA Cross
📉 Short Entry Zone: 154.75-155.21
⚡ Leverage: 15x

🎯 Strategy Details:
Target 1: 153.82
Target 2: 152.35
Target 3: 150.02
Target 4: 145.99

🔺 Stop-Loss: 162.73
💡 After reaching the first target you can put the rest of the position to breakeven.

📊 The intraday chart maintains a bullish posture with price holding above dynamic support. Short-term averages aligned bearishly, opening a momentum scalp window. The oscillator shows constructive selling pressure without capitulation. Place defensive stops above the setup zone; anticipate swift execution toward the nearest target.

$BTC
#Signal🚥.
·
--
Bullish
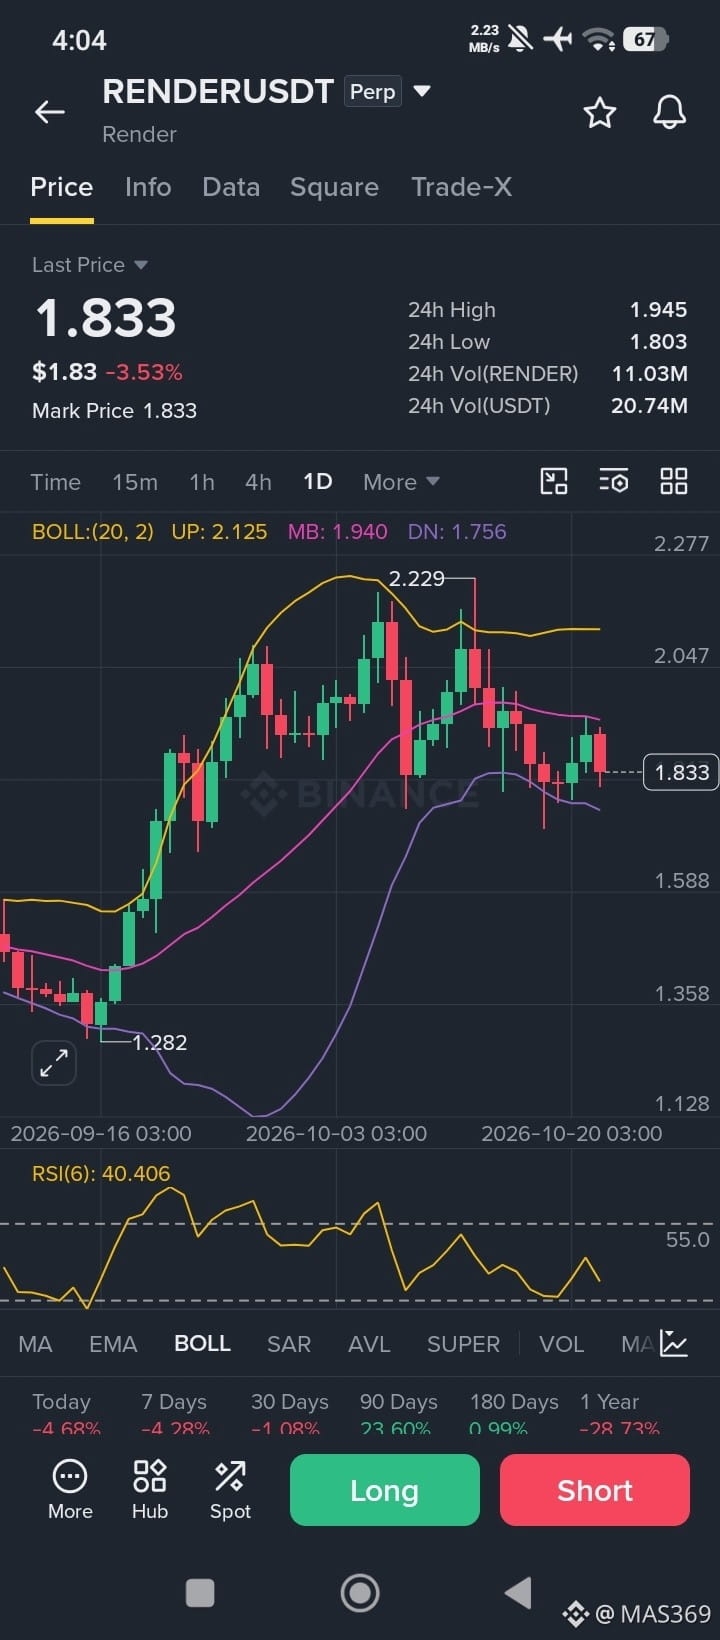
$RENDER #Signal🚥. 📩 #RENDER USDT 15M | EMA Cross 📈 Long Entry Zone: 1.836-1.842 ⚡ Leverage: 15x 🎯 Strategy Details: Target 1: 1.853 Target 2: 1.87 Target 3: 1.898 Target 4: 1.946 🔺 Stop-Loss: 1.747 💡 After reaching the first target you can put the rest of the position to breakeven. 📊 The intraday chart maintains a bearish posture with price holding below dynamic resistance. A fast exponential crossover has triggered fresh buying interest. The oscillator shows constructive buying pressure without overheating. Invalidation lies below the entry zone; target a quick sweep to the first objective and extension toward the final target. {future}(RENDERUSDT)
$RENDER #Signal🚥.
📩 #RENDER USDT 15M | EMA Cross
📈 Long Entry Zone: 1.836-1.842
⚡ Leverage: 15x

🎯 Strategy Details:
Target 1: 1.853
Target 2: 1.87
Target 3: 1.898
Target 4: 1.946

🔺 Stop-Loss: 1.747
💡 After reaching the first target you can put the rest of the position to breakeven.

📊 The intraday chart maintains a bearish posture with price holding below dynamic resistance. A fast exponential crossover has triggered fresh buying interest. The oscillator shows constructive buying pressure without overheating. Invalidation lies below the entry zone; target a quick sweep to the first objective and extension toward the final target.
·
--
Bullish
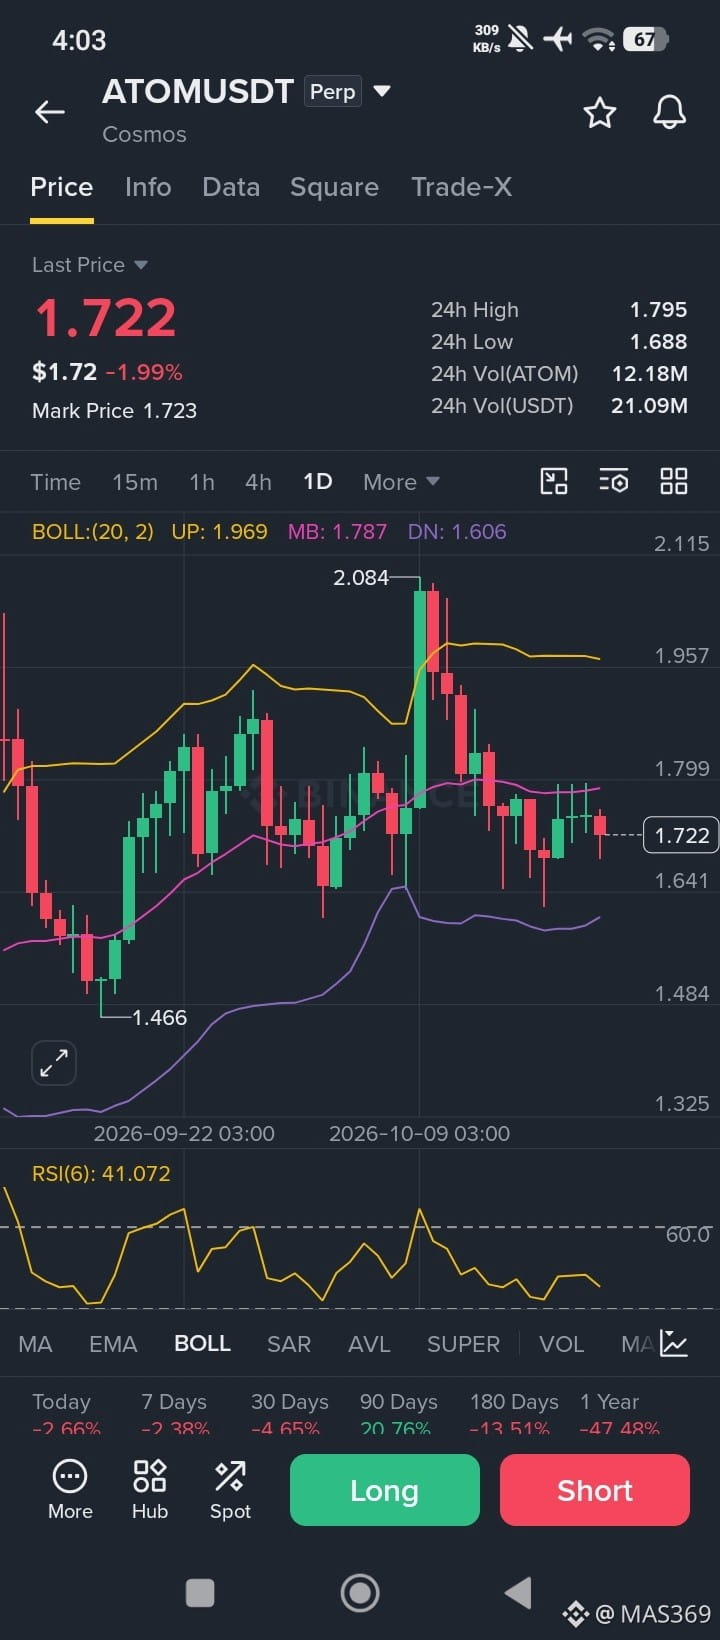
$ATOM #Signal🚥. 📩 #ATOMUSDT 15M | EMA Cross 📈 Long Entry Zone: 1.714-1.72 ⚡ Leverage: 15x 🎯 Strategy Details: Target 1: 1.73 Target 2: 1.746 Target 3: 1.772 Target 4: 1.817 🔺 Stop-Loss: 1.631 💡 After reaching the first target you can put the rest of the position to breakeven. 📊 Short-term structure favors sellers as momentum sustains below key averages. Short-term averages aligned bullishly, opening a momentum scalp window. Buyers maintain control as the momentum gauge sits in a sustainable zone. Invalidation lies below the entry zone; target a quick sweep to the first objective and extension toward the final target. {future}(ATOMUSDT)
$ATOM #Signal🚥.
📩 #ATOMUSDT 15M | EMA Cross
📈 Long Entry Zone: 1.714-1.72
⚡ Leverage: 15x

🎯 Strategy Details:
Target 1: 1.73
Target 2: 1.746
Target 3: 1.772
Target 4: 1.817

🔺 Stop-Loss: 1.631
💡 After reaching the first target you can put the rest of the position to breakeven.

📊 Short-term structure favors sellers as momentum sustains below key averages. Short-term averages aligned bullishly, opening a momentum scalp window. Buyers maintain control as the momentum gauge sits in a sustainable zone. Invalidation lies below the entry zone; target a quick sweep to the first objective and extension toward the final target.
·
--
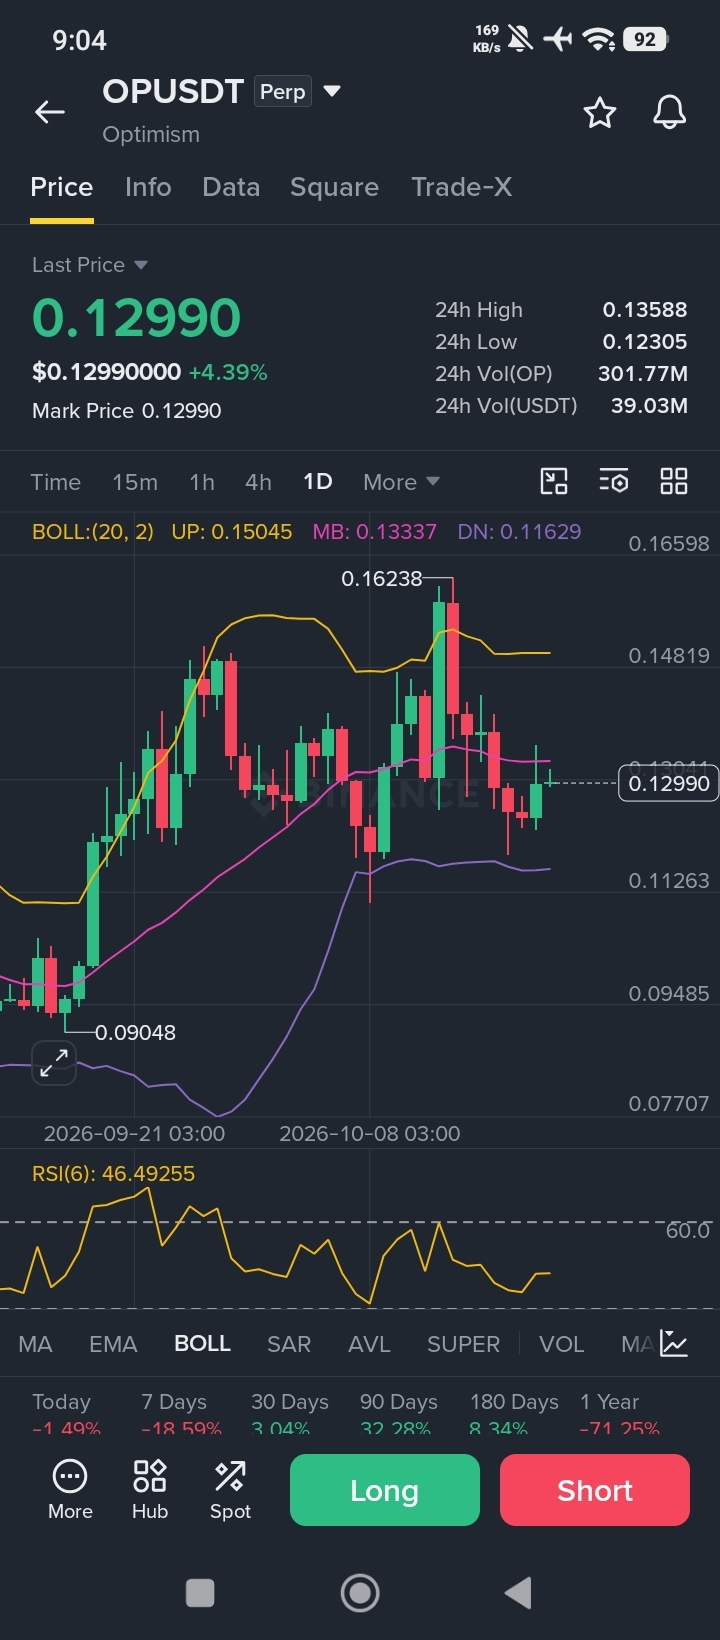
#OP/USDT All targets achieved 😎 Profit: 42.3387% 📈 Period: 1 day ⏰ {future}(OPUSDT)
#OP/USDT All targets achieved 😎
Profit: 42.3387% 📈
Period: 1 day ⏰
MAS369
·
--
Bearish
$OP /USDT 15M | EMA Cross
📉 Short Entry Zone: 0.13-0.1304
⚡ Leverage: 15x

🎯 Strategy Details:
Target 1: 0.12922
Target 2: 0.12799
Target 3: 0.12603
Target 4: 0.12265

🔺 Stop-Loss: 0.13671
💡 After reaching the first target you can put the rest of the position to breakeven.

📊 Price action on the fifteen-minute frame reflects steady bullish commitment. A fast exponential crossover has triggered fresh selling interest. Momentum remains healthy with room before reaching extreme oversold conditions. Invalidation lies above the entry zone; target a quick drop to the first objective and extension toward the final target.

#Signal🚥.
·
--
Bullish
·
--
#AVAX/USDT Take-Profit target 2 ✅ Profit: 30.6647% 📈 Period: 2 days 10 hr ⏰ {future}(AVAXUSDT)
#AVAX/USDT Take-Profit target 2 ✅
Profit: 30.6647% 📈
Period: 2 days 10 hr ⏰
MAS369
·
--
Bearish
📩 $AAVE /Usdt 15M | EMA Cross
📉 Short Entry Zone: 154.75-155.21
⚡ Leverage: 15x

🎯 Strategy Details:
Target 1: 153.82
Target 2: 152.35
Target 3: 150.02
Target 4: 145.99

🔺 Stop-Loss: 162.73
💡 After reaching the first target you can put the rest of the position to breakeven.

📊 The intraday chart maintains a bullish posture with price holding above dynamic support. Short-term averages aligned bearishly, opening a momentum scalp window. The oscillator shows constructive selling pressure without capitulation. Place defensive stops above the setup zone; anticipate swift execution toward the nearest target.

$BTC
#Signal🚥.
·
--
Bullish
·
--
Bullish
$ENA Direction: LONG ➖➖➖➖➖➖➖ Target 1: 0.1890✅ Target 2: 0.2000✅ Target 3: 0.2120✅ Target 4: 0.2250✅ 🔥125% Profit (5x)🔥 FOLLOW ME FOR MORE SIGNAL #Signal🚥. #SİGNAL
$ENA
Direction: LONG
➖➖➖➖➖➖➖
Target 1: 0.1890✅
Target 2: 0.2000✅
Target 3: 0.2120✅
Target 4: 0.2250✅

🔥125% Profit (5x)🔥
FOLLOW ME FOR MORE SIGNAL
#Signal🚥. #SİGNAL
MAS369
·
--
Bullish
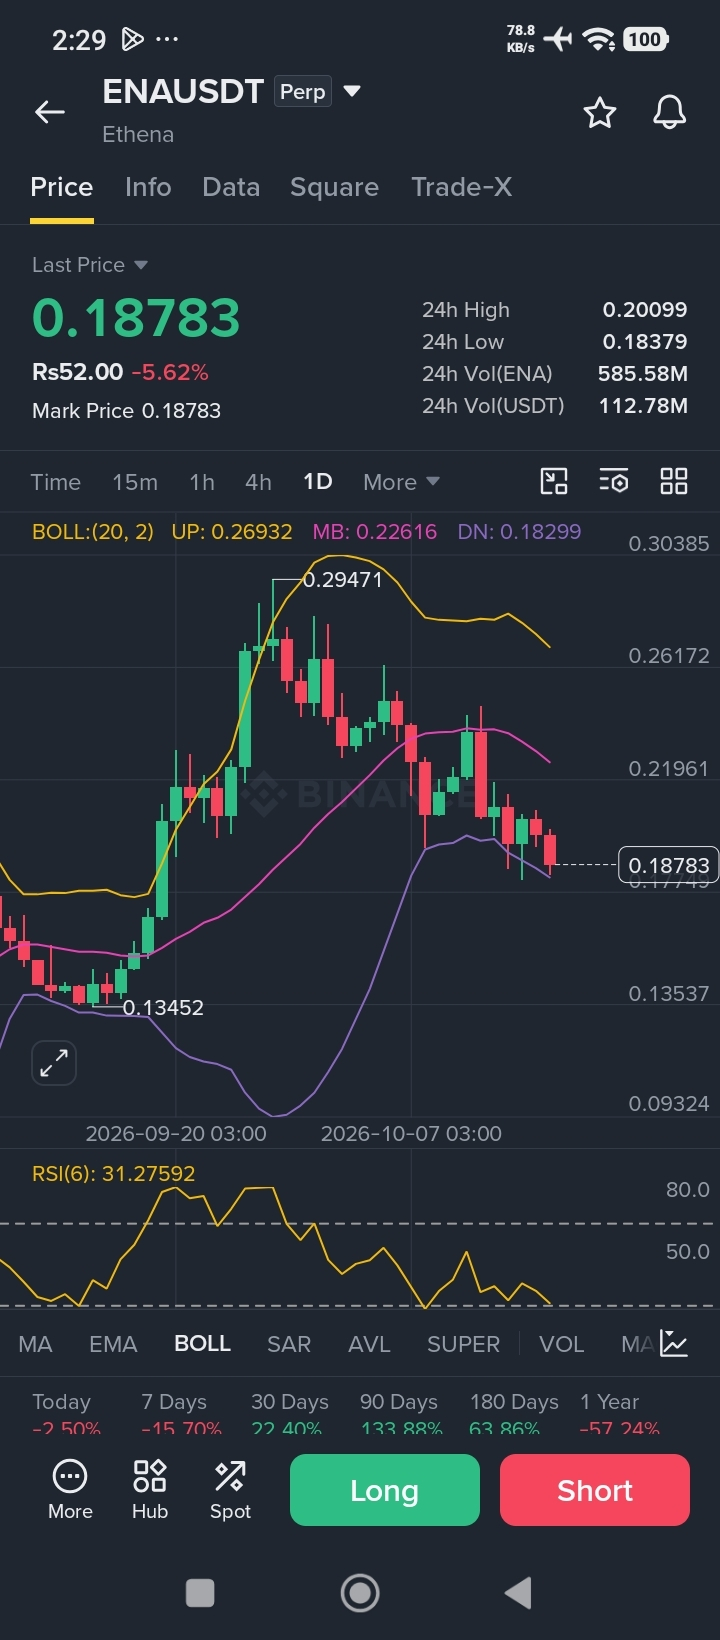
Killer Signal 2252

$ENA /USDT (2-5x)
Direction: LONG

ENTRY: 0.1780 - 0.1800

TARGETS: 0.1890 – 0.2000 – 0.2120 - 0.2250 - 0.2400 - 0.2550 - 0.2750 - 0.3000

STOP LOSS: 0.1620

8H FVG confluent with ascending trendline support and a horizontal level at entry.

#ENA #Signal🚥.
·
--
Bullish
✅ Congrats members! #XRP/USDT reached 1.3519 Keep enjoying our signals 🎯 ✅ 18.03% Profit $XRP FOLLOW Me For More Signals. #Signal🚥.
✅ Congrats members!

#XRP/USDT reached 1.3519

Keep enjoying our signals 🎯

✅ 18.03% Profit
$XRP

FOLLOW Me For More Signals.
#Signal🚥.
MAS369
·
--
Bullish
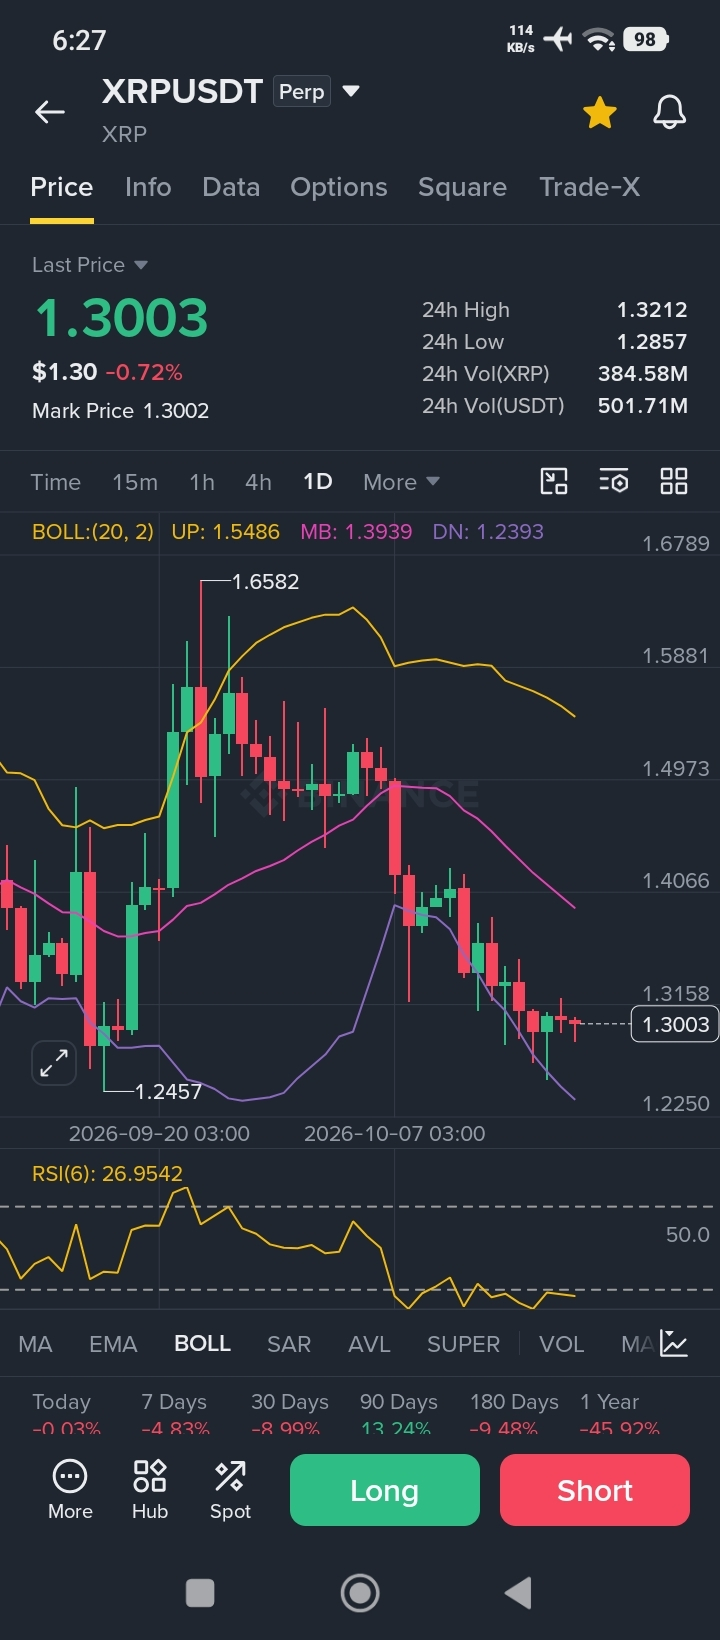
💥 Futures

✅ Long

$XRP /USDT

Entry zone : 1.2579 - 1.2969

Take Profits :

1.3033
1.3420
1.3807
1.4194
1.4581

Stop loss :1.206117

Leverage: 10x

$XRP $SOL
#Signal🚥.
Log in to explore more content
Join global crypto users on Binance Square
⚡️ Get latest and useful information about crypto.
💬 Trusted by the world’s largest crypto exchange.
👍 Discover real insights from verified creators.
Email / Phone number
Sitemap
Cookie Preferences
Platform T&Cs