Binance Square
#osmo

osmo

274,722 views
1,554 Discussing
Mustang88sn
·
--
$OSMO 📊 — DeFi on the radar! 💰 Current price: $0.0330 (-2.37% in 24h) 📊 Daily range: 🔺 High: $0.0339 🔻 Low: $0.0322 📦 Volume: 8.13M OSMO / $267K USDT 📈 Indicators: · EMA(21): $0.0329 — price is slightly above, neutral · EMA(50): $0.0329 — price is touching, possible support · EMA(200): $0.0333 — price is below, resistance overhead · Supertrend (10,3): $0.0325 — price is above, bullish signal ✅ · RSI(14): 52.49 — neutral, room for growth 📈 🧠 Thought: OSMO is trading in a tight range, and Supertrend shows a bullish setup. RSI is in a healthy zone—there’s room to rise. If $0.0339 breaks, we expect a move toward $0.035+ . Volumes are stable. 🎯 Targets: TP1: $0.0345 TP2: $0.0355 TP3: $0.0370 🛑 Stop: $0.0315 Who’s watching Osmosis? Share your thoughts! 👇 #OSMO #Osmosis #CryptoSignal {spot}(OSMOUSDT) {future}(ATOMUSDT) {future}(KAVAUSDT)
$OSMO 📊 — DeFi on the radar!
💰 Current price: $0.0330 (-2.37% in 24h)
📊 Daily range:
🔺 High: $0.0339
🔻 Low: $0.0322
📦 Volume: 8.13M OSMO / $267K USDT
📈 Indicators:
· EMA(21): $0.0329 — price is slightly above, neutral
· EMA(50): $0.0329 — price is touching, possible support
· EMA(200): $0.0333 — price is below, resistance overhead
· Supertrend (10,3): $0.0325 — price is above, bullish signal ✅
· RSI(14): 52.49 — neutral, room for growth 📈
🧠 Thought:
OSMO is trading in a tight range, and Supertrend shows a bullish setup. RSI is in a healthy zone—there’s room to rise. If $0.0339 breaks, we expect a move toward $0.035+ . Volumes are stable.
🎯 Targets:
TP1: $0.0345
TP2: $0.0355
TP3: $0.0370
🛑 Stop: $0.0315

Who’s watching Osmosis? Share your thoughts! 👇

#OSMO #Osmosis #CryptoSignal
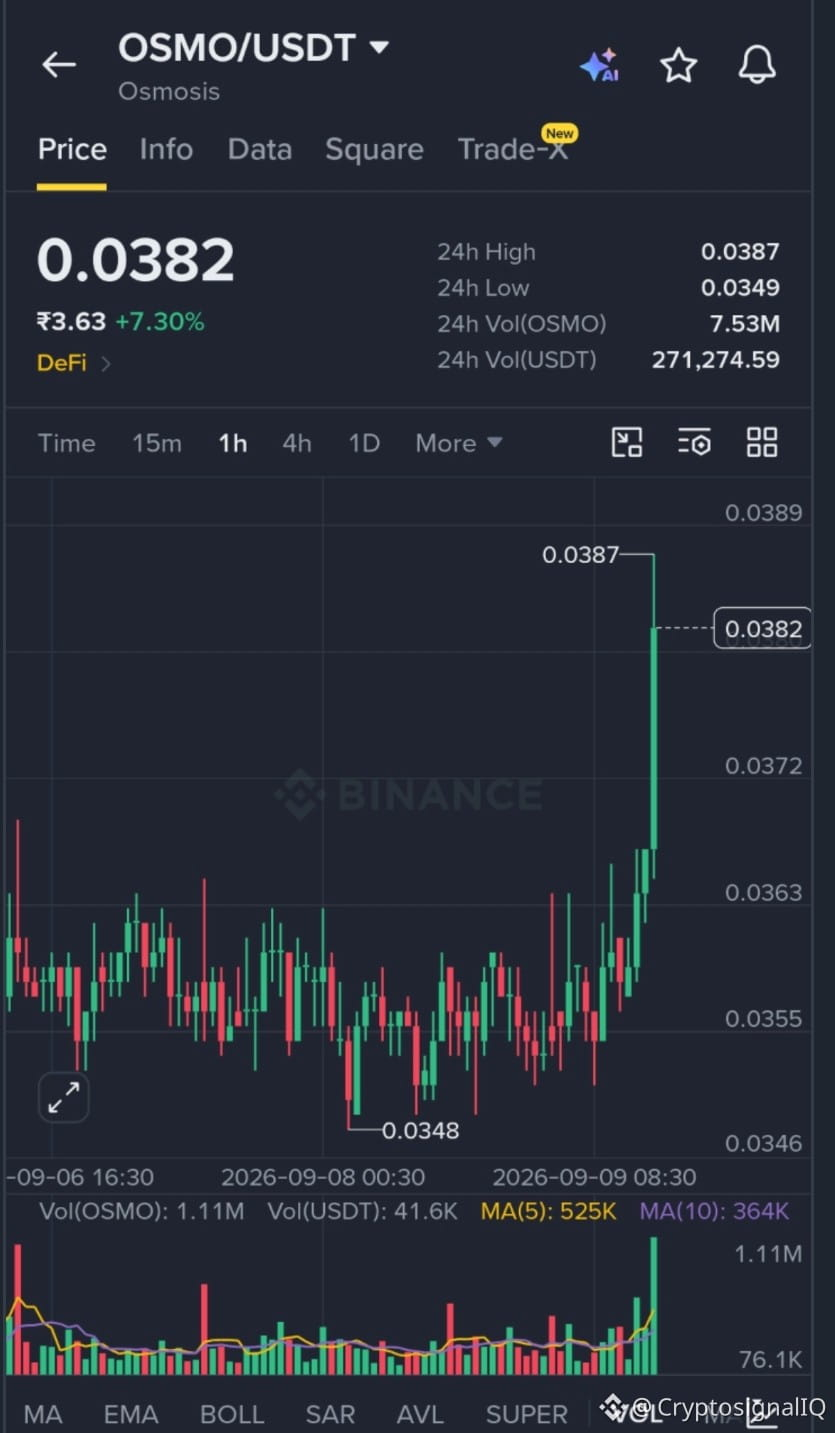
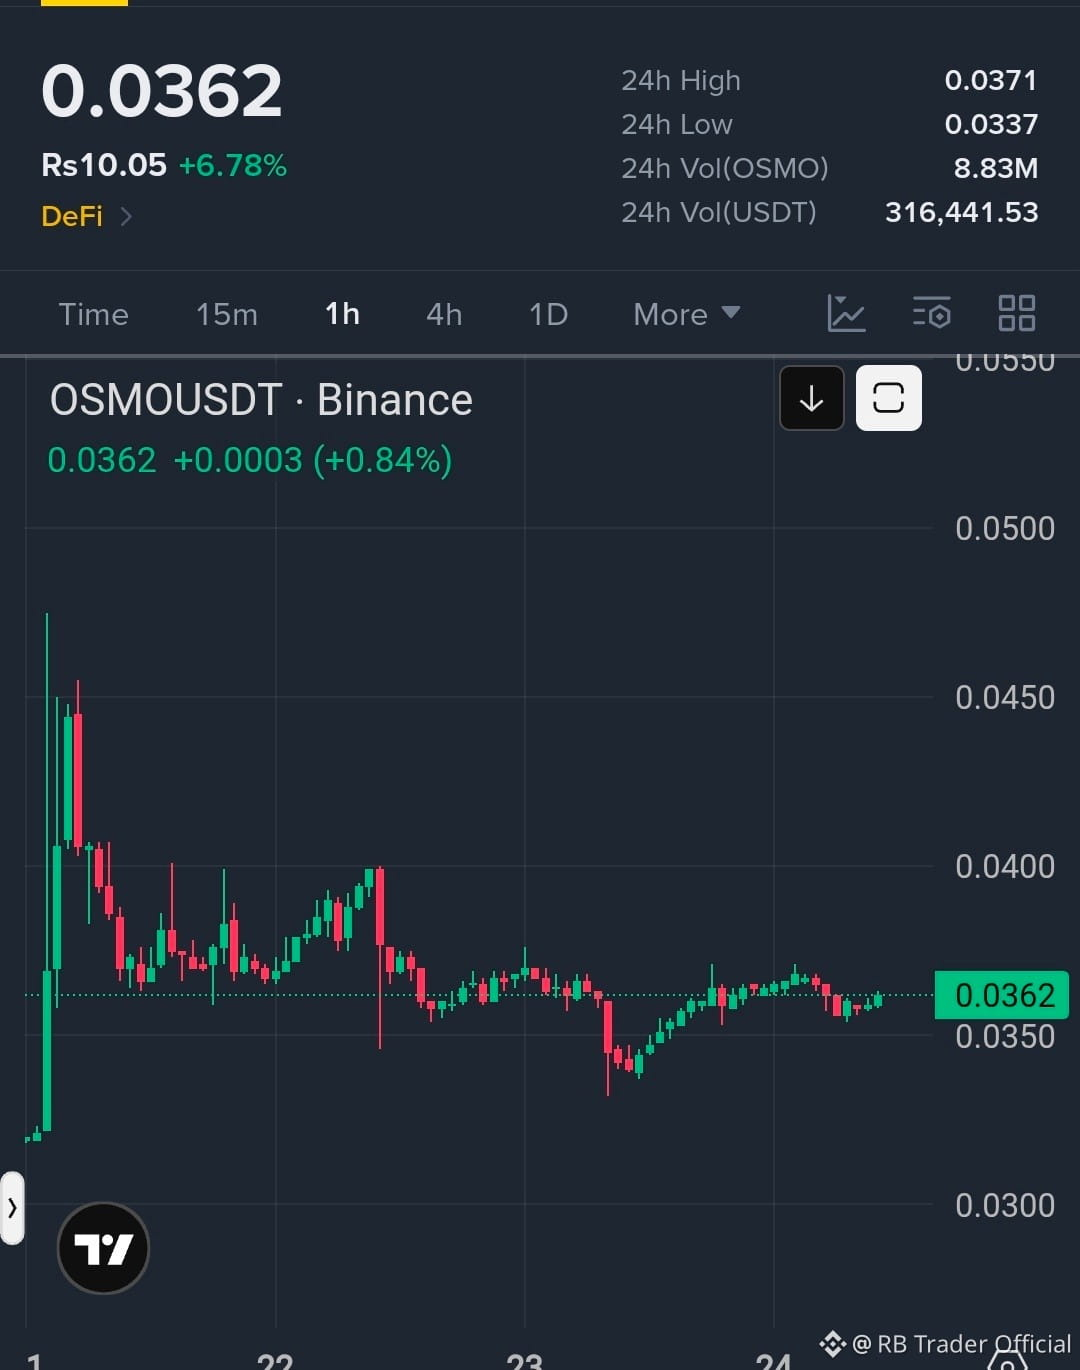
$OSMO $OSMO 30m | Chart Analysis - Bias leans bullish despite mixed momentum signals - Key support zone around 0.0351–0.0346 holding critical liquidity - +8% upside potential if price reclaims and holds above 0.037 - Watch for a volume spike or a sharp test of 0.0346 to trigger a move - The next move hinges on a setup forming just beyond these levels… 👇 Get the complete breakdown — entry, targets & invalidation: → tinyurl.com/FinoraBot #OSMO {future}(OSMOUSDT)
$OSMO
$OSMO 30m | Chart Analysis

- Bias leans bullish despite mixed momentum signals
- Key support zone around 0.0351–0.0346 holding critical liquidity
- +8% upside potential if price reclaims and holds above 0.037
- Watch for a volume spike or a sharp test of 0.0346 to trigger a move
- The next move hinges on a setup forming just beyond these levels…

👇 Get the complete breakdown — entry, targets & invalidation:
→ tinyurl.com/FinoraBot
#OSMO
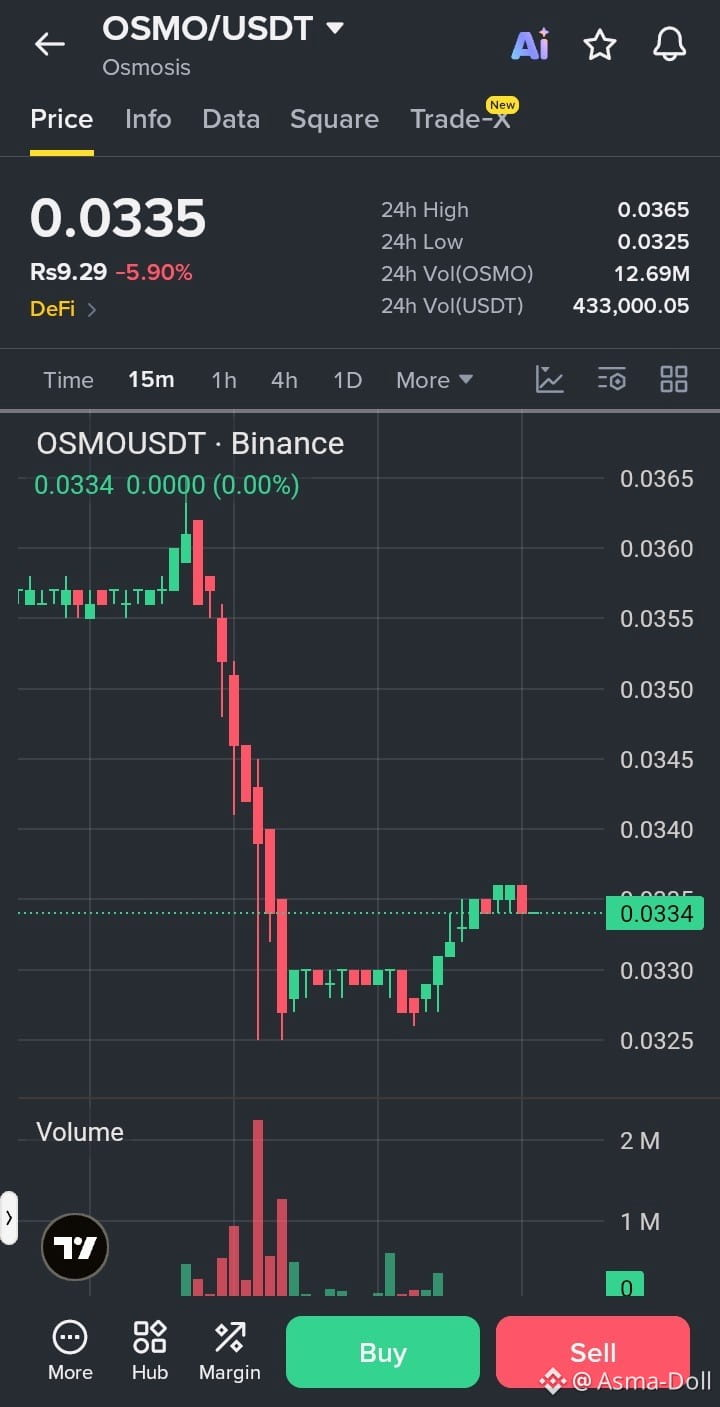
$OSMO IS BUILDING A BULLISH REVERSAL AFTER THE SELL-OFF 🔥 Entry: 0.0355 – 0.0360 🔥 Target 1: 0.0372 🚀 Target 2: 0.0388 🚀 Target 3: 0.0410 🚀 Stop Loss: 0.0343 ⚠️ OSMO just put in a higher low on the 15m chart after that sharp drop — exactly the kind of buyer absorption I look for before a reversal. Price is now reclaiming the recovery zone, and a clean push above 0.0360 should trigger stops and momentum toward the first target. Volume is picking up as we hold this area, and the recent structure shift tells me sellers are losing control. Are you catching this dip or waiting for more confirmation? Not financial advice. Always manage your risk. #OSMO #BullishReversal #LongSetup #Crypto 🔥
$OSMO IS BUILDING A BULLISH REVERSAL AFTER THE SELL-OFF 🔥

Entry: 0.0355 – 0.0360 🔥
Target 1: 0.0372 🚀
Target 2: 0.0388 🚀
Target 3: 0.0410 🚀
Stop Loss: 0.0343 ⚠️

OSMO just put in a higher low on the 15m chart after that sharp drop — exactly the kind of buyer absorption I look for before a reversal. Price is now reclaiming the recovery zone, and a clean push above 0.0360 should trigger stops and momentum toward the first target.

Volume is picking up as we hold this area, and the recent structure shift tells me sellers are losing control. Are you catching this dip or waiting for more confirmation?

Not financial advice. Always manage your risk.

#OSMO #BullishReversal #LongSetup #Crypto

🔥
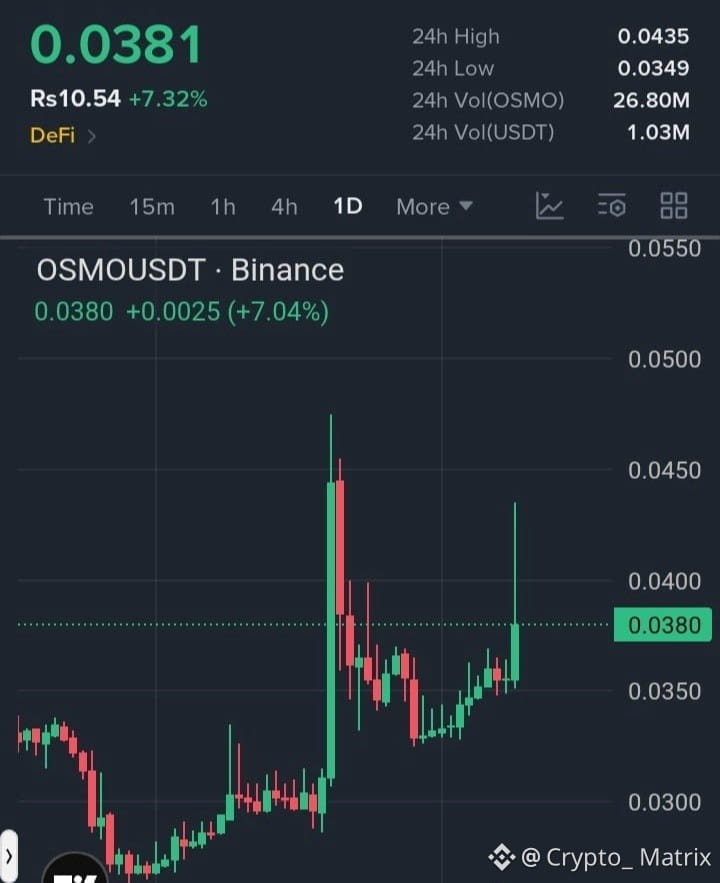
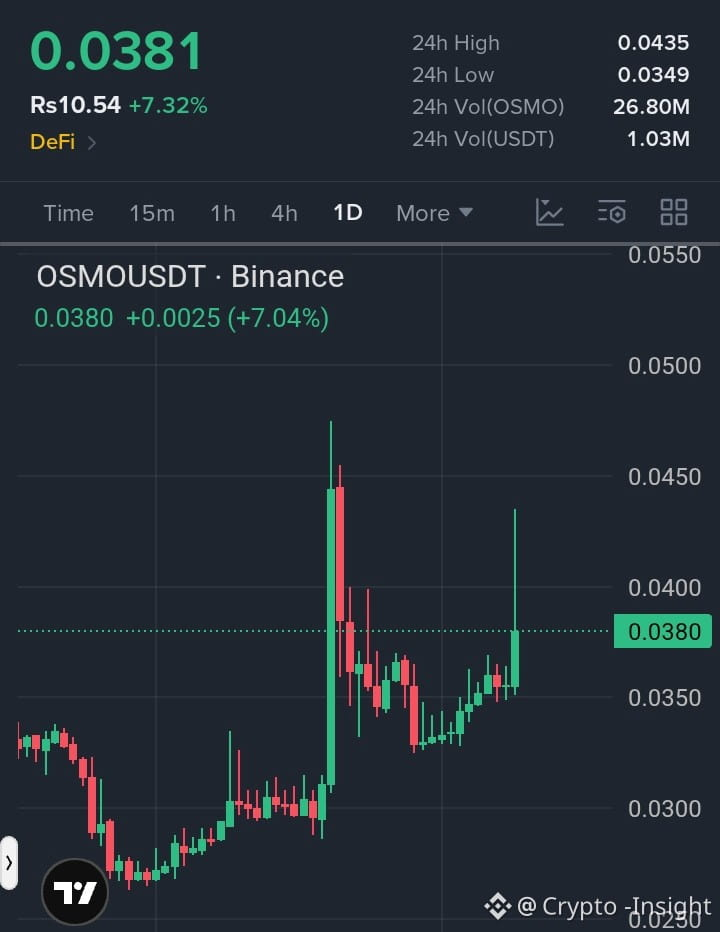
$OSMO 📉 Crash Alert: 5.1% Drop on $OSMO , dead cat bounce or reversal? - Given the aggressive dump and the lack of immediate structural support, I expect more downside is likely unless buyers can swiftly reclaim 0.0373 and hold above it. - If price consolidates under 0.0373, a short entry on a failed retest of 0.0373 or ideally 0.0380, with a target at 0.0342, is a logical play. Confirmation should come from a bearish candle pattern or rejection wick on the 15m or lower timeframes. - If, however, there’s a fast reclaim of 0.0373 with a bullish engulfing or high-volume reversal, price could quickly move to 0.0380 or even test 0.0385 — but watch for exhaustion signals or a liquidity sweep into these levels to reload shorts. - Stop-loss should be set above the recent swing high if shorting (e.g., above 0.0385–0.0390), or below the new low wick if longing a bounce. Always wait for a clear confirmation: pin bar, bullish engulfing for longs; shooting star, bearish engulfing, or lower high structure for shorts. - If price gets back above 0.0395 with strength, it would invalidate the short bias and signal a likely reversal to the upside. 📝 This is not investment advice, only an educational analysis. Right now, I’m leaning toward further downside as the most probable outcome unless you see a fast, high-volume reclaim of 0.0373. Always wait for confirmations and never enter blindly after a sharp move like this! 🚦 📊 Get detailed free analysis of any coin on any timeframe you want. Try Finora AI - Your Trade Buddy for free → tinyurl.com/FinoraBot #OSMO {future}(OSMOUSDT)
$OSMO
📉 Crash Alert: 5.1% Drop on $OSMO , dead cat bounce or reversal?

- Given the aggressive dump and the lack of immediate structural support, I expect more downside is likely unless buyers can swiftly reclaim 0.0373 and hold above it.
- If price consolidates under 0.0373, a short entry on a failed retest of 0.0373 or ideally 0.0380, with a target at 0.0342, is a logical play. Confirmation should come from a bearish candle pattern or rejection wick on the 15m or lower timeframes.
- If, however, there’s a fast reclaim of 0.0373 with a bullish engulfing or high-volume reversal, price could quickly move to 0.0380 or even test 0.0385 — but watch for exhaustion signals or a liquidity sweep into these levels to reload shorts.
- Stop-loss should be set above the recent swing high if shorting (e.g., above 0.0385–0.0390), or below the new low wick if longing a bounce. Always wait for a clear confirmation: pin bar, bullish engulfing for longs; shooting star, bearish engulfing, or lower high structure for shorts.
- If price gets back above 0.0395 with strength, it would invalidate the short bias and signal a likely reversal to the upside.

📝 This is not investment advice, only an educational analysis. Right now, I’m leaning toward further downside as the most probable outcome unless you see a fast, high-volume reclaim of 0.0373. Always wait for confirmations and never enter blindly after a sharp move like this! 🚦

📊 Get detailed free analysis of any coin on any timeframe you want. Try Finora AI - Your Trade Buddy for free → tinyurl.com/FinoraBot
#OSMO
·
--
Bearish
Some people chase the newest trend every week. Others spend time understanding the ecosystems that continue growing regardless of market noise. Osmosis has built a reputation around community participation and DeFi innovation. Markets move up and down, but active ecosystems tend to attract attention over the long run. Strong communities often become the foundation of sustainable growth. #osmo #defi #CryptoCommunity #Web3 #Blockchain $OSMO {spot}(OSMOUSDT)
Some people chase the newest trend every week.

Others spend time understanding the ecosystems that continue growing regardless of market noise.
Osmosis has built a reputation around community participation and DeFi innovation.
Markets move up and down, but active ecosystems tend to attract attention over the long run.

Strong communities often become the foundation of sustainable growth.

#osmo #defi #CryptoCommunity #Web3 #Blockchain $OSMO
$OSMO looked dead after the grind down to 0.0433, but that low ended up becoming the turning point. Buyers stepped in aggressively, sending price straight to 0.0550 before profit-taking kicked in. What's important is that the pullback held well above the lows and buyers are already trying to reclaim momentum. Entry: 0.0475 - 0.0485 TP1: 0.0550 TP2: 0.0600 TP3: 0.0650 SL: 0.0450 The key level is 0.0550. That's the recent spike high and current breakout trigger. Price is now consolidating after a sharp impulse move rather than fully retracing it, which usually signals accumulation rather than distribution. If bulls can reclaim 0.0550, this recovery structure could extend much higher. 👀📈 Trade #osmo here {spot}(OSMOUSDT) $RE $O
$OSMO looked dead after the grind down to 0.0433, but that low ended up becoming the turning point. Buyers stepped in aggressively, sending price straight to 0.0550 before profit-taking kicked in. What's important is that the pullback held well above the lows and buyers are already trying to reclaim momentum.

Entry: 0.0475 - 0.0485

TP1: 0.0550
TP2: 0.0600
TP3: 0.0650

SL: 0.0450

The key level is 0.0550. That's the recent spike high and current breakout trigger. Price is now consolidating after a sharp impulse move rather than fully retracing it, which usually signals accumulation rather than distribution. If bulls can reclaim 0.0550, this recovery structure could extend much higher. 👀📈
Trade #osmo here
$RE $O
·
--
Bullish
$OSMO /USDT is currently showing a short-term pullback after testing the recent high near 0.0550, with price now holding around 0.0465. The structure still looks like a volatile DeFi rotation phase where liquidity is swinging between support and resistance zones. Volume remains decent at 45M+ in 24h, which suggests active participation, but momentum has cooled slightly after the recent push. The key now is whether buyers defend the 0.045–0.046 zone to avoid a deeper retracement toward the previous base. $OSMOUSDT is trading near 0.0465 with corrective pressure after rejection from the {spot}(OSMOUSDT) upper range. Target 1: 0.0500 Target 2: 0.0535 Target 3: 0.0580 #OSMO #DeFi #OSMOUSDT
$OSMO /USDT is currently showing a short-term pullback after testing the recent high near 0.0550, with price now holding around 0.0465. The structure still looks like a volatile DeFi rotation phase where liquidity is swinging between support and resistance zones. Volume remains decent at 45M+ in 24h, which suggests active participation, but momentum has cooled slightly after the recent push. The key now is whether buyers defend the 0.045–0.046 zone to avoid a deeper retracement toward the previous base.

$OSMOUSDT is trading near 0.0465 with corrective pressure after rejection from the
upper range.

Target 1: 0.0500
Target 2: 0.0535
Target 3: 0.0580

#OSMO #DeFi #OSMOUSDT
$OSMO Bounce off the .0433 low with conviction. Now trading at .0507, sitting tight under the 4h MA25. Trend: Consolidation after the 14% rip from the lows. Momentum is bullish but cooling—needs to clear .055 for continuation. Tight chop between .0462 support and .055 resistance. Breakout risk to the upside as long as .0462 holds. • Entry Zone: .0505 - .0520 • TP1: .0550 • TP2: .0600 • TP3: .0650 • Stop-Loss: .0455 Structure is clean. Above the 99MA, volatility compression. If .055 flips, the ask gets thin. #osmo #WriteToEarnUpgrade
$OSMO

Bounce off the .0433 low with conviction. Now trading at .0507, sitting tight under the 4h MA25.

Trend: Consolidation after the 14% rip from the lows. Momentum is bullish but cooling—needs to clear .055 for continuation. Tight chop between .0462 support and .055 resistance. Breakout risk to the upside as long as .0462 holds.

• Entry Zone: .0505 - .0520
• TP1: .0550
• TP2: .0600
• TP3: .0650
• Stop-Loss: .0455

Structure is clean. Above the 99MA, volatility compression. If .055 flips, the ask gets thin.

#osmo #WriteToEarnUpgrade
$OSMO Breakout Momentum Building 🚀 $OSMO has delivered a clean breakout from accumulation and buyers are aggressively pushing higher. As long as momentum holds above the breakout zone, continuation toward higher levels remains likely. TP1: 0.0545 TP2: 0.0580 TP3: 0.0620 #OSMO #DeFi #Crypto #BinanceSquare 🔥
$OSMO Breakout Momentum Building 🚀

$OSMO has delivered a clean breakout from accumulation and buyers are aggressively pushing higher. As long as momentum holds above the breakout zone, continuation toward higher levels remains likely.

TP1: 0.0545
TP2: 0.0580
TP3: 0.0620

#OSMO #DeFi #Crypto #BinanceSquare 🔥
$OSMO is showing strong bullish momentum after gaining more than 18% in the last 24 hours. The price reached a high of $0.0550 while maintaining solid trading volume, reflecting increased interest from traders. With DeFi-related assets attracting attention and buyers holding key support levels, $OSMO has the potential to continue its upward trend toward the next resistance zones. Target 1: $0.0565 Target 2: $0.0600 Target 3: $0.0650 #OSMO #USDT #DEFI
$OSMO is showing strong bullish momentum after gaining more than 18% in the last 24 hours. The price reached a high of $0.0550 while maintaining solid trading volume, reflecting increased interest from traders. With DeFi-related assets attracting attention and buyers holding key support levels, $OSMO has the potential to continue its upward trend toward the next resistance zones.

Target 1: $0.0565
Target 2: $0.0600
Target 3: $0.0650

#OSMO #USDT #DEFI
·
--
Bullish
$OSMO {spot}(OSMOUSDT) USDT BULLISH CONTINUATION SETUP Market structure shows strong bullish momentum after a sharp upside move with price holding above key intraday support zones. Positive MACD momentum supports continuation, while price is consolidating just below resistance near the recent high area, indicating a potential breakout setup. Long Entry: 0.0510 – 0.0522 (accumulation zone) OR breakout entry above 0.0532 on strong volume confirmation Targets (TP): TP1: 0.0537 TP2: 0.0565 TP3: 0.0600 Stop Loss (SL): 0.0472 (below structural support) Risk Management: Risk only 1–2% per trade, secure partial profits at TP1 and move SL to breakeven after confirmation of breakout follow-through. #OSMO #TechnicalAnalysis #CryptoTrading #DeFi #Altcoins
$OSMO
USDT BULLISH CONTINUATION SETUP

Market structure shows strong bullish momentum after a sharp upside move with price holding above key intraday support zones. Positive MACD momentum supports continuation, while price is consolidating just below resistance near the recent high area, indicating a potential breakout setup.

Long Entry: 0.0510 – 0.0522 (accumulation zone) OR breakout entry above 0.0532 on strong volume confirmation

Targets (TP): TP1: 0.0537
TP2: 0.0565
TP3: 0.0600

Stop Loss (SL): 0.0472 (below structural support)

Risk Management: Risk only 1–2% per trade, secure partial profits at TP1 and move SL to breakeven after confirmation of breakout follow-through.

#OSMO #TechnicalAnalysis #CryptoTrading #DeFi #Altcoins
$OSMO usdt breakout momentum ignites 🚀 Entry: 0.0462 - 0.0468 Target: 0.0480 Target: 0.0495 Target: 0.0510 Stop Loss: 0.0450 A strong bullish engulfing candle on the 1H timeframe signals aggressive buyer participation, with price reclaiming short-term resistance and pushing toward the recent high. Volume-backed momentum suggests continuation toward higher targets as long as the breakout zone holds as support. Not financial advice. Manage your risk. #OSMO #LongSetup #BreakoutTrading ⚡️
$OSMO usdt breakout momentum ignites 🚀
Entry: 0.0462 - 0.0468
Target: 0.0480
Target: 0.0495
Target: 0.0510
Stop Loss: 0.0450

A strong bullish engulfing candle on the 1H timeframe signals aggressive buyer participation, with price reclaiming short-term resistance and pushing toward the recent high. Volume-backed momentum suggests continuation toward higher targets as long as the breakout zone holds as support.

Not financial advice. Manage your risk.
#OSMO #LongSetup #BreakoutTrading

⚡️
OSMO Don't rush in just yet: Excitement is fine, but the real focus is whether there's someone ready to catch the dip. 5m +5.17%, current price 0.0512, 24h volume 1.3438 million, VWAP above 0.047281, MACD 0.000203. The next candle only depends on one thing: Is there anyone ready to buy the dip? #OSMO #Alert
OSMO Don't rush in just yet: Excitement is fine, but the real focus is whether there's someone ready to catch the dip. 5m +5.17%, current price 0.0512, 24h volume 1.3438 million, VWAP above 0.047281, MACD 0.000203.

The next candle only depends on one thing: Is there anyone ready to buy the dip?

#OSMO #Alert
Article
$OSMO/USDT: The Breakout Opportunity Most Traders Are Still Ignoring🚀 $OSMO/USDT: Early Breakout Signal or Just Another Dead Cat Bounce? Current Price: 0.0400 USDT 📈 24H Change: +14.61% 📊 Daily Range: 0.0349 – 0.0468 USDT 💰 24H Volume: 35.25M+ OSMO While most traders are chasing the hottest narratives, OSMO is quietly building one of the most interesting risk-to-reward setups on the market. After a strong 14%+ daily move, many traders are asking the same question: Is this the beginning of a trend reversal or simply a temporary relief rally? Market Structure Analysis The recent surge from the 0.035 area confirms that buyers are actively defending support levels. More importantly, volume expansion accompanied the move, suggesting that this isn't purely speculative noise. The market is now approaching a critical decision zone where the next major trend direction could be determined. Key Trading Zones 🟢 Primary Entry Zone 0.0380 – 0.0395 USDT 🟢 Accumulation Zone 0.0360 – 0.0375 USDT 🟢 Aggressive Entry Zone 0.0345 – 0.0355 USDT Professional traders don't chase pumps. They buy support and sell strength. Profit Targets 🎯 Target 1: 0.0470 USDT 🎯 Target 2: 0.0520 USDT 🎯 Target 3: 0.0600 USDT 🎯 Target 4: 0.0700 USDT A confirmed breakout above 0.0470 USDT could attract fresh momentum buyers and accelerate the move. Risk Management 🔴 Invalidation Level: 0.0340 USDT A daily close below this level would weaken the bullish structure and increase downside risk. Trading Strategy ✅ Already holding OSMO? Consider securing partial profits near resistance while keeping a portion of the position open for potential continuation. ✅ Looking for a new entry? Waiting for pullbacks into support zones may offer a significantly better risk-to-reward profile than buying directly into resistance. Final Verdict OSMO is showing signs of renewed strength after an extended period of weakness. Price action, volume, and momentum currently favor buyers. However, the most important battle remains ahead. If bulls successfully reclaim and hold above 0.0470 USDT, the probability of a larger recovery wave increases substantially. 📊 My view: Bullish above support, cautious near resistance. What's your target for OSMO during this cycle? 🚀 0.05 USDT? 🚀 0.07 USDT? 🚀 Higher? Share your thoughts below 👇 {spot}(OSMOUSDT) #osmo #OSMOSIS #USDT #CryptoForgeAlpha #BinanceSquare $OSMO $FIDA $BTC {spot}(FIDAUSDT) {spot}(BTCUSDT)

$OSMO/USDT: The Breakout Opportunity Most Traders Are Still Ignoring

🚀 $OSMO /USDT: Early Breakout Signal or Just Another Dead Cat Bounce?
Current Price: 0.0400 USDT 📈 24H Change: +14.61% 📊 Daily Range: 0.0349 – 0.0468 USDT 💰 24H Volume: 35.25M+ OSMO
While most traders are chasing the hottest narratives, OSMO is quietly building one of the most interesting risk-to-reward setups on the market.
After a strong 14%+ daily move, many traders are asking the same question:
Is this the beginning of a trend reversal or simply a temporary relief rally?
Market Structure Analysis
The recent surge from the 0.035 area confirms that buyers are actively defending support levels.
More importantly, volume expansion accompanied the move, suggesting that this isn't purely speculative noise.
The market is now approaching a critical decision zone where the next major trend direction could be determined.
Key Trading Zones
🟢 Primary Entry Zone 0.0380 – 0.0395 USDT
🟢 Accumulation Zone 0.0360 – 0.0375 USDT
🟢 Aggressive Entry Zone 0.0345 – 0.0355 USDT
Professional traders don't chase pumps. They buy support and sell strength.
Profit Targets
🎯 Target 1: 0.0470 USDT
🎯 Target 2: 0.0520 USDT
🎯 Target 3: 0.0600 USDT
🎯 Target 4: 0.0700 USDT
A confirmed breakout above 0.0470 USDT could attract fresh momentum buyers and accelerate the move.
Risk Management
🔴 Invalidation Level: 0.0340 USDT
A daily close below this level would weaken the bullish structure and increase downside risk.
Trading Strategy
✅ Already holding OSMO?
Consider securing partial profits near resistance while keeping a portion of the position open for potential continuation.
✅ Looking for a new entry?
Waiting for pullbacks into support zones may offer a significantly better risk-to-reward profile than buying directly into resistance.
Final Verdict
OSMO is showing signs of renewed strength after an extended period of weakness. Price action, volume, and momentum currently favor buyers.
However, the most important battle remains ahead.
If bulls successfully reclaim and hold above 0.0470 USDT, the probability of a larger recovery wave increases substantially.
📊 My view: Bullish above support, cautious near resistance.
What's your target for OSMO during this cycle?
🚀 0.05 USDT? 🚀 0.07 USDT? 🚀 Higher?
Share your thoughts below 👇
#osmo #OSMOSIS #USDT #CryptoForgeAlpha #BinanceSquare $OSMO $FIDA $BTC
Article
$OSMO Anomalous surge of +32% — Is this just the beginning or a trap for long traders?While macro attention is focused on Bitcoin, the main liquidity hub of the Cosmos ecosystem ($OSMO) suddenly revved up, showing a +32.38% gain in a day. Abnormal volumes indicate this isn't just a retail pump. A cold engineering breakdown of the metrics from CryptoForge Alpha. 👇 1️⃣ Technical Analysis (1D / 4H) Currently, $OSMO is trading at $0.0695, having aggressively bounced off the daily low of $0.0516.

$OSMO Anomalous surge of +32% — Is this just the beginning or a trap for long traders?

While macro attention is focused on Bitcoin, the main liquidity hub of the Cosmos ecosystem ($OSMO ) suddenly revved up, showing a +32.38% gain in a day. Abnormal volumes indicate this isn't just a retail pump. A cold engineering breakdown of the metrics from CryptoForge Alpha. 👇
1️⃣ Technical Analysis (1D / 4H)
Currently, $OSMO is trading at $0.0695, having aggressively bounced off the daily low of $0.0516.
Article
$OSMO (Osmosis): Accumulation of Big Capital or Calm Before the Storm? Exclusive AnalysisOSMO/USDT: the momentum is there, but right now the market rewards only discipline 📈 OSMO has shown a strong short-term move: +9.98% in 24 hours, price skyrocketed to 0.0485 USDT, and the daily range of 0.0423 → 0.0572 along with a volume of 49.8M indicates that liquidity has already flowed into the coin. But after such a move, the worst decision is to buy just because it's 'already pumping.'

$OSMO (Osmosis): Accumulation of Big Capital or Calm Before the Storm? Exclusive Analysis

OSMO/USDT: the momentum is there, but right now the market rewards only discipline 📈
OSMO has shown a strong short-term move: +9.98% in 24 hours, price skyrocketed to 0.0485 USDT, and the daily range of 0.0423 → 0.0572 along with a volume of 49.8M indicates that liquidity has already flowed into the coin.
But after such a move, the worst decision is to buy just because it's 'already pumping.'
Article
$OSMO/USDT: we’ve got a bounce but the market is already near the decision zoneRELOADING COSMOS ECOSYSTEM: WHO'S SECRETLY SCOOPING UP OSMO ON THE SAME DAY? 🚀🧪 📊 CURRENT METRICS (The numbers game at this moment): ▸ Current Price: $0.0485 (≈ ₴2.15) ▸ Daily Gain: +9.98% 📈 ▸ 24h High: $0.0572 ▸ 24h Low: $0.0423 ▸ Daily Trading Volume: 49,801,432 OSMO (That's over $2.41 million USDT liquidity for the current market cap of the coin)

$OSMO/USDT: we’ve got a bounce but the market is already near the decision zone

RELOADING COSMOS ECOSYSTEM: WHO'S SECRETLY SCOOPING UP OSMO ON THE SAME DAY? 🚀🧪
📊 CURRENT METRICS (The numbers game at this moment):
▸ Current Price: $0.0485 (≈ ₴2.15)
▸ Daily Gain: +9.98% 📈
▸ 24h High: $0.0572
▸ 24h Low: $0.0423
▸ Daily Trading Volume: 49,801,432 OSMO (That's over $2.41 million USDT liquidity for the current market cap of the coin)
Article
$OSMO One of the Strongest Breakout Setups on Binance Right Now🚀 OSMO/USDT: The Breakout Nobody Expected Is Now Impossible to Ignore Current Price: 0.0498 USDT 📈 Strong bullish momentum 🔥 Buyers are reclaiming key market structure levels 💰 Growing attention from momentum traders While most traders are still focused on the largest-cap assets, OSMO is quietly becoming one of the strongest-performing charts on the board. After a powerful rally from recent lows, the market is approaching a critical decision point that could determine the next major move. The question isn't whether OSMO has already moved. The question is whether the real breakout is still ahead. Market Structure Analysis OSMO has successfully broken out from its previous consolidation range and is now testing an important resistance area. What makes this move interesting is the combination of increasing momentum and improving buyer participation. As long as key support levels continue to hold, bulls remain in control of the short-term trend. However, experienced traders know that the best opportunities usually come from patience rather than chasing green candles. Key Trading Zones 🟢 Primary Entry Zone 0.0460 – 0.0480 USDT 🟢 Accumulation Zone 0.0420 – 0.0450 USDT 🟢 High-Conviction Support 0.0380 – 0.0410 USDT The market rewards discipline, not emotions. Bullish Targets 🎯 Target 1: 0.0550 USDT 🎯 Target 2: 0.0620 USDT 🎯 Target 3: 0.0700 USDT 🎯 Target 4: 0.0850 USDT A confirmed breakout above resistance could trigger a new wave of momentum buying. Risk Management 🔴 Invalidation Level: 0.0380 USDT A daily close below this level would weaken the current bullish structure and increase downside risk. Trading Strategy ✅ Already holding OSMO? Consider scaling out partial profits into strength while allowing a portion of the position to run toward higher targets. ✅ Looking for a new entry? Waiting for healthy pullbacks into support zones often provides a significantly better risk-to-reward profile. Final Verdict OSMO is showing one of the strongest technical recoveries among mid-cap altcoins right now. Price action, momentum, and market participation continue to favor buyers. But remember: The goal is not to predict every move. The goal is to manage risk while positioning for high-probability opportunities. 📊 My bias remains bullish while support levels hold. What comes next for OSMO? 🚀 0.055 first? 🚀 0.07 next? 💎 Or even higher this cycle? Share your target below 👇 {spot}(OSMOUSDT) #osmo #OSMOSIS #USDT #crypto #CryptoForgeAlpha $FIDA $EDEN {spot}(FIDAUSDT) {spot}(EDENUSDT)

$OSMO One of the Strongest Breakout Setups on Binance Right Now

🚀 OSMO/USDT: The Breakout Nobody Expected Is Now Impossible to Ignore
Current Price: 0.0498 USDT 📈 Strong bullish momentum 🔥 Buyers are reclaiming key market structure levels 💰 Growing attention from momentum traders
While most traders are still focused on the largest-cap assets, OSMO is quietly becoming one of the strongest-performing charts on the board.
After a powerful rally from recent lows, the market is approaching a critical decision point that could determine the next major move.
The question isn't whether OSMO has already moved.
The question is whether the real breakout is still ahead.
Market Structure Analysis
OSMO has successfully broken out from its previous consolidation range and is now testing an important resistance area.
What makes this move interesting is the combination of increasing momentum and improving buyer participation.
As long as key support levels continue to hold, bulls remain in control of the short-term trend.
However, experienced traders know that the best opportunities usually come from patience rather than chasing green candles.
Key Trading Zones
🟢 Primary Entry Zone 0.0460 – 0.0480 USDT
🟢 Accumulation Zone 0.0420 – 0.0450 USDT
🟢 High-Conviction Support 0.0380 – 0.0410 USDT
The market rewards discipline, not emotions.
Bullish Targets
🎯 Target 1: 0.0550 USDT
🎯 Target 2: 0.0620 USDT
🎯 Target 3: 0.0700 USDT
🎯 Target 4: 0.0850 USDT
A confirmed breakout above resistance could trigger a new wave of momentum buying.
Risk Management
🔴 Invalidation Level: 0.0380 USDT
A daily close below this level would weaken the current bullish structure and increase downside risk.
Trading Strategy
✅ Already holding OSMO?
Consider scaling out partial profits into strength while allowing a portion of the position to run toward higher targets.
✅ Looking for a new entry?
Waiting for healthy pullbacks into support zones often provides a significantly better risk-to-reward profile.
Final Verdict
OSMO is showing one of the strongest technical recoveries among mid-cap altcoins right now.
Price action, momentum, and market participation continue to favor buyers.
But remember:
The goal is not to predict every move.
The goal is to manage risk while positioning for high-probability opportunities.
📊 My bias remains bullish while support levels hold.
What comes next for OSMO?
🚀 0.055 first? 🚀 0.07 next? 💎 Or even higher this cycle?
Share your target below 👇
#osmo #OSMOSIS #USDT #crypto #CryptoForgeAlpha $FIDA $EDEN
·
--
$OSMO is holding a live support area, and buyers still have a reason to defend it here. $OSMO – Momentum remains strong, and price is holding above the local range with buyers still active. Trading Plan LONG $OSMO (max 10x) 🎯 Entry: 0.06822 - 0.07076 🛑 SL: 0.05649 ✅ TP1: 0.07431 ✅ TP2: 0.07787 ✅ TP3: 0.08193 • Live range structure is still clean enough to plan around • Confirmation matters more than chasing this move Would you take the long on $OSMO only after confirmation, or start scaling near support? Trade $OSMO here 👇 #OSMO #PriceAction
$OSMO is holding a live support area, and buyers still have a reason to defend it here.

$OSMO – Momentum remains strong, and price is holding above the local range with buyers still active.

Trading Plan LONG $OSMO (max 10x)

🎯 Entry: 0.06822 - 0.07076
🛑 SL: 0.05649
✅ TP1: 0.07431
✅ TP2: 0.07787
✅ TP3: 0.08193

• Live range structure is still clean enough to plan around
• Confirmation matters more than chasing this move

Would you take the long on $OSMO only after confirmation, or start scaling near support?

Trade $OSMO here 👇

#OSMO #PriceAction
🚨 Warning: $OSMO is about to explode 🚀. A "hidden" buying frenzy is brewing. Full setup below 👇 Price looks bullish, but internal data reveals a secret strength: the 24h change of +25.62% is not just a coincidence. The market is over-leveraged, with longs paying a premium. Smart money is entering, and liquidity is increasing. The window for this trade is closing fast. Entry: $0.065 | SL: $0.061 | TP1: $0.072 | Leverage: 10x Cross I'm trading this setup. R:R is too good to ignore. Daily free signals for followers. Save this post before it's gone. If you don't follow, you'll wonder 'what if' in 48h. LONG or SHORT $OSMO here? Comment below! 👇 ⚠️ Not financial advice. DYOR. #OSMO #Crypto #BinanceSquare
🚨 Warning: $OSMO is about to explode 🚀. A "hidden" buying frenzy is brewing. Full setup below 👇

Price looks bullish, but internal data reveals a secret strength: the 24h change of +25.62% is not just a coincidence. The market is over-leveraged, with longs paying a premium. Smart money is entering, and liquidity is increasing.

The window for this trade is closing fast.
Entry: $0.065 | SL: $0.061 | TP1: $0.072 | Leverage: 10x Cross

I'm trading this setup. R:R is too good to ignore.
Daily free signals for followers. Save this post before it's gone. If you don't follow, you'll wonder 'what if' in 48h. LONG or SHORT $OSMO here? Comment below! 👇
⚠️ Not financial advice. DYOR. #OSMO #Crypto #BinanceSquare
Log in to explore more content
Join global crypto users on Binance Square
⚡️ Get latest and useful information about crypto.
💬 Trusted by the world’s largest crypto exchange.
👍 Discover real insights from verified creators.
Email / Phone number