

#nasdaqdowweeklygapwidestsincejuly2002
nasdaqdowweeklygapwidestsincejuly2002
Hot
Latest

🌪️ A 2002-LEVEL MARKET GAP — SHOULD CRYPTO TRADERS PAY ATTENTION?
Wall Street just recorded its widest weekly Nasdaq–Dow performance gap since July 2002. 📉
When tech stocks weaken, crypto sentiment can also come under pressure — especially during periods of reduced risk appetite.
But this signal alone does not confirm a crypto crash.
📌 Watch $BTC support, selling volume, and broader market sentiment.
#nasdaqdowweeklygapwidestsincejuly2002
🌪️ A 2002-LEVEL MARKET GAP — SHOULD CRYPTO TRADERS PAY ATTENTION?
Wall Street just recorded its widest weekly Nasdaq–Dow performance gap since July 2002. 📉
When tech stocks weaken, crypto sentiment can also come under pressure — especially during periods of reduced risk appetite.
But this signal alone does not confirm a crypto crash.
📌 Watch $BTC support, selling volume, and broader market sentiment.
#nasdaqdowweeklygapwidestsincejuly2002
Wall Street just recorded its widest weekly Nasdaq–Dow performance gap since July 2002. 📉
When tech stocks weaken, crypto sentiment can also come under pressure — especially during periods of reduced risk appetite.
But this signal alone does not confirm a crypto crash.
📌 Watch $BTC support, selling volume, and broader market sentiment.
#nasdaqdowweeklygapwidestsincejuly2002
129

·
--
#nasdaqdowweeklygapwidestsincejuly2002 #BTC #NASDAQ
📉 Nasdaq: −4.48% | Dow Jones: +0.68%
The widest weekly gap since July 2002! 📊
🔍 What's happening? AI spending concerns and high valuations are pressuring tech stocks, while the Dow remains resilient.
₿ Why crypto traders should care: Bitcoin can follow tech during risk-off periods. Watch key support, resistance, and market liquidity.
⚠️ My take: A warning signal, not a confirmed crash. One week doesn't define the trend.
💬 Is this a healthy AI market correction or the beginning of a broader sell-off? 👇 "CLICK ON THE BELOW YELLOW COIN TAG TO GO TO DESIRED TRADING PAGE TO GET BENEFIT TRADE"$BTC $STRK
{spot}(STRKUSDT)
{spot}(BTCUSDT)
#nasdaqdowweeklygapwidestsincejuly2002 #BTC #NASDAQ
📉 Nasdaq: −4.48% | Dow Jones: +0.68%
The widest weekly gap since July 2002! 📊
🔍 What's happening? AI spending concerns and high valuations are pressuring tech stocks, while the Dow remains resilient.
₿ Why crypto traders should care: Bitcoin can follow tech during risk-off periods. Watch key support, resistance, and market liquidity.
⚠️ My take: A warning signal, not a confirmed crash. One week doesn't define the trend.
💬 Is this a healthy AI market correction or the beginning of a broader sell-off? 👇 "CLICK ON THE BELOW YELLOW COIN TAG TO GO TO DESIRED TRADING PAGE TO GET BENEFIT TRADE"$BTC $STRK
📉 Nasdaq: −4.48% | Dow Jones: +0.68%
The widest weekly gap since July 2002! 📊
🔍 What's happening? AI spending concerns and high valuations are pressuring tech stocks, while the Dow remains resilient.
₿ Why crypto traders should care: Bitcoin can follow tech during risk-off periods. Watch key support, resistance, and market liquidity.
⚠️ My take: A warning signal, not a confirmed crash. One week doesn't define the trend.
💬 Is this a healthy AI market correction or the beginning of a broader sell-off? 👇 "CLICK ON THE BELOW YELLOW COIN TAG TO GO TO DESIRED TRADING PAGE TO GET BENEFIT TRADE"$BTC $STRK
ABO3ZAM:
تحليل منطقي، الفجوة في الشارت تخوف فعلاً. برايك البيتكوين بيقدر يصمد فوق الدعم الحالي ولا نشوف كسر يجرنا لمستويات أقل قبل الإغلاق الأسبوعي؟ 🎯
1
3k

·
--
#NasdaqDowWeeklyGapWidestSinceJuly2002
😨 Wall Street Hits Extreme Fear. Crypto Sentiment Stays Neutral.
📊 Week to Oct 16: Dow +0.7%, Nasdaq -4.5%, the widest weekly gap since July 2002
📉 Chip index -11.4% in 8 straight down days, worst week since April 2025
⚖️ Narrow selloff: the equal-weight S&P 500 ETF still ended the week up
😨 CNN Fear & Greed Index: 18 (Extreme Fear), down from 47 a week earlier
🟡 Crypto Fear & Greed Index: 53 (Neutral)
🟠 $BTC slipped about 2.6% Monday to Friday on Binance, less than the Nasdaq, and trades near $82K
What it means for crypto: Bitcoin has held up better than tech so far, but crypto has often moved with tech stocks, so a deeper Nasdaq slide is still a risk. This week's big-tech earnings could decide whether the gap closes.
Is crypto decoupling from tech, or just lagging? 👇
$BTC $ETH
#NasdaqDowWeeklyGapWidestSinceJuly2002 #CryptoNews #Macro #FearAndGreed
#NasdaqDowWeeklyGapWidestSinceJuly2002
😨 Wall Street Hits Extreme Fear. Crypto Sentiment Stays Neutral.
📊 Week to Oct 16: Dow +0.7%, Nasdaq -4.5%, the widest weekly gap since July 2002
📉 Chip index -11.4% in 8 straight down days, worst week since April 2025
⚖️ Narrow selloff: the equal-weight S&P 500 ETF still ended the week up
😨 CNN Fear & Greed Index: 18 (Extreme Fear), down from 47 a week earlier
🟡 Crypto Fear & Greed Index: 53 (Neutral)
🟠 $BTC slipped about 2.6% Monday to Friday on Binance, less than the Nasdaq, and trades near $82K
What it means for crypto: Bitcoin has held up better than tech so far, but crypto has often moved with tech stocks, so a deeper Nasdaq slide is still a risk. This week's big-tech earnings could decide whether the gap closes.
Is crypto decoupling from tech, or just lagging? 👇
$BTC $ETH
#NasdaqDowWeeklyGapWidestSinceJuly2002 #CryptoNews #Macro #FearAndGreed
😨 Wall Street Hits Extreme Fear. Crypto Sentiment Stays Neutral.
📊 Week to Oct 16: Dow +0.7%, Nasdaq -4.5%, the widest weekly gap since July 2002
📉 Chip index -11.4% in 8 straight down days, worst week since April 2025
⚖️ Narrow selloff: the equal-weight S&P 500 ETF still ended the week up
😨 CNN Fear & Greed Index: 18 (Extreme Fear), down from 47 a week earlier
🟡 Crypto Fear & Greed Index: 53 (Neutral)
🟠 $BTC slipped about 2.6% Monday to Friday on Binance, less than the Nasdaq, and trades near $82K
What it means for crypto: Bitcoin has held up better than tech so far, but crypto has often moved with tech stocks, so a deeper Nasdaq slide is still a risk. This week's big-tech earnings could decide whether the gap closes.
Is crypto decoupling from tech, or just lagging? 👇
$BTC $ETH
#NasdaqDowWeeklyGapWidestSinceJuly2002 #CryptoNews #Macro #FearAndGreed
ABO3ZAM:
صمود البيتكوين غريب فعلاً رغم ضغط الناسداك، هل تشوف إغلاق الأسبوع فوق الـ 80 ألف بيعطينا دفعة لأهداف أعلى ولا ننتظر كسر وهمي ونخفف مراكزنا؟ 🎯
5
51

·
--
Bearish
#NasdaqDowWeeklyGapWidestSinceJuly2002
🚨 NASDAQ–DOW GAP HITS WIDEST LEVEL SINCE JULY 2002
Wall Street just recorded an unusual split in market performance. For the week ending October 16, the Nasdaq Composite fell approximately 4.48%, while the Dow Jones Industrial Average gained around 0.68% — a gap of 5.16 percentage points, the widest since July 2002.
📊 KEY DEVELOPMENTS
• Nasdaq weakness: Technology and AI-related stocks faced significant selling pressure.
• Dow resilience: Traditional blue-chip stocks outperformed, highlighting a clear divergence between major market sectors.
• AI valuation concerns: Investors are reassessing the potential returns from heavy AI investment and infrastructure spending.
• Macro pressure: Oil prices, inflation concerns, and interest-rate expectations remain important factors for risk assets.
₿ WHY IT MATTERS FOR CRYPTO
This divergence deserves attention from Bitcoin and altcoin traders because crypto markets can be sensitive to changes in broader risk appetite and financial conditions.
If technology stocks remain under pressure, speculative crypto assets could face additional volatility. However, a weaker Nasdaq does not automatically mean Bitcoin will decline. Crypto has its own liquidity dynamics, institutional flows, and market-specific catalysts.
🔎 WHAT TRADERS SHOULD WATCH
• Bitcoin price action and spot trading volume
• Nasdaq stability and broader equity sentiment
• Federal Reserve expectations and Treasury yields
• Whether BTC holds key support levels or breaks down with stronger selling pressure
⚠️ MARKET TAKEAWAY
The key signal is not simply that stocks are falling — it is that market leadership is changing. Whether this develops into a broader risk-off move or remains a sector rotation will depend on what happens next.
Do you think this is a temporary rotation away from tech, or an early warning of broader market weakness?
$STRK
{future}(STRKUSDT)
$EPIC
{future}(EPICUSDT)
$EIGEN
{future}(EIGENUSDT)
#NasdaqDowWeeklyGapWidestSinceJuly2002
🚨 NASDAQ–DOW GAP HITS WIDEST LEVEL SINCE JULY 2002
Wall Street just recorded an unusual split in market performance. For the week ending October 16, the Nasdaq Composite fell approximately 4.48%, while the Dow Jones Industrial Average gained around 0.68% — a gap of 5.16 percentage points, the widest since July 2002.
📊 KEY DEVELOPMENTS
• Nasdaq weakness: Technology and AI-related stocks faced significant selling pressure.
• Dow resilience: Traditional blue-chip stocks outperformed, highlighting a clear divergence between major market sectors.
• AI valuation concerns: Investors are reassessing the potential returns from heavy AI investment and infrastructure spending.
• Macro pressure: Oil prices, inflation concerns, and interest-rate expectations remain important factors for risk assets.
₿ WHY IT MATTERS FOR CRYPTO
This divergence deserves attention from Bitcoin and altcoin traders because crypto markets can be sensitive to changes in broader risk appetite and financial conditions.
If technology stocks remain under pressure, speculative crypto assets could face additional volatility. However, a weaker Nasdaq does not automatically mean Bitcoin will decline. Crypto has its own liquidity dynamics, institutional flows, and market-specific catalysts.
🔎 WHAT TRADERS SHOULD WATCH
• Bitcoin price action and spot trading volume
• Nasdaq stability and broader equity sentiment
• Federal Reserve expectations and Treasury yields
• Whether BTC holds key support levels or breaks down with stronger selling pressure
⚠️ MARKET TAKEAWAY
The key signal is not simply that stocks are falling — it is that market leadership is changing. Whether this develops into a broader risk-off move or remains a sector rotation will depend on what happens next.
Do you think this is a temporary rotation away from tech, or an early warning of broader market weakness?
$STRK
$EPIC
$EIGEN
🚨 NASDAQ–DOW GAP HITS WIDEST LEVEL SINCE JULY 2002
Wall Street just recorded an unusual split in market performance. For the week ending October 16, the Nasdaq Composite fell approximately 4.48%, while the Dow Jones Industrial Average gained around 0.68% — a gap of 5.16 percentage points, the widest since July 2002.
📊 KEY DEVELOPMENTS
• Nasdaq weakness: Technology and AI-related stocks faced significant selling pressure.
• Dow resilience: Traditional blue-chip stocks outperformed, highlighting a clear divergence between major market sectors.
• AI valuation concerns: Investors are reassessing the potential returns from heavy AI investment and infrastructure spending.
• Macro pressure: Oil prices, inflation concerns, and interest-rate expectations remain important factors for risk assets.
₿ WHY IT MATTERS FOR CRYPTO
This divergence deserves attention from Bitcoin and altcoin traders because crypto markets can be sensitive to changes in broader risk appetite and financial conditions.
If technology stocks remain under pressure, speculative crypto assets could face additional volatility. However, a weaker Nasdaq does not automatically mean Bitcoin will decline. Crypto has its own liquidity dynamics, institutional flows, and market-specific catalysts.
🔎 WHAT TRADERS SHOULD WATCH
• Bitcoin price action and spot trading volume
• Nasdaq stability and broader equity sentiment
• Federal Reserve expectations and Treasury yields
• Whether BTC holds key support levels or breaks down with stronger selling pressure
⚠️ MARKET TAKEAWAY
The key signal is not simply that stocks are falling — it is that market leadership is changing. Whether this develops into a broader risk-off move or remains a sector rotation will depend on what happens next.
Do you think this is a temporary rotation away from tech, or an early warning of broader market weakness?
$STRK
$EPIC
$EIGEN
ABO3ZAM:
تحليل ممتاز، هل تشوف إغلاق الأسبوعي فوق مستويات الدعم الحالية كافٍ لإنهاء هذا التباين، ولا تتوقع كسر وهمي يجر السوق لأسفل قبل أي ارتداد؟ 🎯
1
628
🚨 WALL STREET JUST FLASHED A 24-YEAR MARKET SIGNAL!
📉 Nasdaq Composite: −4.48% for the week
📈 Dow Jones: +0.68% for the week
The gap is the widest since July 2002! <Cite refs={["turn888018search8"]}/>
🔥 AI stock worries are shaking tech markets while traditional blue chips show greater resilience.
Could this volatility spill over into $BTC and $ETH ?
#nasdaqdowweeklygapwidestsincejuly2002
🚨 WALL STREET JUST FLASHED A 24-YEAR MARKET SIGNAL!
📉 Nasdaq Composite: −4.48% for the week
📈 Dow Jones: +0.68% for the week
The gap is the widest since July 2002! <Cite refs={["turn888018search8"]}/>
🔥 AI stock worries are shaking tech markets while traditional blue chips show greater resilience.
Could this volatility spill over into $BTC and $ETH ?
#nasdaqdowweeklygapwidestsincejuly2002
📉 Nasdaq Composite: −4.48% for the week
📈 Dow Jones: +0.68% for the week
The gap is the widest since July 2002! <Cite refs={["turn888018search8"]}/>
🔥 AI stock worries are shaking tech markets while traditional blue chips show greater resilience.
Could this volatility spill over into $BTC and $ETH ?
#nasdaqdowweeklygapwidestsincejuly2002
18
⚠️ TECH STOCKS ARE UNDER PRESSURE!
The Nasdaq and Dow have recorded their widest weekly performance gap in more than 24 years. 📊
Investors are questioning AI spending, debt levels, and how quickly massive investments will generate profits.
👀 If risk appetite weakens further, crypto markets could feel the pressure too.
Watch $BTC price action and volume before making a spot move.
#nasdaqdowweeklygapwidestsincejuly2002
⚠️ TECH STOCKS ARE UNDER PRESSURE!
The Nasdaq and Dow have recorded their widest weekly performance gap in more than 24 years. 📊
Investors are questioning AI spending, debt levels, and how quickly massive investments will generate profits.
👀 If risk appetite weakens further, crypto markets could feel the pressure too.
Watch $BTC price action and volume before making a spot move.
#nasdaqdowweeklygapwidestsincejuly2002
The Nasdaq and Dow have recorded their widest weekly performance gap in more than 24 years. 📊
Investors are questioning AI spending, debt levels, and how quickly massive investments will generate profits.
👀 If risk appetite weakens further, crypto markets could feel the pressure too.
Watch $BTC price action and volume before making a spot move.
#nasdaqdowweeklygapwidestsincejuly2002
16
🔥 THE AI BOOM FACES A SERIOUS MARKET TEST!
Investors are reassessing the cost, debt, and profitability of AI infrastructure as technology stocks face a sharp weekly decline. 🤖
Meanwhile, the Dow outperformed the Nasdaq by the widest weekly margin since July 2002. <Cite refs={["turn888018news13","turn888018search8"]}/>
💡 For spot traders, volatility creates opportunities — but only when entries are disciplined and risk is controlled.
Will tech recover next week, or will selling continue?
#nasdaqdowweeklygapwidestsincejuly2002
🔥 THE AI BOOM FACES A SERIOUS MARKET TEST!
Investors are reassessing the cost, debt, and profitability of AI infrastructure as technology stocks face a sharp weekly decline. 🤖
Meanwhile, the Dow outperformed the Nasdaq by the widest weekly margin since July 2002. <Cite refs={["turn888018news13","turn888018search8"]}/>
💡 For spot traders, volatility creates opportunities — but only when entries are disciplined and risk is controlled.
Will tech recover next week, or will selling continue?
#nasdaqdowweeklygapwidestsincejuly2002
Investors are reassessing the cost, debt, and profitability of AI infrastructure as technology stocks face a sharp weekly decline. 🤖
Meanwhile, the Dow outperformed the Nasdaq by the widest weekly margin since July 2002. <Cite refs={["turn888018news13","turn888018search8"]}/>
💡 For spot traders, volatility creates opportunities — but only when entries are disciplined and risk is controlled.
Will tech recover next week, or will selling continue?
#nasdaqdowweeklygapwidestsincejuly2002
25

WALL STREET’S AI BOOM FACES A REALITY CHECK!🚨 #NasdaqDowWeeklyGapWidestSinceJuly2002
U.S. markets just delivered a major warning signal. For the week ending October 16, the Nasdaq Composite fell approximately 4.5%, while the Dow Jones gained around 0.7% — their widest weekly performance gap since July 2002. ⚠️
📊 WHAT’S BEHIND THE DIVERGENCE?
🔴 AI financing fears: Investors are questioning whether massive AI infrastructure spending can generate enough profits to justify its cost.
💸 Debt pressure: CoreWeave suffered a sharp sell-off as concerns about AI infrastructure financing and borrowing obligations intensified.
📉 Technology stocks under pressure: Semiconductor and high-growth technology shares faced heavy selling as investors reassessed valuations and future earnings.
🔄 Sector rotation: Money appears to be shifting away from some high-growth technology names toward other market sectors. This may reflect selective repositioning rather than a complete exit from risk assets.
🪙 WHAT DOES THIS MEAN FOR CRYPTO?
₿ $BTC — Bitcoin: Watch whether Bitcoin holds key support levels if technology stocks remain weak. A stock-market sell-off can pressure crypto sentiment, but BTC does not always move in line with equities.
🔷 $ETH — Ethereum: Monitor spot demand, liquidity, and relative strength. A broader risk-off environment can increase volatility across major altcoins.
⚠️ AI crypto tokens: Projects connected to AI and decentralized computing may face greater scrutiny over real usage, revenue, and token value—not just exciting narratives.
🔍 3 THINGS TO WATCH NEXT WEEK
1️⃣ Big Tech earnings: Will companies demonstrate that AI spending is translating into sustainable revenue and profits?
2️⃣ Inflation and Fed expectations: Interest rates and borrowing costs could influence valuations across technology stocks and crypto.
3️⃣ Bitcoin confirmation: Watch price action, trading volume, and support levels instead of assuming that weakness in the Nasdaq automatically means a crypto crash.
🧠 MY TAKE: AI could transform the global economy, but not every AI investment will deliver strong returns. The market is increasingly asking a difficult question: Who will profit from the AI boom—and who will be left carrying the debt?
For crypto traders, this is a time to prioritize risk management, liquidity, and confirmed market signals over hype.
💬 Your opinion: Is this a healthy rotation away from expensive tech stocks, or the beginning of a deeper AI market correction?
#NasdaqDowWeeklyGapWidestSinceJuly2002 #Bitcoin #BTC #Ethereum #ETH #CryptoNews #StockMarket #AIStocks #MarketAnalysis #FederalReserve #RiskManagement
⚠️ Disclaimer: Educational market commentary only, not financial advice. Market correlations can change, and past performance does not predict future results.
{spot}(ETHUSDT)
{spot}(BTCUSDT)
WALL STREET’S AI BOOM FACES A REALITY CHECK!
🚨 #NasdaqDowWeeklyGapWidestSinceJuly2002
U.S. markets just delivered a major warning signal. For the week ending October 16, the Nasdaq Composite fell approximately 4.5%, while the Dow Jones gained around 0.7% — their widest weekly performance gap since July 2002. ⚠️
📊 WHAT’S BEHIND THE DIVERGENCE?
🔴 AI financing fears: Investors are questioning whether massive AI infrastructure spending can generate enough profits to justify its cost.
💸 Debt pressure: CoreWeave suffered a sharp sell-off as concerns about AI infrastructure financing and borrowing obligations intensified.
📉 Technology stocks under pressure: Semiconductor and high-growth technology shares faced heavy selling as investors reassessed valuations and future earnings.
🔄 Sector rotation: Money appears to be shifting away from some high-growth technology names toward other market sectors. This may reflect selective repositioning rather than a complete exit from risk assets.
🪙 WHAT DOES THIS MEAN FOR CRYPTO?
₿ $BTC — Bitcoin: Watch whether Bitcoin holds key support levels if technology stocks remain weak. A stock-market sell-off can pressure crypto sentiment, but BTC does not always move in line with equities.
🔷 $ETH — Ethereum: Monitor spot demand, liquidity, and relative strength. A broader risk-off environment can increase volatility across major altcoins.
⚠️ AI crypto tokens: Projects connected to AI and decentralized computing may face greater scrutiny over real usage, revenue, and token value—not just exciting narratives.
🔍 3 THINGS TO WATCH NEXT WEEK
1️⃣ Big Tech earnings: Will companies demonstrate that AI spending is translating into sustainable revenue and profits?
2️⃣ Inflation and Fed expectations: Interest rates and borrowing costs could influence valuations across technology stocks and crypto.
3️⃣ Bitcoin confirmation: Watch price action, trading volume, and support levels instead of assuming that weakness in the Nasdaq automatically means a crypto crash.
🧠 MY TAKE: AI could transform the global economy, but not every AI investment will deliver strong returns. The market is increasingly asking a difficult question: Who will profit from the AI boom—and who will be left carrying the debt?
For crypto traders, this is a time to prioritize risk management, liquidity, and confirmed market signals over hype.
💬 Your opinion: Is this a healthy rotation away from expensive tech stocks, or the beginning of a deeper AI market correction?
#NasdaqDowWeeklyGapWidestSinceJuly2002 #Bitcoin #BTC #Ethereum #ETH #CryptoNews #StockMarket #AIStocks #MarketAnalysis #FederalReserve #RiskManagement
⚠️ Disclaimer: Educational market commentary only, not financial advice. Market correlations can change, and past performance does not predict future results.
U.S. markets just delivered a major warning signal. For the week ending October 16, the Nasdaq Composite fell approximately 4.5%, while the Dow Jones gained around 0.7% — their widest weekly performance gap since July 2002. ⚠️
📊 WHAT’S BEHIND THE DIVERGENCE?
🔴 AI financing fears: Investors are questioning whether massive AI infrastructure spending can generate enough profits to justify its cost.
💸 Debt pressure: CoreWeave suffered a sharp sell-off as concerns about AI infrastructure financing and borrowing obligations intensified.
📉 Technology stocks under pressure: Semiconductor and high-growth technology shares faced heavy selling as investors reassessed valuations and future earnings.
🔄 Sector rotation: Money appears to be shifting away from some high-growth technology names toward other market sectors. This may reflect selective repositioning rather than a complete exit from risk assets.
🪙 WHAT DOES THIS MEAN FOR CRYPTO?
₿ $BTC — Bitcoin: Watch whether Bitcoin holds key support levels if technology stocks remain weak. A stock-market sell-off can pressure crypto sentiment, but BTC does not always move in line with equities.
🔷 $ETH — Ethereum: Monitor spot demand, liquidity, and relative strength. A broader risk-off environment can increase volatility across major altcoins.
⚠️ AI crypto tokens: Projects connected to AI and decentralized computing may face greater scrutiny over real usage, revenue, and token value—not just exciting narratives.
🔍 3 THINGS TO WATCH NEXT WEEK
1️⃣ Big Tech earnings: Will companies demonstrate that AI spending is translating into sustainable revenue and profits?
2️⃣ Inflation and Fed expectations: Interest rates and borrowing costs could influence valuations across technology stocks and crypto.
3️⃣ Bitcoin confirmation: Watch price action, trading volume, and support levels instead of assuming that weakness in the Nasdaq automatically means a crypto crash.
🧠 MY TAKE: AI could transform the global economy, but not every AI investment will deliver strong returns. The market is increasingly asking a difficult question: Who will profit from the AI boom—and who will be left carrying the debt?
For crypto traders, this is a time to prioritize risk management, liquidity, and confirmed market signals over hype.
💬 Your opinion: Is this a healthy rotation away from expensive tech stocks, or the beginning of a deeper AI market correction?
#NasdaqDowWeeklyGapWidestSinceJuly2002 #Bitcoin #BTC #Ethereum #ETH #CryptoNews #StockMarket #AIStocks #MarketAnalysis #FederalReserve #RiskManagement
⚠️ Disclaimer: Educational market commentary only, not financial advice. Market correlations can change, and past performance does not predict future results.
ABO3ZAM:
تحليل عميق يا بطل، السوق فعلاً بدأ يفرز الغث من السمين. لا تنسوا تأمين الأرباح وإدارة المحفظة بذكاء، فالسوق لا يرحم من يطمع في أوقات التذبذب 🎯
1
61

·
--
#NasdaqDowWeeklyGapWidestSinceJuly2002
📉 Nasdaq Composite: −4.48%
📈 Dow Jones: +0.68%
That's a 5.16-point weekly gap, the widest since July 2002.
Same week, same market, two completely different stories. 👇
🔍 What's behind the split?
The AI conversation has shifted. It's no longer "Is AI the future?" but "Who pays for this massive buildout, and when do the returns show up?" Debt-funded spending and stretched valuations pushed tech and chip stocks lower, while the Dow held steady.
🔗 Why crypto traders should care
$BTC isn't Nasdaq, but in risk-off phases Bitcoin can trade like high-beta tech. A strong Dow offers little comfort when crypto depends on risk appetite and liquidity.
👀 What to watch
🔴 If tech stays weak and $BTC loses key support on rising sell volume, downside pressure could build.
🟢 If tech stabilizes and $BTC holds support while reclaiming resistance, crypto can recover despite the equity split.
⚠️ My take: This is a signal to pay attention, not a crash call. One week doesn't confirm a trend, and the 2002 comparison is context, not a forecast. Liquidity, sentiment, and Bitcoin's own price action will decide the next move.
💬 Binancians, what's your view? Is this a healthy rotation out of an overpriced AI trade, or the start of a broader risk-off wave? Drop your take below 👇
#BTC #CryptoMarket #NASDAQ #MacroAnalysis
{spot}(BTCUSDT)
#NasdaqDowWeeklyGapWidestSinceJuly2002
📉 Nasdaq Composite: −4.48%
📈 Dow Jones: +0.68%
That's a 5.16-point weekly gap, the widest since July 2002.
Same week, same market, two completely different stories. 👇
🔍 What's behind the split?
The AI conversation has shifted. It's no longer "Is AI the future?" but "Who pays for this massive buildout, and when do the returns show up?" Debt-funded spending and stretched valuations pushed tech and chip stocks lower, while the Dow held steady.
🔗 Why crypto traders should care
$BTC isn't Nasdaq, but in risk-off phases Bitcoin can trade like high-beta tech. A strong Dow offers little comfort when crypto depends on risk appetite and liquidity.
👀 What to watch
🔴 If tech stays weak and $BTC loses key support on rising sell volume, downside pressure could build.
🟢 If tech stabilizes and $BTC holds support while reclaiming resistance, crypto can recover despite the equity split.
⚠️ My take: This is a signal to pay attention, not a crash call. One week doesn't confirm a trend, and the 2002 comparison is context, not a forecast. Liquidity, sentiment, and Bitcoin's own price action will decide the next move.
💬 Binancians, what's your view? Is this a healthy rotation out of an overpriced AI trade, or the start of a broader risk-off wave? Drop your take below 👇
#BTC #CryptoMarket #NASDAQ #MacroAnalysis
📉 Nasdaq Composite: −4.48%
📈 Dow Jones: +0.68%
That's a 5.16-point weekly gap, the widest since July 2002.
Same week, same market, two completely different stories. 👇
🔍 What's behind the split?
The AI conversation has shifted. It's no longer "Is AI the future?" but "Who pays for this massive buildout, and when do the returns show up?" Debt-funded spending and stretched valuations pushed tech and chip stocks lower, while the Dow held steady.
🔗 Why crypto traders should care
$BTC isn't Nasdaq, but in risk-off phases Bitcoin can trade like high-beta tech. A strong Dow offers little comfort when crypto depends on risk appetite and liquidity.
👀 What to watch
🔴 If tech stays weak and $BTC loses key support on rising sell volume, downside pressure could build.
🟢 If tech stabilizes and $BTC holds support while reclaiming resistance, crypto can recover despite the equity split.
⚠️ My take: This is a signal to pay attention, not a crash call. One week doesn't confirm a trend, and the 2002 comparison is context, not a forecast. Liquidity, sentiment, and Bitcoin's own price action will decide the next move.
💬 Binancians, what's your view? Is this a healthy rotation out of an overpriced AI trade, or the start of a broader risk-off wave? Drop your take below 👇
#BTC #CryptoMarket #NASDAQ #MacroAnalysis
ABO3ZAM:
تحليل واقعي وممتاز يا غالي. السوق يمر بمرحلة تذبذب عالية، الأهم حالياً هو تأمين الأرباح ووضع ستوب لوز صارم عند مستويات الدعم لتفادي أي كسر مفاجئ للسيولة. 🤝
2
1
152
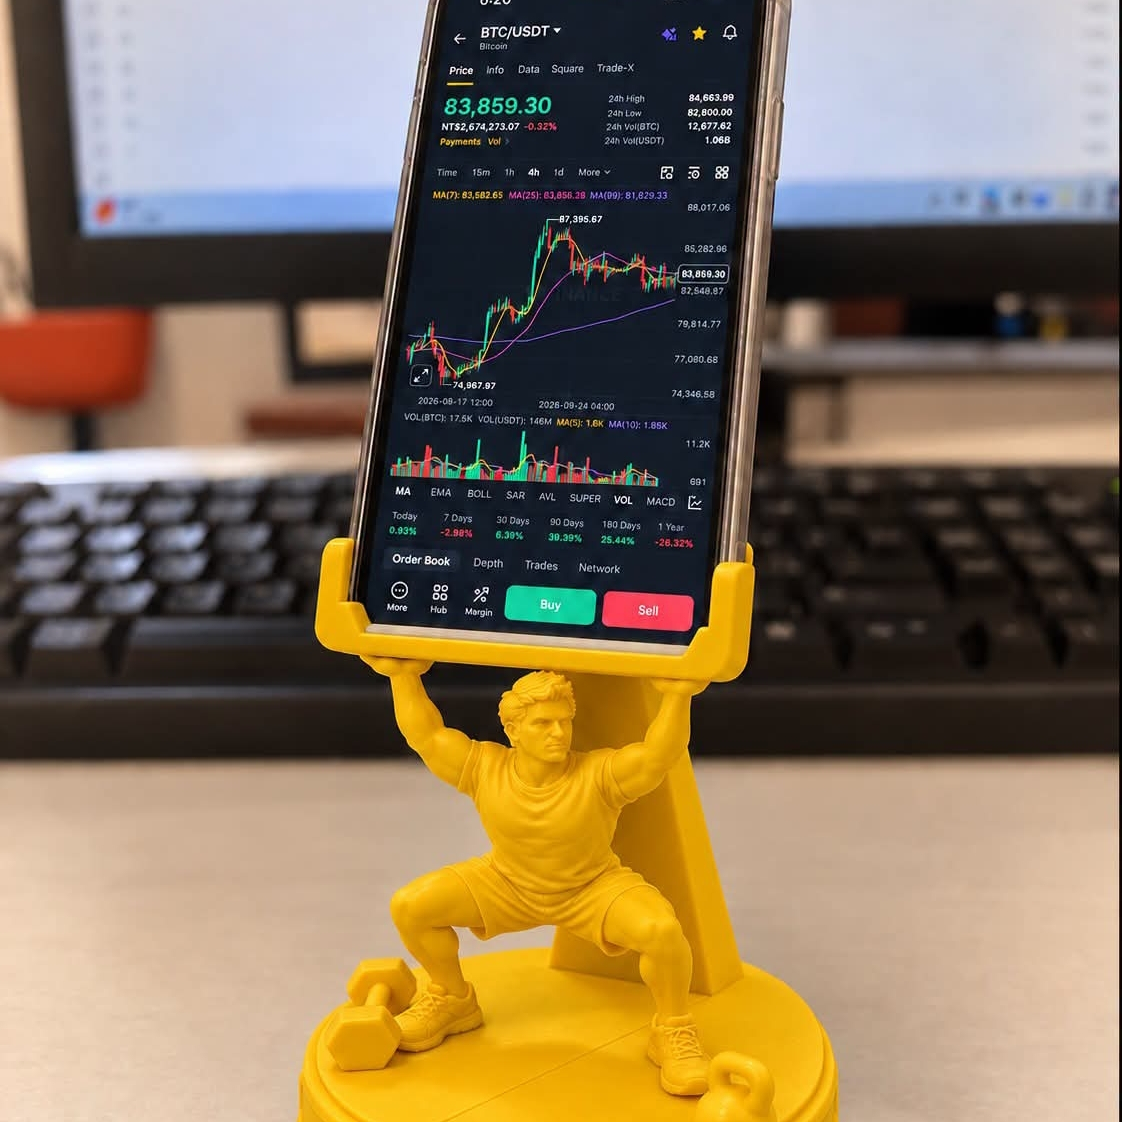
#Nasdaq100Falls5.5%InWorstWeekIn18Months
🚨 BREAKING: Nasdaq 100 Falls 5.5% — Worst Week in 18 Months!
Nasdaq 100 closed at 29,187.55, worst since April 2025.
WHY CRASH?
📉 Philly Semiconductor: -16%, 8 straight days DOWN — longest losing streak since 2008, $2T market value erased!
📉 CoreWeave: -25% worst week, Debt $51B, Bond Yields 15% — AI infra financing blowing up!
📉 Nasdaq-Dow Gap: Widest since July 2002 — Money rotating OUT of tech
📈 VIX: +21.45% → 19.99 Fear rising
ROOT CAUSE:
AI bubble reality check — investors asking: Will AI revenue justify massive spending?
+ PPI HOT 6.3% YoY + Oil near $110 = Rate hike fears
BUT CRYPTO HOLDING?
BTC holding $80k, ETH $2,450 — Nasdaq crumbling harder than crypto!
Is this AI trade reset or start of bigger correction?
#Nasdaq100Falls5.5%InWorstWeekIn18Months #NasdaqDowWeeklyGapWidestSinceJuly2002 $BTC $QQQ $XAU
#Nasdaq100Falls5.5%InWorstWeekIn18Months
🚨 BREAKING: Nasdaq 100 Falls 5.5% — Worst Week in 18 Months!
Nasdaq 100 closed at 29,187.55, worst since April 2025.
WHY CRASH?
📉 Philly Semiconductor: -16%, 8 straight days DOWN — longest losing streak since 2008, $2T market value erased!
📉 CoreWeave: -25% worst week, Debt $51B, Bond Yields 15% — AI infra financing blowing up!
📉 Nasdaq-Dow Gap: Widest since July 2002 — Money rotating OUT of tech
📈 VIX: +21.45% → 19.99 Fear rising
ROOT CAUSE:
AI bubble reality check — investors asking: Will AI revenue justify massive spending?
+ PPI HOT 6.3% YoY + Oil near $110 = Rate hike fears
BUT CRYPTO HOLDING?
BTC holding $80k, ETH $2,450 — Nasdaq crumbling harder than crypto!
Is this AI trade reset or start of bigger correction?
#Nasdaq100Falls5.5%InWorstWeekIn18Months #NasdaqDowWeeklyGapWidestSinceJuly2002 $BTC $QQQ $XAU
🚨 BREAKING: Nasdaq 100 Falls 5.5% — Worst Week in 18 Months!
Nasdaq 100 closed at 29,187.55, worst since April 2025.
WHY CRASH?
📉 Philly Semiconductor: -16%, 8 straight days DOWN — longest losing streak since 2008, $2T market value erased!
📉 CoreWeave: -25% worst week, Debt $51B, Bond Yields 15% — AI infra financing blowing up!
📉 Nasdaq-Dow Gap: Widest since July 2002 — Money rotating OUT of tech
📈 VIX: +21.45% → 19.99 Fear rising
ROOT CAUSE:
AI bubble reality check — investors asking: Will AI revenue justify massive spending?
+ PPI HOT 6.3% YoY + Oil near $110 = Rate hike fears
BUT CRYPTO HOLDING?
BTC holding $80k, ETH $2,450 — Nasdaq crumbling harder than crypto!
Is this AI trade reset or start of bigger correction?
#Nasdaq100Falls5.5%InWorstWeekIn18Months #NasdaqDowWeeklyGapWidestSinceJuly2002 $BTC $QQQ $XAU
1
88

·
--
$BTC | Nasdaq posted its widest weekly gap since July 2002. SatoshiMacro's Nasdaq 100 tracker shows the index closed 29,187.55 on 16 October, 6.5 percent below the 31,224 record set ten days earlier. On the desk a gap like that reads as a volatility signal, not a verdict. Bitcoin has run about 2.4 times NDX daily volatility since 2020, so a move this size in equities often shows up amplified in BTC. My read is the multiplier matters more than the correlation this week. That 2.4x is a long-run average, not a next-session forecast. Australian accounts carry the AUD/USD layer too, 5 to 10 percentage points a year on SatoshiMacro's own data, on top of the index move. Size for both.
https://satoshimacro.com/tools/crypto/markets/nasdaq-100/?utm_source=binance_square&utm_medium=social&utm_campaign=autopilot_short-1
#SatoshiMacro #NasdaqDowWeeklyGapWidestSinceJuly2002 #Nasdaq100 #Bitcoin
$BTC | Nasdaq posted its widest weekly gap since July 2002. SatoshiMacro's Nasdaq 100 tracker shows the index closed 29,187.55 on 16 October, 6.5 percent below the 31,224 record set ten days earlier. On the desk a gap like that reads as a volatility signal, not a verdict. Bitcoin has run about 2.4 times NDX daily volatility since 2020, so a move this size in equities often shows up amplified in BTC. My read is the multiplier matters more than the correlation this week. That 2.4x is a long-run average, not a next-session forecast. Australian accounts carry the AUD/USD layer too, 5 to 10 percentage points a year on SatoshiMacro's own data, on top of the index move. Size for both.
https://satoshimacro.com/tools/crypto/markets/nasdaq-100/?utm_source=binance_square&utm_medium=social&utm_campaign=autopilot_short-1
#SatoshiMacro #NasdaqDowWeeklyGapWidestSinceJuly2002 #Nasdaq100 #Bitcoin
https://satoshimacro.com/tools/crypto/markets/nasdaq-100/?utm_source=binance_square&utm_medium=social&utm_campaign=autopilot_short-1
#SatoshiMacro #NasdaqDowWeeklyGapWidestSinceJuly2002 #Nasdaq100 #Bitcoin
102

·
--
Nasdaq & Dow Divergence: Widest Weekly Gap Since July 2002! 📉⚡
Tech stocks face heavy rotation as the Nasdaq drops -4.48% while the Dow gains +0.68%—marking a massive 5.16 percentage-point weekly gap, the largest since 2002!
Key Takeaways:
• Sector Rotation: Investors are shifting capital from Tech/AI to Traditional Value sectors (Banking, Industrials).
• Macro Pressures: Rising oil prices and inflation concerns continue to weigh on tech high-flyers.
• Crypto Impact: Risk-off sentiment in tech equities often leads to heightened volatility across crypto markets. Stay cautious!
#NasdaqDowWeeklyGapWidestSinceJuly2002 #CryptoMarket #TradingInsights
Nasdaq & Dow Divergence: Widest Weekly Gap Since July 2002! 📉⚡
Tech stocks face heavy rotation as the Nasdaq drops -4.48% while the Dow gains +0.68%—marking a massive 5.16 percentage-point weekly gap, the largest since 2002!
Key Takeaways:
• Sector Rotation: Investors are shifting capital from Tech/AI to Traditional Value sectors (Banking, Industrials).
• Macro Pressures: Rising oil prices and inflation concerns continue to weigh on tech high-flyers.
• Crypto Impact: Risk-off sentiment in tech equities often leads to heightened volatility across crypto markets. Stay cautious!
#NasdaqDowWeeklyGapWidestSinceJuly2002 #CryptoMarket #TradingInsights
Tech stocks face heavy rotation as the Nasdaq drops -4.48% while the Dow gains +0.68%—marking a massive 5.16 percentage-point weekly gap, the largest since 2002!
Key Takeaways:
• Sector Rotation: Investors are shifting capital from Tech/AI to Traditional Value sectors (Banking, Industrials).
• Macro Pressures: Rising oil prices and inflation concerns continue to weigh on tech high-flyers.
• Crypto Impact: Risk-off sentiment in tech equities often leads to heightened volatility across crypto markets. Stay cautious!
#NasdaqDowWeeklyGapWidestSinceJuly2002 #CryptoMarket #TradingInsights
86

·
--
#nasdaq100falls5.5%inworstweekin18months
Nasdaq 100 -5.5%: a rotation out of AI, not a market-wide panic. 🔄
📊 Week to Oct 16: Nasdaq 100 -5.5% (worst since Apr 2025), S&P 500 -2.0%, Dow +0.7%. The Nasdaq–Dow gap is the widest since July 2002.
🔌 Chips fell 8 straight sessions (longest since 2008), -11.4% on the week, yet still up >50% YTD.
What’s driving it
• AI financing stress: CoreWeave -12%, its bonds under pressure
• Oil: Brent ~$110 fuels inflation fears (CPI 3.7%, PPI 6.3%)
• China’s CXMT memory progress → competition fears
⚠️ Nuance: Nasdaq 100 is ~7% below its Oct 6 peak, still short of the 10% “correction” line.
Crypto link: BTC fell only ~1% on Friday while the Nasdaq 100 dropped 2.5%, so no full contagion yet. That could change if credit stress spreads.
I’m watching: CoreWeave credit, 10Y yield (~5.1%), oil, and whether BTC holds its own support.
Is crypto decoupling or just late? 👇
Not financial advice. DYOR.
#NasdaqDowWeeklyGapWidestSinceJuly2002 #AIStocks #Bitcoin
$BTC
{future}(BTCUSDT)
$QQQB
{spot}(QQQBUSDT)
$NVDAB
{spot}(NVDABUSDT)
#nasdaq100falls5.5%inworstweekin18months
Nasdaq 100 -5.5%: a rotation out of AI, not a market-wide panic. 🔄
📊 Week to Oct 16: Nasdaq 100 -5.5% (worst since Apr 2025), S&P 500 -2.0%, Dow +0.7%. The Nasdaq–Dow gap is the widest since July 2002.
🔌 Chips fell 8 straight sessions (longest since 2008), -11.4% on the week, yet still up >50% YTD.
What’s driving it
• AI financing stress: CoreWeave -12%, its bonds under pressure
• Oil: Brent ~$110 fuels inflation fears (CPI 3.7%, PPI 6.3%)
• China’s CXMT memory progress → competition fears
⚠️ Nuance: Nasdaq 100 is ~7% below its Oct 6 peak, still short of the 10% “correction” line.
Crypto link: BTC fell only ~1% on Friday while the Nasdaq 100 dropped 2.5%, so no full contagion yet. That could change if credit stress spreads.
I’m watching: CoreWeave credit, 10Y yield (~5.1%), oil, and whether BTC holds its own support.
Is crypto decoupling or just late? 👇
Not financial advice. DYOR.
#NasdaqDowWeeklyGapWidestSinceJuly2002 #AIStocks #Bitcoin
$BTC
$QQQB
$NVDAB
Nasdaq 100 -5.5%: a rotation out of AI, not a market-wide panic. 🔄
📊 Week to Oct 16: Nasdaq 100 -5.5% (worst since Apr 2025), S&P 500 -2.0%, Dow +0.7%. The Nasdaq–Dow gap is the widest since July 2002.
🔌 Chips fell 8 straight sessions (longest since 2008), -11.4% on the week, yet still up >50% YTD.
What’s driving it
• AI financing stress: CoreWeave -12%, its bonds under pressure
• Oil: Brent ~$110 fuels inflation fears (CPI 3.7%, PPI 6.3%)
• China’s CXMT memory progress → competition fears
⚠️ Nuance: Nasdaq 100 is ~7% below its Oct 6 peak, still short of the 10% “correction” line.
Crypto link: BTC fell only ~1% on Friday while the Nasdaq 100 dropped 2.5%, so no full contagion yet. That could change if credit stress spreads.
I’m watching: CoreWeave credit, 10Y yield (~5.1%), oil, and whether BTC holds its own support.
Is crypto decoupling or just late? 👇
Not financial advice. DYOR.
#NasdaqDowWeeklyGapWidestSinceJuly2002 #AIStocks #Bitcoin
$BTC
$QQQB
$NVDAB
2
3.4k

·
--
Bullish
#nasdaqdowweeklygapwidestsincejuly2002
🚨🚨🚨🚨🚨🚨🚨🚨🚨🚨🚨🚨🚨🚨 WALL STREET JUST SENT A WARNING SIGNAL — SHOULD CRYPTO TRADERS PAY ATTENTION?
Something unusual happened in the US stock market this week.
📉 Nasdaq Composite: -4.48%
📈 Dow Jones: +0.68%
That’s a 5.16-percentage-point gap — the widest weekly divergence between these indexes since July 2002.
But what does it mean for crypto? 👇
🔍 1. Tech Stocks Are Under Pressure
Concerns about AI investment returns have weighed on technology stocks. Investors are reassessing whether massive spending on AI infrastructure can deliver the expected returns.
🔗 2. Why $BTC Matters Here
Bitcoin doesn’t always move in the same direction as stocks. However, when risk sentiment weakens, crypto can experience additional volatility as investors reassess their exposure to riskier assets.
📊 3. What Should We Watch Next?
🔴 Bearish scenario: If technology stocks remain weak and $BTC loses important support with rising selling volume, downside pressure could increase.
🟢 Recovery scenario: If stocks stabilize and Bitcoin holds support while reclaiming resistance, crypto could recover despite the equity market divergence.
⚠️ My take: This is a signal to pay attention, not proof that a market crash is coming. The July 2002 comparison is interesting, but one similar historical pattern cannot predict what happens next.
The next move depends on market conditions, liquidity, investor sentiment, and Bitcoin’s own price action.
💬 Binancians, what’s your view? Is this a temporary correction in technology stocks, or could it trigger another wave of volatility across the crypto market?
#Bitcoin #BTC #CryptoMarket #Nasdaq #MacroAnalysis
{future}(BTCUSDT)
#nasdaqdowweeklygapwidestsincejuly2002
🚨🚨🚨🚨🚨🚨🚨🚨🚨🚨🚨🚨🚨🚨 WALL STREET JUST SENT A WARNING SIGNAL — SHOULD CRYPTO TRADERS PAY ATTENTION?
Something unusual happened in the US stock market this week.
📉 Nasdaq Composite: -4.48%
📈 Dow Jones: +0.68%
That’s a 5.16-percentage-point gap — the widest weekly divergence between these indexes since July 2002.
But what does it mean for crypto? 👇
🔍 1. Tech Stocks Are Under Pressure
Concerns about AI investment returns have weighed on technology stocks. Investors are reassessing whether massive spending on AI infrastructure can deliver the expected returns.
🔗 2. Why $BTC Matters Here
Bitcoin doesn’t always move in the same direction as stocks. However, when risk sentiment weakens, crypto can experience additional volatility as investors reassess their exposure to riskier assets.
📊 3. What Should We Watch Next?
🔴 Bearish scenario: If technology stocks remain weak and $BTC loses important support with rising selling volume, downside pressure could increase.
🟢 Recovery scenario: If stocks stabilize and Bitcoin holds support while reclaiming resistance, crypto could recover despite the equity market divergence.
⚠️ My take: This is a signal to pay attention, not proof that a market crash is coming. The July 2002 comparison is interesting, but one similar historical pattern cannot predict what happens next.
The next move depends on market conditions, liquidity, investor sentiment, and Bitcoin’s own price action.
💬 Binancians, what’s your view? Is this a temporary correction in technology stocks, or could it trigger another wave of volatility across the crypto market?
#Bitcoin #BTC #CryptoMarket #Nasdaq #MacroAnalysis
🚨🚨🚨🚨🚨🚨🚨🚨🚨🚨🚨🚨🚨🚨 WALL STREET JUST SENT A WARNING SIGNAL — SHOULD CRYPTO TRADERS PAY ATTENTION?
Something unusual happened in the US stock market this week.
📉 Nasdaq Composite: -4.48%
📈 Dow Jones: +0.68%
That’s a 5.16-percentage-point gap — the widest weekly divergence between these indexes since July 2002.
But what does it mean for crypto? 👇
🔍 1. Tech Stocks Are Under Pressure
Concerns about AI investment returns have weighed on technology stocks. Investors are reassessing whether massive spending on AI infrastructure can deliver the expected returns.
🔗 2. Why $BTC Matters Here
Bitcoin doesn’t always move in the same direction as stocks. However, when risk sentiment weakens, crypto can experience additional volatility as investors reassess their exposure to riskier assets.
📊 3. What Should We Watch Next?
🔴 Bearish scenario: If technology stocks remain weak and $BTC loses important support with rising selling volume, downside pressure could increase.
🟢 Recovery scenario: If stocks stabilize and Bitcoin holds support while reclaiming resistance, crypto could recover despite the equity market divergence.
⚠️ My take: This is a signal to pay attention, not proof that a market crash is coming. The July 2002 comparison is interesting, but one similar historical pattern cannot predict what happens next.
The next move depends on market conditions, liquidity, investor sentiment, and Bitcoin’s own price action.
💬 Binancians, what’s your view? Is this a temporary correction in technology stocks, or could it trigger another wave of volatility across the crypto market?
#Bitcoin #BTC #CryptoMarket #Nasdaq #MacroAnalysis
1.4k


The Nasdaq and Dow Jones Industrial Average have experienced their widest weekly closing price gap since July 2002. This significant divergence highlights contrasting market sentiments and performance between growth-oriented tech stocks (Nasdaq) and more traditional industrial companies (Dow).
This widening gap suggests a potential rotation in the market, with investors favoring different sectors. It could be driven by macroeconomic factors, interest rate expectations, or specific industry trends. For crypto markets, such broad market movements can influence overall risk appetite, potentially impacting digital asset valuations and trading volumes. Traders should monitor these traditional market signals for insights into broader financial conditions.
Disclaimer: This is not financial advice. Always do your own research.
#NasdaqDowWeeklyGapWidestSinceJuly2002 $BTC $ETH
The Nasdaq and Dow Jones Industrial Average have experienced their widest weekly closing price gap since July 2002. This significant divergence highlights contrasting market sentiments and performance between growth-oriented tech stocks (Nasdaq) and more traditional industrial companies (Dow).
This widening gap suggests a potential rotation in the market, with investors favoring different sectors. It could be driven by macroeconomic factors, interest rate expectations, or specific industry trends. For crypto markets, such broad market movements can influence overall risk appetite, potentially impacting digital asset valuations and trading volumes. Traders should monitor these traditional market signals for insights into broader financial conditions.
Disclaimer: This is not financial advice. Always do your own research.
#NasdaqDowWeeklyGapWidestSinceJuly2002 $BTC $ETH
This widening gap suggests a potential rotation in the market, with investors favoring different sectors. It could be driven by macroeconomic factors, interest rate expectations, or specific industry trends. For crypto markets, such broad market movements can influence overall risk appetite, potentially impacting digital asset valuations and trading volumes. Traders should monitor these traditional market signals for insights into broader financial conditions.
Disclaimer: This is not financial advice. Always do your own research.
#NasdaqDowWeeklyGapWidestSinceJuly2002 $BTC $ETH
64

#NasdaqDowWeeklyGapWidestSinceJuly2002
🚨 Wall Street Is Sending a Warning Signal — Is Crypto Next?
📉 Nasdaq Composite: -4.48% 📈 Dow Jones: +0.68%
The gap between these two indexes reached 5.16 percentage points, marking their widest weekly divergence since July 2002. 👀
But what could this mean for crypto? 🪙
💻 Tech stocks are facing pressure as investors question whether huge AI investments will deliver the expected returns.
₿ Bitcoin doesn’t always follow the stock market, but when investors become cautious, crypto volatility can increase.
🔴 Bearish scenario: If tech stocks continue falling and BTC loses key support, selling pressure could grow.
🟢 Bullish scenario: If markets stabilize and Bitcoin reclaims important resistance levels, crypto could see a recovery.
⚠️ My view: This is a signal to stay alert, not a guarantee of a market crash. History can offer clues, but it never guarantees the next move.
💬 What do you think, Binancians? Is this just a temporary correction, or could more volatility be coming to the crypto market?
👍 Like 🔄 Share ➕ Follow for more crypto updates!
#Bitcoin #BTC $BTC
{future}(BTCUSDT)
#NasdaqDowWeeklyGapWidestSinceJuly2002
🚨 Wall Street Is Sending a Warning Signal — Is Crypto Next?
📉 Nasdaq Composite: -4.48% 📈 Dow Jones: +0.68%
The gap between these two indexes reached 5.16 percentage points, marking their widest weekly divergence since July 2002. 👀
But what could this mean for crypto? 🪙
💻 Tech stocks are facing pressure as investors question whether huge AI investments will deliver the expected returns.
₿ Bitcoin doesn’t always follow the stock market, but when investors become cautious, crypto volatility can increase.
🔴 Bearish scenario: If tech stocks continue falling and BTC loses key support, selling pressure could grow.
🟢 Bullish scenario: If markets stabilize and Bitcoin reclaims important resistance levels, crypto could see a recovery.
⚠️ My view: This is a signal to stay alert, not a guarantee of a market crash. History can offer clues, but it never guarantees the next move.
💬 What do you think, Binancians? Is this just a temporary correction, or could more volatility be coming to the crypto market?
👍 Like 🔄 Share ➕ Follow for more crypto updates!
#Bitcoin #BTC $BTC
🚨 Wall Street Is Sending a Warning Signal — Is Crypto Next?
📉 Nasdaq Composite: -4.48% 📈 Dow Jones: +0.68%
The gap between these two indexes reached 5.16 percentage points, marking their widest weekly divergence since July 2002. 👀
But what could this mean for crypto? 🪙
💻 Tech stocks are facing pressure as investors question whether huge AI investments will deliver the expected returns.
₿ Bitcoin doesn’t always follow the stock market, but when investors become cautious, crypto volatility can increase.
🔴 Bearish scenario: If tech stocks continue falling and BTC loses key support, selling pressure could grow.
🟢 Bullish scenario: If markets stabilize and Bitcoin reclaims important resistance levels, crypto could see a recovery.
⚠️ My view: This is a signal to stay alert, not a guarantee of a market crash. History can offer clues, but it never guarantees the next move.
💬 What do you think, Binancians? Is this just a temporary correction, or could more volatility be coming to the crypto market?
👍 Like 🔄 Share ➕ Follow for more crypto updates!
#Bitcoin #BTC $BTC
84

#NasdaqDowWeeklyGapWidestSinceJuly2002 🚨 WALL STREET JUST HAD ITS MOST LOPSIDED WEEK SINCE 2002? 🌍📊
📰 Nasdaq fell 4.48% while Dow Jones rose 0.68% this week. It's the widest weekly gap between the two indexes since July 2002, with chip stocks hit hardest, down over 11%.
💡 WHAT THIS MEANS FOR TRADERS:
🔹 Tech is under pressure and money is rotating into traditional, defensive stocks.
🔹 This kind of historic divergence usually brings high volatility across both stocks and crypto.
🔹 If tech selloff spreads, risk assets like crypto could feel the pressure too.
🔎 2 RELATED COINS TO WATCH:
🌐 $QQQ — Right at the center of this tech selloff, its next move will set the tone for risk assets.
⚡ $BTC — Holding up with +0.14% while tech bleeds, showing relative strength in this rotation.
⚖️ MY TAKE:
This looks more like a sharp sector rotation than a full market crash. Tech is cooling off while money moves elsewhere. There could be a bounce opportunity if Nasdaq stabilizes, but the risk of more downside is still there, so rushing in is not ideal.
💬 Do you think this Nasdaq-Dow split will drag Bitcoin down or will BTC decouple and hold strong? 👇✨
#NasdaqDowWeeklyGapWidestSinceJuly2002
#StockMarketCrash
#QQQ
#DowJones
{future}(BTCUSDT)
{future}(QQQUSDT)
#NasdaqDowWeeklyGapWidestSinceJuly2002 🚨 WALL STREET JUST HAD ITS MOST LOPSIDED WEEK SINCE 2002? 🌍📊
📰 Nasdaq fell 4.48% while Dow Jones rose 0.68% this week. It's the widest weekly gap between the two indexes since July 2002, with chip stocks hit hardest, down over 11%.
💡 WHAT THIS MEANS FOR TRADERS:
🔹 Tech is under pressure and money is rotating into traditional, defensive stocks.
🔹 This kind of historic divergence usually brings high volatility across both stocks and crypto.
🔹 If tech selloff spreads, risk assets like crypto could feel the pressure too.
🔎 2 RELATED COINS TO WATCH:
🌐 $QQQ — Right at the center of this tech selloff, its next move will set the tone for risk assets.
⚡ $BTC — Holding up with +0.14% while tech bleeds, showing relative strength in this rotation.
⚖️ MY TAKE:
This looks more like a sharp sector rotation than a full market crash. Tech is cooling off while money moves elsewhere. There could be a bounce opportunity if Nasdaq stabilizes, but the risk of more downside is still there, so rushing in is not ideal.
💬 Do you think this Nasdaq-Dow split will drag Bitcoin down or will BTC decouple and hold strong? 👇✨
#NasdaqDowWeeklyGapWidestSinceJuly2002
#StockMarketCrash
#QQQ
#DowJones
📰 Nasdaq fell 4.48% while Dow Jones rose 0.68% this week. It's the widest weekly gap between the two indexes since July 2002, with chip stocks hit hardest, down over 11%.
💡 WHAT THIS MEANS FOR TRADERS:
🔹 Tech is under pressure and money is rotating into traditional, defensive stocks.
🔹 This kind of historic divergence usually brings high volatility across both stocks and crypto.
🔹 If tech selloff spreads, risk assets like crypto could feel the pressure too.
🔎 2 RELATED COINS TO WATCH:
🌐 $QQQ — Right at the center of this tech selloff, its next move will set the tone for risk assets.
⚡ $BTC — Holding up with +0.14% while tech bleeds, showing relative strength in this rotation.
⚖️ MY TAKE:
This looks more like a sharp sector rotation than a full market crash. Tech is cooling off while money moves elsewhere. There could be a bounce opportunity if Nasdaq stabilizes, but the risk of more downside is still there, so rushing in is not ideal.
💬 Do you think this Nasdaq-Dow split will drag Bitcoin down or will BTC decouple and hold strong? 👇✨
#NasdaqDowWeeklyGapWidestSinceJuly2002
#StockMarketCrash
#QQQ
#DowJones
1
424

#NasdaqDowWeeklyGapWidestSinceJuly2002 🚨 WALL STREET JUST FLASHED A SIGNAL WE HAVEN’T SEEN IN MORE THAN TWO DECADES…
The weekly performance gap between the Nasdaq and Dow has reportedly reached its widest level since July 2002. And that kind of divergence is hard to ignore.
While one side of the market is being driven heavily by growth and technology stocks, the other is telling a very different story. When two major U.S. indexes move this far apart, it can reveal a major shift in where investors are willing to take risk.
But here’s where it gets interesting for crypto traders. 👀
Bitcoin and the broader crypto market often react to changes in global risk sentiment. If investors continue rotating toward higher-growth assets, crypto could eventually benefit from stronger risk appetite. But if this massive gap is actually a warning of instability beneath the surface, volatility could arrive before the next clear direction.
The July 2002 comparison makes this especially worth watching — not because history has to repeat itself, but because extreme market divergences rarely go unnoticed for long.
📊 Nasdaq vs Dow is now a chart worth keeping on the radar.
The next question isn’t simply which index wins…
It’s what happens when this gap finally starts to close. 👀
#NasdaqDowWeeklyGapWidestSinceJuly200 #Nasdaq #DowJones #Bitcoin
{spot}(BTCUSDT)
#NasdaqDowWeeklyGapWidestSinceJuly2002 🚨 WALL STREET JUST FLASHED A SIGNAL WE HAVEN’T SEEN IN MORE THAN TWO DECADES…
The weekly performance gap between the Nasdaq and Dow has reportedly reached its widest level since July 2002. And that kind of divergence is hard to ignore.
While one side of the market is being driven heavily by growth and technology stocks, the other is telling a very different story. When two major U.S. indexes move this far apart, it can reveal a major shift in where investors are willing to take risk.
But here’s where it gets interesting for crypto traders. 👀
Bitcoin and the broader crypto market often react to changes in global risk sentiment. If investors continue rotating toward higher-growth assets, crypto could eventually benefit from stronger risk appetite. But if this massive gap is actually a warning of instability beneath the surface, volatility could arrive before the next clear direction.
The July 2002 comparison makes this especially worth watching — not because history has to repeat itself, but because extreme market divergences rarely go unnoticed for long.
📊 Nasdaq vs Dow is now a chart worth keeping on the radar.
The next question isn’t simply which index wins…
It’s what happens when this gap finally starts to close. 👀
#NasdaqDowWeeklyGapWidestSinceJuly200 #Nasdaq #DowJones #Bitcoin
The weekly performance gap between the Nasdaq and Dow has reportedly reached its widest level since July 2002. And that kind of divergence is hard to ignore.
While one side of the market is being driven heavily by growth and technology stocks, the other is telling a very different story. When two major U.S. indexes move this far apart, it can reveal a major shift in where investors are willing to take risk.
But here’s where it gets interesting for crypto traders. 👀
Bitcoin and the broader crypto market often react to changes in global risk sentiment. If investors continue rotating toward higher-growth assets, crypto could eventually benefit from stronger risk appetite. But if this massive gap is actually a warning of instability beneath the surface, volatility could arrive before the next clear direction.
The July 2002 comparison makes this especially worth watching — not because history has to repeat itself, but because extreme market divergences rarely go unnoticed for long.
📊 Nasdaq vs Dow is now a chart worth keeping on the radar.
The next question isn’t simply which index wins…
It’s what happens when this gap finally starts to close. 👀
#NasdaqDowWeeklyGapWidestSinceJuly200 #Nasdaq #DowJones #Bitcoin
98
·
--
#NasdaqDowWeeklyGapWidestSinceJuly2002
For the week ending October 16, 2026, the weekly performance gap between the Nasdaq Composite and the Dow Jones Industrial Average hit 5.16%, marking its widest divergence since July 2002. [1, 2]
This historic 24-year extreme was driven by an aggressive sector rotation. Investors pulled capital out of highly valued artificial intelligence and tech-heavy equities to seek refuge in defensive, value-oriented old-economy stocks. [1, 2, 3, 4]
$ETC
{future}(ETCUSDT)
$BTC
{future}(BTCUSDT)
$THETA
{future}(THETAUSDT)
#NasdaqDowSignals
#Nasdaq100Falls5.5%InWorstWeekIn18Months
#Nasdaq100Falls5.5%InWorstWeekIn18Months
#NasdaqDowWeeklyGapWidestSinceJuly2002
For the week ending October 16, 2026, the weekly performance gap between the Nasdaq Composite and the Dow Jones Industrial Average hit 5.16%, marking its widest divergence since July 2002. [1, 2]
This historic 24-year extreme was driven by an aggressive sector rotation. Investors pulled capital out of highly valued artificial intelligence and tech-heavy equities to seek refuge in defensive, value-oriented old-economy stocks. [1, 2, 3, 4]
$ETC
$BTC
$THETA
#NasdaqDowSignals
#Nasdaq100Falls5.5%InWorstWeekIn18Months
#Nasdaq100Falls5.5%InWorstWeekIn18Months
For the week ending October 16, 2026, the weekly performance gap between the Nasdaq Composite and the Dow Jones Industrial Average hit 5.16%, marking its widest divergence since July 2002. [1, 2]
This historic 24-year extreme was driven by an aggressive sector rotation. Investors pulled capital out of highly valued artificial intelligence and tech-heavy equities to seek refuge in defensive, value-oriented old-economy stocks. [1, 2, 3, 4]
$ETC
$BTC
$THETA
#NasdaqDowSignals
#Nasdaq100Falls5.5%InWorstWeekIn18Months
#Nasdaq100Falls5.5%InWorstWeekIn18Months
81

·
--
🧮 3 things to know: Nasdaq -4.5% vs Dow +0.7%, and where $BTC sits
1️⃣ Widest weekly Nasdaq-Dow gap since July 2002
2️⃣ Chip index fell 8 days straight, longest streak since 2008
3️⃣ AI-return doubts + $100+ oil hit tech; banks held the Dow
📦 BTC $81.4K, -2.8% on the week: right between the two
🔥 Top gainer today: $EPIC +30%
📅 Next: Netflix Tue, Tesla & Meta Wed after the close
🎯 My take: risk-off into earnings; hold $80.8K or $79.8K is next
💬 Do Tesla & Meta rescue tech next week, or sink it deeper? 👇
#NasdaqDowWeeklyGapWidestSinceJuly2002 #Stocks #Bitcoin
🧮 3 things to know: Nasdaq -4.5% vs Dow +0.7%, and where $BTC sits
1️⃣ Widest weekly Nasdaq-Dow gap since July 2002
2️⃣ Chip index fell 8 days straight, longest streak since 2008
3️⃣ AI-return doubts + $100+ oil hit tech; banks held the Dow
📦 BTC $81.4K, -2.8% on the week: right between the two
🔥 Top gainer today: $EPIC +30%
📅 Next: Netflix Tue, Tesla & Meta Wed after the close
🎯 My take: risk-off into earnings; hold $80.8K or $79.8K is next
💬 Do Tesla & Meta rescue tech next week, or sink it deeper? 👇
#NasdaqDowWeeklyGapWidestSinceJuly2002 #Stocks #Bitcoin
1️⃣ Widest weekly Nasdaq-Dow gap since July 2002
2️⃣ Chip index fell 8 days straight, longest streak since 2008
3️⃣ AI-return doubts + $100+ oil hit tech; banks held the Dow
📦 BTC $81.4K, -2.8% on the week: right between the two
🔥 Top gainer today: $EPIC +30%
📅 Next: Netflix Tue, Tesla & Meta Wed after the close
🎯 My take: risk-off into earnings; hold $80.8K or $79.8K is next
💬 Do Tesla & Meta rescue tech next week, or sink it deeper? 👇
#NasdaqDowWeeklyGapWidestSinceJuly2002 #Stocks #Bitcoin
406
Log in to explore more content
Join global crypto users on Binance Square
⚡️ Get latest and useful information about crypto.
💬 Trusted by the world’s largest crypto exchange.
👍 Discover real insights from verified creators.
Email / Phone number
Trending Topics
1
#GrayscaleAndRepublicLaunchThreeCryptoFunds
173,979 views
1,206 Discussing
2
#ElSalvadorBitcoinHoldingsSurpass7800BTC
77,381 views
1,032 Discussing
3
#BitcoinSurpasses$82K
55,901 views
203 Discussing
4
#FranceNationalAssemblyPassesCryptoToStablecoinTaxAmendment
1,341 views
117 Discussing
5
#DeepSeekReleasesUpdatedAIModel
90,551 views
1,112 Discussing
6
#CelestiaRises16%To2026High
409,561 views
2,410 Discussing
7
#NasdaqDowWeeklyGapWidestSinceJuly2002
222,649 views
1,778 Discussing
8
#Nasdaq100Falls5.5%InWorstWeekIn18Months
96,756 views
1,195 Discussing
9
#StrategySharesFall9%OnFriday
155,424 views
1,189 Discussing
10
#USPPIRises6.3%YearOverYear
206,567 views
1,304 Discussing