

#etfflow
etfflow
149,648 views
185 Discussing
Hot
Latest

🚀 $BTC ETF NET FLOW FLIPS TO POSITIVE IN 7D! 📈
The 7‑day net flow for $BTC ETFs surged +8,587 coins (+$661.6M), a clear whale‑level inflow that’s rewriting the order book. 🦈📊 Smart money is loading up as daily outflows dry, suggesting a bullish tilt ahead.
Meanwhile $ETH ETFs posted a stark contrast: 1‑day net outflow of -9,540 ($23.2M) but a 7‑day net inflow of +39,046 ($95M). The weekly swing hints at a potential re‑allocation from Bitcoin to Ether as liquidity hunts fresh terrain. 🔄💎
💬 Do you see this ETF surge as the next catalyst for a $BTC rally or a signal to rotate into $ETH ? 👇
⚠️ Not financial advice. Always manage your risk. 🛡️
🏷️ #BTC #ETFFlow #SmartMoney #Crypto
🚀 🔥
🚀 $BTC ETF NET FLOW FLIPS TO POSITIVE IN 7D! 📈
The 7‑day net flow for $BTC ETFs surged +8,587 coins (+$661.6M), a clear whale‑level inflow that’s rewriting the order book. 🦈📊 Smart money is loading up as daily outflows dry, suggesting a bullish tilt ahead.
Meanwhile $ETH ETFs posted a stark contrast: 1‑day net outflow of -9,540 ($23.2M) but a 7‑day net inflow of +39,046 ($95M). The weekly swing hints at a potential re‑allocation from Bitcoin to Ether as liquidity hunts fresh terrain. 🔄💎
💬 Do you see this ETF surge as the next catalyst for a $BTC rally or a signal to rotate into $ETH ? 👇
⚠️ Not financial advice. Always manage your risk. 🛡️
🏷️ #BTC #ETFFlow #SmartMoney #Crypto
🚀 🔥
The 7‑day net flow for $BTC ETFs surged +8,587 coins (+$661.6M), a clear whale‑level inflow that’s rewriting the order book. 🦈📊 Smart money is loading up as daily outflows dry, suggesting a bullish tilt ahead.
Meanwhile $ETH ETFs posted a stark contrast: 1‑day net outflow of -9,540 ($23.2M) but a 7‑day net inflow of +39,046 ($95M). The weekly swing hints at a potential re‑allocation from Bitcoin to Ether as liquidity hunts fresh terrain. 🔄💎
💬 Do you see this ETF surge as the next catalyst for a $BTC rally or a signal to rotate into $ETH ? 👇
⚠️ Not financial advice. Always manage your risk. 🛡️
🏷️ #BTC #ETFFlow #SmartMoney #Crypto
🚀 🔥

33

🦈 $BTC SURFACES AFTER ETF OUTFLOW WHILE CUMULATIVE INFLOW STAYS ROARING 🚀
The latest 589 BTC net outflow from spot ETFs is just a blip, a brief chill after three days of 12.9k BTC inflows. 📊 Smart money is still loading the tank, with over 700k BTC parked in the funds.
Liquidity hunters see the dip as a cheap refill point; sellers are forced to chase, feeding the next wave of buying pressure. 🌊 The institutional appetite hasn’t vanished, it’s simply recalibrating.
Keep eyes on the order flow and volume spikes—when the whales start re‑stacking, the price breakout will follow. 💡
💬 Are you staying on the sidelines or positioning for the next institutional surge? 👇
⚠️ Not financial advice. Always manage your risk. 🛡️
🏷️ #BTC #ETFFlow #InstitutionalDemand #Crypto
🔥 💎
🦈 $BTC SURFACES AFTER ETF OUTFLOW WHILE CUMULATIVE INFLOW STAYS ROARING 🚀
The latest 589 BTC net outflow from spot ETFs is just a blip, a brief chill after three days of 12.9k BTC inflows. 📊 Smart money is still loading the tank, with over 700k BTC parked in the funds.
Liquidity hunters see the dip as a cheap refill point; sellers are forced to chase, feeding the next wave of buying pressure. 🌊 The institutional appetite hasn’t vanished, it’s simply recalibrating.
Keep eyes on the order flow and volume spikes—when the whales start re‑stacking, the price breakout will follow. 💡
💬 Are you staying on the sidelines or positioning for the next institutional surge? 👇
⚠️ Not financial advice. Always manage your risk. 🛡️
🏷️ #BTC #ETFFlow #InstitutionalDemand #Crypto
🔥 💎
The latest 589 BTC net outflow from spot ETFs is just a blip, a brief chill after three days of 12.9k BTC inflows. 📊 Smart money is still loading the tank, with over 700k BTC parked in the funds.
Liquidity hunters see the dip as a cheap refill point; sellers are forced to chase, feeding the next wave of buying pressure. 🌊 The institutional appetite hasn’t vanished, it’s simply recalibrating.
Keep eyes on the order flow and volume spikes—when the whales start re‑stacking, the price breakout will follow. 💡
💬 Are you staying on the sidelines or positioning for the next institutional surge? 👇
⚠️ Not financial advice. Always manage your risk. 🛡️
🏷️ #BTC #ETFFlow #InstitutionalDemand #Crypto
🔥 💎

30

·
--
🦈 $BTC ETF FLOW REVEALS INSTITUTIONAL RESILIENCE AT $79K 📈
📊 Yesterday’s spot‑ETF outflow of 589 $BTC is a blip after three sessions that netted >12,900 $BTC , leaving cumulative inflows north of 700,000 $BTC . 🌊 Smart money’s appetite remains robust, merely pausing to recalibrate.
🔍 With price perched above $79K, the ETF demand bucket acts as a deep liquidity well. A retest of the $79K order block could trigger a fresh upward thrust as institutional orders refill the gap. 📈
💬 How will the next ETF flow shape the $BTC trajectory—another inflow surge or a strategic pause? 👇
⚠️ Not financial advice. Always manage your risk. 🛡️
🏷️ #BTC #ETFFlow #InstitutionalDemand #Crypto
🔥 💎
🦈 $BTC ETF FLOW REVEALS INSTITUTIONAL RESILIENCE AT $79K 📈
📊 Yesterday’s spot‑ETF outflow of 589 $BTC is a blip after three sessions that netted >12,900 $BTC , leaving cumulative inflows north of 700,000 $BTC . 🌊 Smart money’s appetite remains robust, merely pausing to recalibrate.
🔍 With price perched above $79K, the ETF demand bucket acts as a deep liquidity well. A retest of the $79K order block could trigger a fresh upward thrust as institutional orders refill the gap. 📈
💬 How will the next ETF flow shape the $BTC trajectory—another inflow surge or a strategic pause? 👇
⚠️ Not financial advice. Always manage your risk. 🛡️
🏷️ #BTC #ETFFlow #InstitutionalDemand #Crypto
🔥 💎
📊 Yesterday’s spot‑ETF outflow of 589 $BTC is a blip after three sessions that netted >12,900 $BTC , leaving cumulative inflows north of 700,000 $BTC . 🌊 Smart money’s appetite remains robust, merely pausing to recalibrate.
🔍 With price perched above $79K, the ETF demand bucket acts as a deep liquidity well. A retest of the $79K order block could trigger a fresh upward thrust as institutional orders refill the gap. 📈
💬 How will the next ETF flow shape the $BTC trajectory—another inflow surge or a strategic pause? 👇
⚠️ Not financial advice. Always manage your risk. 🛡️
🏷️ #BTC #ETFFlow #InstitutionalDemand #Crypto
🔥 💎

26

🦈 $XRP SURGES AS FRANKLIN ETF PUMPS $1.55M 💥
Smart money just lit the runway – Franklin’s ETF arm snapped up $1.55 M of $XRP , a decisive liquidity sweep that forces sellers to the edge. 📊 Volume spikes and a tightening spread hint at a bullish thrust as whales lock in positions. 🌊
💬 Are you ready to ride the wave or wait for the next institutional push? 👇
⚠️ Not financial advice. Always manage your risk. 🛡️
🏷️ #XRP #SmartMoney #ETFFlow #Crypto
🚀 ⚡
🦈 $XRP SURGES AS FRANKLIN ETF PUMPS $1.55M 💥
Smart money just lit the runway – Franklin’s ETF arm snapped up $1.55 M of $XRP , a decisive liquidity sweep that forces sellers to the edge. 📊 Volume spikes and a tightening spread hint at a bullish thrust as whales lock in positions. 🌊
💬 Are you ready to ride the wave or wait for the next institutional push? 👇
⚠️ Not financial advice. Always manage your risk. 🛡️
🏷️ #XRP #SmartMoney #ETFFlow #Crypto
🚀 ⚡
Smart money just lit the runway – Franklin’s ETF arm snapped up $1.55 M of $XRP , a decisive liquidity sweep that forces sellers to the edge. 📊 Volume spikes and a tightening spread hint at a bullish thrust as whales lock in positions. 🌊
💬 Are you ready to ride the wave or wait for the next institutional push? 👇
⚠️ Not financial advice. Always manage your risk. 🛡️
🏷️ #XRP #SmartMoney #ETFFlow #Crypto
🚀 ⚡


51

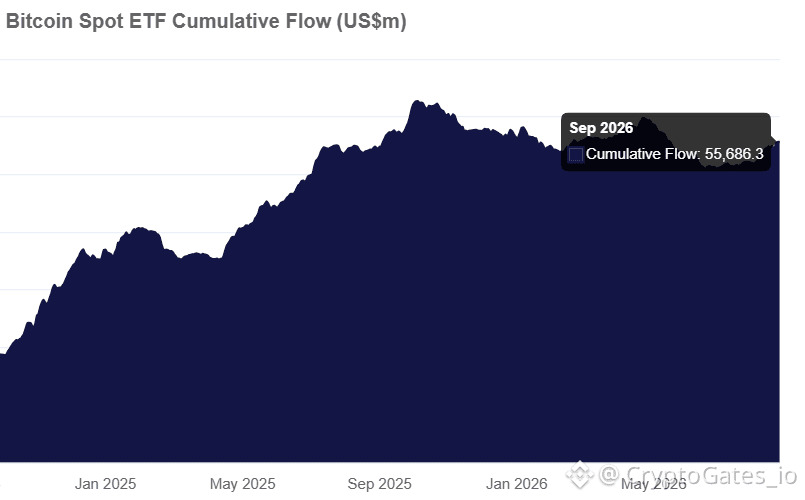
$BTC price vs ETF flows, the disconnect nobody's pricing in
🔴 BTC price: ~78K, down ~1% today
🔵 ETF cumulative flow: 55,686.3M (Sep 2026)
📈 Flow chart has climbed steadily since Jan 2024, no real breakdown even during the 58K-68K chop
📉 Price candles are noisy day to day, flow data isn't
⚠️ Don't read one red day as trend reversal without checking if flows confirm it
Verify first. Risk later...
#Bitcoin #ETFFlow
$BTC price vs ETF flows, the disconnect nobody's pricing in
🔴 BTC price: ~78K, down ~1% today
🔵 ETF cumulative flow: 55,686.3M (Sep 2026)
📈 Flow chart has climbed steadily since Jan 2024, no real breakdown even during the 58K-68K chop
📉 Price candles are noisy day to day, flow data isn't
⚠️ Don't read one red day as trend reversal without checking if flows confirm it
Verify first. Risk later...
#Bitcoin #ETFFlow
🔴 BTC price: ~78K, down ~1% today
🔵 ETF cumulative flow: 55,686.3M (Sep 2026)
📈 Flow chart has climbed steadily since Jan 2024, no real breakdown even during the 58K-68K chop
📉 Price candles are noisy day to day, flow data isn't
⚠️ Don't read one red day as trend reversal without checking if flows confirm it
Verify first. Risk later...
#Bitcoin #ETFFlow
47

·
--

Article
U.S. Bitcoin ETFs Surge $731M: What Smart Money Is WatchingMost traders focus on price swings, but the real signal is the flow of institutional capital.
The latest data from SoSoValue shows that on September 3rd, U.S. spot Bitcoin ETFs pulled in a staggering $730.9 million in a single trading session— the largest since mid‑January. BlackRock’s iShares Bitcoin Trust alone attracted over $450 million, a clear sign that the biggest player in the ETF space is betting on a bullish trajectory for $BTC.
This isn’t just a headline; it’s a barometer of market confidence. When the largest asset managers pour money into spot ETFs, they’re effectively buying the underlying asset at a price that reflects their valuation of future upside. The influx also tightens the supply of $BTC on exchanges, potentially nudging the price higher as demand outpaces liquidity.
What does this mean for the price? Historically, a surge of institutional inflows precedes a 10‑20 % rally in the short to medium term. The current inflow, coupled with a steady rise in on‑chain metrics like active addresses and transaction volume, suggests that $BTC could be poised for a breakout above the $70,000 resistance that has been a psychological barrier for months.
Watch list: Keep an eye on the ETF net inflow data for the next trading day. A sustained inflow trend will confirm that the institutional appetite is not a one‑off event but a new baseline. #BTC #ETFFlow #Institutional
If the institutional momentum continues, will $BTC break through the $70,000 ceiling and set a new all‑time high?
U.S. Bitcoin ETFs Surge $731M: What Smart Money Is Watching
Most traders focus on price swings, but the real signal is the flow of institutional capital.
The latest data from SoSoValue shows that on September 3rd, U.S. spot Bitcoin ETFs pulled in a staggering $730.9 million in a single trading session— the largest since mid‑January. BlackRock’s iShares Bitcoin Trust alone attracted over $450 million, a clear sign that the biggest player in the ETF space is betting on a bullish trajectory for $BTC .
This isn’t just a headline; it’s a barometer of market confidence. When the largest asset managers pour money into spot ETFs, they’re effectively buying the underlying asset at a price that reflects their valuation of future upside. The influx also tightens the supply of $BTC on exchanges, potentially nudging the price higher as demand outpaces liquidity.
What does this mean for the price? Historically, a surge of institutional inflows precedes a 10‑20 % rally in the short to medium term. The current inflow, coupled with a steady rise in on‑chain metrics like active addresses and transaction volume, suggests that $BTC could be poised for a breakout above the $70,000 resistance that has been a psychological barrier for months.
Watch list: Keep an eye on the ETF net inflow data for the next trading day. A sustained inflow trend will confirm that the institutional appetite is not a one‑off event but a new baseline. #BTC #ETFFlow #Institutional
If the institutional momentum continues, will $BTC break through the $70,000 ceiling and set a new all‑time high?
The latest data from SoSoValue shows that on September 3rd, U.S. spot Bitcoin ETFs pulled in a staggering $730.9 million in a single trading session— the largest since mid‑January. BlackRock’s iShares Bitcoin Trust alone attracted over $450 million, a clear sign that the biggest player in the ETF space is betting on a bullish trajectory for $BTC .
This isn’t just a headline; it’s a barometer of market confidence. When the largest asset managers pour money into spot ETFs, they’re effectively buying the underlying asset at a price that reflects their valuation of future upside. The influx also tightens the supply of $BTC on exchanges, potentially nudging the price higher as demand outpaces liquidity.
What does this mean for the price? Historically, a surge of institutional inflows precedes a 10‑20 % rally in the short to medium term. The current inflow, coupled with a steady rise in on‑chain metrics like active addresses and transaction volume, suggests that $BTC could be poised for a breakout above the $70,000 resistance that has been a psychological barrier for months.
Watch list: Keep an eye on the ETF net inflow data for the next trading day. A sustained inflow trend will confirm that the institutional appetite is not a one‑off event but a new baseline. #BTC #ETFFlow #Institutional
If the institutional momentum continues, will $BTC break through the $70,000 ceiling and set a new all‑time high?
15

·
--
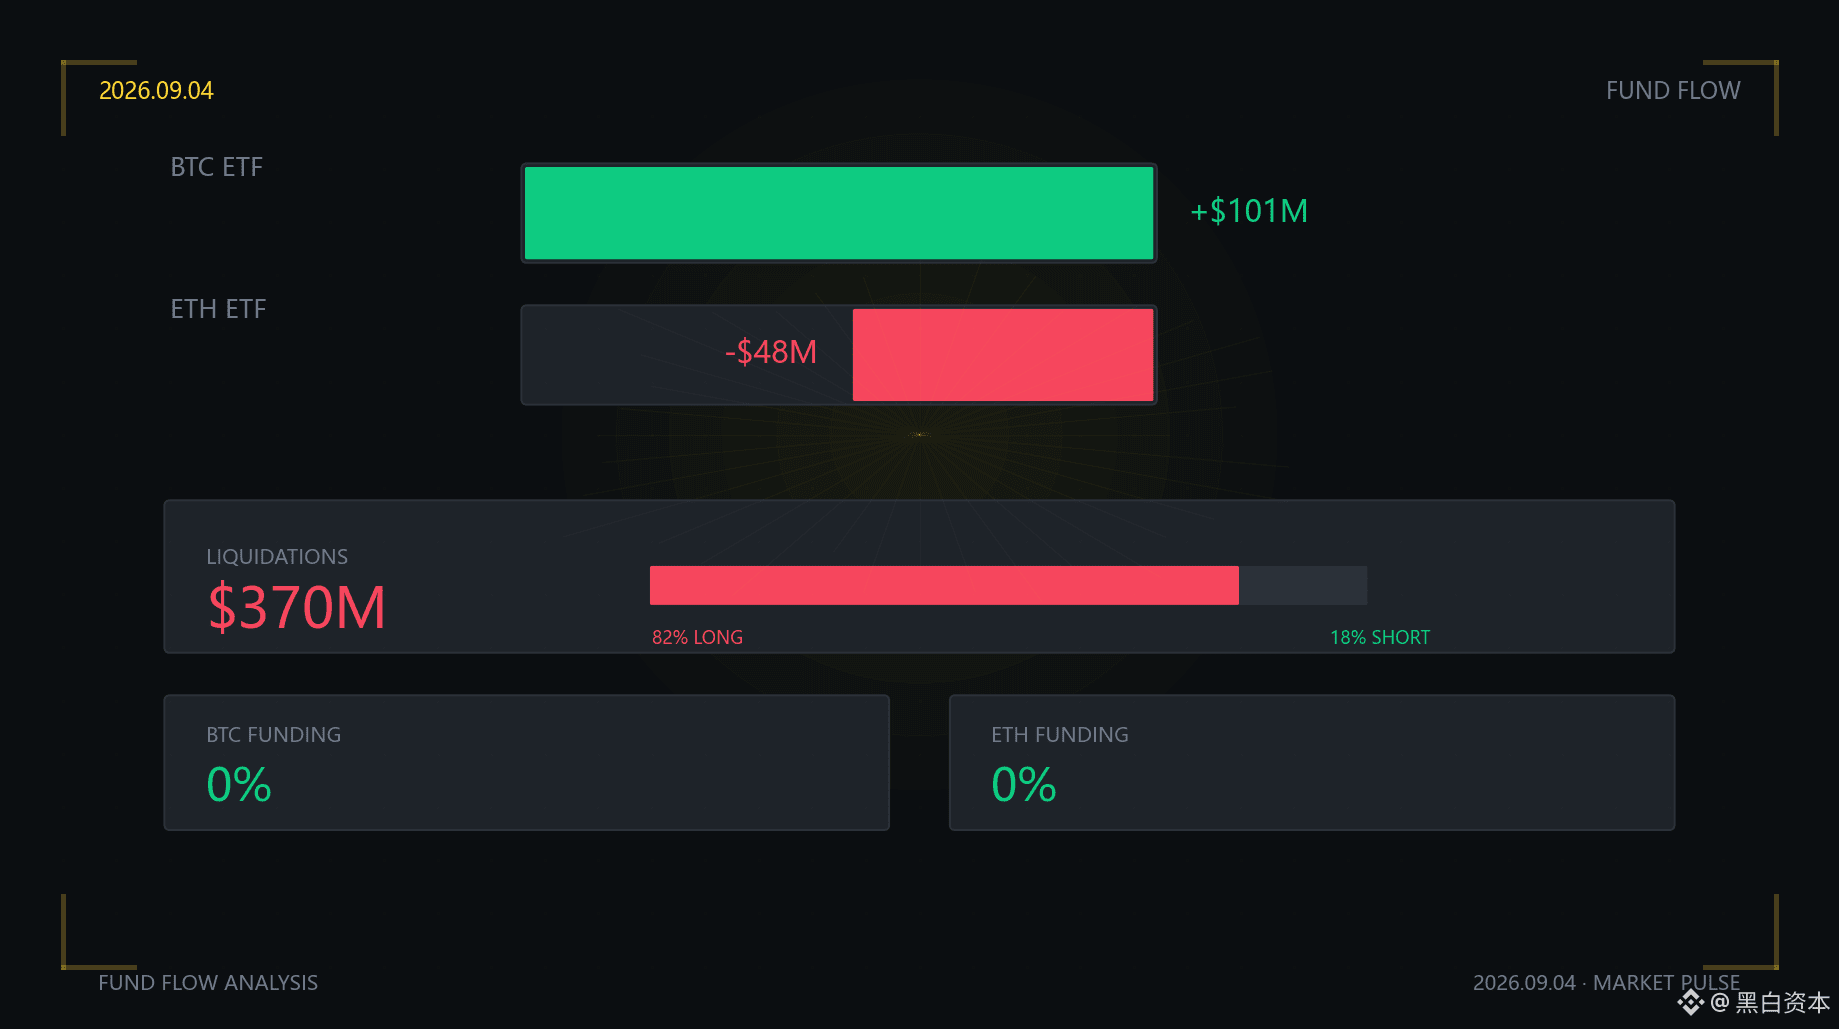
Capital Flow Direction | 09.04 Overnight Recap
ETF Flows
BTC ETF +$101M
ETH ETF -$48M
Net inflow $53M
Derivatives
Liquidations $370M | 82% long / 18% short
BTC funding rate 0% | ETH funding rate 0%
Signal Assessment
ETF inflows + price rising = capital and price resonance, trend confirmation
Long-side liquidation pressure $370M, 82% long positions; deleveraging cleanup has not ended yet
Funding rate 0% = neutral, balanced between longs and shorts
BTC $81,087 (+4.3%)
Fear/Greed 74 — leaning toward greed
Conclusion: Capital strength resonates and trend confirmation is in place
$BTC #ETFFlow #LiquidationData
Capital Flow Direction | 09.04 Overnight Recap
ETF Flows
BTC ETF +$101M
ETH ETF -$48M
Net inflow $53M
Derivatives
Liquidations $370M | 82% long / 18% short
BTC funding rate 0% | ETH funding rate 0%
Signal Assessment
ETF inflows + price rising = capital and price resonance, trend confirmation
Long-side liquidation pressure $370M, 82% long positions; deleveraging cleanup has not ended yet
Funding rate 0% = neutral, balanced between longs and shorts
BTC $81,087 (+4.3%)
Fear/Greed 74 — leaning toward greed
Conclusion: Capital strength resonates and trend confirmation is in place
$BTC #ETFFlow #LiquidationData
ETF Flows
BTC ETF +$101M
ETH ETF -$48M
Net inflow $53M
Derivatives
Liquidations $370M | 82% long / 18% short
BTC funding rate 0% | ETH funding rate 0%
Signal Assessment
ETF inflows + price rising = capital and price resonance, trend confirmation
Long-side liquidation pressure $370M, 82% long positions; deleveraging cleanup has not ended yet
Funding rate 0% = neutral, balanced between longs and shorts
BTC $81,087 (+4.3%)
Fear/Greed 74 — leaning toward greed
Conclusion: Capital strength resonates and trend confirmation is in place
$BTC #ETFFlow #LiquidationData
461
·
--
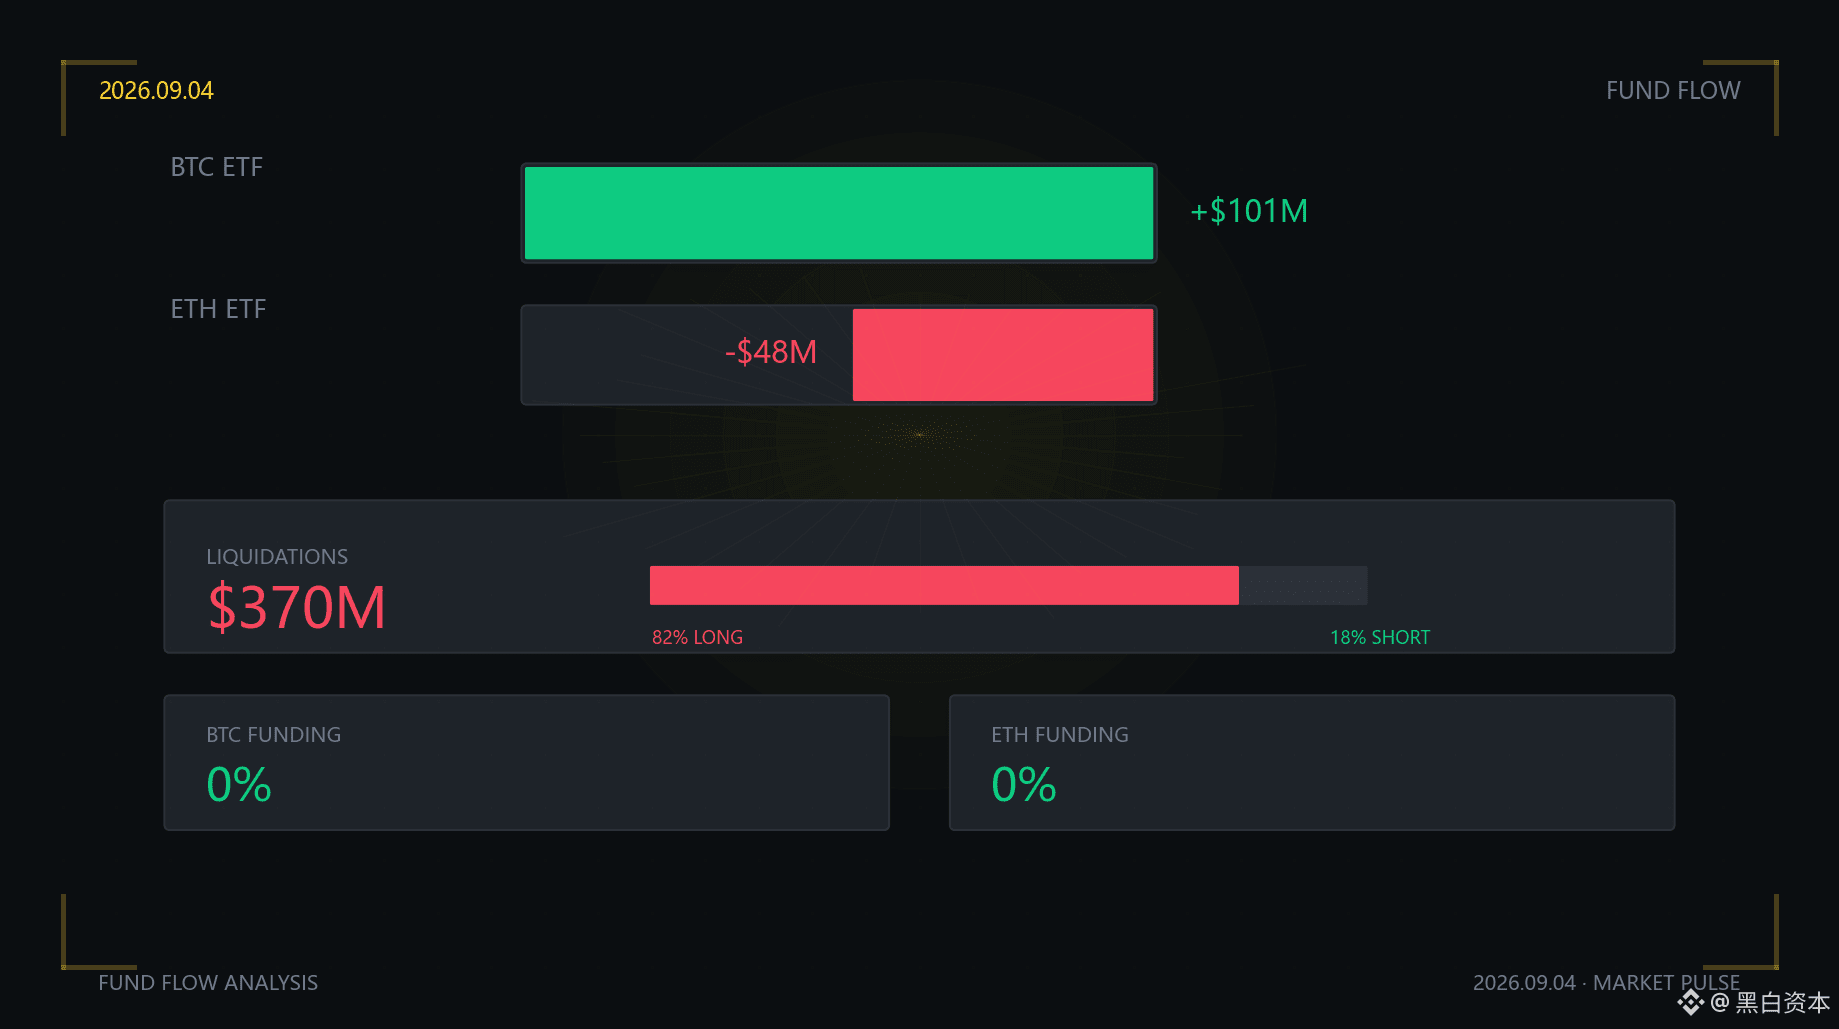
Fund Flow Direction | 09.04 Overnight Review
BTC ETF +$101M
ETH ETF -$48M
Liquidations $370M, 82% long positions
BTC funding rate 0%
ETFs move in sync with price, confirming the trend
The long-side panic selling indicates leverage is too high
Conclusion: Growing divergence in liquidity—caution in the short term
$BTC #ETFFlow #LiquidationData
Fund Flow Direction | 09.04 Overnight Review
BTC ETF +$101M
ETH ETF -$48M
Liquidations $370M, 82% long positions
BTC funding rate 0%
ETFs move in sync with price, confirming the trend
The long-side panic selling indicates leverage is too high
Conclusion: Growing divergence in liquidity—caution in the short term
$BTC #ETFFlow #LiquidationData
BTC ETF +$101M
ETH ETF -$48M
Liquidations $370M, 82% long positions
BTC funding rate 0%
ETFs move in sync with price, confirming the trend
The long-side panic selling indicates leverage is too high
Conclusion: Growing divergence in liquidity—caution in the short term
$BTC #ETFFlow #LiquidationData
204
·
--
ETF tracking | Midday update
BTC ETF +$101M
ETH ETF -$48M
BTC institutions continue to see inflows while ETH institutions see outflows
Capital prefers BTC as a safe haven
$BTC #ETFFlow #MarketStructure
ETF tracking | Midday update
BTC ETF +$101M
ETH ETF -$48M
BTC institutions continue to see inflows while ETH institutions see outflows
Capital prefers BTC as a safe haven
$BTC #ETFFlow #MarketStructure
BTC ETF +$101M
ETH ETF -$48M
BTC institutions continue to see inflows while ETH institutions see outflows
Capital prefers BTC as a safe haven
$BTC #ETFFlow #MarketStructure
155
·
--

Article
Bitcoin ETFs Drop Outflows 66% as $BTC Surges 25% in AugustMost traders focus on price swings, but the real signal is the flow of institutional capital. In August, U.S. spot Bitcoin ETFs trimmed their year‑to‑date net outflows by 66%, a clear sign that the smart money is re‑entering the market. Meanwhile, Ether ETFs posted positive YTD inflows of $732 million and XRP ETFs added $502 million, indicating a broader shift toward crypto‑asset exposure.
The data tells a story of confidence. When ETFs reduce outflows, it means that investors are not just holding cash but are actively buying into the underlying assets. The 25% rally in $BTC during the same period is not a coincidence; it is the market’s response to the influx of fresh capital. Ether and XRP’s positive inflows further suggest that diversification within the crypto basket is gaining traction, potentially cushioning $BTC’s volatility.
What does this mean for price? If the trend of reduced outflows continues, we could see sustained upward pressure on $BTC and a tightening of the price range. The ETF flows act as a barometer for institutional sentiment, and a 66% reduction in outflows is a bullish indicator that could precede a new rally phase.
Watch list: Keep an eye on the daily net inflow data for U.S. spot Bitcoin ETFs. A sudden spike in inflows could signal a breakout opportunity. #ETFFlow
If the smart money keeps moving in, will $BTC break its current resistance and set a new all‑time high?
Bitcoin ETFs Drop Outflows 66% as $BTC Surges 25% in August
Most traders focus on price swings, but the real signal is the flow of institutional capital. In August, U.S. spot Bitcoin ETFs trimmed their year‑to‑date net outflows by 66%, a clear sign that the smart money is re‑entering the market. Meanwhile, Ether ETFs posted positive YTD inflows of $732 million and XRP ETFs added $502 million, indicating a broader shift toward crypto‑asset exposure.
The data tells a story of confidence. When ETFs reduce outflows, it means that investors are not just holding cash but are actively buying into the underlying assets. The 25% rally in $BTC during the same period is not a coincidence; it is the market’s response to the influx of fresh capital. Ether and XRP’s positive inflows further suggest that diversification within the crypto basket is gaining traction, potentially cushioning $BTC ’s volatility.
What does this mean for price? If the trend of reduced outflows continues, we could see sustained upward pressure on $BTC and a tightening of the price range. The ETF flows act as a barometer for institutional sentiment, and a 66% reduction in outflows is a bullish indicator that could precede a new rally phase.
Watch list: Keep an eye on the daily net inflow data for U.S. spot Bitcoin ETFs. A sudden spike in inflows could signal a breakout opportunity. #ETFFlow
If the smart money keeps moving in, will $BTC break its current resistance and set a new all‑time high?
The data tells a story of confidence. When ETFs reduce outflows, it means that investors are not just holding cash but are actively buying into the underlying assets. The 25% rally in $BTC during the same period is not a coincidence; it is the market’s response to the influx of fresh capital. Ether and XRP’s positive inflows further suggest that diversification within the crypto basket is gaining traction, potentially cushioning $BTC ’s volatility.
What does this mean for price? If the trend of reduced outflows continues, we could see sustained upward pressure on $BTC and a tightening of the price range. The ETF flows act as a barometer for institutional sentiment, and a 66% reduction in outflows is a bullish indicator that could precede a new rally phase.
Watch list: Keep an eye on the daily net inflow data for U.S. spot Bitcoin ETFs. A sudden spike in inflows could signal a breakout opportunity. #ETFFlow
If the smart money keeps moving in, will $BTC break its current resistance and set a new all‑time high?
4

·
--
Solana’s price slipped to $94.87, a modest 0.77% dip, but the market’s attention is shifting toward the ETF inflow data. $SOL saw $15 million pour into spot Solana ETFs in the biggest 24‑hour window in three weeks, suggesting that institutional‑type capital is looking for regulated exposure rather than pure spot buying. That kind of flow can stiffen the order book on Binance, creating tighter spreads and lower volatility on the spot pair while the underlying asset still trades within a relatively wide range ($87.72‑$102.74 today).
For traders, the practical takeaway is to watch the depth chart for $SOL. A sudden surge of buy orders at the current price can act as a support wall, while a thin sell side may hint at a short‑term bounce. Pair this with the broader sector trend—privacy‑focused assets like $ZEC are also rallying on ETF news—so you might see a subtle rotation from pure‑play tokens to those tied to regulatory milestones.
How are you adjusting your spot or futures positions as these ETF inflows reshape liquidity?
#CryptoAnalysis #AltcoinInsights #ETFFlow #GAMERXERO
Solana’s price slipped to $94.87, a modest 0.77% dip, but the market’s attention is shifting toward the ETF inflow data. $SOL saw $15 million pour into spot Solana ETFs in the biggest 24‑hour window in three weeks, suggesting that institutional‑type capital is looking for regulated exposure rather than pure spot buying. That kind of flow can stiffen the order book on Binance, creating tighter spreads and lower volatility on the spot pair while the underlying asset still trades within a relatively wide range ($87.72‑$102.74 today).
For traders, the practical takeaway is to watch the depth chart for $SOL . A sudden surge of buy orders at the current price can act as a support wall, while a thin sell side may hint at a short‑term bounce. Pair this with the broader sector trend—privacy‑focused assets like $ZEC are also rallying on ETF news—so you might see a subtle rotation from pure‑play tokens to those tied to regulatory milestones.
How are you adjusting your spot or futures positions as these ETF inflows reshape liquidity?
#CryptoAnalysis #AltcoinInsights #ETFFlow #GAMERXERO
For traders, the practical takeaway is to watch the depth chart for $SOL . A sudden surge of buy orders at the current price can act as a support wall, while a thin sell side may hint at a short‑term bounce. Pair this with the broader sector trend—privacy‑focused assets like $ZEC are also rallying on ETF news—so you might see a subtle rotation from pure‑play tokens to those tied to regulatory milestones.
How are you adjusting your spot or futures positions as these ETF inflows reshape liquidity?
#CryptoAnalysis #AltcoinInsights #ETFFlow #GAMERXERO


220

·
--
Bullish
🚀 GOOD NEWS
U.S. Crypto ETF Flows (July 7)
🟢 $BTC : +$265.69M
🟢 $ETH : +$20.66M
⚪️ XRP: $0
🟢 SOL: +$8.36M
🟢 $HYPE
{future}(HYPEUSDT)
: +$8.43M
⚪️ LINK: $0
🟢 HBAR: +$1.01M
Takeaway: Institutional demand remained strong, led by Bitcoin with over $265M in net inflows. Ethereum continued attracting capital, while Solana, Hyperliquid (HYPE), and Hedera (HBAR) also recorded positive inflows. Most other crypto ETFs saw no net flows for the day.
#ETFFlow
🚀 GOOD NEWS
U.S. Crypto ETF Flows (July 7)
🟢 $BTC : +$265.69M
🟢 $ETH : +$20.66M
⚪️ XRP: $0
🟢 SOL: +$8.36M
🟢 $HYPE
: +$8.43M
⚪️ LINK: $0
🟢 HBAR: +$1.01M
Takeaway: Institutional demand remained strong, led by Bitcoin with over $265M in net inflows. Ethereum continued attracting capital, while Solana, Hyperliquid (HYPE), and Hedera (HBAR) also recorded positive inflows. Most other crypto ETFs saw no net flows for the day.
#ETFFlow
U.S. Crypto ETF Flows (July 7)
🟢 $BTC : +$265.69M
🟢 $ETH : +$20.66M
⚪️ XRP: $0
🟢 SOL: +$8.36M
🟢 $HYPE
: +$8.43M
⚪️ LINK: $0
🟢 HBAR: +$1.01M
Takeaway: Institutional demand remained strong, led by Bitcoin with over $265M in net inflows. Ethereum continued attracting capital, while Solana, Hyperliquid (HYPE), and Hedera (HBAR) also recorded positive inflows. Most other crypto ETFs saw no net flows for the day.
#ETFFlow
1
154

·
--
SOL: Macro and Regulatory Currents to Watch
SOL is currently trading at $76.22, with a 24-hour price change of -1.06%. The market sentiment is marked as Fear, indicating cautious behavior among traders. The main discussion revolves around institutional flows and on-chain capital movements. The focus is on the contrast between SOL's net inflows in spot ETFs and the net outflows for BTC and ETH. According to Cointelegraph, SOL spot ETFs saw net inflows of $8.83M on Aug. 10, while BTC and ETH had net outflows of -$144.67M and -$14.59M, respectively. Additionally, there are signs of activity in RWA and memecoin spaces on the Solana network, with Pump fun surpassing Hyperliquid in 30-day revenue. The overall sentiment remains rational and data-driven. As the market continues to evolve, the key areas to watch include the flow of institutional capital and the impact of regulatory developments on the broader crypto ecosystem.
#cryptomacro #etfflow #blockchainnews #marketanalysis #sol
SOL: Macro and Regulatory Currents to Watch
SOL is currently trading at $76.22, with a 24-hour price change of -1.06%. The market sentiment is marked as Fear, indicating cautious behavior among traders. The main discussion revolves around institutional flows and on-chain capital movements. The focus is on the contrast between SOL's net inflows in spot ETFs and the net outflows for BTC and ETH. According to Cointelegraph, SOL spot ETFs saw net inflows of $8.83M on Aug. 10, while BTC and ETH had net outflows of -$144.67M and -$14.59M, respectively. Additionally, there are signs of activity in RWA and memecoin spaces on the Solana network, with Pump fun surpassing Hyperliquid in 30-day revenue. The overall sentiment remains rational and data-driven. As the market continues to evolve, the key areas to watch include the flow of institutional capital and the impact of regulatory developments on the broader crypto ecosystem.
#cryptomacro #etfflow #blockchainnews #marketanalysis #sol
SOL is currently trading at $76.22, with a 24-hour price change of -1.06%. The market sentiment is marked as Fear, indicating cautious behavior among traders. The main discussion revolves around institutional flows and on-chain capital movements. The focus is on the contrast between SOL's net inflows in spot ETFs and the net outflows for BTC and ETH. According to Cointelegraph, SOL spot ETFs saw net inflows of $8.83M on Aug. 10, while BTC and ETH had net outflows of -$144.67M and -$14.59M, respectively. Additionally, there are signs of activity in RWA and memecoin spaces on the Solana network, with Pump fun surpassing Hyperliquid in 30-day revenue. The overall sentiment remains rational and data-driven. As the market continues to evolve, the key areas to watch include the flow of institutional capital and the impact of regulatory developments on the broader crypto ecosystem.
#cryptomacro #etfflow #blockchainnews #marketanalysis #sol
85
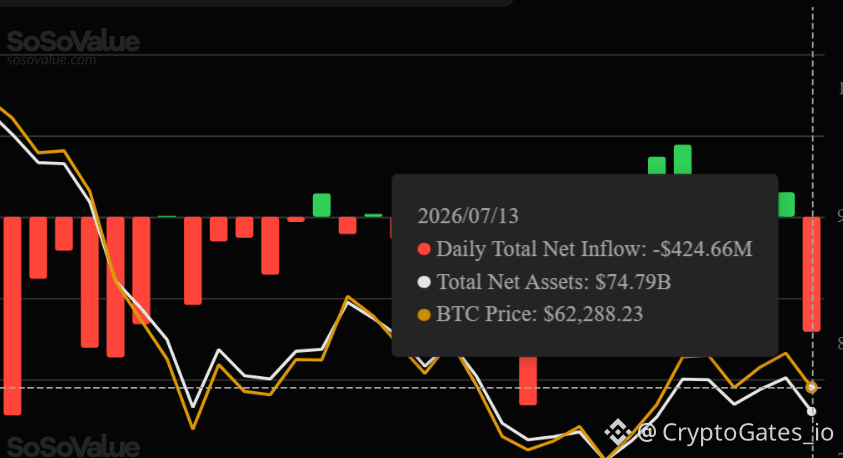
📊 BTC Spot ETF Flow — July 13, 2026
Net Outflow: -$424.66M
Total Net Assets: $74.79B
This outflow reverses the market's brief recovery attempt, signaling that institutional demand remains inconsistent rather than structurally confirmed.
One data point doesn't define a trend - this is exactly the kind of environment where scenario testing beats reacting to headlines.
#BTC #ETFFlow s #CryptoTrading
📊 BTC Spot ETF Flow — July 13, 2026
Net Outflow: -$424.66M
Total Net Assets: $74.79B
This outflow reverses the market's brief recovery attempt, signaling that institutional demand remains inconsistent rather than structurally confirmed.
One data point doesn't define a trend - this is exactly the kind of environment where scenario testing beats reacting to headlines.
#BTC #ETFFlow s #CryptoTrading
Net Outflow: -$424.66M
Total Net Assets: $74.79B
This outflow reverses the market's brief recovery attempt, signaling that institutional demand remains inconsistent rather than structurally confirmed.
One data point doesn't define a trend - this is exactly the kind of environment where scenario testing beats reacting to headlines.
#BTC #ETFFlow s #CryptoTrading
90

·
--
Article
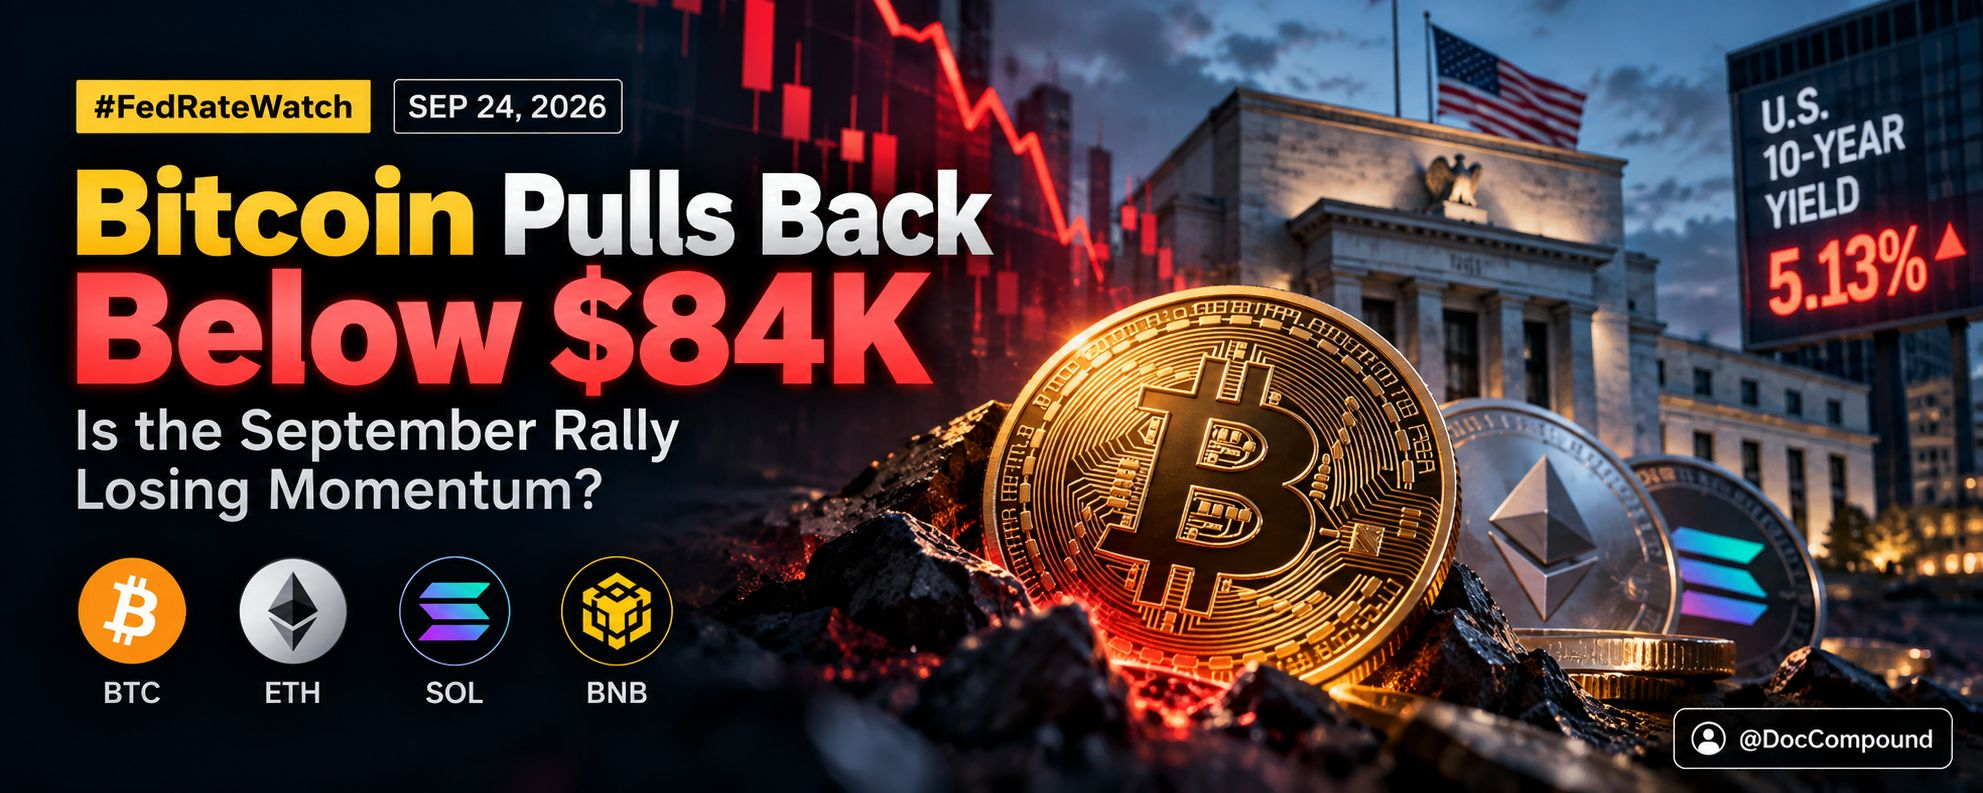
🚨 Bitcoin Pulls Back Below $84K: Is the September Rally Losing Momentum?🚨 Bitcoin Pulls Back Below $84K: Is the September Rally Losing Momentum?
September 24, 2026
Bitcoin recently climbed to an eight-month high above $87,000. Now, the market is facing a different test.
BTC has pulled back below $84,000 as U.S. Treasury yields rise, reminding investors that a strong rally does not eliminate macroeconomic risk.
The question is no longer simply how high Bitcoin can go.
Can the market sustain its recovery when financial conditions become less supportive?
Let's examine the developments that matter.
📊 1. THE MARKET SNAPSHOT
Today's market is showing signs of short-term weakness following a powerful recovery.
Approximate prices reported on September 24:
Asset Price. 24-hour change
BTC $83,923 -2.3%
ETH $2,674 -2.5%
BNB $769 -2.0%
SOL $115 -2.6%
Despite the daily declines, Bitcoin, Ethereum, and Solana remained up more than 10% over the preceding seven days in the reported snapshot.
The takeaway: A short-term correction can occur even while the broader weekly recovery remains intact.
🏦 2. THE MACRO FACTOR: TREASURY YIELDS
One of the most important developments is the rise in U.S. Treasury yields.
The 10-year Treasury yield reportedly reached approximately 5.13% intraday, its highest level since 2007.
Higher yields can make interest-bearing assets more attractive relative to riskier investments. They can also tighten financial conditions and influence investor appetite for speculative assets.
Bitcoin is not trading in isolation. Its relationship with broader technology stocks and risk sentiment remains important.
This is why I continue to monitor the Federal Reserve and Treasury markets alongside crypto price action.
💵 3. ETF INFLOWS: SUPPORT, BUT NOT A GUARANTEE
Institutional demand has been an important part of Bitcoin's September recovery.
U.S. spot Bitcoin ETFs reportedly attracted nearly $1 billion in a single session on Monday, September 21.
However, ETF inflows do not guarantee that prices will continue rising.
Investors should watch whether inflows persist during periods of weakness or begin to fade as prices retreat from recent highs.
Institutional demand matters, but its durability matters just as much.
⚠️ 4. LEVERAGE IS ANOTHER RISK TO WATCH
The recent rally was accompanied by substantial short liquidations...
While forced short covering can accelerate upward price movements, it does not necessarily represent the same kind of sustained demand as new spot buying.
Rising leverage can also amplify volatility when prices reverse.
That makes it important to distinguish between a rally supported by durable demand and one partly driven by traders being forced to close positions.
🔍 5. WHAT I'M WATCHING NEXT
Rather than trying to predict the next candle, I would monitor five developments:
IBitcoin price structure: Whether BTC stabilizes after its pullback
ETF flows: Whether institutional demand remains consistent
Treasury yields: Whether rising yields continue pressuring risk assets
Leverage: Whether speculative positioning becomes excessive
Ethereum and Solana: Whether they maintain relative strength during consolidation
These indicators can help distinguish a temporary correction from a more persistent deterioration in market conditions.
They are monitoring criteria, not guarantees of a particular outcome.
🧠 6. MY TAKE AS A DISCIPLINED ACCUMULATOR
I am not interested in chasing every breakout or treating every correction as a crisis.
My approach remains focused on systematic accumulation, capital preservation, and patience.
A strong rally does not mean risk has disappeared. A pullback does not automatically invalidate the broader investment thesis.
For long-term investors, the important questions are:
Has the underlying investment thesis changed?Is the portfolio appropriately sized for the risk?
Is the investment plan still sustainable?
Are decisions being driven by a strategy or by emotion?
My objective is not to predict every market movement. It is to build a process that can survive different market conditions.
🎯 FINAL THOUGHT
Bitcoin's September recovery has demonstrated that demand can return quickly when market sentiment improves.
But the latest pullback highlights the importance of liquidity, Treasury yields, institutional flows, and positioning.
The next phase deserves careful observation rather than assumptions based on recent price performance.
The market can move faster than our convictions. Discipline is what keeps the two from becoming a problem.
What are you watching most closely right now: Bitcoin's price structure, ETF flows, or the macroeconomic environment?
Share your perspective in the comments. 👇
— @DocCompound
#Bitcoin #Ethereum #BinanceSquare #ETFFlow #CryptoInvesting
Market figures are approximate and reflect published reports from September 24, 2026. This article is for informational purposes only and is not financial advice. Cryptocurrency investments involve substantial risk.
🚨 Bitcoin Pulls Back Below $84K: Is the September Rally Losing Momentum?
🚨 Bitcoin Pulls Back Below $84K: Is the September Rally Losing Momentum?
September 24, 2026
Bitcoin recently climbed to an eight-month high above $87,000. Now, the market is facing a different test.
BTC has pulled back below $84,000 as U.S. Treasury yields rise, reminding investors that a strong rally does not eliminate macroeconomic risk.
The question is no longer simply how high Bitcoin can go.
Can the market sustain its recovery when financial conditions become less supportive?
Let's examine the developments that matter.
📊 1. THE MARKET SNAPSHOT
Today's market is showing signs of short-term weakness following a powerful recovery.
Approximate prices reported on September 24:
Asset Price. 24-hour change
BTC $83,923 -2.3%
ETH $2,674 -2.5%
BNB $769 -2.0%
SOL $115 -2.6%
Despite the daily declines, Bitcoin, Ethereum, and Solana remained up more than 10% over the preceding seven days in the reported snapshot.
The takeaway: A short-term correction can occur even while the broader weekly recovery remains intact.
🏦 2. THE MACRO FACTOR: TREASURY YIELDS
One of the most important developments is the rise in U.S. Treasury yields.
The 10-year Treasury yield reportedly reached approximately 5.13% intraday, its highest level since 2007.
Higher yields can make interest-bearing assets more attractive relative to riskier investments. They can also tighten financial conditions and influence investor appetite for speculative assets.
Bitcoin is not trading in isolation. Its relationship with broader technology stocks and risk sentiment remains important.
This is why I continue to monitor the Federal Reserve and Treasury markets alongside crypto price action.
💵 3. ETF INFLOWS: SUPPORT, BUT NOT A GUARANTEE
Institutional demand has been an important part of Bitcoin's September recovery.
U.S. spot Bitcoin ETFs reportedly attracted nearly $1 billion in a single session on Monday, September 21.
However, ETF inflows do not guarantee that prices will continue rising.
Investors should watch whether inflows persist during periods of weakness or begin to fade as prices retreat from recent highs.
Institutional demand matters, but its durability matters just as much.
⚠️ 4. LEVERAGE IS ANOTHER RISK TO WATCH
The recent rally was accompanied by substantial short liquidations...
While forced short covering can accelerate upward price movements, it does not necessarily represent the same kind of sustained demand as new spot buying.
Rising leverage can also amplify volatility when prices reverse.
That makes it important to distinguish between a rally supported by durable demand and one partly driven by traders being forced to close positions.
🔍 5. WHAT I'M WATCHING NEXT
Rather than trying to predict the next candle, I would monitor five developments:
IBitcoin price structure: Whether BTC stabilizes after its pullback
ETF flows: Whether institutional demand remains consistent
Treasury yields: Whether rising yields continue pressuring risk assets
Leverage: Whether speculative positioning becomes excessive
Ethereum and Solana: Whether they maintain relative strength during consolidation
These indicators can help distinguish a temporary correction from a more persistent deterioration in market conditions.
They are monitoring criteria, not guarantees of a particular outcome.
🧠 6. MY TAKE AS A DISCIPLINED ACCUMULATOR
I am not interested in chasing every breakout or treating every correction as a crisis.
My approach remains focused on systematic accumulation, capital preservation, and patience.
A strong rally does not mean risk has disappeared. A pullback does not automatically invalidate the broader investment thesis.
For long-term investors, the important questions are:
Has the underlying investment thesis changed?Is the portfolio appropriately sized for the risk?
Is the investment plan still sustainable?
Are decisions being driven by a strategy or by emotion?
My objective is not to predict every market movement. It is to build a process that can survive different market conditions.
🎯 FINAL THOUGHT
Bitcoin's September recovery has demonstrated that demand can return quickly when market sentiment improves.
But the latest pullback highlights the importance of liquidity, Treasury yields, institutional flows, and positioning.
The next phase deserves careful observation rather than assumptions based on recent price performance.
The market can move faster than our convictions. Discipline is what keeps the two from becoming a problem.
What are you watching most closely right now: Bitcoin's price structure, ETF flows, or the macroeconomic environment?
Share your perspective in the comments. 👇
— @DocCompound
#Bitcoin #Ethereum #BinanceSquare #ETFFlow #CryptoInvesting
Market figures are approximate and reflect published reports from September 24, 2026. This article is for informational purposes only and is not financial advice. Cryptocurrency investments involve substantial risk.
September 24, 2026
Bitcoin recently climbed to an eight-month high above $87,000. Now, the market is facing a different test.
BTC has pulled back below $84,000 as U.S. Treasury yields rise, reminding investors that a strong rally does not eliminate macroeconomic risk.
The question is no longer simply how high Bitcoin can go.
Can the market sustain its recovery when financial conditions become less supportive?
Let's examine the developments that matter.
📊 1. THE MARKET SNAPSHOT
Today's market is showing signs of short-term weakness following a powerful recovery.
Approximate prices reported on September 24:
Asset Price. 24-hour change
BTC $83,923 -2.3%
ETH $2,674 -2.5%
BNB $769 -2.0%
SOL $115 -2.6%
Despite the daily declines, Bitcoin, Ethereum, and Solana remained up more than 10% over the preceding seven days in the reported snapshot.
The takeaway: A short-term correction can occur even while the broader weekly recovery remains intact.
🏦 2. THE MACRO FACTOR: TREASURY YIELDS
One of the most important developments is the rise in U.S. Treasury yields.
The 10-year Treasury yield reportedly reached approximately 5.13% intraday, its highest level since 2007.
Higher yields can make interest-bearing assets more attractive relative to riskier investments. They can also tighten financial conditions and influence investor appetite for speculative assets.
Bitcoin is not trading in isolation. Its relationship with broader technology stocks and risk sentiment remains important.
This is why I continue to monitor the Federal Reserve and Treasury markets alongside crypto price action.
💵 3. ETF INFLOWS: SUPPORT, BUT NOT A GUARANTEE
Institutional demand has been an important part of Bitcoin's September recovery.
U.S. spot Bitcoin ETFs reportedly attracted nearly $1 billion in a single session on Monday, September 21.
However, ETF inflows do not guarantee that prices will continue rising.
Investors should watch whether inflows persist during periods of weakness or begin to fade as prices retreat from recent highs.
Institutional demand matters, but its durability matters just as much.
⚠️ 4. LEVERAGE IS ANOTHER RISK TO WATCH
The recent rally was accompanied by substantial short liquidations...
While forced short covering can accelerate upward price movements, it does not necessarily represent the same kind of sustained demand as new spot buying.
Rising leverage can also amplify volatility when prices reverse.
That makes it important to distinguish between a rally supported by durable demand and one partly driven by traders being forced to close positions.
🔍 5. WHAT I'M WATCHING NEXT
Rather than trying to predict the next candle, I would monitor five developments:
IBitcoin price structure: Whether BTC stabilizes after its pullback
ETF flows: Whether institutional demand remains consistent
Treasury yields: Whether rising yields continue pressuring risk assets
Leverage: Whether speculative positioning becomes excessive
Ethereum and Solana: Whether they maintain relative strength during consolidation
These indicators can help distinguish a temporary correction from a more persistent deterioration in market conditions.
They are monitoring criteria, not guarantees of a particular outcome.
🧠 6. MY TAKE AS A DISCIPLINED ACCUMULATOR
I am not interested in chasing every breakout or treating every correction as a crisis.
My approach remains focused on systematic accumulation, capital preservation, and patience.
A strong rally does not mean risk has disappeared. A pullback does not automatically invalidate the broader investment thesis.
For long-term investors, the important questions are:
Has the underlying investment thesis changed?Is the portfolio appropriately sized for the risk?
Is the investment plan still sustainable?
Are decisions being driven by a strategy or by emotion?
My objective is not to predict every market movement. It is to build a process that can survive different market conditions.
🎯 FINAL THOUGHT
Bitcoin's September recovery has demonstrated that demand can return quickly when market sentiment improves.
But the latest pullback highlights the importance of liquidity, Treasury yields, institutional flows, and positioning.
The next phase deserves careful observation rather than assumptions based on recent price performance.
The market can move faster than our convictions. Discipline is what keeps the two from becoming a problem.
What are you watching most closely right now: Bitcoin's price structure, ETF flows, or the macroeconomic environment?
Share your perspective in the comments. 👇
— @DocCompound
#Bitcoin #Ethereum #BinanceSquare #ETFFlow #CryptoInvesting
Market figures are approximate and reflect published reports from September 24, 2026. This article is for informational purposes only and is not financial advice. Cryptocurrency investments involve substantial risk.
98

·
--
🚀 $BTC SURGES PAST $84K ON SHORT‑SQUEEZE & ETF INFLOW! 📈
🦈 A massive short‑squeeze wiped out roughly $262 M of bearish contracts, thrusting $BTC above the $84,000 mark in a single hour. The liquidation acted as a liquidity‑hunt catalyst, instantly flipping order flow from sellers to buyers. 📊
Meanwhile, spot‑ETF capital surged close to $1 B on the cash session, but the inflow lagged the price jump, merely reinforcing the rally rather than igniting it. This staggered timing signals that futures markets still lead the smart‑money narrative. 📌
Expect the next structural test around the $84k demand block; a clean retest could lock in the bullish bias, while a break below may expose lingering short‑covering pressure. 💬 Do you see the $84k zone as the next launchpad or a trap for lingering shorts? 👇
⚠️ Not financial advice. Always manage your risk. 🛡️
🏷️ #BTC #ShortSqueeze #ETFFlow #CryptoAnalysis
🔥 🦈
🚀 $BTC SURGES PAST $84K ON SHORT‑SQUEEZE & ETF INFLOW! 📈
🦈 A massive short‑squeeze wiped out roughly $262 M of bearish contracts, thrusting $BTC above the $84,000 mark in a single hour. The liquidation acted as a liquidity‑hunt catalyst, instantly flipping order flow from sellers to buyers. 📊
Meanwhile, spot‑ETF capital surged close to $1 B on the cash session, but the inflow lagged the price jump, merely reinforcing the rally rather than igniting it. This staggered timing signals that futures markets still lead the smart‑money narrative. 📌
Expect the next structural test around the $84k demand block; a clean retest could lock in the bullish bias, while a break below may expose lingering short‑covering pressure. 💬 Do you see the $84k zone as the next launchpad or a trap for lingering shorts? 👇
⚠️ Not financial advice. Always manage your risk. 🛡️
🏷️ #BTC #ShortSqueeze #ETFFlow #CryptoAnalysis
🔥 🦈
🦈 A massive short‑squeeze wiped out roughly $262 M of bearish contracts, thrusting $BTC above the $84,000 mark in a single hour. The liquidation acted as a liquidity‑hunt catalyst, instantly flipping order flow from sellers to buyers. 📊
Meanwhile, spot‑ETF capital surged close to $1 B on the cash session, but the inflow lagged the price jump, merely reinforcing the rally rather than igniting it. This staggered timing signals that futures markets still lead the smart‑money narrative. 📌
Expect the next structural test around the $84k demand block; a clean retest could lock in the bullish bias, while a break below may expose lingering short‑covering pressure. 💬 Do you see the $84k zone as the next launchpad or a trap for lingering shorts? 👇
⚠️ Not financial advice. Always manage your risk. 🛡️
🏷️ #BTC #ShortSqueeze #ETFFlow #CryptoAnalysis
🔥 🦈
25
·
--
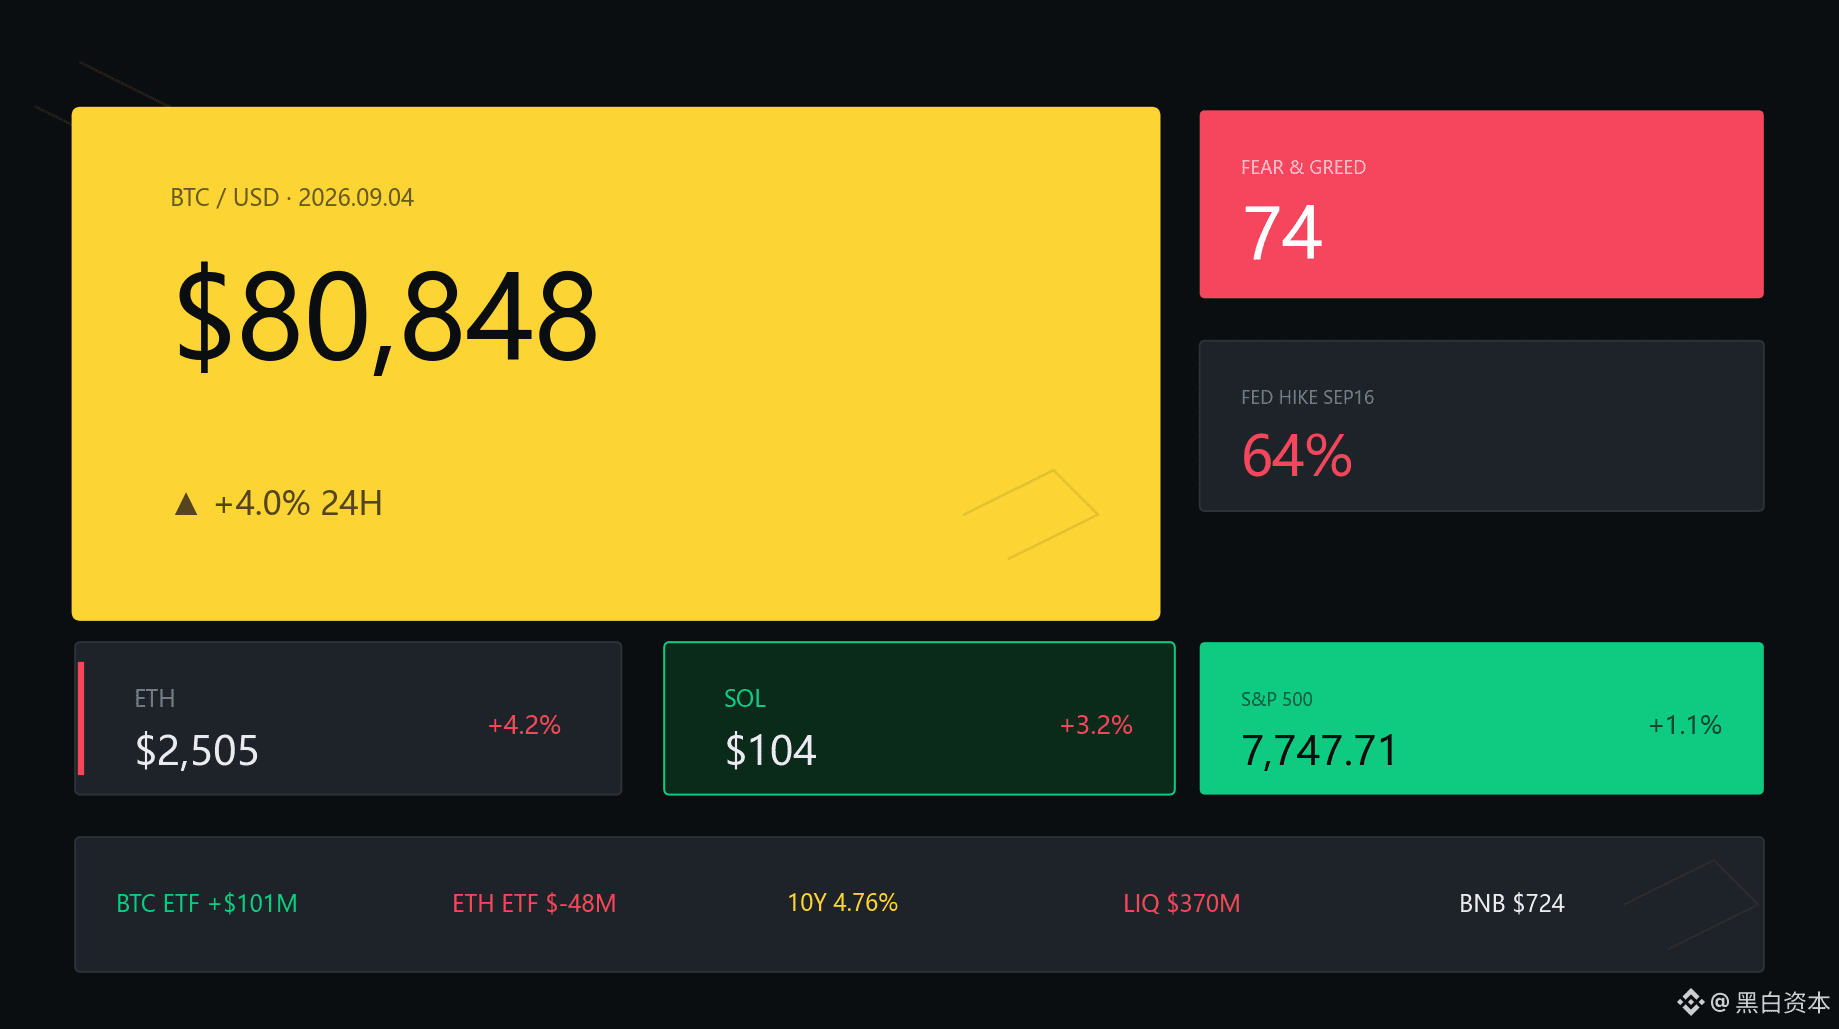
Money and prices are rising together, and in this kind of moment I actually feel the most nervous—because everyone is on the same side.
Overnight ETF ledger: BTC +$101M, ETH -$48M, total net inflow $53M.
In the past 24 hours, $370M was liquidated—82% of it was bets on the long side. Leverage hasn’t fully been cleared yet, so don’t rush to jump in.
Contract fee rate is 0%. No one wants to put up money—both longs and shorts are waiting for the other side to move first.
BTC is now $77,309 (+0.6%). I’m in fear/greed mode: 63, leaning toward greed. I’d only consider entries around $73,444; I won’t chase before $81,175.
Did you add positions or cut positions yesterday? Give me the numbers—I want to see which side the market is leaning toward right now.
$BTC #ETFFlow #LiquidationData
Money and prices are rising together, and in this kind of moment I actually feel the most nervous—because everyone is on the same side.
Overnight ETF ledger: BTC +$101M, ETH -$48M, total net inflow $53M.
In the past 24 hours, $370M was liquidated—82% of it was bets on the long side. Leverage hasn’t fully been cleared yet, so don’t rush to jump in.
Contract fee rate is 0%. No one wants to put up money—both longs and shorts are waiting for the other side to move first.
BTC is now $77,309 (+0.6%). I’m in fear/greed mode: 63, leaning toward greed. I’d only consider entries around $73,444; I won’t chase before $81,175.
Did you add positions or cut positions yesterday? Give me the numbers—I want to see which side the market is leaning toward right now.
$BTC #ETFFlow #LiquidationData
Overnight ETF ledger: BTC +$101M, ETH -$48M, total net inflow $53M.
In the past 24 hours, $370M was liquidated—82% of it was bets on the long side. Leverage hasn’t fully been cleared yet, so don’t rush to jump in.
Contract fee rate is 0%. No one wants to put up money—both longs and shorts are waiting for the other side to move first.
BTC is now $77,309 (+0.6%). I’m in fear/greed mode: 63, leaning toward greed. I’d only consider entries around $73,444; I won’t chase before $81,175.
Did you add positions or cut positions yesterday? Give me the numbers—I want to see which side the market is leaning toward right now.
$BTC #ETFFlow #LiquidationData

2
1
236
·
--
News itself isn’t worth much—the value lies in how the market reacts to it.
Today there wasn’t any news worth putting on the stage. The $77,309 BTC (+0.6%) movement is purely the market digesting its own positions.
I’ve never trade based on the headline. I trade based on the money. Over the past couple of days, ETF net inflows reached $53M. This number is more honest than any headline—money doesn’t lie; people do.
BTC $77,309 (+0.6%), fear-greed is 63—leaning greedy. Bad news that can’t be hammered down is the floor; good news that can’t be lifted is the top. What I’m watching right now is these two things.
After you read this news, what’s your first reaction—do you want to buy or to run?
$ETH #MacroAnalysis #ETFFlow
News itself isn’t worth much—the value lies in how the market reacts to it.
Today there wasn’t any news worth putting on the stage. The $77,309 BTC (+0.6%) movement is purely the market digesting its own positions.
I’ve never trade based on the headline. I trade based on the money. Over the past couple of days, ETF net inflows reached $53M. This number is more honest than any headline—money doesn’t lie; people do.
BTC $77,309 (+0.6%), fear-greed is 63—leaning greedy. Bad news that can’t be hammered down is the floor; good news that can’t be lifted is the top. What I’m watching right now is these two things.
After you read this news, what’s your first reaction—do you want to buy or to run?
$ETH #MacroAnalysis #ETFFlow
Today there wasn’t any news worth putting on the stage. The $77,309 BTC (+0.6%) movement is purely the market digesting its own positions.
I’ve never trade based on the headline. I trade based on the money. Over the past couple of days, ETF net inflows reached $53M. This number is more honest than any headline—money doesn’t lie; people do.
BTC $77,309 (+0.6%), fear-greed is 63—leaning greedy. Bad news that can’t be hammered down is the floor; good news that can’t be lifted is the top. What I’m watching right now is these two things.
After you read this news, what’s your first reaction—do you want to buy or to run?
$ETH #MacroAnalysis #ETFFlow

1
137
·
--
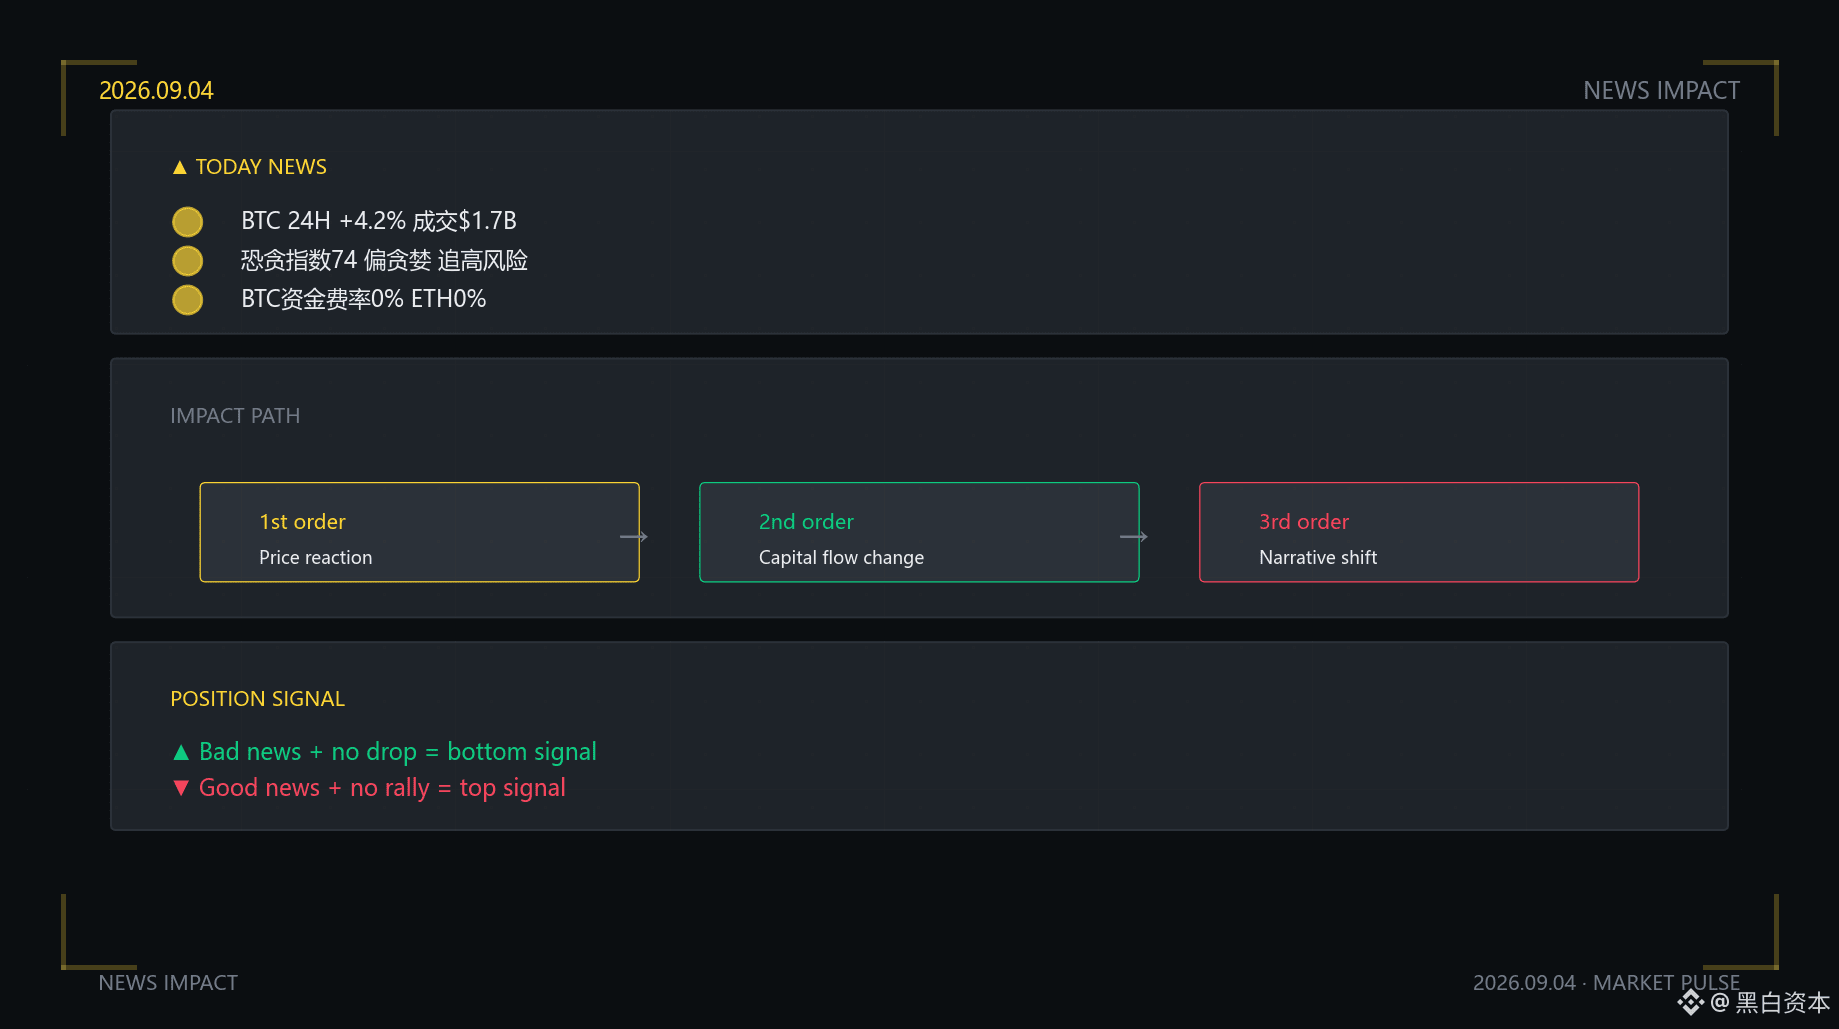
News Impact Analysis | 09.04
Today’s Focus
BTC $81,220 (+4.2%)
Fear and Greed 74, fee rate 0%
No major news; endogenous volatility in the market
Impact Pathway
First-order effect → price reacts immediately
Good news → up; bad news → down; this is the surface level
Second-order effect → changes in capital behavior
ETF inflows/outflows; fee-rate deviation; activity from large whales
Third-order effect → reshaping the narrative structure
Market narrative changes; medium-to-long-term trend turning point
Position Meaning
Bad news that doesn’t lead to a drop → a bottom signal; shorts are exhausted
Good news that doesn’t lead to a rise → a top signal; longs are exhausted
BTC $81,220 (+4.2%)
Net ETF inflow $53M
$ETH #MacroAnalysis #ETFFlow
News Impact Analysis | 09.04
Today’s Focus
BTC $81,220 (+4.2%)
Fear and Greed 74, fee rate 0%
No major news; endogenous volatility in the market
Impact Pathway
First-order effect → price reacts immediately
Good news → up; bad news → down; this is the surface level
Second-order effect → changes in capital behavior
ETF inflows/outflows; fee-rate deviation; activity from large whales
Third-order effect → reshaping the narrative structure
Market narrative changes; medium-to-long-term trend turning point
Position Meaning
Bad news that doesn’t lead to a drop → a bottom signal; shorts are exhausted
Good news that doesn’t lead to a rise → a top signal; longs are exhausted
BTC $81,220 (+4.2%)
Net ETF inflow $53M
$ETH #MacroAnalysis #ETFFlow
Today’s Focus
BTC $81,220 (+4.2%)
Fear and Greed 74, fee rate 0%
No major news; endogenous volatility in the market
Impact Pathway
First-order effect → price reacts immediately
Good news → up; bad news → down; this is the surface level
Second-order effect → changes in capital behavior
ETF inflows/outflows; fee-rate deviation; activity from large whales
Third-order effect → reshaping the narrative structure
Market narrative changes; medium-to-long-term trend turning point
Position Meaning
Bad news that doesn’t lead to a drop → a bottom signal; shorts are exhausted
Good news that doesn’t lead to a rise → a top signal; longs are exhausted
BTC $81,220 (+4.2%)
Net ETF inflow $53M
$ETH #MacroAnalysis #ETFFlow
387

·
--
🚀 $BTC BULLISH SURGE DRIVEN BY $1B ETF INFLOWS! 🦈
Institutional capital is still chasing BTC – nearly $1 B surged into U.S. spot Bitcoin ETFs last week, with BlackRock’s IBIT alone soaking up $691.5 M. 🦈 This three‑week streak of net inflows signals deep‑pocketed demand that’s now anchoring the market around the $80 K‑$83 K corridor.
Technical eyes are glued to the $82,793 resistance ceiling. A clean break could unlock a swing toward $90 K, while a failure will keep BTC boxed in, letting macro‑rate pressure dictate the next leg. 📊 Volume on the top‑tier exchange has already swelled to $14.5 B, suggesting order flow is ready to absorb a sell‑off if the breakout holds. ⚡
💬 Will the ETF‑fuelled buying punch through the $82.8K barrier or will macro headwinds force a retrace? 👇
⚠️ Not financial advice. Always manage your risk. 🛡️
🏷️ #BTC #ETFFlow #InstitutionalDemand #BTCBreakout #Crypto
🔥 💎
🚀 $BTC BULLISH SURGE DRIVEN BY $1B ETF INFLOWS! 🦈
Institutional capital is still chasing BTC – nearly $1 B surged into U.S. spot Bitcoin ETFs last week, with BlackRock’s IBIT alone soaking up $691.5 M. 🦈 This three‑week streak of net inflows signals deep‑pocketed demand that’s now anchoring the market around the $80 K‑$83 K corridor.
Technical eyes are glued to the $82,793 resistance ceiling. A clean break could unlock a swing toward $90 K, while a failure will keep BTC boxed in, letting macro‑rate pressure dictate the next leg. 📊 Volume on the top‑tier exchange has already swelled to $14.5 B, suggesting order flow is ready to absorb a sell‑off if the breakout holds. ⚡
💬 Will the ETF‑fuelled buying punch through the $82.8K barrier or will macro headwinds force a retrace? 👇
⚠️ Not financial advice. Always manage your risk. 🛡️
🏷️ #BTC #ETFFlow #InstitutionalDemand #BTCBreakout #Crypto
🔥 💎
Institutional capital is still chasing BTC – nearly $1 B surged into U.S. spot Bitcoin ETFs last week, with BlackRock’s IBIT alone soaking up $691.5 M. 🦈 This three‑week streak of net inflows signals deep‑pocketed demand that’s now anchoring the market around the $80 K‑$83 K corridor.
Technical eyes are glued to the $82,793 resistance ceiling. A clean break could unlock a swing toward $90 K, while a failure will keep BTC boxed in, letting macro‑rate pressure dictate the next leg. 📊 Volume on the top‑tier exchange has already swelled to $14.5 B, suggesting order flow is ready to absorb a sell‑off if the breakout holds. ⚡
💬 Will the ETF‑fuelled buying punch through the $82.8K barrier or will macro headwinds force a retrace? 👇
⚠️ Not financial advice. Always manage your risk. 🛡️
🏷️ #BTC #ETFFlow #InstitutionalDemand #BTCBreakout #Crypto
🔥 💎
18
Log in to explore more content
Join global crypto users on Binance Square
⚡️ Get latest and useful information about crypto.
💬 Trusted by the world’s largest crypto exchange.
👍 Discover real insights from verified creators.
Email / Phone number
Trending Topics
1
#BinanceWillListHyperliquid(HYPE)
28,059 views
768 Discussing
2
#FedOctoberRateHikeOddsRiseTo69.7%
978 views
98 Discussing
3
#BitcoinFallsBelow$83,000
1,366 views
20 Discussing
4
#BitcoinFallsToAround$84,600ThisWeek
0 views
0 Discussing
5
#US30YearYieldHighestSince2004
4,165 views
154 Discussing
6
#ETHBreaksAbove$2,700
757 views
20 Discussing
7
#USWeighsPromotingDollarStablecoinsAbroad
29,783 views
974 Discussing
8
#US10YTreasuryYieldHits19YearHigh
27,511 views
748 Discussing
9
#SpotBitcoinETFsInflow$2.31BInFourDays
4,118 views
59 Discussing
10
#BitcoinRejectedAt$87,300Twice
0 views
0 Discussing