cryptoquant

463,431 views
1,424 Discussing
AbJr Binancian
·
--
Article
How to Check Exchange Reserves and Fund Flows Without Trusting the ExchangeIf you want to understand an exchange, don't rely on just one source of information. Cryptocurrency exchanges publish information about their reserves, trading activity and platform performance. But investors do not have to depend entirely on exchange announcements to understand what is happening. Independent blockchain analytics providers, market-data platforms and research organizations offer tools that can help users examine exchange activity from different perspectives. The objective is not to find one perfect dashboard. It is to combine independent sources and understand what each one actually measures. Here are three useful platforms to start with. 1. CryptoQuant: Track Exchange Reserves and Netflows <text color="secondary" size="xs">Platform: On-chain analytics</text> CryptoQuant provides on-chain data and market indicators that help users examine cryptocurrency movements. Two particularly useful metrics are: Exchange Reserves This indicator estimates the amount of cryptocurrency held in wallets attributed to exchanges. Investors can monitor changes over time to identify whether estimated exchange-held balances are increasing or decreasing. Exchange Netflows Netflows help identify the difference between cryptocurrency entering and leaving exchange wallets. This can provide useful context when evaluating market movements. For example, a period of substantial outflows may indicate that assets are leaving exchange-associated wallets. However, this does not automatically prove that investors are accumulating. Transfers between exchanges, wallet reorganizations and changes in custody arrangements can also influence the figures. How to use it: Visit CryptoQuant.Select the cryptocurrency you want to analyze.Open the relevant exchange reserve or netflow chart.Select the exchange and time period where available.Compare the movement with price, trading volume and other market indicators. 2. Kaiko: Understand Liquidity Beyond Trading Volume <text color="secondary" size="xs">Platform: Institutional market data</text> Trading volume is one of the most commonly reported exchange metrics. But it does not tell the entire story. Kaiko provides market-quality data that can help investors examine how efficiently assets can be traded. Three indicators are particularly important. Order-book depth Shows how much buying and selling interest is available around the current market price. Greater depth can help larger orders execute without significantly moving the market. Bid-ask spread Shows the difference between the best available buy and sell prices. A smaller spread generally indicates better immediate trading conditions. Slippage Measures how much the execution price differs from the expected price. This is especially important for larger trades and during periods of volatility. How to use it: Visit Kaiko's market-data resources.Select the asset and trading pair.Examine available market-depth and spread information.Compare equivalent trading pairs across exchanges.Review the same time periods to avoid misleading comparisons. 3. The Block: Monitor Derivatives and Market Structure <text color="secondary" size="xs">Platform: Cryptocurrency research and data</text> The Block provides cryptocurrency research, market statistics and derivatives-related data. This can help investors understand market activity beyond spot trading. Useful indicators include: Futures trading volume Shows the reported value of derivatives contracts traded during a given period. Open interest Measures the outstanding value of derivatives contracts that remain open. Exchange market share Provides context on how trading activity is distributed across different market participants and platforms, subject to the methodology and coverage of the data. These metrics can help investors understand whether market activity is concentrated in spot markets or derivatives. However, rising derivatives volume or open interest does not automatically indicate positive or negative market sentiment. 4. How to Combine These Three Sources Each platform answers a different question. The most useful approach is to examine the same asset, exchange and time period wherever possible. For example, imagine an exchange reports a significant increase in trading activity. Instead of immediately interpreting this as growing market confidence, examine: Whether exchange reserves are increasing or decreasing.Whether the movement is accompanied by meaningful netflows.Whether order-book depth is improving.Whether bid-ask spreads remain competitive.Whether derivatives open interest is expanding. This creates a more complete picture of market conditions. 5. Important Limitations to Remember Independent data is valuable, but it is not automatically perfect. Analytics providers use different methodologies, wallet-attribution systems and data coverage. Some exchange wallets may not be identified correctly, while internal transfers can create movements that do not represent customer deposits or withdrawals. Market-data coverage can also differ between providers. Most importantly, on-chain reserves do not independently establish an exchange's complete financial position or prove that all customer liabilities are covered. For that, users should also examine official Proof of Reserves reports, liability methodologies and available independent assurance. Final Thoughts: Verify From More Than One Direction Understanding an exchange requires more than reading its announcements or looking at a single reserve chart. CryptoQuant helps examine on-chain reserves and fund movements. Kaiko provides tools to evaluate market quality and liquidity. The Block offers additional visibility into derivatives and market structure. Together, these sources provide a broader analytical framework for understanding cryptocurrency exchanges. The goal isn't to trust one dashboard more than another. It's to build your own conclusion from evidence that can be independently examined. #Binance #CryptoQuant #Kaiko #TheBlock #ExchangeTransparency

How to Check Exchange Reserves and Fund Flows Without Trusting the Exchange

If you want to understand an exchange, don't rely on just one source of information.
Cryptocurrency exchanges publish information about their reserves, trading activity and platform performance.
But investors do not have to depend entirely on exchange announcements to understand what is happening.
Independent blockchain analytics providers, market-data platforms and research organizations offer tools that can help users examine exchange activity from different perspectives. The objective is not to find one perfect dashboard.
It is to combine independent sources and understand what each one actually measures.
Here are three useful platforms to start with.
1. CryptoQuant: Track Exchange Reserves and Netflows
<text color="secondary" size="xs">Platform: On-chain analytics</text>
CryptoQuant provides on-chain data and market indicators that help users examine cryptocurrency movements.
Two particularly useful metrics are:
Exchange Reserves
This indicator estimates the amount of cryptocurrency held in wallets attributed to exchanges.
Investors can monitor changes over time to identify whether estimated exchange-held balances are increasing or decreasing.
Exchange Netflows
Netflows help identify the difference between cryptocurrency entering and leaving exchange wallets.
This can provide useful context when evaluating market movements.
For example, a period of substantial outflows may indicate that assets are leaving exchange-associated wallets.
However, this does not automatically prove that investors are accumulating.
Transfers between exchanges, wallet reorganizations and changes in custody arrangements can also influence the figures.
How to use it:
Visit CryptoQuant.Select the cryptocurrency you want to analyze.Open the relevant exchange reserve or netflow chart.Select the exchange and time period where available.Compare the movement with price, trading volume and other market indicators.
2. Kaiko: Understand Liquidity Beyond Trading Volume
<text color="secondary" size="xs">Platform: Institutional market data</text>
Trading volume is one of the most commonly reported exchange metrics. But it does not tell the entire story.
Kaiko provides market-quality data that can help investors examine how efficiently assets can be traded.
Three indicators are particularly important.
Order-book depth
Shows how much buying and selling interest is available around the current market price.
Greater depth can help larger orders execute without significantly moving the market.
Bid-ask spread
Shows the difference between the best available buy and sell prices.
A smaller spread generally indicates better immediate trading conditions.
Slippage
Measures how much the execution price differs from the expected price.
This is especially important for larger trades and during periods of volatility.
How to use it:
Visit Kaiko's market-data resources.Select the asset and trading pair.Examine available market-depth and spread information.Compare equivalent trading pairs across exchanges.Review the same time periods to avoid misleading comparisons.
3. The Block: Monitor Derivatives and Market Structure
<text color="secondary" size="xs">Platform: Cryptocurrency research and data</text>
The Block provides cryptocurrency research, market statistics and derivatives-related data.
This can help investors understand market activity beyond spot trading.
Useful indicators include:
Futures trading volume
Shows the reported value of derivatives contracts traded during a given period.
Open interest
Measures the outstanding value of derivatives contracts that remain open.
Exchange market share
Provides context on how trading activity is distributed across different market participants and platforms, subject to the methodology and coverage of the data.
These metrics can help investors understand whether market activity is concentrated in spot markets or derivatives.
However, rising derivatives volume or open interest does not automatically indicate positive or negative market sentiment.
4. How to Combine These Three Sources
Each platform answers a different question.
The most useful approach is to examine the same asset, exchange and time period wherever possible.
For example, imagine an exchange reports a significant increase in trading activity.
Instead of immediately interpreting this as growing market confidence, examine:
Whether exchange reserves are increasing or decreasing.Whether the movement is accompanied by meaningful netflows.Whether order-book depth is improving.Whether bid-ask spreads remain competitive.Whether derivatives open interest is expanding.
This creates a more complete picture of market conditions.
5. Important Limitations to Remember
Independent data is valuable, but it is not automatically perfect.
Analytics providers use different methodologies, wallet-attribution systems and data coverage.
Some exchange wallets may not be identified correctly, while internal transfers can create movements that do not represent customer deposits or withdrawals.
Market-data coverage can also differ between providers.
Most importantly, on-chain reserves do not independently establish an exchange's complete financial position or prove that all customer liabilities are covered.
For that, users should also examine official Proof of Reserves reports, liability methodologies and available independent assurance.
Final Thoughts: Verify From More Than One Direction
Understanding an exchange requires more than reading its announcements or looking at a single reserve chart.
CryptoQuant helps examine on-chain reserves and fund movements.
Kaiko provides tools to evaluate market quality and liquidity.
The Block offers additional visibility into derivatives and market structure.
Together, these sources provide a broader analytical framework for understanding cryptocurrency exchanges.
The goal isn't to trust one dashboard more than another. It's to build your own conclusion from evidence that can be independently examined.
#Binance #CryptoQuant #Kaiko #TheBlock #ExchangeTransparency

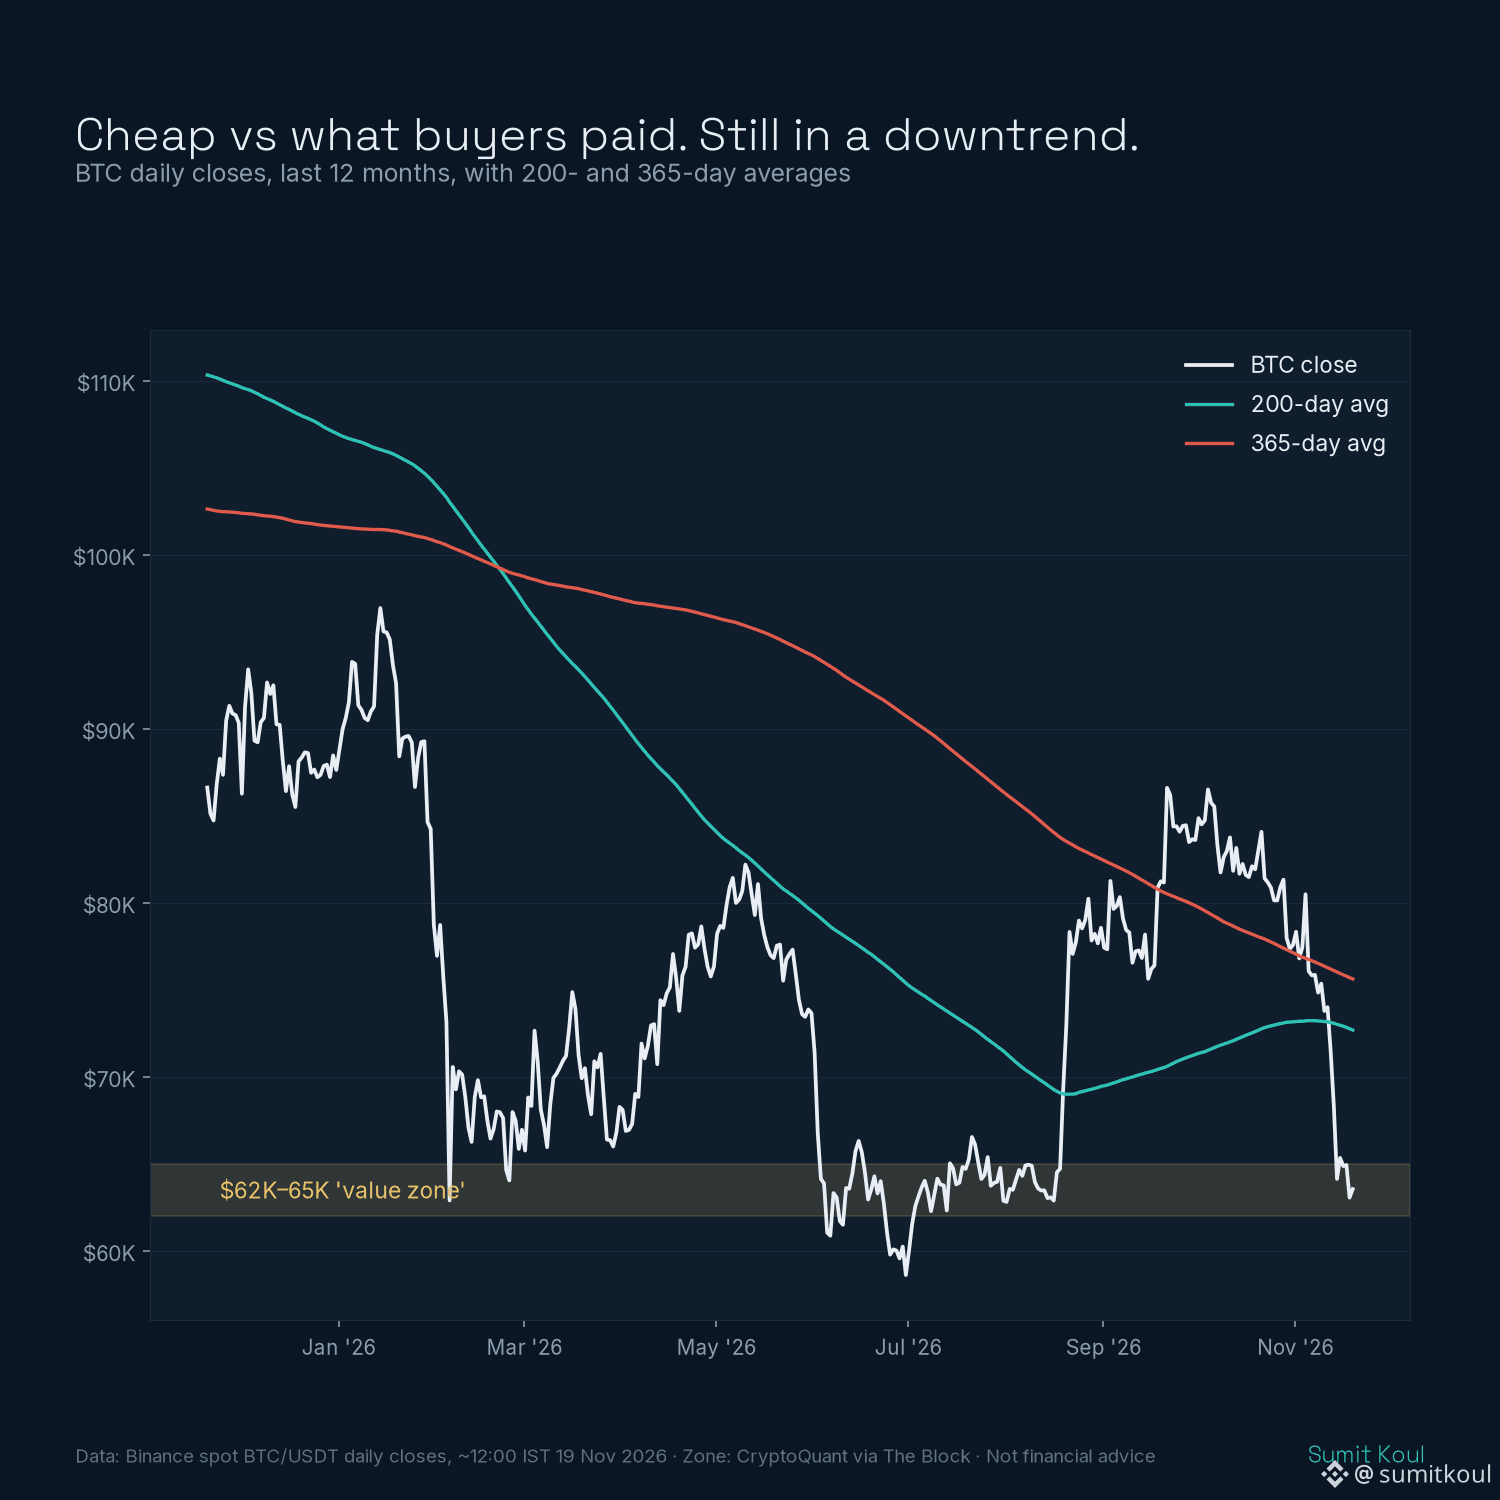
CryptoQuant says $BTC is in a "bear phase" and a "value zone" at the same time. Both can be true. 🧭 📉 BTC ~$63.5K is ~13% under its 200-day average (~$72.7K on Binance closes) 💸 Recent buyers sit at about −20% unrealized, the worst since July 🎯 $62K–65K is the band CryptoQuant expects recent buyers to defend Meanwhile Binance BTCUSDT open interest rose ~3.6% in 24h and longs are paying funding. What would confirm a bottom, and what would break it 👉 https://www.binance.com/en/square/post/389854650658027 #Bitcoin #CryptoQuant #MarketUpdate Not financial advice.
CryptoQuant says $BTC is in a "bear phase" and a "value zone" at the same time. Both can be true. 🧭

📉 BTC ~$63.5K is ~13% under its 200-day average (~$72.7K on Binance closes)
💸 Recent buyers sit at about −20% unrealized, the worst since July
🎯 $62K–65K is the band CryptoQuant expects recent buyers to defend

Meanwhile Binance BTCUSDT open interest rose ~3.6% in 24h and longs are paying funding.

What would confirm a bottom, and what would break it 👉 https://www.binance.com/en/square/post/389854650658027

#Bitcoin #CryptoQuant #MarketUpdate
Not financial advice.
$BTC is officially back in a bearish phase according to CryptoQuant, but there's a twist I actually like. Per The Block, CryptoQuant notes Bitcoin is trading below its 200-day and 365-day moving averages (around $72,900 and $75,900), and 30-day demand growth has dropped below -400,000 BTC, the weakest since early July. At the same time, traders' unrealized losses hit about 20%, which the firm calls a "value zone". My read: the value zone tag isn't a buy signal by itself. CryptoQuant says these bottoming periods have usually taken at least two months to form, so I'm not expecting a V. Until $BTC reclaims those averages, rallies look like places where trapped longs get out. Are you scaling in slowly here, or waiting for the 200-day reclaim first? Source: The Block, CryptoQuant. NFA, just my take. #BTC #Bitcoin #CryptoQuant #CryptoNews
$BTC is officially back in a bearish phase according to CryptoQuant, but there's a twist I actually like.

Per The Block, CryptoQuant notes Bitcoin is trading below its 200-day and 365-day moving averages (around $72,900 and $75,900), and 30-day demand growth has dropped below -400,000 BTC, the weakest since early July. At the same time, traders' unrealized losses hit about 20%, which the firm calls a "value zone".

My read: the value zone tag isn't a buy signal by itself. CryptoQuant says these bottoming periods have usually taken at least two months to form, so I'm not expecting a V. Until $BTC reclaims those averages, rallies look like places where trapped longs get out.

Are you scaling in slowly here, or waiting for the 200-day reclaim first?

Source: The Block, CryptoQuant. NFA, just my take.
#BTC #Bitcoin #CryptoQuant #CryptoNews
Demand is the real vote with money. CryptoQuant data shows that apparent demand for $BTC fell to -255,000 coins, its lowest level since 2026. It had previously dipped below -290,000, far below the monthly average of -172,000. Put simply, nobody is willing to catch the falling knife right now; everyone is waiting for lower prices. The price action confirms it: on November 18, $BTC retested $62,000, returning to the levels seen during July’s crash. It briefly bounced to $63,800, then ran out of steam. What’s interesting, though, is that demand bottoming out often means sentiment isn’t far from bottoming out either. When fear is at its most intense, that’s often when weak hands get shaken out. The $62,000 level has held twice now. Do you think this is the real bottom, or just halfway down? #比特币 #BTC #CryptoQuant
Demand is the real vote with money. CryptoQuant data shows that apparent demand for $BTC fell to -255,000 coins, its lowest level since 2026. It had previously dipped below -290,000, far below the monthly average of -172,000. Put simply, nobody is willing to catch the falling knife right now; everyone is waiting for lower prices. The price action confirms it: on November 18, $BTC retested $62,000, returning to the levels seen during July’s crash. It briefly bounced to $63,800, then ran out of steam.

What’s interesting, though, is that demand bottoming out often means sentiment isn’t far from bottoming out either. When fear is at its most intense, that’s often when weak hands get shaken out. The $62,000 level has held twice now. Do you think this is the real bottom, or just halfway down?

#比特币 #BTC #CryptoQuant
$BTC short-term traders are the deepest underwater since July, according to CryptoQuant. BTC trades about 20% below their average cost, the widest gap since July 1. Holders realized a net loss of 25,800 BTC on the worst day of the slide. CryptoQuant calls it a "value zone" but says that does not mean the decline is over. Nearest support they see is $62K to $65K. I'm treating it as information, not a signal. What about you, cheap or still falling? Click here to Trade 👇️ $BTC {future}(BTCUSDT) {spot}(BTCUSDT) #bitcoin #CryptoQuant
$BTC short-term traders are the deepest underwater since July, according to CryptoQuant.

BTC trades about 20% below their average cost, the widest gap since July 1.

Holders realized a net loss of 25,800 BTC on the worst day of the slide.

CryptoQuant calls it a "value zone" but says that does not mean the decline is over.

Nearest support they see is $62K to $65K.

I'm treating it as information, not a signal.

What about you, cheap or still falling?

Click here to Trade 👇️
$BTC

#bitcoin #CryptoQuant
Bitcoin ETF Outflows Reach $240M as Bearish Trend Signals Bitcoin ETF outflows resumed with $240M exiting the market. CryptoQuant data signals a transition into a bearish market phase, marking a significant shift in institutional sentiment. #BitcoinETF #CryptoQuant ‎
Bitcoin ETF Outflows Reach $240M as Bearish Trend Signals

Bitcoin ETF outflows resumed with $240M exiting the market. CryptoQuant data signals a transition into a bearish market phase, marking a significant shift in institutional sentiment.

#BitcoinETF #CryptoQuant ‎
🚨 IS BITCOIN LEAVING THE BEAR MARKET BEHIND? A CryptoQuant analysis detected a signal that has historically appeared near the end of BTC bear markets. 📊 🔹 The supply in profit and loss diverged again. 🔹 Nearly 69% of BTC was in profit. 🔹 The 2026 bottom was less severe than previous ones. 🔹 Bitcoin did not fall below its realized price. Could this be a sign of a cycle recovery? 👀 Although the indicators are encouraging, it doesn’t mean the decline is definitively over. The market may still see significant corrections. 📈 Are we witnessing the start of a new bull phase, or is another drop still to come? #Bitcoin #BTC #CryptoQuant $ETH , $BTC ,$BNB
🚨 IS BITCOIN LEAVING THE BEAR MARKET BEHIND?
A CryptoQuant analysis detected a signal that has historically appeared near the end of BTC bear markets. 📊
🔹 The supply in profit and loss diverged again. 🔹 Nearly 69% of BTC was in profit. 🔹 The 2026 bottom was less severe than previous ones. 🔹 Bitcoin did not fall below its realized price.
Could this be a sign of a cycle recovery? 👀
Although the indicators are encouraging, it doesn’t mean the decline is definitively over. The market may still see significant corrections.
📈 Are we witnessing the start of a new bull phase, or is another drop still to come?
#Bitcoin #BTC #CryptoQuant $ETH , $BTC ,$BNB
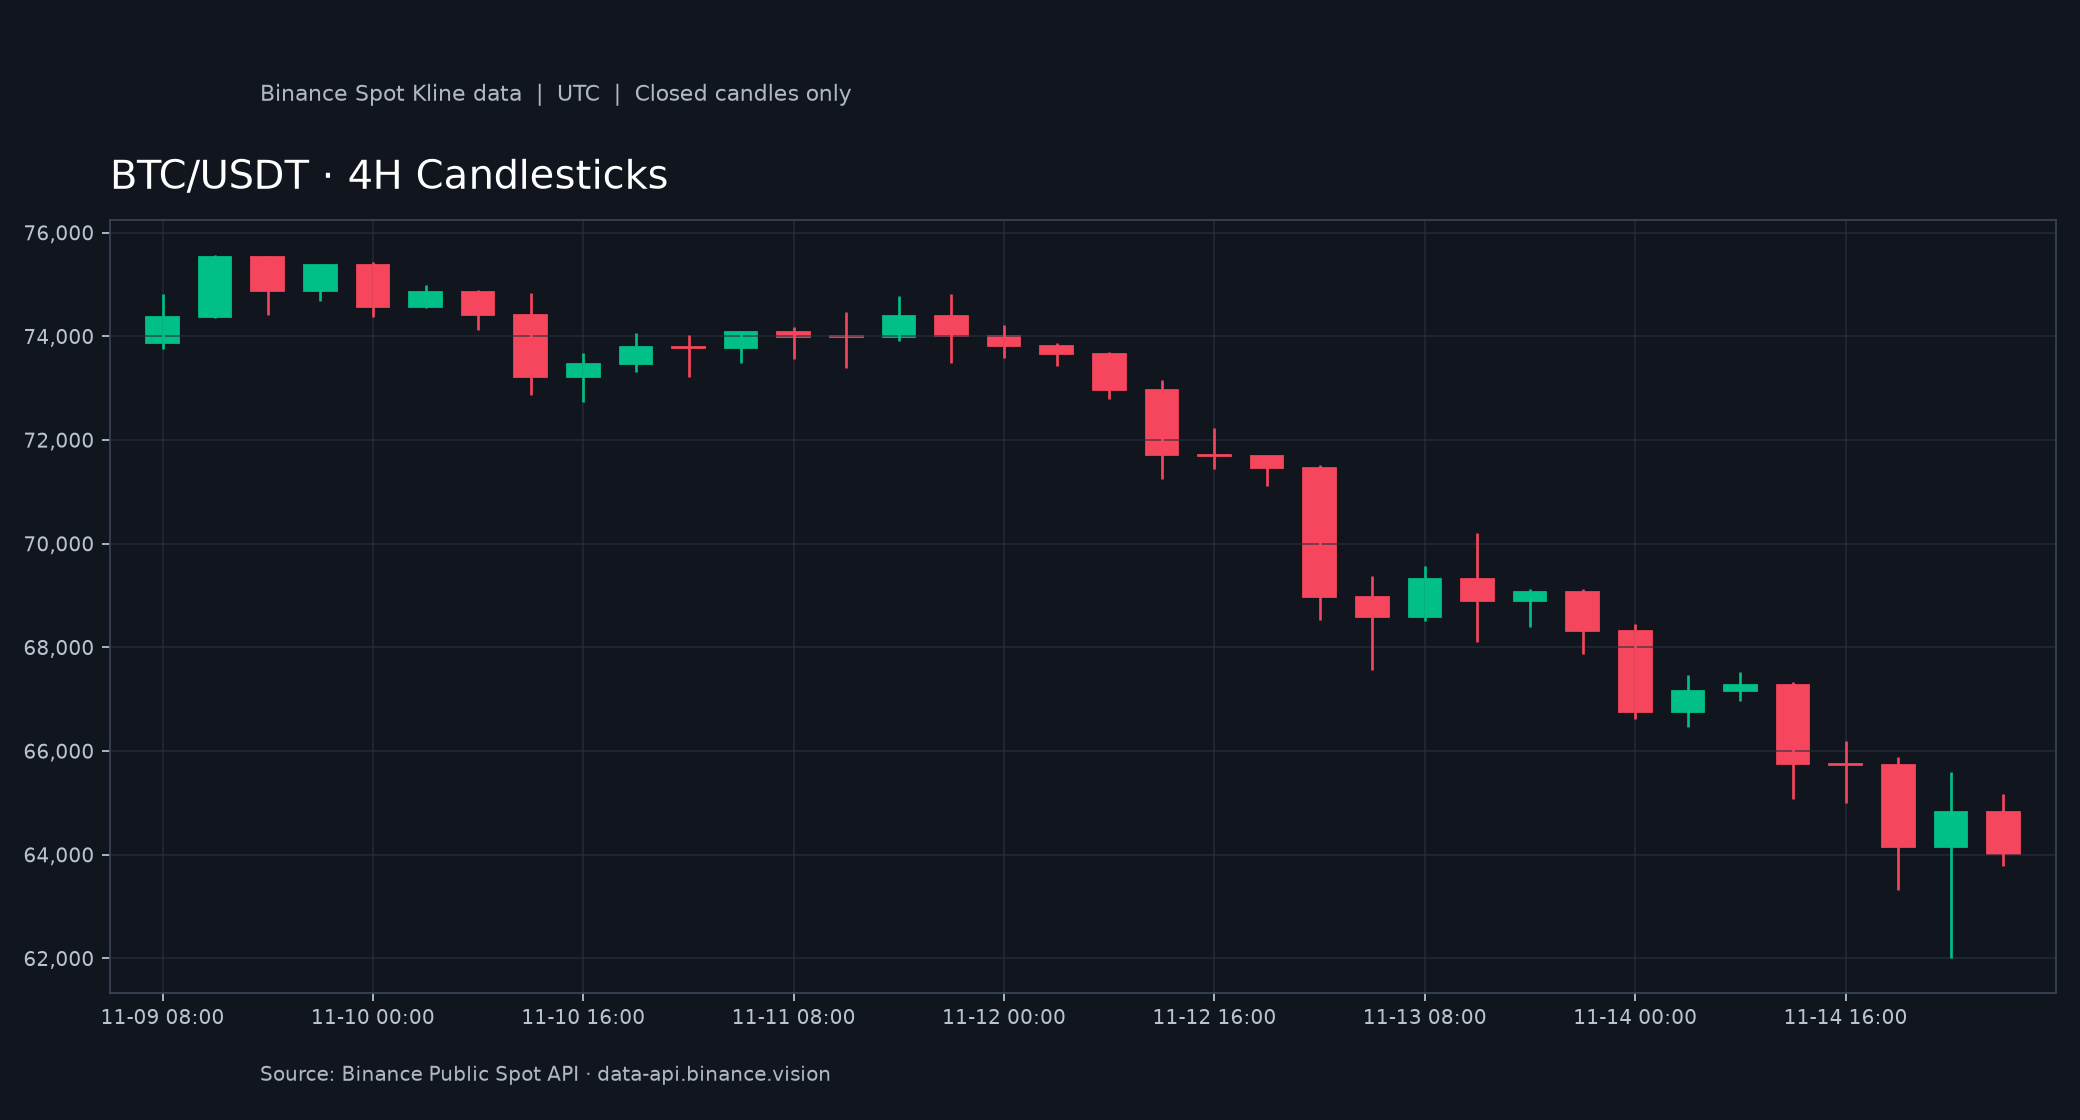
“Bear-market phase” and “value zone” appearing in the same report isn’t a contradiction—it’s a matter of timing. A Tuesday report from CryptoQuant: BTC fell below the 200-day moving average at $72,900 and the 365-day moving average at $75,900, returning to a bear-market phase. 30-day aggregate demand growth fell below -400,000 BTC, its fastest contraction since July 1. Traders’ unrealized profit and loss was -20%, the lowest since July 1. On November 17, net realized losses totaled 25,800 BTC—the most since July 13. That’s what the report means by a “value zone”: losses have become deep enough. The Bull-Bear Score was just 10 out of 100, and briefly hit zero on November 10, when BTC was still at $74,000. The share of analysts with a bullish consensus was 58%, the lowest in a year. Citi piled on Wednesday: it slashed its 12-month price target from $113,000 to $99,500, citing the same on-chain signals—breaking below the 200-day moving average, ETF flows turning negative for the year, and ETH seeing seven consecutive weeks of outflows. BTC is currently around $62,600, down 2.5% in 24 hours and 15.2% over seven days, just about $580 above Saturday’s low of $62,000. The Fear and Greed Index is at 10: Extreme Fear. My take: separate the level from the direction. “Value zone” describes the level; losses of 20% indicate that selling pressure is already intense. “Bear-market phase” describes the direction: demand is still contracting at its fastest pace since July, and there are no buyers stepping in. Cheap doesn’t mean it’s bottomed. The key point is that Citi’s “price cut” isn’t all that bearish: its $99,500 target is still about 59% above the current price. It cut its short-term outlook for fund flows to neutral, not its 12-month outlook—it had raised its target from $82,000 to $113,000 just a month and a half ago. Wall Street and on-chain analysts are focused on the same trigger this time: the 200-day moving average. What to watch next: whether 30-day demand growth can get back near zero—and it needs to be a return of spot buying, not leveraged perpetual futures positions. That’s the recovery condition CryptoQuant itself laid out. Also watch Wednesday’s final ETF flow figures (IBIT hasn’t reported yet), and whether $62,000 holds. Two scenarios: if demand stops contracting, the first level to watch is the 200-day moving average at $72,900; if demand keeps shrinking, $61,800—the lower end of the range cited by Bitfinex—is the next stop. Which do you think will come first this time: “demand stops contracting” or “$62,000 breaks”? Are you waiting for a signal of spot buying, or have you already started buying in batches? $BTC $ETH #比特币 #CryptoQuant #ETF The above is for market information only and does not constitute investment advice.
“Bear-market phase” and “value zone” appearing in the same report isn’t a contradiction—it’s a matter of timing.

A Tuesday report from CryptoQuant: BTC fell below the 200-day moving average at $72,900 and the 365-day moving average at $75,900, returning to a bear-market phase. 30-day aggregate demand growth fell below -400,000 BTC, its fastest contraction since July 1.
Traders’ unrealized profit and loss was -20%, the lowest since July 1. On November 17, net realized losses totaled 25,800 BTC—the most since July 13. That’s what the report means by a “value zone”: losses have become deep enough.
The Bull-Bear Score was just 10 out of 100, and briefly hit zero on November 10, when BTC was still at $74,000. The share of analysts with a bullish consensus was 58%, the lowest in a year.
Citi piled on Wednesday: it slashed its 12-month price target from $113,000 to $99,500, citing the same on-chain signals—breaking below the 200-day moving average, ETF flows turning negative for the year, and ETH seeing seven consecutive weeks of outflows.
BTC is currently around $62,600, down 2.5% in 24 hours and 15.2% over seven days, just about $580 above Saturday’s low of $62,000. The Fear and Greed Index is at 10: Extreme Fear.

My take: separate the level from the direction. “Value zone” describes the level; losses of 20% indicate that selling pressure is already intense. “Bear-market phase” describes the direction: demand is still contracting at its fastest pace since July, and there are no buyers stepping in. Cheap doesn’t mean it’s bottomed.
The key point is that Citi’s “price cut” isn’t all that bearish: its $99,500 target is still about 59% above the current price. It cut its short-term outlook for fund flows to neutral, not its 12-month outlook—it had raised its target from $82,000 to $113,000 just a month and a half ago. Wall Street and on-chain analysts are focused on the same trigger this time: the 200-day moving average.
What to watch next: whether 30-day demand growth can get back near zero—and it needs to be a return of spot buying, not leveraged perpetual futures positions. That’s the recovery condition CryptoQuant itself laid out. Also watch Wednesday’s final ETF flow figures (IBIT hasn’t reported yet), and whether $62,000 holds. Two scenarios: if demand stops contracting, the first level to watch is the 200-day moving average at $72,900; if demand keeps shrinking, $61,800—the lower end of the range cited by Bitfinex—is the next stop.

Which do you think will come first this time: “demand stops contracting” or “$62,000 breaks”? Are you waiting for a signal of spot buying, or have you already started buying in batches?

$BTC $ETH
#比特币 #CryptoQuant #ETF
The above is for market information only and does not constitute investment advice.
Article
【Market Update】CryptoQuant: Bitcoin Returns to a Bear Market【Market Update】CryptoQuant: Bitcoin Returns to a Bear Market On-chain analytics firm CryptoQuant concluded in its November 17 weekly report (Bear Claw) that Bitcoin has fallen below both its 200-day and 365-day moving averages, officially returning to bear-market territory. On November 15, Bitcoin briefly dropped to $61,000, setting a four-month low. The 200-day moving average is at $72,900 and the 365-day moving average is at $75,900. The moving averages have turned from support into resistance, making a sustained major rebound unlikely until Bitcoin climbs back above them. Demand has also weakened: the 30-day growth in total demand for spot and perpetual futures combined has fallen below -400,000 BTC, its weakest level since July 1. The contraction is being led by selling pressure in the spot market. Holders realized a net loss of 25,800 BTC in a single day, the largest amount since July 13. The selling pressure is coming from holders accepting losses below their cost basis, not just from leveraged liquidations.

【Market Update】CryptoQuant: Bitcoin Returns to a Bear Market

【Market Update】CryptoQuant: Bitcoin Returns to a Bear Market
On-chain analytics firm CryptoQuant concluded in its November 17 weekly report (Bear Claw) that Bitcoin has fallen below both its 200-day and 365-day moving averages, officially returning to bear-market territory. On November 15, Bitcoin briefly dropped to $61,000, setting a four-month low. The 200-day moving average is at $72,900 and the 365-day moving average is at $75,900. The moving averages have turned from support into resistance, making a sustained major rebound unlikely until Bitcoin climbs back above them.
Demand has also weakened: the 30-day growth in total demand for spot and perpetual futures combined has fallen below -400,000 BTC, its weakest level since July 1. The contraction is being led by selling pressure in the spot market. Holders realized a net loss of 25,800 BTC in a single day, the largest amount since July 13. The selling pressure is coming from holders accepting losses below their cost basis, not just from leveraged liquidations.
CryptoQuant officially says Bitcoin is back in a bearish phase — and the levels it needs to reclaim are far above the current price. Context: CryptoQuant’s weekly “Bear Claw” report (Nov. 17, covered by Cointelegraph + Bitget News on Nov. 18) says BTC has fallen below its 200-day ($72,900) and 365-day ($75,900) moving averages. Its Bullish Score Index is at 10 out of 100 — a deeply bearish zone — and total demand growth is contracting at its fastest pace since July 1, with analyst sentiment at its most bearish since November 2025. The $62,000–$65,000 zone is identified as short-term support, but they emphasize that there’s no confirmation of a bottom yet, and a sustained recovery could take at least two months. Tonight, BTC is testing the lower end of that zone: the 11:15 p.m. WIB 15-minute candle closed at $62,513 after touching $62,285. Bullish scenario: hold above $62,000, then reclaim $65,000 as the first step; the trend only truly changes if $72,900 and $75,900 are broken — still a long way from here. Bearish scenario: a close below $62,000 opens the door to further declines; with demand still contracting, a bounce without a recovery in demand is just a pause. My conclusion: I’m leaning cautious while BTC is below $65,000. This isn’t a verdict, but a regime signal from a major on-chain firm — and I’m waiting for confirmation that demand is recovering before taking a stronger stance. This is my analysis, not financial advice — always DYOR. What do you think: will the $62,000–$65,000 zone hold, or break this week? #Bitcoin #CryptoQuant $BTC
CryptoQuant officially says Bitcoin is back in a bearish phase — and the levels it needs to reclaim are far above the current price.

Context: CryptoQuant’s weekly “Bear Claw” report (Nov. 17, covered by Cointelegraph + Bitget News on Nov. 18) says BTC has fallen below its 200-day ($72,900) and 365-day ($75,900) moving averages. Its Bullish Score Index is at 10 out of 100 — a deeply bearish zone — and total demand growth is contracting at its fastest pace since July 1, with analyst sentiment at its most bearish since November 2025. The $62,000–$65,000 zone is identified as short-term support, but they emphasize that there’s no confirmation of a bottom yet, and a sustained recovery could take at least two months. Tonight, BTC is testing the lower end of that zone: the 11:15 p.m. WIB 15-minute candle closed at $62,513 after touching $62,285.

Bullish scenario: hold above $62,000, then reclaim $65,000 as the first step; the trend only truly changes if $72,900 and $75,900 are broken — still a long way from here.

Bearish scenario: a close below $62,000 opens the door to further declines; with demand still contracting, a bounce without a recovery in demand is just a pause.

My conclusion: I’m leaning cautious while BTC is below $65,000. This isn’t a verdict, but a regime signal from a major on-chain firm — and I’m waiting for confirmation that demand is recovering before taking a stronger stance.

This is my analysis, not financial advice — always DYOR.

What do you think: will the $62,000–$65,000 zone hold, or break this week?

#Bitcoin #CryptoQuant $BTC
Bitcoin's newest big buyers are now sitting on their largest paper loss on record, yet most of them are not rushing to sell. CryptoQuant analyst Darkfost said on November 15, 2026 that short-term holder whales, large wallets that built positions within roughly the last 155 days, now hold nearly $8 billion in unrealized losses, the highest ever tracked for this group. Many bought into $BTC's 51%+ rally from June; in September the same cohort held about $9.07 billion in paper gains before a correction of nearly 30% since October flipped that cushion. Selling pressure is rising only modestly. The monthly average of these whales' inflows to Binance climbed from about 1,200 BTC to 2,100 BTC, with a peak above 9,000 BTC on November 3, still below levels seen in June and February 2026. CryptoQuant reads that as conviction rather than panic. #Bitcoin #OnChain #CryptoQuant DYOR. Not financial advice.
Bitcoin's newest big buyers are now sitting on their largest paper loss on record, yet most of them are not rushing to sell.

CryptoQuant analyst Darkfost said on November 15, 2026 that short-term holder whales, large wallets that built positions within roughly the last 155 days, now hold nearly $8 billion in unrealized losses, the highest ever tracked for this group. Many bought into $BTC 's 51%+ rally from June; in September the same cohort held about $9.07 billion in paper gains before a correction of nearly 30% since October flipped that cushion.

Selling pressure is rising only modestly. The monthly average of these whales' inflows to Binance climbed from about 1,200 BTC to 2,100 BTC, with a peak above 9,000 BTC on November 3, still below levels seen in June and February 2026. CryptoQuant reads that as conviction rather than panic.

#Bitcoin #OnChain #CryptoQuant
DYOR. Not financial advice.
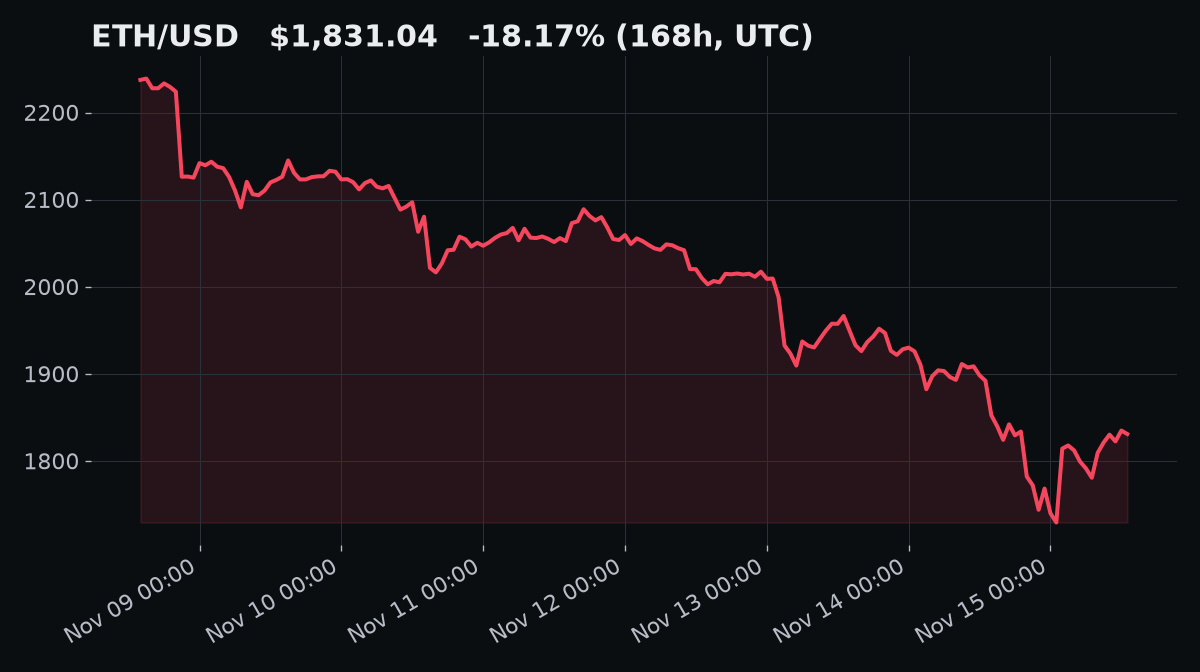
Binance's ETH stash is at a five-year low. Is that dip-buying or just a change of address? • Binance ETH reserves: ~2.9M, lowest since 2021 (CryptoQuant/Darkfost, Nov 15) • Peak: 5M+ in July 2025, so about -42% since • Customer ETH balances in Binance's proof-of-reserves: 3,482,001 on Nov 12 vs 3,446,090 on Nov 4, up 1.04% (crypto.news) • US spot ETH ETFs: ~$398.9M net outflows, Nov 9-13 (Farside) • $ETH on the chart: $1,831.04, -18.17% over 168h (Coinbase candles) My read: falling exchange reserves mean less coin sitting ready to sell, but the analyst himself notes withdrawals don't prove new buying. Coins can move to cold storage, staking or DeFi and still come back. I'd watch whether netflows stay negative if $ETH keeps sliding. Not financial advice. Disclosure: Write to Earn may pay me a commission on cashtag trades. #Ethereum #OnChain #CryptoQuant
Binance's ETH stash is at a five-year low. Is that dip-buying or just a change of address?

• Binance ETH reserves: ~2.9M, lowest since 2021 (CryptoQuant/Darkfost, Nov 15)
• Peak: 5M+ in July 2025, so about -42% since
• Customer ETH balances in Binance's proof-of-reserves: 3,482,001 on Nov 12 vs 3,446,090 on Nov 4, up 1.04% (crypto.news)
• US spot ETH ETFs: ~$398.9M net outflows, Nov 9-13 (Farside)
• $ETH on the chart: $1,831.04, -18.17% over 168h (Coinbase candles)

My read: falling exchange reserves mean less coin sitting ready to sell, but the analyst himself notes withdrawals don't prove new buying. Coins can move to cold storage, staking or DeFi and still come back. I'd watch whether netflows stay negative if $ETH keeps sliding. Not financial advice.

Disclosure: Write to Earn may pay me a commission on cashtag trades.

#Ethereum #OnChain #CryptoQuant
·
--
‎🐋 Whales Are Buying the Dip While Everyone Else Panic Sells. Who's Right? 👀 ‎Bitcoin has dropped 24% and now sits near $65.5K. The latest CryptoQuant data shows a split market: ‎ ‎🟢 Whales (1,000+ BTC): added about 47,000 BTC during the drop. ‎🟢 1,000 to 10,000 BTC wallets: accounted for 43,700 BTC of that buying. ‎🔴 Mid-sized wallets (100 to 1,000 BTC): sold 50,500 BTC. ‎🔴 Smaller wallets (10 to 100 BTC): sold 14,400 BTC. ‎ ‎📉 Demand is weak. Bitcoin's 30-day apparent demand fell to about -284,000 BTC, the weakest since April 2025. ‎💸 Pain is real. Holders took net realized losses on 14 of the last 16 days, about 84,000 BTC in total. ‎⚖️ The problem: short-term holders, ETFs and mid-sized wallets are selling faster than whales can absorb the supply. ‎ ‎**What this could mean: ‎- Bulls: big players accumulating during fear has marked turning points before. ‎- Bears: if sellers keep outpacing buyers, whale buying alone may not stop the slide. ‎ ‎Smart money may be early, or may be catching a falling knife. The data doesn't say which yet. 🎯 ‎ ‎🗳️ Poll time: What's your call on BTC from here? ‎🐂 Whales are right, bottom is close ‎🐻 More downside coming ‎🤷 Waiting on the sidelines ‎ ‎Drop your answer below 👇 ‎ ‎Disclaimer: Educational content only. Not financial advice. ‎Always DYOR. ‎ ‎#CryptoNews #BTC #CryptoQuant #BinanceSquare #CryptoSelloffTriggersMultipleWhaleLiquidations {spot}(BTCUSDT)
‎🐋 Whales Are Buying the Dip While Everyone Else Panic Sells. Who's Right? 👀
‎Bitcoin has dropped 24% and now sits near $65.5K. The latest CryptoQuant data shows a split market:
‎
‎🟢 Whales (1,000+ BTC): added about 47,000 BTC during the drop.
‎🟢 1,000 to 10,000 BTC wallets: accounted for 43,700 BTC of that buying.
‎🔴 Mid-sized wallets (100 to 1,000 BTC): sold 50,500 BTC.
‎🔴 Smaller wallets (10 to 100 BTC): sold 14,400 BTC.
‎
‎📉 Demand is weak. Bitcoin's 30-day apparent demand fell to about -284,000 BTC, the weakest since April 2025.
‎💸 Pain is real. Holders took net realized losses on 14 of the last 16 days, about 84,000 BTC in total.
‎⚖️ The problem: short-term holders, ETFs and mid-sized wallets are selling faster than whales can absorb the supply.
‎
‎**What this could mean:
‎- Bulls: big players accumulating during fear has marked turning points before.
‎- Bears: if sellers keep outpacing buyers, whale buying alone may not stop the slide.
‎
‎Smart money may be early, or may be catching a falling knife. The data doesn't say which yet. 🎯
‎
‎🗳️ Poll time: What's your call on BTC from here?
‎🐂 Whales are right, bottom is close
‎🐻 More downside coming
‎🤷 Waiting on the sidelines
‎
‎Drop your answer below 👇
‎
‎Disclaimer: Educational content only. Not financial advice.
‎Always DYOR.
‎
‎#CryptoNews #BTC #CryptoQuant #BinanceSquare
#CryptoSelloffTriggersMultipleWhaleLiquidations
Bitcoin Up or Down on November 15?

Bitcoin Up or Down on November 15?

1%Up99%Down
Volume $330,977.15
#HalfOfBitcoinUnderwater 📉 MORE THAN HALF OF BITCOIN'S SUPPLY IS UNDERWATER CryptoQuant expert Darkfost has just pointed out that less than 45% of the active Bitcoin supply is still in profit, meaning more than half is below its purchase price. History shows that whenever this ratio falls below 40%, the market often hits the bottom of a correction. Bitcoin is currently around $65,466 after dipping to $62,006 early this morning, so the 40% level is being watched closely. Biggest perpetual movers today: $ZEC 912 dollars, $ASTER 0,53 dollars, $ICP 2,24 dollars #Bitcoin #CryptoQuant #CryptoMarket
#HalfOfBitcoinUnderwater
📉 MORE THAN HALF OF BITCOIN'S SUPPLY IS UNDERWATER
CryptoQuant expert Darkfost has just pointed out that less than 45% of the active Bitcoin supply is still in profit, meaning more than half is below its purchase price. History shows that whenever this ratio falls below 40%, the market often hits the bottom of a correction. Bitcoin is currently around $65,466 after dipping to $62,006 early this morning, so the 40% level is being watched closely.
Biggest perpetual movers today: $ZEC 912 dollars, $ASTER 0,53 dollars, $ICP 2,24 dollars
#Bitcoin #CryptoQuant #CryptoMarket
📉 Ethereum reserves on Binance hit their lowest level in nearly five years On November 15, CryptoQuant analyst Darkfost reported that about 2.9 million ETH remained at Binance’s tracked addresses—the lowest level since 2021. According to his estimate, this amount has fallen by nearly 42% since July 2025. A decline in on-chain reserves may reflect transfers to personal wallets, staking, or other services, but does not in itself prove widespread buying. The difference in methodologies also matters: CryptoQuant’s data on known addresses is not the same as customer balances in Binance’s Proof of Reserves report. Source: CryptoQuant (Darkfost), crypto.news, November 15, 2026. #Ethereum #CryptoQuant
📉 Ethereum reserves on Binance hit their lowest level in nearly five years

On November 15, CryptoQuant analyst Darkfost reported that about 2.9 million ETH remained at Binance’s tracked addresses—the lowest level since 2021. According to his estimate, this amount has fallen by nearly 42% since July 2025.

A decline in on-chain reserves may reflect transfers to personal wallets, staking, or other services, but does not in itself prove widespread buying. The difference in methodologies also matters: CryptoQuant’s data on known addresses is not the same as customer balances in Binance’s Proof of Reserves report.

Source: CryptoQuant (Darkfost), crypto.news, November 15, 2026.
#Ethereum #CryptoQuant
CryptoQuant on-chain analysis, November 15: During Bitcoin’s roughly 24% pullback in this cycle, wallets holding more than 1,000 BTC added a combined approximately 47,000 BTC, including an increase of about 43,700 BTC among wallets holding 1,000–10,000 BTC. Addresses holding 100–1,000 BTC decreased by approximately 50,500 BTC, while the 10–100 BTC group decreased by about 14,400 BTC. The analysis also said that 30-day apparent demand was approximately negative 284,000 BTC, its lowest level since April 2025. In the 16 days since October 29, net realized losses were recorded on 14 days, totaling about 84,000 BTC. These “increases/decreases” are on-chain statistics grouped by wallet balance and do not equate to owner identities or overall market fund flows. The data reflect diverging behavior among addresses of different sizes; CryptoQuant said selling by short-term holders, ETFs, and medium-sized wallets is outpacing whale accumulation. $BTC #比特币 #链上数据 #加密市场 #CryptoQuant
#BitcoinBullScoreHitsZero 📉 BITCOIN’S BULL SCORE DROPS TO ZERO! Hey everyone, CryptoQuant’s gauge has just hit an absolute low: Bitcoin’s bull score has fallen to 0 out of 100, down from 90 on 13/10. Of the 10 indicators, only 2 are still green: Bitcoin demand contracted by 284,000 coins over 30 days, its strongest reading since March, while USDT’s market cap shed $6.6 billion over 60 days. $BTC Perpetuals are hovering around $74,500, below the 365-day moving average of around $76,400. But back in April, this indicator also hit 20, then bounced back to 80 within 2 months. Biggest perpetual move today: $ZEC 991 dollars, $ICP 2,63 dollars #Bitcoin #CryptoQuant #BearMarket
#BitcoinBullScoreHitsZero
📉 BITCOIN’S BULL SCORE DROPS TO ZERO!
Hey everyone, CryptoQuant’s gauge has just hit an absolute low: Bitcoin’s bull score has fallen to 0 out of 100, down from 90 on 13/10. Of the 10 indicators, only 2 are still green: Bitcoin demand contracted by 284,000 coins over 30 days, its strongest reading since March, while USDT’s market cap shed $6.6 billion over 60 days. $BTC Perpetuals are hovering around $74,500, below the 365-day moving average of around $76,400. But back in April, this indicator also hit 20, then bounced back to 80 within 2 months.
Biggest perpetual move today: $ZEC 991 dollars, $ICP 2,63 dollars
#Bitcoin #CryptoQuant #BearMarket
CryptoQuant's Bull Score has fallen to 20, practically handing the bulls a knife. BTC has dropped below the 365-day moving average and is barreling toward support at 73,200. This pullback is probably unavoidable, so don't blindly buy the dip. #BTC #CryptoQuant
CryptoQuant's Bull Score has fallen to 20, practically handing the bulls a knife. BTC has dropped below the 365-day moving average and is barreling toward support at 73,200. This pullback is probably unavoidable, so don't blindly buy the dip.

#BTC #CryptoQuant
Stablecoin market cap falls to its lowest level in over a year According to CryptoQuant analyst Darkfost Since April this year It has fallen from about $280 billion to about $263 billion Down about $17 billion in six months A decline of roughly 6% On centralized trading platforms Binance accounts for about 70% of the stablecoin supply Its stablecoin market cap 90-day average Slid from about $51 billion to about $34 billion After the hot wallet security incident Another roughly $3 billion in stablecoins flowed out The contraction in stablecoins Essentially means there's less dry powder on the sidelines It's not about any one altcoin Next, watch whether $BTC can strengthen First, see whether stablecoins can stop falling and recover Then see whether exchanges can continue to retain liquidity $BTC $BNB #稳定币市值 #流动性 #CryptoQuant
Stablecoin market cap falls to its lowest level in over a year

According to CryptoQuant analyst Darkfost
Since April this year
It has fallen from about $280 billion to about $263 billion
Down about $17 billion in six months
A decline of roughly 6%

On centralized trading platforms
Binance accounts for about 70% of the stablecoin supply
Its stablecoin market cap 90-day average
Slid from about $51 billion to about $34 billion
After the hot wallet security incident
Another roughly $3 billion in stablecoins flowed out

The contraction in stablecoins
Essentially means there's less dry powder on the sidelines
It's not about any one altcoin
Next, watch whether $BTC can strengthen
First, see whether stablecoins can stop falling and recover
Then see whether exchanges can continue to retain liquidity

$BTC $BNB
#稳定币市值 #流动性 #CryptoQuant
Sellers ran out of steam first Buyers still haven't returned According to CryptoQuant Bitcoin’s “seller exhaustion” model has fallen to near its lowest level since this bear market began The model uses the ratio of supply in profit compared with the monthly average volatility to assess whether sellers still have enough coins to keep pushing prices down After spot prices pulled back more than 10% from their highs most short-term holders looking to take profits had already sold and selling pressure weakened noticeably But the analysis also made one thing clear: weaker selling pressure doesn’t mean an immediate rebound The core issue is insufficient new demand Until buying capital returns at scale upside remains limited At this point, the biggest risk is to mistake “sellers can’t push it lower” for “a huge rally is coming” A more measured interpretation is that downward momentum is fading but a trend reversal will take real money coming into the market $BTC $ETH #卖方耗竭 #Bitcoin链上 #CryptoQuant
Sellers ran out of steam first
Buyers still haven't returned

According to CryptoQuant
Bitcoin’s “seller exhaustion” model
has fallen to near its lowest level since this bear market began
The model uses
the ratio of supply in profit
compared with the monthly average volatility
to assess whether sellers still have enough coins to keep pushing prices down

After spot prices pulled back more than 10% from their highs
most short-term holders looking to take profits had already sold
and selling pressure weakened noticeably
But the analysis also made one thing clear:
weaker selling pressure doesn’t mean an immediate rebound
The core issue is insufficient new demand
Until buying capital returns at scale
upside remains limited

At this point, the biggest risk is
to mistake “sellers can’t push it lower” for “a huge rally is coming”
A more measured interpretation is that
downward momentum is fading
but a trend reversal will take real money coming into the market

$BTC $ETH
#卖方耗竭 #Bitcoin链上 #CryptoQuant
Log in to explore more content
Join global crypto users on Binance Square
⚡️ Get latest and useful information about crypto.
💬 Trusted by the world’s largest crypto exchange.
👍 Discover real insights from verified creators.
Email / Phone number