

#analises
analises
337,231 views
803 Discussing
Hot
Latest

$ZEC Latest Analysis – Should You Trade It on Binance Now?
Zcash (ZEC) is delivering one of the strongest privacy-coin performances of 2026. As of September 4, $ZEC trades around $950–$1,000 after a sharp breakout above the $700–$900 resistance zone that held for years. The token recently hit its highest levels since 2018, with 24-hour gains near 15% and futures volume surging over 100%.
Key drivers: renewed demand for financial privacy, Grayscale’s ongoing push for a spot ZEC ETF, improved network upgrades after earlier vulnerability concerns, and strong technical momentum. Open interest and trading volume have climbed sharply, confirming real participation rather than pure speculation. Next upside targets sit at $1,000 (psychological), then $1,200–$1,300, with longer-term charts pointing toward $1,800 if the structure holds.
Technically the setup remains bullish above $900 support. RSI is elevated (overbought territory), so short-term pullbacks toward $850–$900 are possible and healthy. A clean break and hold above $1,000 would open further upside.
Should you trade $ZEC on Binance now?
Momentum favors the bulls, and Binance offers deep liquidity on both spot and futures pairs. Aggressive traders can look for entries on dips to the breakout zone with tight risk management. More cautious participants may wait for a successful retest of $900 or a clear daily close above $1,000. Volatility remains high — position size carefully and use stop-losses.
This is not financial advice. DYOR, manage risk, and trade only what you can afford to lose. The privacy narrative is strong, but crypto moves fast.
#ZECUSDT #zec #analises
{future}(ZECUSDT)
$ZEC Latest Analysis – Should You Trade It on Binance Now?
Zcash (ZEC) is delivering one of the strongest privacy-coin performances of 2026. As of September 4, $ZEC trades around $950–$1,000 after a sharp breakout above the $700–$900 resistance zone that held for years. The token recently hit its highest levels since 2018, with 24-hour gains near 15% and futures volume surging over 100%.
Key drivers: renewed demand for financial privacy, Grayscale’s ongoing push for a spot ZEC ETF, improved network upgrades after earlier vulnerability concerns, and strong technical momentum. Open interest and trading volume have climbed sharply, confirming real participation rather than pure speculation. Next upside targets sit at $1,000 (psychological), then $1,200–$1,300, with longer-term charts pointing toward $1,800 if the structure holds.
Technically the setup remains bullish above $900 support. RSI is elevated (overbought territory), so short-term pullbacks toward $850–$900 are possible and healthy. A clean break and hold above $1,000 would open further upside.
Should you trade $ZEC on Binance now?
Momentum favors the bulls, and Binance offers deep liquidity on both spot and futures pairs. Aggressive traders can look for entries on dips to the breakout zone with tight risk management. More cautious participants may wait for a successful retest of $900 or a clear daily close above $1,000. Volatility remains high — position size carefully and use stop-losses.
This is not financial advice. DYOR, manage risk, and trade only what you can afford to lose. The privacy narrative is strong, but crypto moves fast.
#ZECUSDT #zec #analises
Zcash (ZEC) is delivering one of the strongest privacy-coin performances of 2026. As of September 4, $ZEC trades around $950–$1,000 after a sharp breakout above the $700–$900 resistance zone that held for years. The token recently hit its highest levels since 2018, with 24-hour gains near 15% and futures volume surging over 100%.
Key drivers: renewed demand for financial privacy, Grayscale’s ongoing push for a spot ZEC ETF, improved network upgrades after earlier vulnerability concerns, and strong technical momentum. Open interest and trading volume have climbed sharply, confirming real participation rather than pure speculation. Next upside targets sit at $1,000 (psychological), then $1,200–$1,300, with longer-term charts pointing toward $1,800 if the structure holds.
Technically the setup remains bullish above $900 support. RSI is elevated (overbought territory), so short-term pullbacks toward $850–$900 are possible and healthy. A clean break and hold above $1,000 would open further upside.
Should you trade $ZEC on Binance now?
Momentum favors the bulls, and Binance offers deep liquidity on both spot and futures pairs. Aggressive traders can look for entries on dips to the breakout zone with tight risk management. More cautious participants may wait for a successful retest of $900 or a clear daily close above $1,000. Volatility remains high — position size carefully and use stop-losses.
This is not financial advice. DYOR, manage risk, and trade only what you can afford to lose. The privacy narrative is strong, but crypto moves fast.
#ZECUSDT #zec #analises
181

Why is XEP $XRP falling? #Analysis Technical Analysis$XRP
#analises
Technical Analysis of XRP Coin
Technical Sentiment Analysis for XRP Coin. As of July 1, 2026, the XRP coin shows strong sell sentiment. Our analysis, which combines 12 technical indicators, indicates that 3 indicators point to a buy, while 9 indicators point to a sell.
Momentum Indicators: Relative Strength Index (RSI), Moving Average Convergence Divergence (MACD), and Overbought/Oversold status. The Relative Strength Index (RSI) for XRP is currently 31.958, indicating a neutral condition. At the same time, the Moving Average Convergence Divergence (MACD) (12, 26) -0.0503 provides a sell signal for short-term momentum. Other oscillators, such as the Stochastic Indicator at 16.561 and the Commodity Channel Index (CCI) at -98.204, confirm negative expectations for the digital asset at -0.0874.
Why is XEP $XRP falling? #Analysis Technical Analysis
$XRP
#analises
Technical Analysis of XRP Coin
Technical Sentiment Analysis for XRP Coin. As of July 1, 2026, the XRP coin shows strong sell sentiment. Our analysis, which combines 12 technical indicators, indicates that 3 indicators point to a buy, while 9 indicators point to a sell.
Momentum Indicators: Relative Strength Index (RSI), Moving Average Convergence Divergence (MACD), and Overbought/Oversold status. The Relative Strength Index (RSI) for XRP is currently 31.958, indicating a neutral condition. At the same time, the Moving Average Convergence Divergence (MACD) (12, 26) -0.0503 provides a sell signal for short-term momentum. Other oscillators, such as the Stochastic Indicator at 16.561 and the Commodity Channel Index (CCI) at -98.204, confirm negative expectations for the digital asset at -0.0874.
#analises
Technical Analysis of XRP Coin
Technical Sentiment Analysis for XRP Coin. As of July 1, 2026, the XRP coin shows strong sell sentiment. Our analysis, which combines 12 technical indicators, indicates that 3 indicators point to a buy, while 9 indicators point to a sell.
Momentum Indicators: Relative Strength Index (RSI), Moving Average Convergence Divergence (MACD), and Overbought/Oversold status. The Relative Strength Index (RSI) for XRP is currently 31.958, indicating a neutral condition. At the same time, the Moving Average Convergence Divergence (MACD) (12, 26) -0.0503 provides a sell signal for short-term momentum. Other oscillators, such as the Stochastic Indicator at 16.561 and the Commodity Channel Index (CCI) at -98.204, confirm negative expectations for the digital asset at -0.0874.
1
2
297

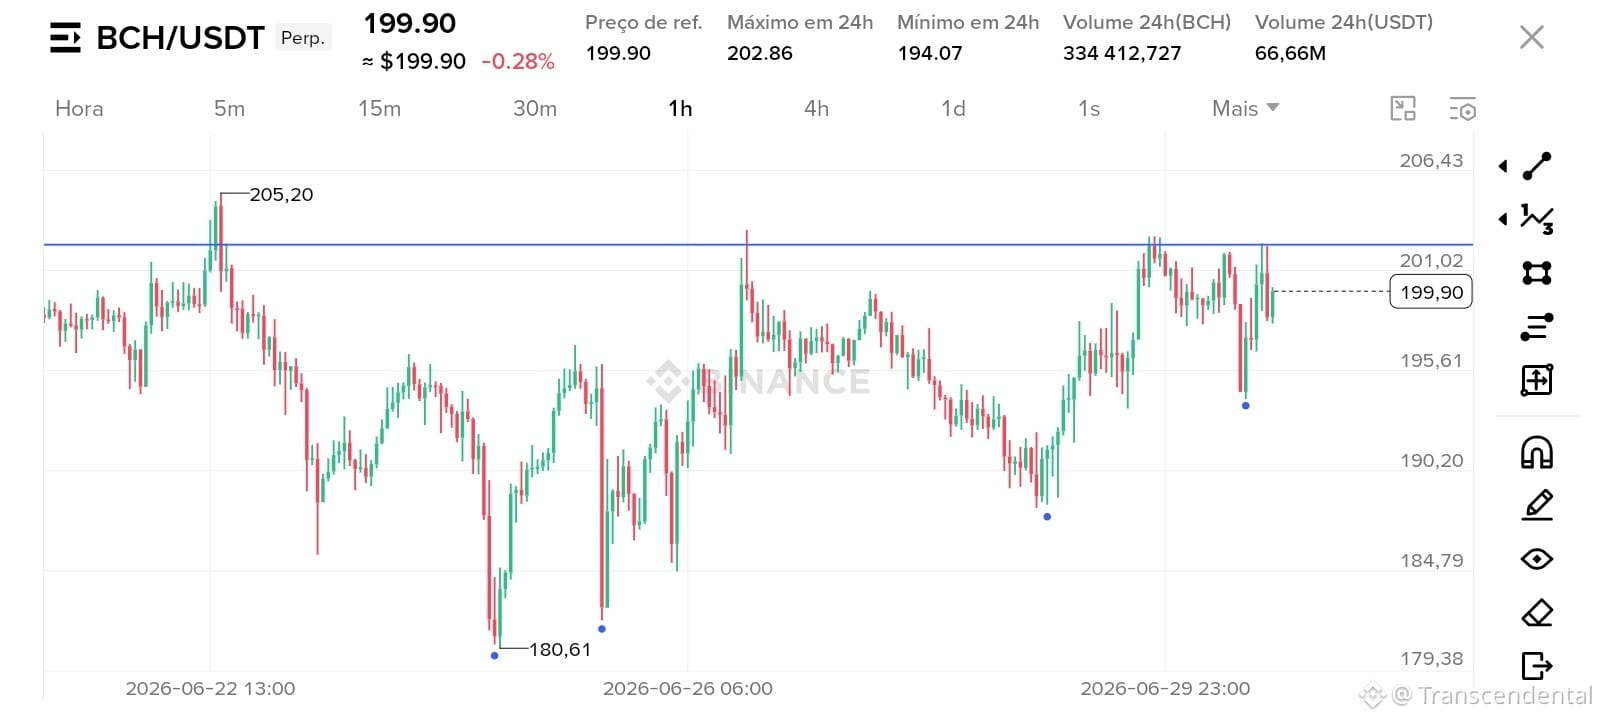
Analyzing the chart of $BCH !
The structure seems like we are in a sideways trend, but if we look down, we find the supports (blue points). Connecting them will give us a view of which direction we are headed. There is a significant resistance that can be broken at any time, which will serve as confirmation for $BCH to move forward.
This is not a trading signal—just a simple analysis.
{future}(BCHUSDT)
#analises #TradingSignals
Analyzing the chart of $BCH !
The structure seems like we are in a sideways trend, but if we look down, we find the supports (blue points). Connecting them will give us a view of which direction we are headed. There is a significant resistance that can be broken at any time, which will serve as confirmation for $BCH to move forward.
This is not a trading signal—just a simple analysis.
#analises #TradingSignals
The structure seems like we are in a sideways trend, but if we look down, we find the supports (blue points). Connecting them will give us a view of which direction we are headed. There is a significant resistance that can be broken at any time, which will serve as confirmation for $BCH to move forward.
This is not a trading signal—just a simple analysis.
#analises #TradingSignals
95

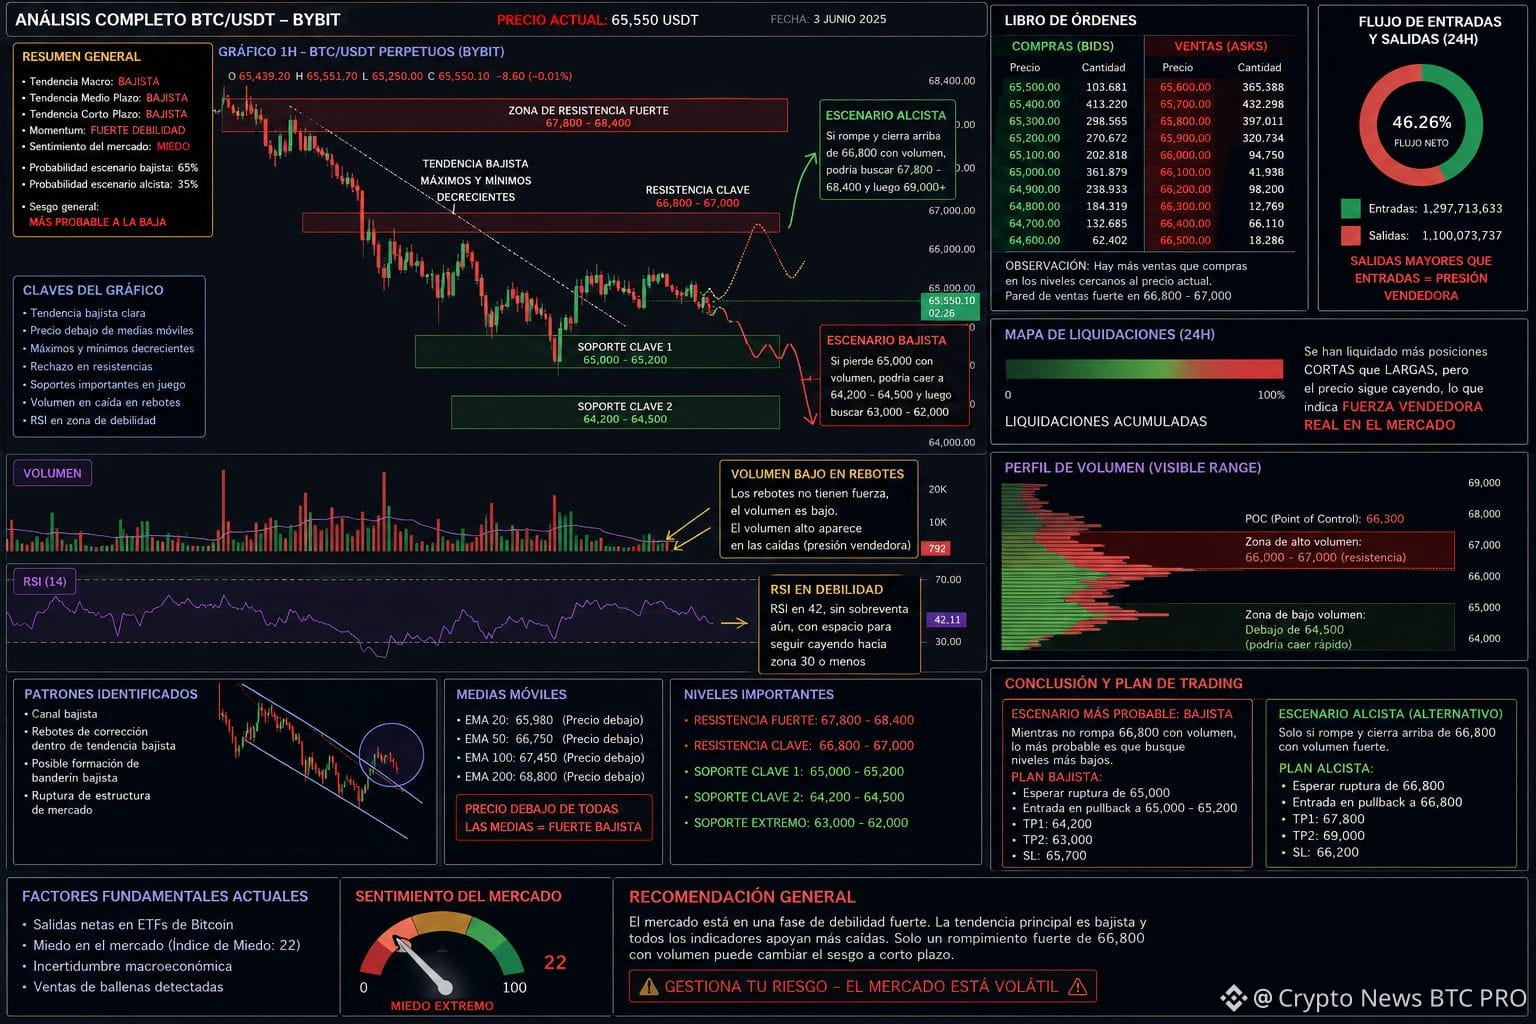
BTC/USDT Analysis
Bitcoin is clearly in a bearish structure in the short term. The drop from the 74,000–82,000 USD zone down to approximately 65,500 USD happened at an unusual speed, showcasing strong selling pressure and a significant capital outflow from the market.
The chart displays lower highs and lower lows, a classic signal of a downtrend. Additionally, the observed bounces have been weak and low in volume, indicating that buyers haven't regained control yet.
The RSI is hovering around 42, below the neutral zone of 50. This reflects weakness in bullish momentum and leaves room for further declines before hitting extreme oversold levels.
Capital flow also favors sellers. The data shows more outflows than inflows, confirming a loss of confidence and increased bearish pressure. The order book reveals significant sell blocks between 66,800 and 67,300 USD, creating a tough resistance to break.
The key levels to watch are:
Main Resistance: 66,800 – 67,000 USD.
Immediate Support: 65,000 USD.
Critical Support: 64,200 – 63,000 USD.
As long as Bitcoin remains below 66,800 USD, the most likely scenario continues to be bearish. A clear break below 65,000 USD could pave the way to 64,200, 63,000, and even 62,000 USD.
Conversely, for a stronger bullish signal to emerge, it would be necessary to reclaim and hold the 66,800–67,000 USD zone with a significant increase in volume.
Conclusion: considering price action, RSI, volume, capital flow, and the order book, the current trend favors continued bearishness unless key resistances are reclaimed.
#BTC #analises #trading
{spot}(BTCUSDT)
BTC/USDT Analysis
Bitcoin is clearly in a bearish structure in the short term. The drop from the 74,000–82,000 USD zone down to approximately 65,500 USD happened at an unusual speed, showcasing strong selling pressure and a significant capital outflow from the market.
The chart displays lower highs and lower lows, a classic signal of a downtrend. Additionally, the observed bounces have been weak and low in volume, indicating that buyers haven't regained control yet.
The RSI is hovering around 42, below the neutral zone of 50. This reflects weakness in bullish momentum and leaves room for further declines before hitting extreme oversold levels.
Capital flow also favors sellers. The data shows more outflows than inflows, confirming a loss of confidence and increased bearish pressure. The order book reveals significant sell blocks between 66,800 and 67,300 USD, creating a tough resistance to break.
The key levels to watch are:
Main Resistance: 66,800 – 67,000 USD.
Immediate Support: 65,000 USD.
Critical Support: 64,200 – 63,000 USD.
As long as Bitcoin remains below 66,800 USD, the most likely scenario continues to be bearish. A clear break below 65,000 USD could pave the way to 64,200, 63,000, and even 62,000 USD.
Conversely, for a stronger bullish signal to emerge, it would be necessary to reclaim and hold the 66,800–67,000 USD zone with a significant increase in volume.
Conclusion: considering price action, RSI, volume, capital flow, and the order book, the current trend favors continued bearishness unless key resistances are reclaimed.
#BTC #analises #trading
Bitcoin is clearly in a bearish structure in the short term. The drop from the 74,000–82,000 USD zone down to approximately 65,500 USD happened at an unusual speed, showcasing strong selling pressure and a significant capital outflow from the market.
The chart displays lower highs and lower lows, a classic signal of a downtrend. Additionally, the observed bounces have been weak and low in volume, indicating that buyers haven't regained control yet.
The RSI is hovering around 42, below the neutral zone of 50. This reflects weakness in bullish momentum and leaves room for further declines before hitting extreme oversold levels.
Capital flow also favors sellers. The data shows more outflows than inflows, confirming a loss of confidence and increased bearish pressure. The order book reveals significant sell blocks between 66,800 and 67,300 USD, creating a tough resistance to break.
The key levels to watch are:
Main Resistance: 66,800 – 67,000 USD.
Immediate Support: 65,000 USD.
Critical Support: 64,200 – 63,000 USD.
As long as Bitcoin remains below 66,800 USD, the most likely scenario continues to be bearish. A clear break below 65,000 USD could pave the way to 64,200, 63,000, and even 62,000 USD.
Conversely, for a stronger bullish signal to emerge, it would be necessary to reclaim and hold the 66,800–67,000 USD zone with a significant increase in volume.
Conclusion: considering price action, RSI, volume, capital flow, and the order book, the current trend favors continued bearishness unless key resistances are reclaimed.
#BTC #analises #trading
1
146
Bitcoin ($BTC ) Market Update: Macro Shock Hits Risk Assets, $82K Support Now Critical
#BTC is trading near $82,900**, down **2% in 24 hours** after geopolitical tensions flared. President Trump's rejection of Iran's Strait of Hormuz proposal sent oil above **$93, spooking risk markets . The pullback follows last week's rally above $87,000—BTC's highest since January .
Derivatives Signal Caution: Open interest dropped to 652,000 BTC, near 2026 lows. Perpetual funding flipped negative (-0.3%), meaning short sellers are paying to stay bearish—a clear sentiment shift .
Key Support: $82,000** is the breakout level from the $75K-$82K range. Holding here keeps the bullish structure valid. A break opens **$78,000, then $75,000**. Resistance sits at **$86,000-$87,000 .
The Bull Case: Spot Bitcoin ETFs recorded $2.39 billion in weekly inflows**—the largest since October 2025. BlackRock's IBIT alone absorbed **$1.16 billion . Analyst Katie Stockton sees the 200-day SMA breakout as confirmation the bearish cycle ended, targeting $93,000 .
Binance Trade Setup: A cautious long if $BTC holds $82,000** with volume, targeting **$87,000-$90,000**, stop below **$80,000. Macro headlines rule the tape—DYOR.
#BTC #analises #Binance
{spot}(BTCUSDT)
Bitcoin ($BTC ) Market Update: Macro Shock Hits Risk Assets, $82K Support Now Critical
#BTC is trading near $82,900**, down **2% in 24 hours** after geopolitical tensions flared. President Trump's rejection of Iran's Strait of Hormuz proposal sent oil above **$93, spooking risk markets . The pullback follows last week's rally above $87,000—BTC's highest since January .
Derivatives Signal Caution: Open interest dropped to 652,000 BTC, near 2026 lows. Perpetual funding flipped negative (-0.3%), meaning short sellers are paying to stay bearish—a clear sentiment shift .
Key Support: $82,000** is the breakout level from the $75K-$82K range. Holding here keeps the bullish structure valid. A break opens **$78,000, then $75,000**. Resistance sits at **$86,000-$87,000 .
The Bull Case: Spot Bitcoin ETFs recorded $2.39 billion in weekly inflows**—the largest since October 2025. BlackRock's IBIT alone absorbed **$1.16 billion . Analyst Katie Stockton sees the 200-day SMA breakout as confirmation the bearish cycle ended, targeting $93,000 .
Binance Trade Setup: A cautious long if $BTC holds $82,000** with volume, targeting **$87,000-$90,000**, stop below **$80,000. Macro headlines rule the tape—DYOR.
#BTC #analises #Binance
#BTC is trading near $82,900**, down **2% in 24 hours** after geopolitical tensions flared. President Trump's rejection of Iran's Strait of Hormuz proposal sent oil above **$93, spooking risk markets . The pullback follows last week's rally above $87,000—BTC's highest since January .
Derivatives Signal Caution: Open interest dropped to 652,000 BTC, near 2026 lows. Perpetual funding flipped negative (-0.3%), meaning short sellers are paying to stay bearish—a clear sentiment shift .
Key Support: $82,000** is the breakout level from the $75K-$82K range. Holding here keeps the bullish structure valid. A break opens **$78,000, then $75,000**. Resistance sits at **$86,000-$87,000 .
The Bull Case: Spot Bitcoin ETFs recorded $2.39 billion in weekly inflows**—the largest since October 2025. BlackRock's IBIT alone absorbed **$1.16 billion . Analyst Katie Stockton sees the 200-day SMA breakout as confirmation the bearish cycle ended, targeting $93,000 .
Binance Trade Setup: A cautious long if $BTC holds $82,000** with volume, targeting **$87,000-$90,000**, stop below **$80,000. Macro headlines rule the tape—DYOR.
#BTC #analises #Binance
9
SuperRare ($RARE ) Market Update: NFT Platform Token Retreats After Volatile Week
$RARE is trading near $0.0128**, down about **0.16% in 24 hours** and roughly **9.5% from its recent high of $0.026 hit earlier this week. Despite the pullback, the token remains up 4.07% over the past 7 days, showing mixed short-term momentum.
Key Context: SuperRare is the governance token for the leading NFT art marketplace on Ethereum. The token is fully unlocked—no future vesting overhang—with 82.5% of supply circulating and a market cap near $10.5 million. This reduces dilution risk but also removes unlock-driven catalysts.
Market Activity: Spot trading volume sits at $764K in 24 hours**, while futures volume is **4x higher at $3.2M, suggesting leverage is driving price action. Open interest is **$3.38M**, with minimal liquidations (~$306), indicating a relatively calm derivatives market.
Key Levels: Support sits near $0.0120–$0.0125, with deeper support at $0.0110**. Resistance is **$0.0150, then $0.0200.
Binance Trade Setup: $RARE is a low-liquidity, high-volatility NFT token. A cautious long only on a confirmed hold above $0.0130** with volume, targeting **$0.0150–$0.0200**, stop below **$0.0120. Thin order books mean slippage can be significant—use limit orders. DYOR.
#RARE #analises #Binance
{spot}(RAREUSDT)
SuperRare ($RARE ) Market Update: NFT Platform Token Retreats After Volatile Week
$RARE is trading near $0.0128**, down about **0.16% in 24 hours** and roughly **9.5% from its recent high of $0.026 hit earlier this week. Despite the pullback, the token remains up 4.07% over the past 7 days, showing mixed short-term momentum.
Key Context: SuperRare is the governance token for the leading NFT art marketplace on Ethereum. The token is fully unlocked—no future vesting overhang—with 82.5% of supply circulating and a market cap near $10.5 million. This reduces dilution risk but also removes unlock-driven catalysts.
Market Activity: Spot trading volume sits at $764K in 24 hours**, while futures volume is **4x higher at $3.2M, suggesting leverage is driving price action. Open interest is **$3.38M**, with minimal liquidations (~$306), indicating a relatively calm derivatives market.
Key Levels: Support sits near $0.0120–$0.0125, with deeper support at $0.0110**. Resistance is **$0.0150, then $0.0200.
Binance Trade Setup: $RARE is a low-liquidity, high-volatility NFT token. A cautious long only on a confirmed hold above $0.0130** with volume, targeting **$0.0150–$0.0200**, stop below **$0.0120. Thin order books mean slippage can be significant—use limit orders. DYOR.
#RARE #analises #Binance
$RARE is trading near $0.0128**, down about **0.16% in 24 hours** and roughly **9.5% from its recent high of $0.026 hit earlier this week. Despite the pullback, the token remains up 4.07% over the past 7 days, showing mixed short-term momentum.
Key Context: SuperRare is the governance token for the leading NFT art marketplace on Ethereum. The token is fully unlocked—no future vesting overhang—with 82.5% of supply circulating and a market cap near $10.5 million. This reduces dilution risk but also removes unlock-driven catalysts.
Market Activity: Spot trading volume sits at $764K in 24 hours**, while futures volume is **4x higher at $3.2M, suggesting leverage is driving price action. Open interest is **$3.38M**, with minimal liquidations (~$306), indicating a relatively calm derivatives market.
Key Levels: Support sits near $0.0120–$0.0125, with deeper support at $0.0110**. Resistance is **$0.0150, then $0.0200.
Binance Trade Setup: $RARE is a low-liquidity, high-volatility NFT token. A cautious long only on a confirmed hold above $0.0130** with volume, targeting **$0.0150–$0.0200**, stop below **$0.0120. Thin order books mean slippage can be significant—use limit orders. DYOR.
#RARE #analises #Binance
13
Moonbeam ($GLMR ) Market Update: Migration Shockwaves, Technical Breakdown Accelerates
$GLMR is trading near $0.0066, down roughly 16% in 24 hours, as the token continues to absorb the fallout from its dramatic network migration. The project has officially withdrawn from Polkadot and is now rebuilding on Base as an AI-agent settlement layer .
The Bearish Case: Technicals are overwhelmingly negative. GLMR sits below all major moving averages (MA5 through MA200), with RSI at 37 and a "Very Bearish" rating from multiple sources . The token has recorded 37 separate 5%+ daily drops over the past year, a brutal downtrend . Recent price action shows a sharp rejection from $0.0087, falling 10.42% in a single hour .
The Nuance: The migration to Base is complete, and $GLMR is pivoting toward AI-agent commerce (ERC-8004/8183 standards) . Funding rates sit at +0.0000%, meaning neither side is paying to hold positions—suggesting this could be a washout rather than panic capitulation .
Key Levels: $0.0067–$0.0070 must hold to avoid a slide toward $0.0062**. Resistance sits at **$0.00775 (MA5), then $0.0082 (MA20).
Binance Trade Setup: Stay flat. The structural trend is broken, and there is no confirmed reversal signal. A short-term bounce could occur if Bollinger lower band ($0.0068) holds, but the risk/reward favors patience until price reclaims at least **$0.0075** with volume. DYOR — this is a post-migration asset in price discovery.
#GLMRUSDT #analises #Binance
{spot}(GLMRUSDT)
Moonbeam ($GLMR ) Market Update: Migration Shockwaves, Technical Breakdown Accelerates
$GLMR is trading near $0.0066, down roughly 16% in 24 hours, as the token continues to absorb the fallout from its dramatic network migration. The project has officially withdrawn from Polkadot and is now rebuilding on Base as an AI-agent settlement layer .
The Bearish Case: Technicals are overwhelmingly negative. GLMR sits below all major moving averages (MA5 through MA200), with RSI at 37 and a "Very Bearish" rating from multiple sources . The token has recorded 37 separate 5%+ daily drops over the past year, a brutal downtrend . Recent price action shows a sharp rejection from $0.0087, falling 10.42% in a single hour .
The Nuance: The migration to Base is complete, and $GLMR is pivoting toward AI-agent commerce (ERC-8004/8183 standards) . Funding rates sit at +0.0000%, meaning neither side is paying to hold positions—suggesting this could be a washout rather than panic capitulation .
Key Levels: $0.0067–$0.0070 must hold to avoid a slide toward $0.0062**. Resistance sits at **$0.00775 (MA5), then $0.0082 (MA20).
Binance Trade Setup: Stay flat. The structural trend is broken, and there is no confirmed reversal signal. A short-term bounce could occur if Bollinger lower band ($0.0068) holds, but the risk/reward favors patience until price reclaims at least **$0.0075** with volume. DYOR — this is a post-migration asset in price discovery.
#GLMRUSDT #analises #Binance
$GLMR is trading near $0.0066, down roughly 16% in 24 hours, as the token continues to absorb the fallout from its dramatic network migration. The project has officially withdrawn from Polkadot and is now rebuilding on Base as an AI-agent settlement layer .
The Bearish Case: Technicals are overwhelmingly negative. GLMR sits below all major moving averages (MA5 through MA200), with RSI at 37 and a "Very Bearish" rating from multiple sources . The token has recorded 37 separate 5%+ daily drops over the past year, a brutal downtrend . Recent price action shows a sharp rejection from $0.0087, falling 10.42% in a single hour .
The Nuance: The migration to Base is complete, and $GLMR is pivoting toward AI-agent commerce (ERC-8004/8183 standards) . Funding rates sit at +0.0000%, meaning neither side is paying to hold positions—suggesting this could be a washout rather than panic capitulation .
Key Levels: $0.0067–$0.0070 must hold to avoid a slide toward $0.0062**. Resistance sits at **$0.00775 (MA5), then $0.0082 (MA20).
Binance Trade Setup: Stay flat. The structural trend is broken, and there is no confirmed reversal signal. A short-term bounce could occur if Bollinger lower band ($0.0068) holds, but the risk/reward favors patience until price reclaims at least **$0.0075** with volume. DYOR — this is a post-migration asset in price discovery.
#GLMRUSDT #analises #Binance
37
PAX Gold ($PAXG ) Market Update: Gold Pullback Deepens, Key Support at $4,100 in Focus
$PAXG is trading near **$4,160**, down roughly **2.7%** in 24 hours as it slides to its lowest level since early August. The token has now printed a series of lower highs — $4,510 in early September, $4,390 mid-month, and $4,300 last week — confirming a short-term downtrend. The 20 EMA has crossed below the 50 EMA, a bearish signal.
Key Levels: The immediate floor sits at **$4,100**, a zone that has held three times since late June. A daily close below $4,100 would open the major $4,000** support, the structural floor since June. On the upside, PAXG must reclaim the EMA cluster at **$4,313–$4,334** to shift momentum, with the prior swing high at **$4,674 as the next real test.
Context: PAXG remains a gold hedge, not a momentum trade. Gold's pullback on easing inflation fears has dragged the token lower, but long-term demand stays intact — Kamino now accepts PAXG as collateral, and Paxos launched yield-bearing PAXG on Sept. 24.
Binance Trade Setup: Wait for stabilization. A cautious long only if $PAXG holds $4,100** with volume, targeting **$4,300–$4,350**, stop below **$4,000. DYOR — PAXG tracks gold, not crypto sentiment.
#PAXG #analises #Binance
{spot}(PAXGUSDT)
PAX Gold ($PAXG ) Market Update: Gold Pullback Deepens, Key Support at $4,100 in Focus
$PAXG is trading near **$4,160**, down roughly **2.7%** in 24 hours as it slides to its lowest level since early August. The token has now printed a series of lower highs — $4,510 in early September, $4,390 mid-month, and $4,300 last week — confirming a short-term downtrend. The 20 EMA has crossed below the 50 EMA, a bearish signal.
Key Levels: The immediate floor sits at **$4,100**, a zone that has held three times since late June. A daily close below $4,100 would open the major $4,000** support, the structural floor since June. On the upside, PAXG must reclaim the EMA cluster at **$4,313–$4,334** to shift momentum, with the prior swing high at **$4,674 as the next real test.
Context: PAXG remains a gold hedge, not a momentum trade. Gold's pullback on easing inflation fears has dragged the token lower, but long-term demand stays intact — Kamino now accepts PAXG as collateral, and Paxos launched yield-bearing PAXG on Sept. 24.
Binance Trade Setup: Wait for stabilization. A cautious long only if $PAXG holds $4,100** with volume, targeting **$4,300–$4,350**, stop below **$4,000. DYOR — PAXG tracks gold, not crypto sentiment.
#PAXG #analises #Binance
$PAXG is trading near **$4,160**, down roughly **2.7%** in 24 hours as it slides to its lowest level since early August. The token has now printed a series of lower highs — $4,510 in early September, $4,390 mid-month, and $4,300 last week — confirming a short-term downtrend. The 20 EMA has crossed below the 50 EMA, a bearish signal.
Key Levels: The immediate floor sits at **$4,100**, a zone that has held three times since late June. A daily close below $4,100 would open the major $4,000** support, the structural floor since June. On the upside, PAXG must reclaim the EMA cluster at **$4,313–$4,334** to shift momentum, with the prior swing high at **$4,674 as the next real test.
Context: PAXG remains a gold hedge, not a momentum trade. Gold's pullback on easing inflation fears has dragged the token lower, but long-term demand stays intact — Kamino now accepts PAXG as collateral, and Paxos launched yield-bearing PAXG on Sept. 24.
Binance Trade Setup: Wait for stabilization. A cautious long only if $PAXG holds $4,100** with volume, targeting **$4,300–$4,350**, stop below **$4,000. DYOR — PAXG tracks gold, not crypto sentiment.
#PAXG #analises #Binance
143
Quant ($QNT ) Market Update: Parabolic Rally Faces Violent Pullback, $227 Becomes Critical Line
$QNT is trading near $260**, down sharply from its intraday peak of **$373 as profit-taking and short-covering exhaustion hit the token . The pullback comes after a staggering 300%+ weekly surge driven by Quant's selection to power The Clearing House's On-Chain Money Initiative—a network handling $2+ trillion in daily US payments .
The Catalyst Is Real, But Token Demand Is Unclear: Quant provides the interoperability layer for tokenized deposits, but neither party confirmed banks must buy QNT tokens to use the network . The deal launches in H1 2027, making current price action heavily narrative-driven .
Technical Warning Signals: RSI hit 95 on the daily—one of the most extreme overbought readings possible . Aroon Up at 92% with Aroon Down at 0% confirms the vertical move . Analyst EGRAG identifies $227** as the key validation level—holding above suggests genuine buyer conviction; losing it raises "liquidity trap" concerns with downside targets at **$165, $115, and $75 .
Binance Trade Setup: Avoid chasing. A cautious long only if $QNT reclaims $290–$320 with volume, targeting $350–$370, stop below $249** . If **$249 breaks, expect deeper correction. DYOR—this is a news-driven spike with no confirmed token value accrual.
#QNT #analises #Binance
{spot}(QNTUSDT)
Quant ($QNT ) Market Update: Parabolic Rally Faces Violent Pullback, $227 Becomes Critical Line
$QNT is trading near $260**, down sharply from its intraday peak of **$373 as profit-taking and short-covering exhaustion hit the token . The pullback comes after a staggering 300%+ weekly surge driven by Quant's selection to power The Clearing House's On-Chain Money Initiative—a network handling $2+ trillion in daily US payments .
The Catalyst Is Real, But Token Demand Is Unclear: Quant provides the interoperability layer for tokenized deposits, but neither party confirmed banks must buy QNT tokens to use the network . The deal launches in H1 2027, making current price action heavily narrative-driven .
Technical Warning Signals: RSI hit 95 on the daily—one of the most extreme overbought readings possible . Aroon Up at 92% with Aroon Down at 0% confirms the vertical move . Analyst EGRAG identifies $227** as the key validation level—holding above suggests genuine buyer conviction; losing it raises "liquidity trap" concerns with downside targets at **$165, $115, and $75 .
Binance Trade Setup: Avoid chasing. A cautious long only if $QNT reclaims $290–$320 with volume, targeting $350–$370, stop below $249** . If **$249 breaks, expect deeper correction. DYOR—this is a news-driven spike with no confirmed token value accrual.
#QNT #analises #Binance
$QNT is trading near $260**, down sharply from its intraday peak of **$373 as profit-taking and short-covering exhaustion hit the token . The pullback comes after a staggering 300%+ weekly surge driven by Quant's selection to power The Clearing House's On-Chain Money Initiative—a network handling $2+ trillion in daily US payments .
The Catalyst Is Real, But Token Demand Is Unclear: Quant provides the interoperability layer for tokenized deposits, but neither party confirmed banks must buy QNT tokens to use the network . The deal launches in H1 2027, making current price action heavily narrative-driven .
Technical Warning Signals: RSI hit 95 on the daily—one of the most extreme overbought readings possible . Aroon Up at 92% with Aroon Down at 0% confirms the vertical move . Analyst EGRAG identifies $227** as the key validation level—holding above suggests genuine buyer conviction; losing it raises "liquidity trap" concerns with downside targets at **$165, $115, and $75 .
Binance Trade Setup: Avoid chasing. A cautious long only if $QNT reclaims $290–$320 with volume, targeting $350–$370, stop below $249** . If **$249 breaks, expect deeper correction. DYOR—this is a news-driven spike with no confirmed token value accrual.
#QNT #analises #Binance
1
259
Dogecoin ($DOGE ) Market Update: Tightening Triangle Nears Apex, Breakout Direction Unclear
$DOGE is trading near $0.0973**, up **2.4%** in 24 hours and **11%** over the past week. The token has held above the **$0.09150 support level, but price action is compressing into a symmetrical triangle on the 4-hour chart—a pattern that typically resolves with a sharp directional move.
Bullish Catalysts: Grayscale's $DOGE fund pulled in roughly $2.6M over the past month**, the strongest inflow since launch. Spot DOGE ETFs recorded **$1.2M in net inflows this week, with flows returning after three weeks of zero. Whale addresses accumulated 240M DOGE during the September dip.
Derivatives Positioning: Open interest sits at $1.57B, a one-month high, with the Binance long/short ratio at 2.30—longs heavily outnumber shorts.
Key Levels: A confirmed 4H close above the falling trendline with volume opens $0.10585**, then **$0.11297–$0.11857**. Support is **$0.09150; a break opens $0.08470–$0.07833.
Binance Trade Setup: Consider a cautious long on a confirmed breakout above the triangle with volume, targeting $0.105–$0.118, stop below $0.0915. DYOR—triangle breakouts can resolve either way.
#DOGE #analises #BİNANCE
{spot}(DOGEUSDT)
Dogecoin ($DOGE ) Market Update: Tightening Triangle Nears Apex, Breakout Direction Unclear
$DOGE is trading near $0.0973**, up **2.4%** in 24 hours and **11%** over the past week. The token has held above the **$0.09150 support level, but price action is compressing into a symmetrical triangle on the 4-hour chart—a pattern that typically resolves with a sharp directional move.
Bullish Catalysts: Grayscale's $DOGE fund pulled in roughly $2.6M over the past month**, the strongest inflow since launch. Spot DOGE ETFs recorded **$1.2M in net inflows this week, with flows returning after three weeks of zero. Whale addresses accumulated 240M DOGE during the September dip.
Derivatives Positioning: Open interest sits at $1.57B, a one-month high, with the Binance long/short ratio at 2.30—longs heavily outnumber shorts.
Key Levels: A confirmed 4H close above the falling trendline with volume opens $0.10585**, then **$0.11297–$0.11857**. Support is **$0.09150; a break opens $0.08470–$0.07833.
Binance Trade Setup: Consider a cautious long on a confirmed breakout above the triangle with volume, targeting $0.105–$0.118, stop below $0.0915. DYOR—triangle breakouts can resolve either way.
#DOGE #analises #BİNANCE
$DOGE is trading near $0.0973**, up **2.4%** in 24 hours and **11%** over the past week. The token has held above the **$0.09150 support level, but price action is compressing into a symmetrical triangle on the 4-hour chart—a pattern that typically resolves with a sharp directional move.
Bullish Catalysts: Grayscale's $DOGE fund pulled in roughly $2.6M over the past month**, the strongest inflow since launch. Spot DOGE ETFs recorded **$1.2M in net inflows this week, with flows returning after three weeks of zero. Whale addresses accumulated 240M DOGE during the September dip.
Derivatives Positioning: Open interest sits at $1.57B, a one-month high, with the Binance long/short ratio at 2.30—longs heavily outnumber shorts.
Key Levels: A confirmed 4H close above the falling trendline with volume opens $0.10585**, then **$0.11297–$0.11857**. Support is **$0.09150; a break opens $0.08470–$0.07833.
Binance Trade Setup: Consider a cautious long on a confirmed breakout above the triangle with volume, targeting $0.105–$0.118, stop below $0.0915. DYOR—triangle breakouts can resolve either way.
#DOGE #analises #BİNANCE
44

·
--
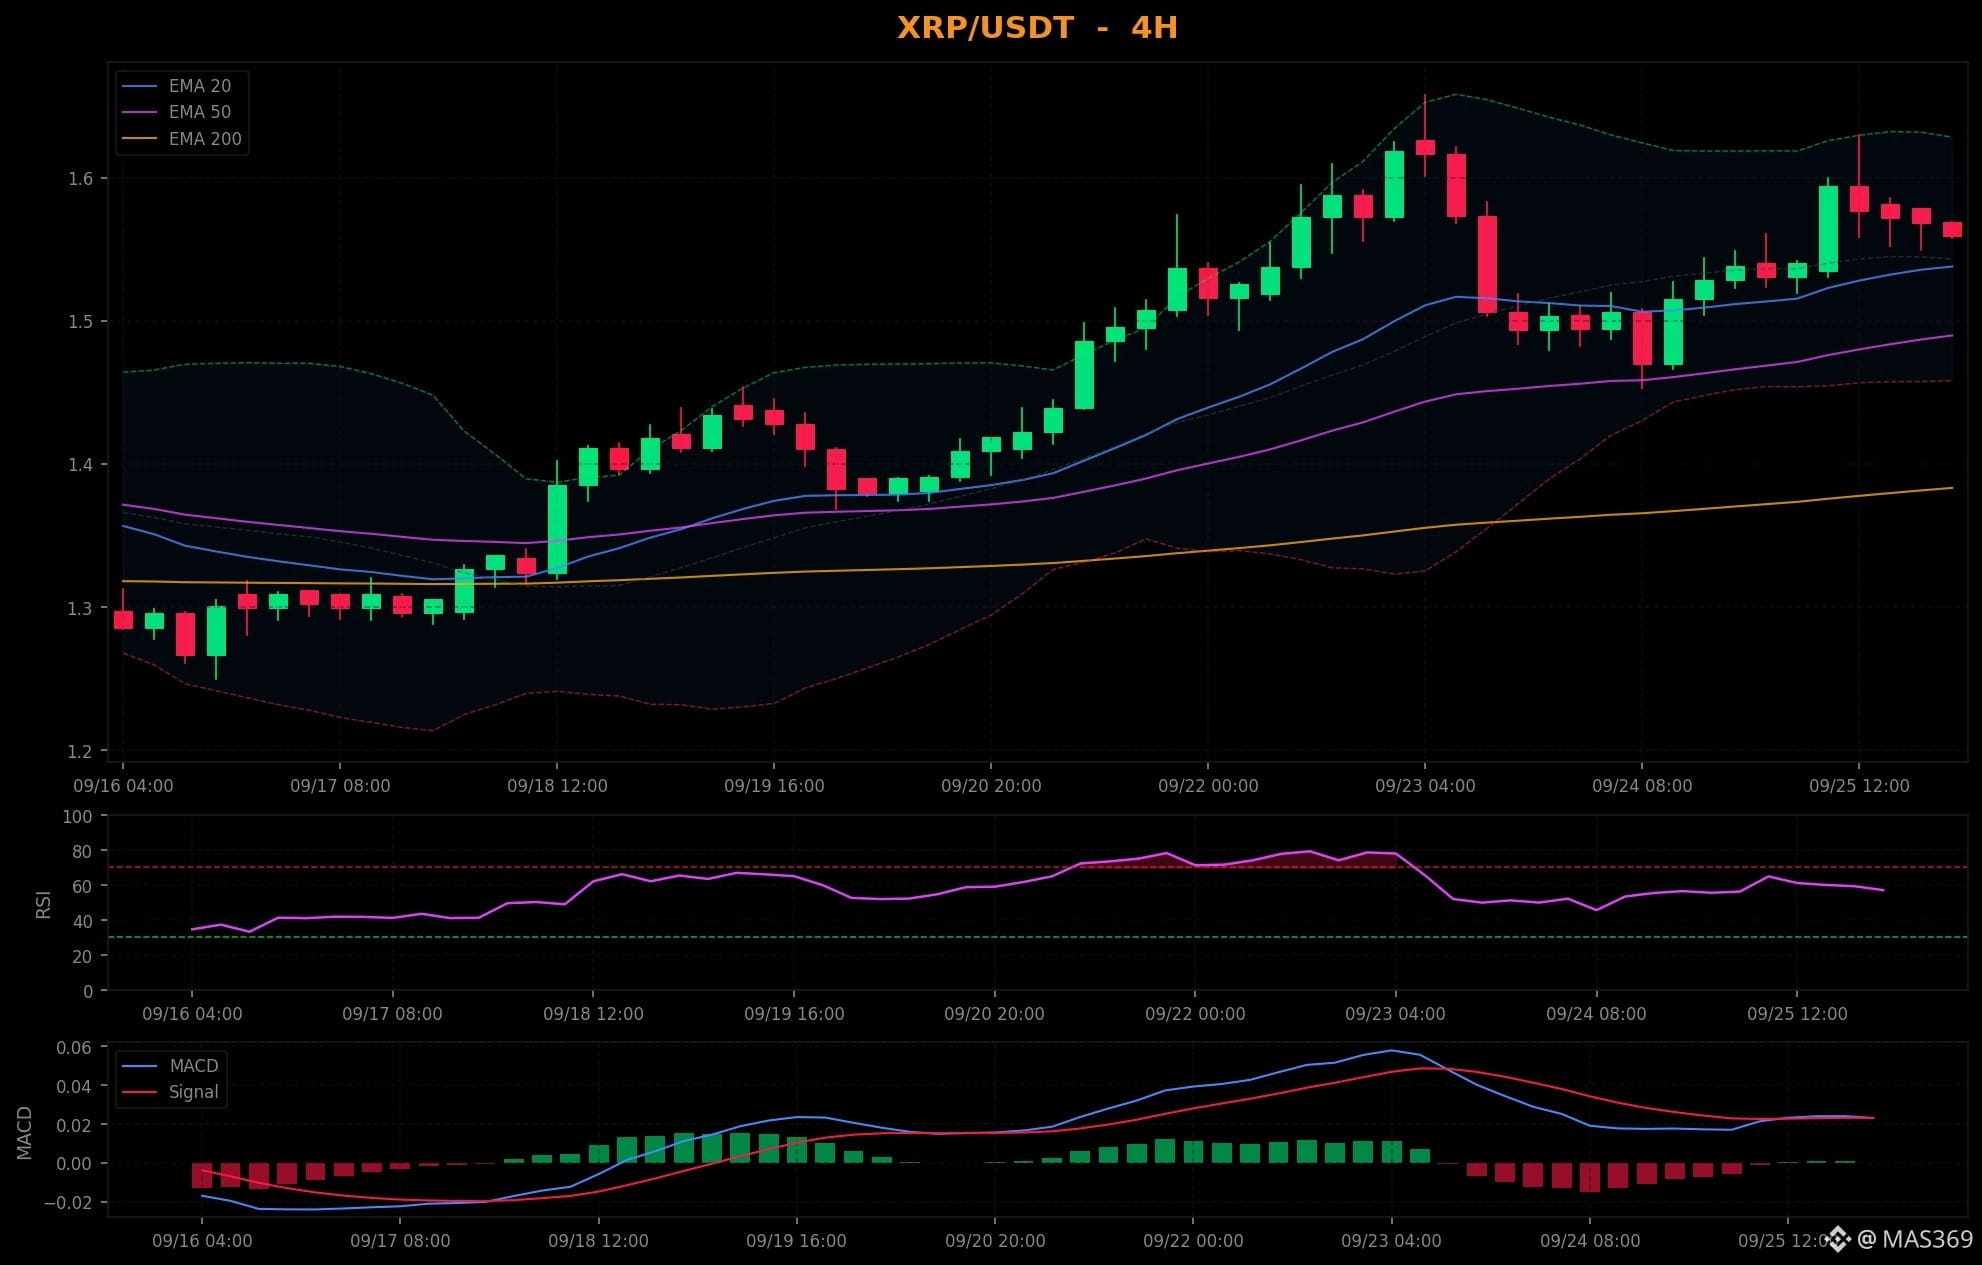
$XRP Analysis
👁🗨 The 4H timeframe for $XRP is currently caught in a consolidation phase. Price is chopping between dynamic levels, and we are waiting for a clear break of structure.
⚖️ Momentum indicators are flattening out. MACD is hovering around the zero line, and RSI is sitting at 57.0, reflecting indecision among buyers and sellers.
From a volatility standpoint, price is trading within the Bollinger Bands. Volume is currently drying up (0.1x average), so keep an eye out for a sudden volatility spike. The Stochastic is at 64.1 (neutral).
🔔 Key Levels:
Break above $1.658 ignites upside. Losing $1.288 opens doors for correction.
🟡 Bias: Neutral (Buy 3/6 | Sell 3/6)
{future}(XRPUSDT)
#Xrp🔥🔥 #analises
$XRP Analysis
👁🗨 The 4H timeframe for $XRP is currently caught in a consolidation phase. Price is chopping between dynamic levels, and we are waiting for a clear break of structure.
⚖️ Momentum indicators are flattening out. MACD is hovering around the zero line, and RSI is sitting at 57.0, reflecting indecision among buyers and sellers.
From a volatility standpoint, price is trading within the Bollinger Bands. Volume is currently drying up (0.1x average), so keep an eye out for a sudden volatility spike. The Stochastic is at 64.1 (neutral).
🔔 Key Levels:
Break above $1.658 ignites upside. Losing $1.288 opens doors for correction.
🟡 Bias: Neutral (Buy 3/6 | Sell 3/6)
#Xrp🔥🔥 #analises
👁🗨 The 4H timeframe for $XRP is currently caught in a consolidation phase. Price is chopping between dynamic levels, and we are waiting for a clear break of structure.
⚖️ Momentum indicators are flattening out. MACD is hovering around the zero line, and RSI is sitting at 57.0, reflecting indecision among buyers and sellers.
From a volatility standpoint, price is trading within the Bollinger Bands. Volume is currently drying up (0.1x average), so keep an eye out for a sudden volatility spike. The Stochastic is at 64.1 (neutral).
🔔 Key Levels:
Break above $1.658 ignites upside. Losing $1.288 opens doors for correction.
🟡 Bias: Neutral (Buy 3/6 | Sell 3/6)
#Xrp🔥🔥 #analises
114

Article
BMT: The Tool That "Spies" on Crypto Sharks — Is It Worth It in 2026?BMT: The Tool That "Spies" on Crypto Sharks — Is It Worth It in 2026?$
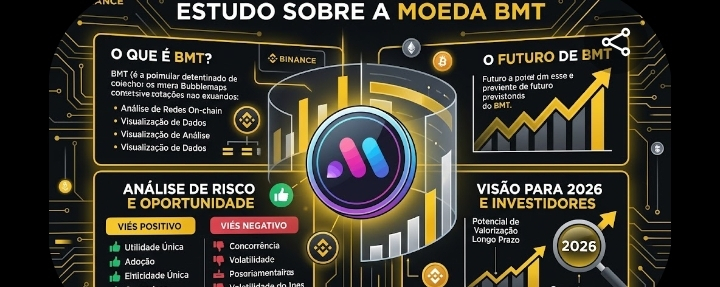
What Is Bubblemaps (BMT)?
Before talking about the coin, it’s important to understand the product. Bubblemaps is an on-chain data visualization platform. Instead of showing endless lists of wallet addresses, it turns that information into colorful bubble maps that instantly reveal who controls what. For example, you can see whether a token is concentrated in the hands of a few "sharks" or if it’s well distributed among the community.
BMT: The Tool That "Spies" on Crypto Sharks — Is It Worth It in 2026?
BMT: The Tool That "Spies" on Crypto Sharks — Is It Worth It in 2026?$
What Is Bubblemaps (BMT)?
Before talking about the coin, it’s important to understand the product. Bubblemaps is an on-chain data visualization platform. Instead of showing endless lists of wallet addresses, it turns that information into colorful bubble maps that instantly reveal who controls what. For example, you can see whether a token is concentrated in the hands of a few "sharks" or if it’s well distributed among the community.
What Is Bubblemaps (BMT)?
Before talking about the coin, it’s important to understand the product. Bubblemaps is an on-chain data visualization platform. Instead of showing endless lists of wallet addresses, it turns that information into colorful bubble maps that instantly reveal who controls what. For example, you can see whether a token is concentrated in the hands of a few "sharks" or if it’s well distributed among the community.
1
155
Official Trump ($TRUMP ) Market Update: $1.93 Support Critical as Team Dumps $70M+ Post-Unlock
$TRUMP is trading near $2.07**, down roughly **11% over the past week**, hovering just above the critical **$1.93 support level that defines its short-term survival.
Key Red Flag: Since the September 18 unlock, the team has moved aggressively. Over the past two weeks, they transferred ~31 million TRUMP (~$70.64M)** to BitGo custody, with **8.4 million tokens (~$18M) flowing directly to OKX exchange addresses within four days of the unlock. A middleman wallet still holds 1.6 million TRUMP (~$3.4M) ready to send—a clear signal of ongoing sell pressure.
Technical Picture: The $1.93 level sits at the lower edge of a pennant pattern. CryptoQuant shows seller-dominant CVD across both spot and futures markets. RSI at 46.6 remains below its moving average, with no oversold reversal signal yet.
Key Levels: Hold $1.93** → potential bounce to **$2.02–$2.30**. Break below → next downside target at **$1.68, with $1.50 as deeper support.
Binance Trade Setup: The structure remains heavily bearish. Stay flat—chasing longs into relentless team transfers is risky. Only consider a cautious long if $TRUMP reclaims $2.10** with volume, targeting **$2.30, stop below $1.93. DYOR — token unlocks and team selling dominate this setup.
#TRUMP #memecoin🚀🚀🚀 #analises #Binance
{spot}(TRUMPUSDT)
Official Trump ($TRUMP ) Market Update: $1.93 Support Critical as Team Dumps $70M+ Post-Unlock
$TRUMP is trading near $2.07**, down roughly **11% over the past week**, hovering just above the critical **$1.93 support level that defines its short-term survival.
Key Red Flag: Since the September 18 unlock, the team has moved aggressively. Over the past two weeks, they transferred ~31 million TRUMP (~$70.64M)** to BitGo custody, with **8.4 million tokens (~$18M) flowing directly to OKX exchange addresses within four days of the unlock. A middleman wallet still holds 1.6 million TRUMP (~$3.4M) ready to send—a clear signal of ongoing sell pressure.
Technical Picture: The $1.93 level sits at the lower edge of a pennant pattern. CryptoQuant shows seller-dominant CVD across both spot and futures markets. RSI at 46.6 remains below its moving average, with no oversold reversal signal yet.
Key Levels: Hold $1.93** → potential bounce to **$2.02–$2.30**. Break below → next downside target at **$1.68, with $1.50 as deeper support.
Binance Trade Setup: The structure remains heavily bearish. Stay flat—chasing longs into relentless team transfers is risky. Only consider a cautious long if $TRUMP reclaims $2.10** with volume, targeting **$2.30, stop below $1.93. DYOR — token unlocks and team selling dominate this setup.
#TRUMP #memecoin🚀🚀🚀 #analises #Binance
$TRUMP is trading near $2.07**, down roughly **11% over the past week**, hovering just above the critical **$1.93 support level that defines its short-term survival.
Key Red Flag: Since the September 18 unlock, the team has moved aggressively. Over the past two weeks, they transferred ~31 million TRUMP (~$70.64M)** to BitGo custody, with **8.4 million tokens (~$18M) flowing directly to OKX exchange addresses within four days of the unlock. A middleman wallet still holds 1.6 million TRUMP (~$3.4M) ready to send—a clear signal of ongoing sell pressure.
Technical Picture: The $1.93 level sits at the lower edge of a pennant pattern. CryptoQuant shows seller-dominant CVD across both spot and futures markets. RSI at 46.6 remains below its moving average, with no oversold reversal signal yet.
Key Levels: Hold $1.93** → potential bounce to **$2.02–$2.30**. Break below → next downside target at **$1.68, with $1.50 as deeper support.
Binance Trade Setup: The structure remains heavily bearish. Stay flat—chasing longs into relentless team transfers is risky. Only consider a cautious long if $TRUMP reclaims $2.10** with volume, targeting **$2.30, stop below $1.93. DYOR — token unlocks and team selling dominate this setup.
#TRUMP #memecoin🚀🚀🚀 #analises #Binance
31
Shiba Inu ($SHIB ) Market Update: Strongest Q3 in Five Years, But $0.0000060 Resistance Caps Rally
$SHIB is trading near $0.00000577**, retreating roughly **10%** from its local peak of **$0.00000620 after sellers aggressively defended the $0.0000060–$0.0000063 zone . The pullback brought price back to its 200-day moving average around $0.00000560, a level it had just broken above .
Bullish Backdrop: SHIB delivered its best Q3 in five years, gaining 44.1% cumulatively (July +12.2%, August +7.55%, September +19.4%) . A new whale withdrew 162 billion SHIB (~$672K) from Coinbase Prime into cold storage, signaling quiet institutional accumulation . Exchange reserves have been steadily declining, with net outflows of 74 billion $SHIB indicating reduced sell-side supply .
Key Levels: $0.0000055–$0.0000056 is the critical support—a daily close below weakens the breakout structure, opening $0.0000054** and then **$0.0000051–$0.0000052** . Resistance remains **$0.0000060–$0.0000063**, with a confirmed break targeting **$0.0000065–$0.0000067 .
Binance Trade Setup: The recovery structure favors bulls if $0.0000056** holds. Consider a **cautious long** on a confirmed bounce with volume, targeting **$0.0000060–$0.0000063**, stop below **$0.0000054. DYOR — leverage amplifies both directions.
#SHIB #Shibalnu #analises #Binance
{spot}(SHIBUSDT)
Shiba Inu ($SHIB ) Market Update: Strongest Q3 in Five Years, But $0.0000060 Resistance Caps Rally
$SHIB is trading near $0.00000577**, retreating roughly **10%** from its local peak of **$0.00000620 after sellers aggressively defended the $0.0000060–$0.0000063 zone . The pullback brought price back to its 200-day moving average around $0.00000560, a level it had just broken above .
Bullish Backdrop: SHIB delivered its best Q3 in five years, gaining 44.1% cumulatively (July +12.2%, August +7.55%, September +19.4%) . A new whale withdrew 162 billion SHIB (~$672K) from Coinbase Prime into cold storage, signaling quiet institutional accumulation . Exchange reserves have been steadily declining, with net outflows of 74 billion $SHIB indicating reduced sell-side supply .
Key Levels: $0.0000055–$0.0000056 is the critical support—a daily close below weakens the breakout structure, opening $0.0000054** and then **$0.0000051–$0.0000052** . Resistance remains **$0.0000060–$0.0000063**, with a confirmed break targeting **$0.0000065–$0.0000067 .
Binance Trade Setup: The recovery structure favors bulls if $0.0000056** holds. Consider a **cautious long** on a confirmed bounce with volume, targeting **$0.0000060–$0.0000063**, stop below **$0.0000054. DYOR — leverage amplifies both directions.
#SHIB #Shibalnu #analises #Binance
$SHIB is trading near $0.00000577**, retreating roughly **10%** from its local peak of **$0.00000620 after sellers aggressively defended the $0.0000060–$0.0000063 zone . The pullback brought price back to its 200-day moving average around $0.00000560, a level it had just broken above .
Bullish Backdrop: SHIB delivered its best Q3 in five years, gaining 44.1% cumulatively (July +12.2%, August +7.55%, September +19.4%) . A new whale withdrew 162 billion SHIB (~$672K) from Coinbase Prime into cold storage, signaling quiet institutional accumulation . Exchange reserves have been steadily declining, with net outflows of 74 billion $SHIB indicating reduced sell-side supply .
Key Levels: $0.0000055–$0.0000056 is the critical support—a daily close below weakens the breakout structure, opening $0.0000054** and then **$0.0000051–$0.0000052** . Resistance remains **$0.0000060–$0.0000063**, with a confirmed break targeting **$0.0000065–$0.0000067 .
Binance Trade Setup: The recovery structure favors bulls if $0.0000056** holds. Consider a **cautious long** on a confirmed bounce with volume, targeting **$0.0000060–$0.0000063**, stop below **$0.0000054. DYOR — leverage amplifies both directions.
#SHIB #Shibalnu #analises #Binance
38
Bitcoin ($BTC ) Market Update: Macro Pressures Cap Rally, $82K Support in Focus
$BTC is trading near $84,200**, down from a recent high of **$87,381 as rising Treasury yields and hawkish Fed expectations weigh on risk assets. The 10-year US Treasury yield has moved above 5%, and markets now price a 75% probability of another Fed rate hike in October.
Key Support: The **$82,000** zone is critical—this was the breakout level that fueled the rally toward $87K. A successful defense keeps the bullish structure intact; a break below could trigger a deeper pullback toward $78,000.
Institutional Demand: Spot Bitcoin ETFs recorded $2.65 billion in inflows over five consecutive days**, with holders of **100-1,000 BTC accumulating over 113,000 BTC since mid-July**. However, ETF inflows slowed sharply to **$28.1 million on September 24 after stronger buying earlier in the week.
Derivatives Risk: Open interest fell 16% to ~$376 billion**, with **$80 million in long liquidations during intraday volatility. The September 25 options expiry adds short-term volatility risk.
Binance Trade Setup: Consider a cautious long if $BTC holds $82,000** with volume, targeting **$87,000–$90,000**, stop below **$80,000. If support breaks, stay flat. DYOR—macro headwinds remain dominant.
#BTC #analises #Binance
{spot}(BTCUSDT)
Bitcoin ($BTC ) Market Update: Macro Pressures Cap Rally, $82K Support in Focus
$BTC is trading near $84,200**, down from a recent high of **$87,381 as rising Treasury yields and hawkish Fed expectations weigh on risk assets. The 10-year US Treasury yield has moved above 5%, and markets now price a 75% probability of another Fed rate hike in October.
Key Support: The **$82,000** zone is critical—this was the breakout level that fueled the rally toward $87K. A successful defense keeps the bullish structure intact; a break below could trigger a deeper pullback toward $78,000.
Institutional Demand: Spot Bitcoin ETFs recorded $2.65 billion in inflows over five consecutive days**, with holders of **100-1,000 BTC accumulating over 113,000 BTC since mid-July**. However, ETF inflows slowed sharply to **$28.1 million on September 24 after stronger buying earlier in the week.
Derivatives Risk: Open interest fell 16% to ~$376 billion**, with **$80 million in long liquidations during intraday volatility. The September 25 options expiry adds short-term volatility risk.
Binance Trade Setup: Consider a cautious long if $BTC holds $82,000** with volume, targeting **$87,000–$90,000**, stop below **$80,000. If support breaks, stay flat. DYOR—macro headwinds remain dominant.
#BTC #analises #Binance
$BTC is trading near $84,200**, down from a recent high of **$87,381 as rising Treasury yields and hawkish Fed expectations weigh on risk assets. The 10-year US Treasury yield has moved above 5%, and markets now price a 75% probability of another Fed rate hike in October.
Key Support: The **$82,000** zone is critical—this was the breakout level that fueled the rally toward $87K. A successful defense keeps the bullish structure intact; a break below could trigger a deeper pullback toward $78,000.
Institutional Demand: Spot Bitcoin ETFs recorded $2.65 billion in inflows over five consecutive days**, with holders of **100-1,000 BTC accumulating over 113,000 BTC since mid-July**. However, ETF inflows slowed sharply to **$28.1 million on September 24 after stronger buying earlier in the week.
Derivatives Risk: Open interest fell 16% to ~$376 billion**, with **$80 million in long liquidations during intraday volatility. The September 25 options expiry adds short-term volatility risk.
Binance Trade Setup: Consider a cautious long if $BTC holds $82,000** with volume, targeting **$87,000–$90,000**, stop below **$80,000. If support breaks, stay flat. DYOR—macro headwinds remain dominant.
#BTC #analises #Binance
77

·
--
📉➡️📈 BTC on Weekly: The "pause" is over—will a big rebound be next?
Friends, today I want to share a more macro view. Sometimes we get lost in the 4H or 1H noise, but Bitcoin’s weekly chart gives a very clear perspective: the main bullish uptrend is still intact, and price is setting up for the next impulse.
🔍 What I see on the chart:
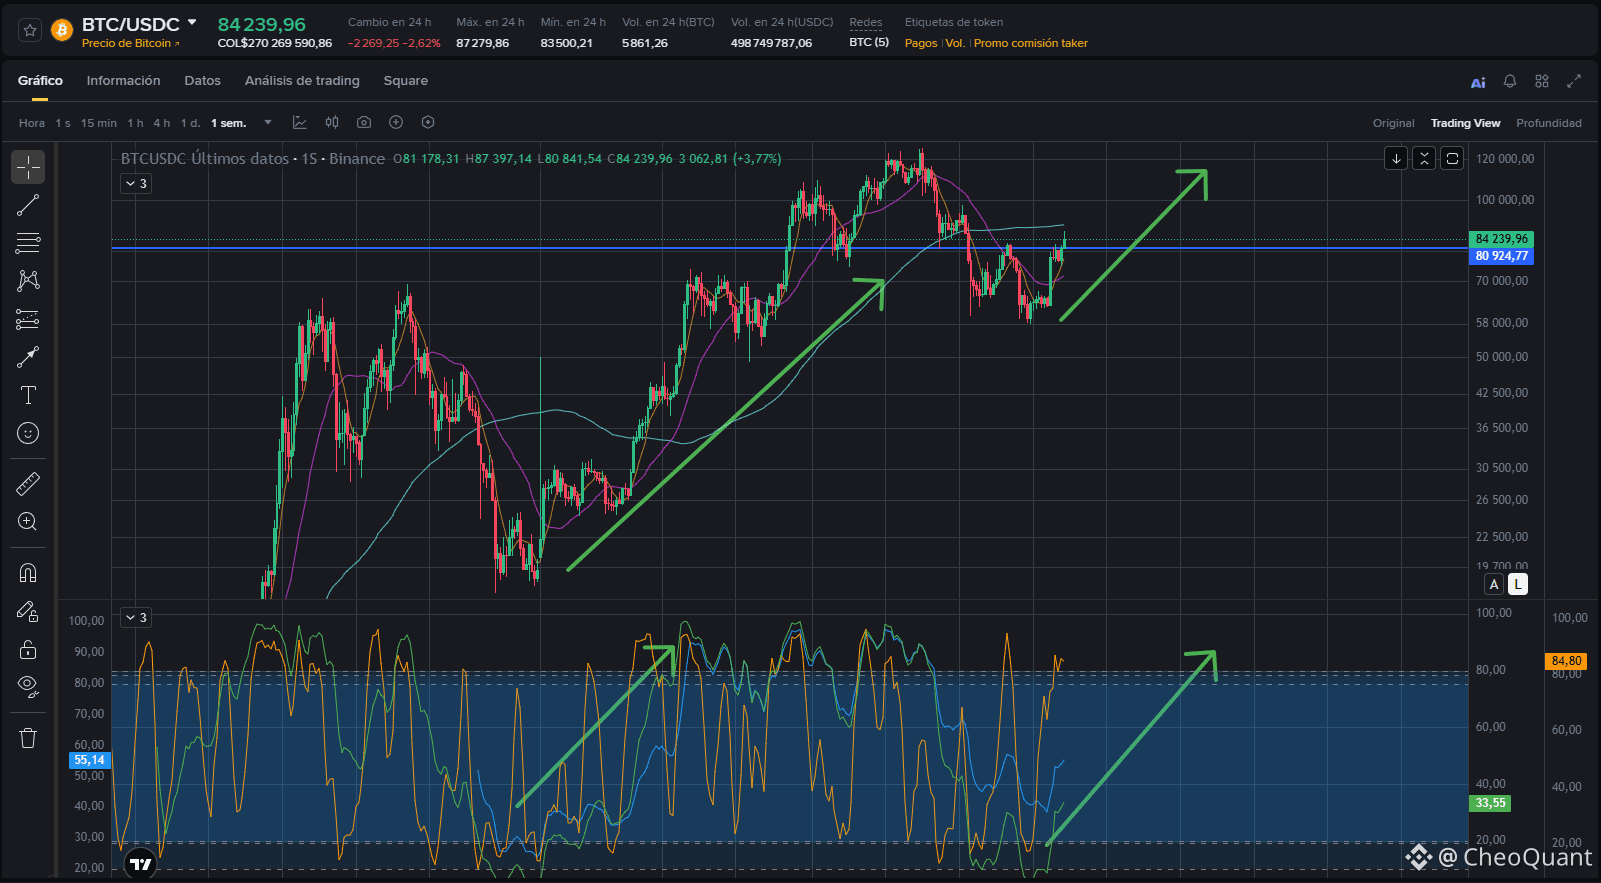
Macro support: After the correction from all-time highs, BTC found firm buyers in the $75K-$80K area. It’s currently trading at ~ $84,239, holding just above the blue structural support line at $80,974.
RSI is the key: Look at the lower indicator. The RSI has cooled down, coming out of the oversold zone and bouncing upward (currently at 55.14). This means the asset still has plenty of room to grow before returning to overbought conditions. The green arrow I drew projects that next move.
Structure of "higher lows": The drop didn’t break the structure. If price keeps the $80K support on the weekly close, the path toward new highs is mathematically alive.
🎯 Scenarios to watch:
Bullish (Breakout): If we see a solid weekly close above $86K-$87K, the way opens toward $95K and eventually a hunt for previous highs (the $100K+ zone), as indicated by the green projection arrow.
Neutral/Correction: A pullback to the $78K-$80K zone would be a healthy "retest." As long as we don’t lose $75K on the weekly, I consider it an accumulation opportunity, not a panic signal.
💡 My take as an enthusiast:
The market often presents opportunities when fear is around. As I always say, I’m not a financial advisor—I’m only sharing what I see on the candles. NFA. DYOR. 🧠
What do you think? Will we break $90K this week, or will we keep ranging?
And as always, if you want me to analyze another crypto, leave it in the comments! 👇
$BTC #bitcoin in #Crypto #Binance anceSquare #Trading #analises isTécnico #Macro
📉➡️📈 BTC on Weekly: The "pause" is over—will a big rebound be next?
Friends, today I want to share a more macro view. Sometimes we get lost in the 4H or 1H noise, but Bitcoin’s weekly chart gives a very clear perspective: the main bullish uptrend is still intact, and price is setting up for the next impulse.
🔍 What I see on the chart:
Macro support: After the correction from all-time highs, BTC found firm buyers in the $75K-$80K area. It’s currently trading at ~ $84,239, holding just above the blue structural support line at $80,974.
RSI is the key: Look at the lower indicator. The RSI has cooled down, coming out of the oversold zone and bouncing upward (currently at 55.14). This means the asset still has plenty of room to grow before returning to overbought conditions. The green arrow I drew projects that next move.
Structure of "higher lows": The drop didn’t break the structure. If price keeps the $80K support on the weekly close, the path toward new highs is mathematically alive.
🎯 Scenarios to watch:
Bullish (Breakout): If we see a solid weekly close above $86K-$87K, the way opens toward $95K and eventually a hunt for previous highs (the $100K+ zone), as indicated by the green projection arrow.
Neutral/Correction: A pullback to the $78K-$80K zone would be a healthy "retest." As long as we don’t lose $75K on the weekly, I consider it an accumulation opportunity, not a panic signal.
💡 My take as an enthusiast:
The market often presents opportunities when fear is around. As I always say, I’m not a financial advisor—I’m only sharing what I see on the candles. NFA. DYOR. 🧠
What do you think? Will we break $90K this week, or will we keep ranging?
And as always, if you want me to analyze another crypto, leave it in the comments! 👇
$BTC #bitcoin in #Crypto #Binance anceSquare #Trading #analises isTécnico #Macro
Friends, today I want to share a more macro view. Sometimes we get lost in the 4H or 1H noise, but Bitcoin’s weekly chart gives a very clear perspective: the main bullish uptrend is still intact, and price is setting up for the next impulse.
🔍 What I see on the chart:
Macro support: After the correction from all-time highs, BTC found firm buyers in the $75K-$80K area. It’s currently trading at ~ $84,239, holding just above the blue structural support line at $80,974.
RSI is the key: Look at the lower indicator. The RSI has cooled down, coming out of the oversold zone and bouncing upward (currently at 55.14). This means the asset still has plenty of room to grow before returning to overbought conditions. The green arrow I drew projects that next move.
Structure of "higher lows": The drop didn’t break the structure. If price keeps the $80K support on the weekly close, the path toward new highs is mathematically alive.
🎯 Scenarios to watch:
Bullish (Breakout): If we see a solid weekly close above $86K-$87K, the way opens toward $95K and eventually a hunt for previous highs (the $100K+ zone), as indicated by the green projection arrow.
Neutral/Correction: A pullback to the $78K-$80K zone would be a healthy "retest." As long as we don’t lose $75K on the weekly, I consider it an accumulation opportunity, not a panic signal.
💡 My take as an enthusiast:
The market often presents opportunities when fear is around. As I always say, I’m not a financial advisor—I’m only sharing what I see on the candles. NFA. DYOR. 🧠
What do you think? Will we break $90K this week, or will we keep ranging?
And as always, if you want me to analyze another crypto, leave it in the comments! 👇
$BTC #bitcoin in #Crypto #Binance anceSquare #Trading #analises isTécnico #Macro
1
119
Filecoin ($FIL ) Market Update: Supply Shock Narrative Fuels Rally, $0.86 Resistance Now Critical
$FIL is trading near $0.84, up roughly 22% this week as traders aggressively front-run the October 15 vesting cliff—the largest supply event in Filecoin's history .
Key Catalyst: Protocol Labs and Filecoin Foundation's six-year vesting ends October 15, cutting annual gross issuance by 75%—from ~88M FIL to ~22M FIL per year . This removes roughly 66.7M FIL annually in new supply, a structural shift the market is pricing in .
Technical Picture: $FIL broke out of a multi-month descending channel and now tests the $0.86 resistance** that has capped every rally since August . It trades above **SMA 7 ($0.86), SMA 20 ($0.81), and SMA 50 ($0.75)—a clean bullish stack . But the taker buy/sell ratio at 0.89 shows sellers dominating aggressive flow, and open interest dropped 13% in 24 hours, signaling profit-taking .
Key Levels: Support is $0.81**, then **$0.75–$0.76**. Resistance is **$0.86, then $0.90–$0.93 .
Binance Trade Setup: Consider a cautious long only on a confirmed daily close above $0.86** with volume, targeting **$0.90–$1.00**, stop below **$0.81. If rejected, expect a pullback toward $0.75–$0.76 . DYOR—investing events invite "buy the rumor, sell the news" volatility
#FIL🧿 #Filecoin #analises #Binance
{spot}(FILUSDT)
Filecoin ($FIL ) Market Update: Supply Shock Narrative Fuels Rally, $0.86 Resistance Now Critical
$FIL is trading near $0.84, up roughly 22% this week as traders aggressively front-run the October 15 vesting cliff—the largest supply event in Filecoin's history .
Key Catalyst: Protocol Labs and Filecoin Foundation's six-year vesting ends October 15, cutting annual gross issuance by 75%—from ~88M FIL to ~22M FIL per year . This removes roughly 66.7M FIL annually in new supply, a structural shift the market is pricing in .
Technical Picture: $FIL broke out of a multi-month descending channel and now tests the $0.86 resistance** that has capped every rally since August . It trades above **SMA 7 ($0.86), SMA 20 ($0.81), and SMA 50 ($0.75)—a clean bullish stack . But the taker buy/sell ratio at 0.89 shows sellers dominating aggressive flow, and open interest dropped 13% in 24 hours, signaling profit-taking .
Key Levels: Support is $0.81**, then **$0.75–$0.76**. Resistance is **$0.86, then $0.90–$0.93 .
Binance Trade Setup: Consider a cautious long only on a confirmed daily close above $0.86** with volume, targeting **$0.90–$1.00**, stop below **$0.81. If rejected, expect a pullback toward $0.75–$0.76 . DYOR—investing events invite "buy the rumor, sell the news" volatility
#FIL🧿 #Filecoin #analises #Binance
$FIL is trading near $0.84, up roughly 22% this week as traders aggressively front-run the October 15 vesting cliff—the largest supply event in Filecoin's history .
Key Catalyst: Protocol Labs and Filecoin Foundation's six-year vesting ends October 15, cutting annual gross issuance by 75%—from ~88M FIL to ~22M FIL per year . This removes roughly 66.7M FIL annually in new supply, a structural shift the market is pricing in .
Technical Picture: $FIL broke out of a multi-month descending channel and now tests the $0.86 resistance** that has capped every rally since August . It trades above **SMA 7 ($0.86), SMA 20 ($0.81), and SMA 50 ($0.75)—a clean bullish stack . But the taker buy/sell ratio at 0.89 shows sellers dominating aggressive flow, and open interest dropped 13% in 24 hours, signaling profit-taking .
Key Levels: Support is $0.81**, then **$0.75–$0.76**. Resistance is **$0.86, then $0.90–$0.93 .
Binance Trade Setup: Consider a cautious long only on a confirmed daily close above $0.86** with volume, targeting **$0.90–$1.00**, stop below **$0.81. If rejected, expect a pullback toward $0.75–$0.76 . DYOR—investing events invite "buy the rumor, sell the news" volatility
#FIL🧿 #Filecoin #analises #Binance
325
$XRP Market Update: Whale Accumulation Fuels Breakout Attempt, $1.50 Is the Line in the Sand
$XRP is trading near $1.52**, up roughly **18.9% over the past week**, after breaking above a September descending trendline that had capped every rally . The surge was powered by massive whale accumulation—large holders added **1.54 billion XRP (~$2.2 billion) over 96 hours, with balances rising from 8.1 billion to 9.7 billion .
Key Catalyst: Ripple's custody service launched with South African bank Absa, adding institutional credibility . Realized price distribution shows the next major supply wall at $1.60, where ~2.5 billion XRP last changed hands .
Risk Signals: MACD has flatlined at zero, signaling momentum exhaustion at this key test . Taker buy/sell ratio sits at 0.81, meaning aggressive sellers are outpacing buyers despite bullish positioning .
Key Levels: Support sits at $1.39–$1.35, with the 200-day EMA at $1.36** as the critical defense . Resistance is **$1.60, then $1.80–$2.00 .
Binance Trade Setup: A cautious long only if $XRP holds $1.50** on a weekly close with volume, targeting **$1.60–$1.80**, stop below **$1.35. A rejection at $1.50 risks a slide back to **$1.30** . DYOR — leverage cuts both ways.
#xrp #analises #BİNANCE
{spot}(XRPUSDT)
$XRP Market Update: Whale Accumulation Fuels Breakout Attempt, $1.50 Is the Line in the Sand
$XRP is trading near $1.52**, up roughly **18.9% over the past week**, after breaking above a September descending trendline that had capped every rally . The surge was powered by massive whale accumulation—large holders added **1.54 billion XRP (~$2.2 billion) over 96 hours, with balances rising from 8.1 billion to 9.7 billion .
Key Catalyst: Ripple's custody service launched with South African bank Absa, adding institutional credibility . Realized price distribution shows the next major supply wall at $1.60, where ~2.5 billion XRP last changed hands .
Risk Signals: MACD has flatlined at zero, signaling momentum exhaustion at this key test . Taker buy/sell ratio sits at 0.81, meaning aggressive sellers are outpacing buyers despite bullish positioning .
Key Levels: Support sits at $1.39–$1.35, with the 200-day EMA at $1.36** as the critical defense . Resistance is **$1.60, then $1.80–$2.00 .
Binance Trade Setup: A cautious long only if $XRP holds $1.50** on a weekly close with volume, targeting **$1.60–$1.80**, stop below **$1.35. A rejection at $1.50 risks a slide back to **$1.30** . DYOR — leverage cuts both ways.
#xrp #analises #BİNANCE
$XRP is trading near $1.52**, up roughly **18.9% over the past week**, after breaking above a September descending trendline that had capped every rally . The surge was powered by massive whale accumulation—large holders added **1.54 billion XRP (~$2.2 billion) over 96 hours, with balances rising from 8.1 billion to 9.7 billion .
Key Catalyst: Ripple's custody service launched with South African bank Absa, adding institutional credibility . Realized price distribution shows the next major supply wall at $1.60, where ~2.5 billion XRP last changed hands .
Risk Signals: MACD has flatlined at zero, signaling momentum exhaustion at this key test . Taker buy/sell ratio sits at 0.81, meaning aggressive sellers are outpacing buyers despite bullish positioning .
Key Levels: Support sits at $1.39–$1.35, with the 200-day EMA at $1.36** as the critical defense . Resistance is **$1.60, then $1.80–$2.00 .
Binance Trade Setup: A cautious long only if $XRP holds $1.50** on a weekly close with volume, targeting **$1.60–$1.80**, stop below **$1.35. A rejection at $1.50 risks a slide back to **$1.30** . DYOR — leverage cuts both ways.
#xrp #analises #BİNANCE
33

NoPainNoGainBrazil
·
--
🚨 SOLANA (SOL) IN A DECISIVE MOMENT: Where Are the Ceiling and Floor?
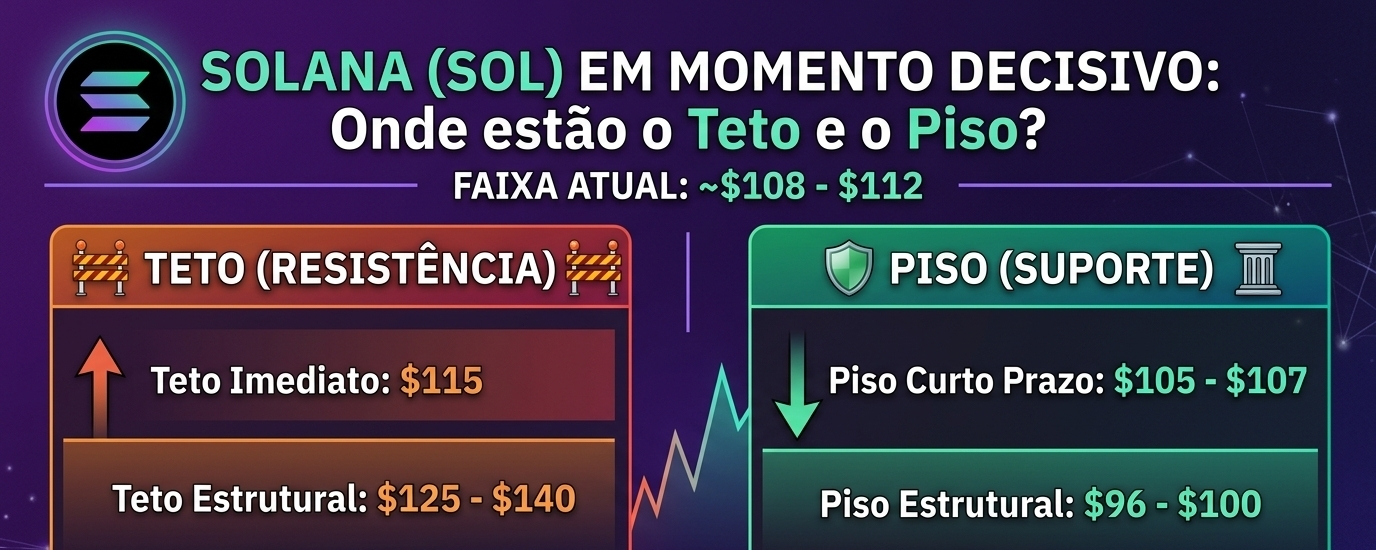
The token $SOL is testing crucial market zones in this final stretch of September 2026, trading in the range of $108 to $112. With the recent recovery of the uptrend structure and the increase in on-chain activity, the market is watching the next targets and protection levels.
Here is the updated mapping of the critical levels for you to adjust your strategy:
🚧 The Ceiling (Resistance Zones)
The upper limit that SOL needs to break to accelerate the uptrend:
* Immediate Ceiling ($112 - $115): This is the main short-term barrier. Breaking and consolidating the price above this range confirms the bullish pattern and attracts more buy-side volume.
Here is the updated mapping of the critical levels for you to adjust your strategy:
🚧 The Ceiling (Resistance Zones)
The upper limit that SOL needs to break to accelerate the uptrend:
* Immediate Ceiling ($112 - $115): This is the main short-term barrier. Breaking and consolidating the price above this range confirms the bullish pattern and attracts more buy-side volume.
225
Zcash ($ZEC ) Market Update: $1,374–$1,380 Long Liquidation Wall Looms, Spot Accumulation Signals Divergence
$ZEC is trading near $1,445**, down roughly **7.7% in 24 hours** after peaking around **$1,595 earlier in the session . The pullback has placed four large long positions on Hyperliquid—worth approximately $17.98 million combined**—less than 5% away from liquidation, with the heaviest cluster sitting at **$1,374–$1,380 .
Key Divergence: Binance top traders remain 72% short, yet spot market buyers continue absorbing supply, creating a persistent gap between derivatives positioning and actual buying pressure . The largest single holder, Garrett Jin, holds a massive ZEC position valued at $312.8 million** with unrealized profits near **$224.5 million—his liquidation price on the short side sits far higher at $2,540, so no immediate squeeze pressure from that side .
Key Levels: A break below $1,374** could trigger cascading liquidations toward **$1,255–$1,055**. Resistance sits at **$1,500–$1,595, with RSI above 70 signaling extended conditions .
Binance Trade Setup: The compressed liquidation zone makes this a high-risk, event-driven setup. A cautious long only if $ZEC defends $1,374** with volume, targeting **$1,500+, stop below $1,350**. If support breaks, stay flat or short toward **$1,255. DYOR—leverage amplifies both directions
#zec #analises #Binance #zcash
{spot}(ZECUSDT)
Zcash ($ZEC ) Market Update: $1,374–$1,380 Long Liquidation Wall Looms, Spot Accumulation Signals Divergence
$ZEC is trading near $1,445**, down roughly **7.7% in 24 hours** after peaking around **$1,595 earlier in the session . The pullback has placed four large long positions on Hyperliquid—worth approximately $17.98 million combined**—less than 5% away from liquidation, with the heaviest cluster sitting at **$1,374–$1,380 .
Key Divergence: Binance top traders remain 72% short, yet spot market buyers continue absorbing supply, creating a persistent gap between derivatives positioning and actual buying pressure . The largest single holder, Garrett Jin, holds a massive ZEC position valued at $312.8 million** with unrealized profits near **$224.5 million—his liquidation price on the short side sits far higher at $2,540, so no immediate squeeze pressure from that side .
Key Levels: A break below $1,374** could trigger cascading liquidations toward **$1,255–$1,055**. Resistance sits at **$1,500–$1,595, with RSI above 70 signaling extended conditions .
Binance Trade Setup: The compressed liquidation zone makes this a high-risk, event-driven setup. A cautious long only if $ZEC defends $1,374** with volume, targeting **$1,500+, stop below $1,350**. If support breaks, stay flat or short toward **$1,255. DYOR—leverage amplifies both directions
#zec #analises #Binance #zcash
$ZEC is trading near $1,445**, down roughly **7.7% in 24 hours** after peaking around **$1,595 earlier in the session . The pullback has placed four large long positions on Hyperliquid—worth approximately $17.98 million combined**—less than 5% away from liquidation, with the heaviest cluster sitting at **$1,374–$1,380 .
Key Divergence: Binance top traders remain 72% short, yet spot market buyers continue absorbing supply, creating a persistent gap between derivatives positioning and actual buying pressure . The largest single holder, Garrett Jin, holds a massive ZEC position valued at $312.8 million** with unrealized profits near **$224.5 million—his liquidation price on the short side sits far higher at $2,540, so no immediate squeeze pressure from that side .
Key Levels: A break below $1,374** could trigger cascading liquidations toward **$1,255–$1,055**. Resistance sits at **$1,500–$1,595, with RSI above 70 signaling extended conditions .
Binance Trade Setup: The compressed liquidation zone makes this a high-risk, event-driven setup. A cautious long only if $ZEC defends $1,374** with volume, targeting **$1,500+, stop below $1,350**. If support breaks, stay flat or short toward **$1,255. DYOR—leverage amplifies both directions
#zec #analises #Binance #zcash
272
Log in to explore more content
Join global crypto users on Binance Square
⚡️ Get latest and useful information about crypto.
💬 Trusted by the world’s largest crypto exchange.
👍 Discover real insights from verified creators.
Email / Phone number
Trending Topics
1
#UKFCAWinsCourtOrderToRecover851400Pounds
3,951 views
300 Discussing
2
#ChainlinkLaunchesCCIP2WithEnterpriseVerification
15,444 views
584 Discussing
3
#GoldFallsTo$4144
6,872 views
107 Discussing
4
#QNTFallsOver40%FromMorningHigh
46,626 views
985 Discussing
5
#USDTAdds845900HoldersInPast7Days
4,284 views
231 Discussing
6
#KospiFalls2.7%SamsungSKHynixDropOver5%
11,465 views
437 Discussing
7
#BitgetCEOConfirms$388MStolenInHack
3,701 views
38 Discussing
8
#BTCFallsBelow$83000
21,025 views
146 Discussing
9
#BitgetDetailsSecurityIncidentTimeline
26,699 views
596 Discussing
10
#BitcoinSpotETFs$2.39BWeeklyNetInflow
8,624 views
38 Discussing