tradingstrategy

6.1M views
27,645 Discussing
Miss coit
·
--
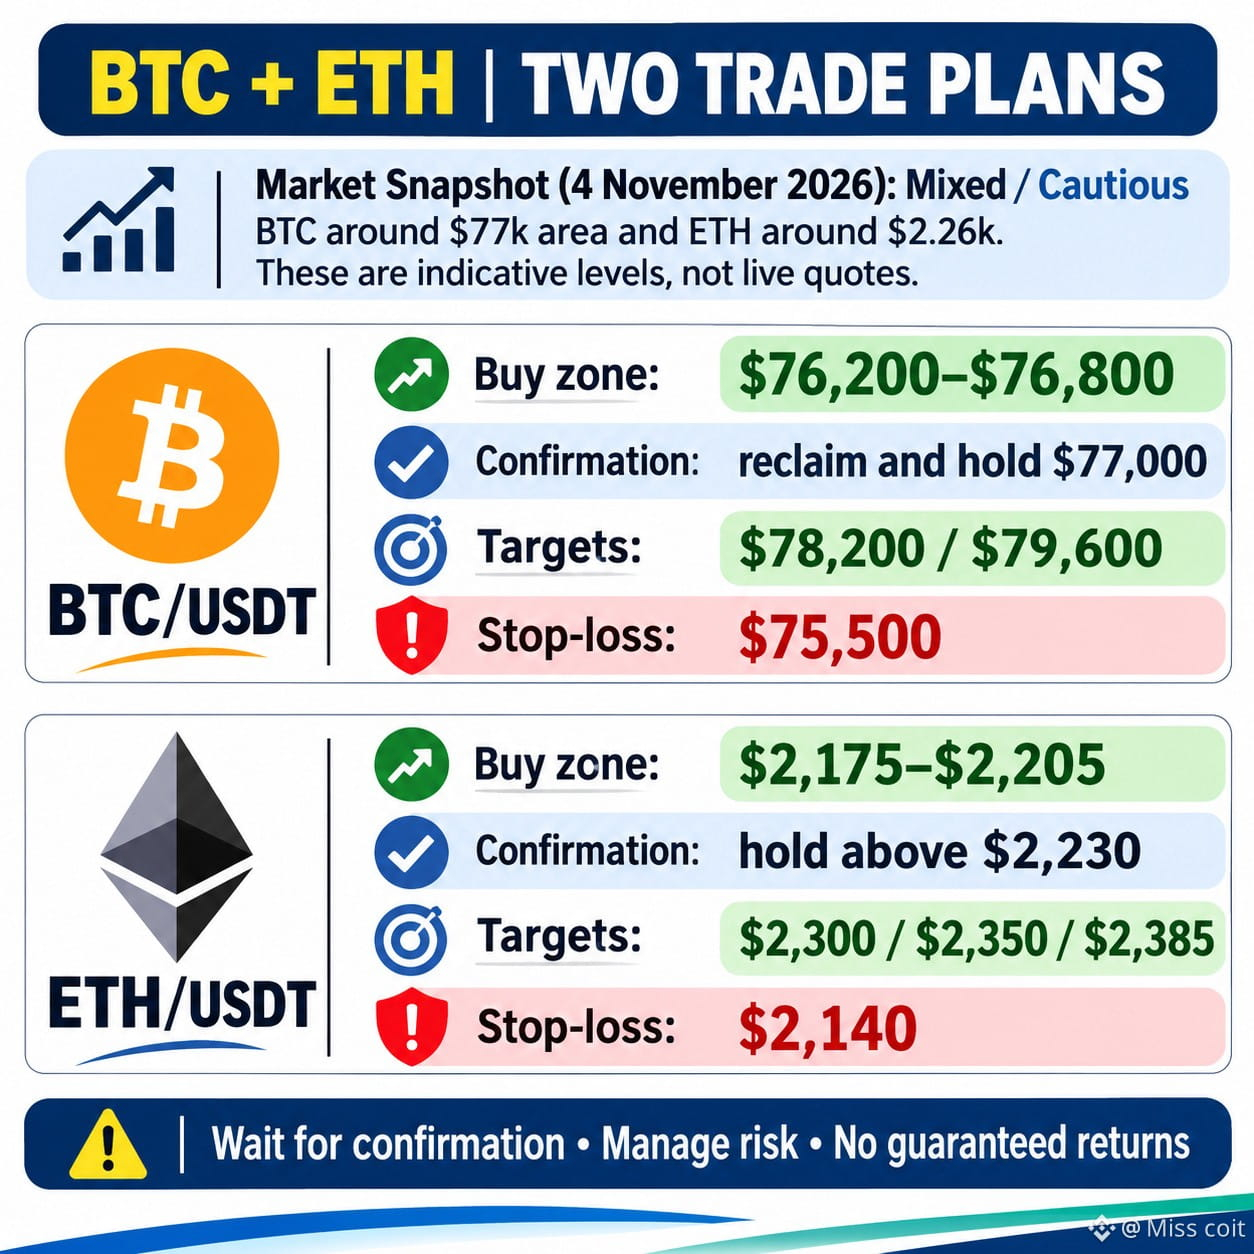
🔥 TWO COINS. TWO OPPORTUNITIES. WHICH ONE WILL MOVE FIRST? The crypto market is showing a cautious recovery. I am watching BTC and ETH for potential long entries, but confirmation is important. 🟠 1. BTC/USDT – LONG SETUP - Buy Zone: $76,200–$76,800 - Entry Confirmation: Reclaim and hold $77,000 - TP1: $78,200 - TP2: $79,600 - Stop Loss: $75,500 🔵 2. ETH/USDT – LONG SETUP - Buy Zone: $2,175–$2,205 - Entry Confirmation: Hold above $2,230 - TP1: $2,300 - TP2: $2,350 - TP3: $2,385 - Stop Loss: $2,140 MY TRADING PLAN: I will wait for confirmation instead of chasing green candles. If support fails, I will avoid the long setup and reassess. Which setup has better potential today: $BTC or $ETH {future}(ETHUSDT) #BTC #ETH #CryptoTrading #BinanceSquare #TradingStrategy
🔥 TWO COINS. TWO OPPORTUNITIES. WHICH ONE WILL MOVE FIRST?

The crypto market is showing a cautious recovery. I am watching BTC and ETH for potential long entries, but confirmation is important.

🟠 1. BTC/USDT – LONG SETUP

- Buy Zone: $76,200–$76,800
- Entry Confirmation: Reclaim and hold $77,000
- TP1: $78,200
- TP2: $79,600
- Stop Loss: $75,500

🔵 2. ETH/USDT – LONG SETUP

- Buy Zone: $2,175–$2,205
- Entry Confirmation: Hold above $2,230
- TP1: $2,300
- TP2: $2,350
- TP3: $2,385
- Stop Loss: $2,140

MY TRADING PLAN:

I will wait for confirmation instead of chasing green candles. If support fails, I will avoid the long setup and reassess.

Which setup has better potential today: $BTC or $ETH

#BTC #ETH #CryptoTrading #BinanceSquare #TradingStrategy
⚔️ The Ultimate Showdown: Crypto Titan vs. Market Wizard! Who Rules the Charts? The crypto market is a battlefield, and everyone has a favorite general. Today, we are pinning two different trading philosophies against each other. In one corner, we have the Aggressive Trend Rider 🚀—the trader who hunts for high-leverage momentum, embraces high volatility, and aims for the moon. In the opposite corner, we have the Disciplined Risk Manager 🛡️—the trader who relies on strict stop-losses, compound interest, patient price action, and capital preservation. Both have made millions, but their paths couldn't be more different. One relies on maximum adrenaline; the other relies on ice-cold patience. 👇 Drop your thoughts in the comments: Which trading style fits your personality? Are you a high-risk profit hunter or a slow-and-steady wealth builder? Tag your favorite trader below! Let’s settle this in the comments! 👇 #BinanceSquare #CryptoTrading. #WhaleWatch #tradingStrategy #bullmarket $BTC {spot}(BTCUSDT) $ETH {spot}(ETHUSDT) $SOL {spot}(SOLUSDT) 🤑🤑🤑🤑🤑🤑🤑🤑🤑🤑🤑🤑🤑🤑
⚔️ The Ultimate Showdown: Crypto Titan vs. Market Wizard! Who Rules the Charts?

The crypto market is a battlefield, and everyone has a favorite general. Today, we are pinning two different trading philosophies against each other.

In one corner, we have the Aggressive Trend Rider 🚀—the trader who hunts for high-leverage momentum, embraces high volatility, and aims for the moon.

In the opposite corner, we have the Disciplined Risk Manager 🛡️—the trader who relies on strict stop-losses, compound interest, patient price action, and capital preservation.

Both have made millions, but their paths couldn't be more different. One relies on maximum adrenaline; the other relies on ice-cold patience.

👇 Drop your thoughts in the comments:

Which trading style fits your personality?

Are you a high-risk profit hunter or a slow-and-steady wealth builder?

Tag your favorite trader below!

Let’s settle this in the comments! 👇

#BinanceSquare #CryptoTrading. #WhaleWatch #tradingStrategy #bullmarket

$BTC
$ETH
$SOL
🤑🤑🤑🤑🤑🤑🤑🤑🤑🤑🤑🤑🤑🤑
Ethereum Up or Down on November 4?

Ethereum Up or Down on November 4?

79%Up21%Down
Volume $65,234.4
📊 Binance PICK: Smart Money Follows Data, Not Hype! 🚀 The market rewards patience, not impulsive decisions. Before making a prediction, I focus on 3 key factors: 🔹 Price Action: Is the market forming higher highs or lower lows? 🔹 Volume: Is momentum supported by real buying or selling pressure? 🔹 Sentiment: Are traders confident, or is the market driven by fear? 🎯 The real edge isn’t predicting every move — it’s managing risk and waiting for high-probability opportunities. 👇 Let’s discuss! What’s your current BTC outlook? 🐂 BULLISH — A breakout is coming. 🐻 BEARISH — More downside ahead. 🦀 NEUTRAL — The market needs confirmation. Drop your view in the comments and tell us which key level BTC must break next. 👇 #BinancePICK #BinanceSquare #Bitcoin #CryptoMarket #TradingStrategy ⚠️ Disclaimer: DYOR before making any trading decisions. This post is for educational purposes only and is not financial advice. Trade at your own risk.
📊 Binance PICK: Smart Money Follows Data, Not Hype! 🚀

The market rewards patience, not impulsive decisions.

Before making a prediction, I focus on 3 key factors:
🔹 Price Action: Is the market forming higher highs or lower lows?
🔹 Volume: Is momentum supported by real buying or selling pressure?
🔹 Sentiment: Are traders confident, or is the market driven by fear?

🎯 The real edge isn’t predicting every move — it’s managing risk and waiting for high-probability opportunities.

👇 Let’s discuss!

What’s your current BTC outlook?

🐂 BULLISH — A breakout is coming.
🐻 BEARISH — More downside ahead.
🦀 NEUTRAL — The market needs confirmation.

Drop your view in the comments and tell us which key level BTC must break next. 👇

#BinancePICK #BinanceSquare #Bitcoin #CryptoMarket #TradingStrategy

⚠️ Disclaimer: DYOR before making any trading decisions. This post is for educational purposes only and is not financial advice. Trade at your own risk.
·
--
Bullish
​🚨 US Elections & Crypto Market Prediction: Massive Bull Run or Bear Trap Ahead? 🇺🇸📊 ​With the US Midterm Elections shaking up the political landscape, volatility across the crypto market is at a peak. Every trader is asking the same question right now: Will $BTC pump or dump from here? ​Here is my market breakdown and trading plan: ​1. Short-Term Outlook (Bearish Volatility / Dip Risk): Historically, US midterm election weeks bring heavy uncertainty and short-term corrections. If Congress shifts and creates regulatory gridlock, we could see a quick 5%–10% shakeout as over-leveraged positions get flushed. Keep a close eye on the crucial $76.5K–$77.5K support zone (200-day EMA) for $BTC. A breakdown below this could trigger a quick liquidity sweep downward. ​2. Long-Term Outlook (100% Bullish History): Zoom out! History shows that US Midterm Elections have consistently marked major cycle bottoms followed by massive 12-month rallies: ​Post-2014 Midterms: Strong recovery rally ​Post-2018 Midterms: +44.9% in 12 months ​Post-2022 Midterms: +92.3% in 12 months ​Once election uncertainty clears, institutional Spot ETF flows and macro liquidity take back control. ​My Trading Strategy: Avoid high-leverage gambling on election headlines. I am treating any short-term post-election dip into strong support zones as a golden opportunity to accumulate $BTC, $ETH, and $SOL for the next major leg up! 🚀 ​What is your move right now? Are you Buying the Dip 🟢 or Waiting on the Sidelines 🔴? Drop your prediction in the comments! 👇 ​$BTC $ETH $BNB $SOL #USElections #Bitcoin #CryptoMarket #BullRun #CryptoPrediction #TradingStrategy #BinanceSquare #Write2Earn #MarketUpdate
​🚨 US Elections & Crypto Market Prediction: Massive Bull Run or Bear Trap Ahead? 🇺🇸📊
​With the US Midterm Elections shaking up the political landscape, volatility across the crypto market is at a peak. Every trader is asking the same question right now: Will $BTC pump or dump from here?
​Here is my market breakdown and trading plan:

​1. Short-Term Outlook (Bearish Volatility / Dip Risk):
Historically, US midterm election weeks bring heavy uncertainty and short-term corrections. If Congress shifts and creates regulatory gridlock, we could see a quick 5%–10% shakeout as over-leveraged positions get flushed. Keep a close eye on the crucial $76.5K–$77.5K support zone (200-day EMA) for $BTC. A breakdown below this could trigger a quick liquidity sweep downward.

​2. Long-Term Outlook (100% Bullish History):
Zoom out! History shows that US Midterm Elections have consistently marked major cycle bottoms followed by massive 12-month rallies:

​Post-2014 Midterms: Strong recovery rally
​Post-2018 Midterms: +44.9% in 12 months
​Post-2022 Midterms: +92.3% in 12 months
​Once election uncertainty clears, institutional Spot ETF flows and macro liquidity take back control.

​My Trading Strategy:
Avoid high-leverage gambling on election headlines. I am treating any short-term post-election dip into strong support zones as a golden opportunity to accumulate $BTC, $ETH, and $SOL for the next major leg up! 🚀
​What is your move right now? Are you Buying the Dip 🟢 or Waiting on the Sidelines 🔴? Drop your prediction in the comments! 👇
​$BTC $ETH $BNB $SOL
#USElections #Bitcoin #CryptoMarket #BullRun #CryptoPrediction #TradingStrategy #BinanceSquare #Write2Earn #MarketUpdate
$1.04B ETF Outflows vs. Institutional Dip Buying: Why $BTC, $SOL, and$XRP Refused to Crash below $76K Everyone on the timeline is panicking over US Midterm Election volatility and the recent $1.04 Billion in combined Bitcoin ETF outflows ($643M Friday + $399M Monday). Yet every single time $BTC dipped toward the $76,000 support zone over the last 48 hours, it snapped right back to $77,800+. Why? Because retail is reading scary headlines while whales are reading the order book: Institutions Are Still Accumulating ($BTC): While frightened short-term ETF holders sold the bottom, Strategy (MSTR) quietly stepped in and bought another 811 BTC ($65.5M), pushing their total treasury to 849,327 BTC. As long as $76,000 holds on the 4H chart, every dip is being absorbed by spot limit orders. Relative Strength Leaders (XRP & $ZEC): The easiest way to find the next breakout is watching which coins stay green when the market chops. Both XRP and ZEC defied the sell-off and pushed higher yesterday while late shorts got trapped at support. The High-Volume Bounce Play ($SOL): After flushing down to $91.56 during Monday's withdrawal FUD, $SOL reclaimed $93.70+ with strong spot volume. Reclaiming the $95.00 psychological level opens a clean intraday run back toward $100. 3 Rules to Survive Post-Election Volatility Today: Stop shorting right into major daily support ($76K on$BTC and $91.50 on$SOL) after a multi-day flush. Wait for the initial election result candle wicks to sweep both sides of liquidity before entering leverage. Focus your trades on high-volume pairs showing real buyer absorption rather than dead low-caps. Tap the Like button if this gave you clarity today, and drop the #1 coin you are trading this week in the comments so we can chart the levels together! 👇📈 #Bitcoin #CryptoMarket #TradingStrategy #Altcoins #BinanceSquare
$1.04B ETF Outflows vs. Institutional Dip Buying: Why $BTC , $SOL, and$XRP Refused to Crash below $76K
Everyone on the timeline is panicking over US Midterm Election volatility and the recent $1.04 Billion in combined Bitcoin ETF outflows ($643M Friday + $399M Monday).
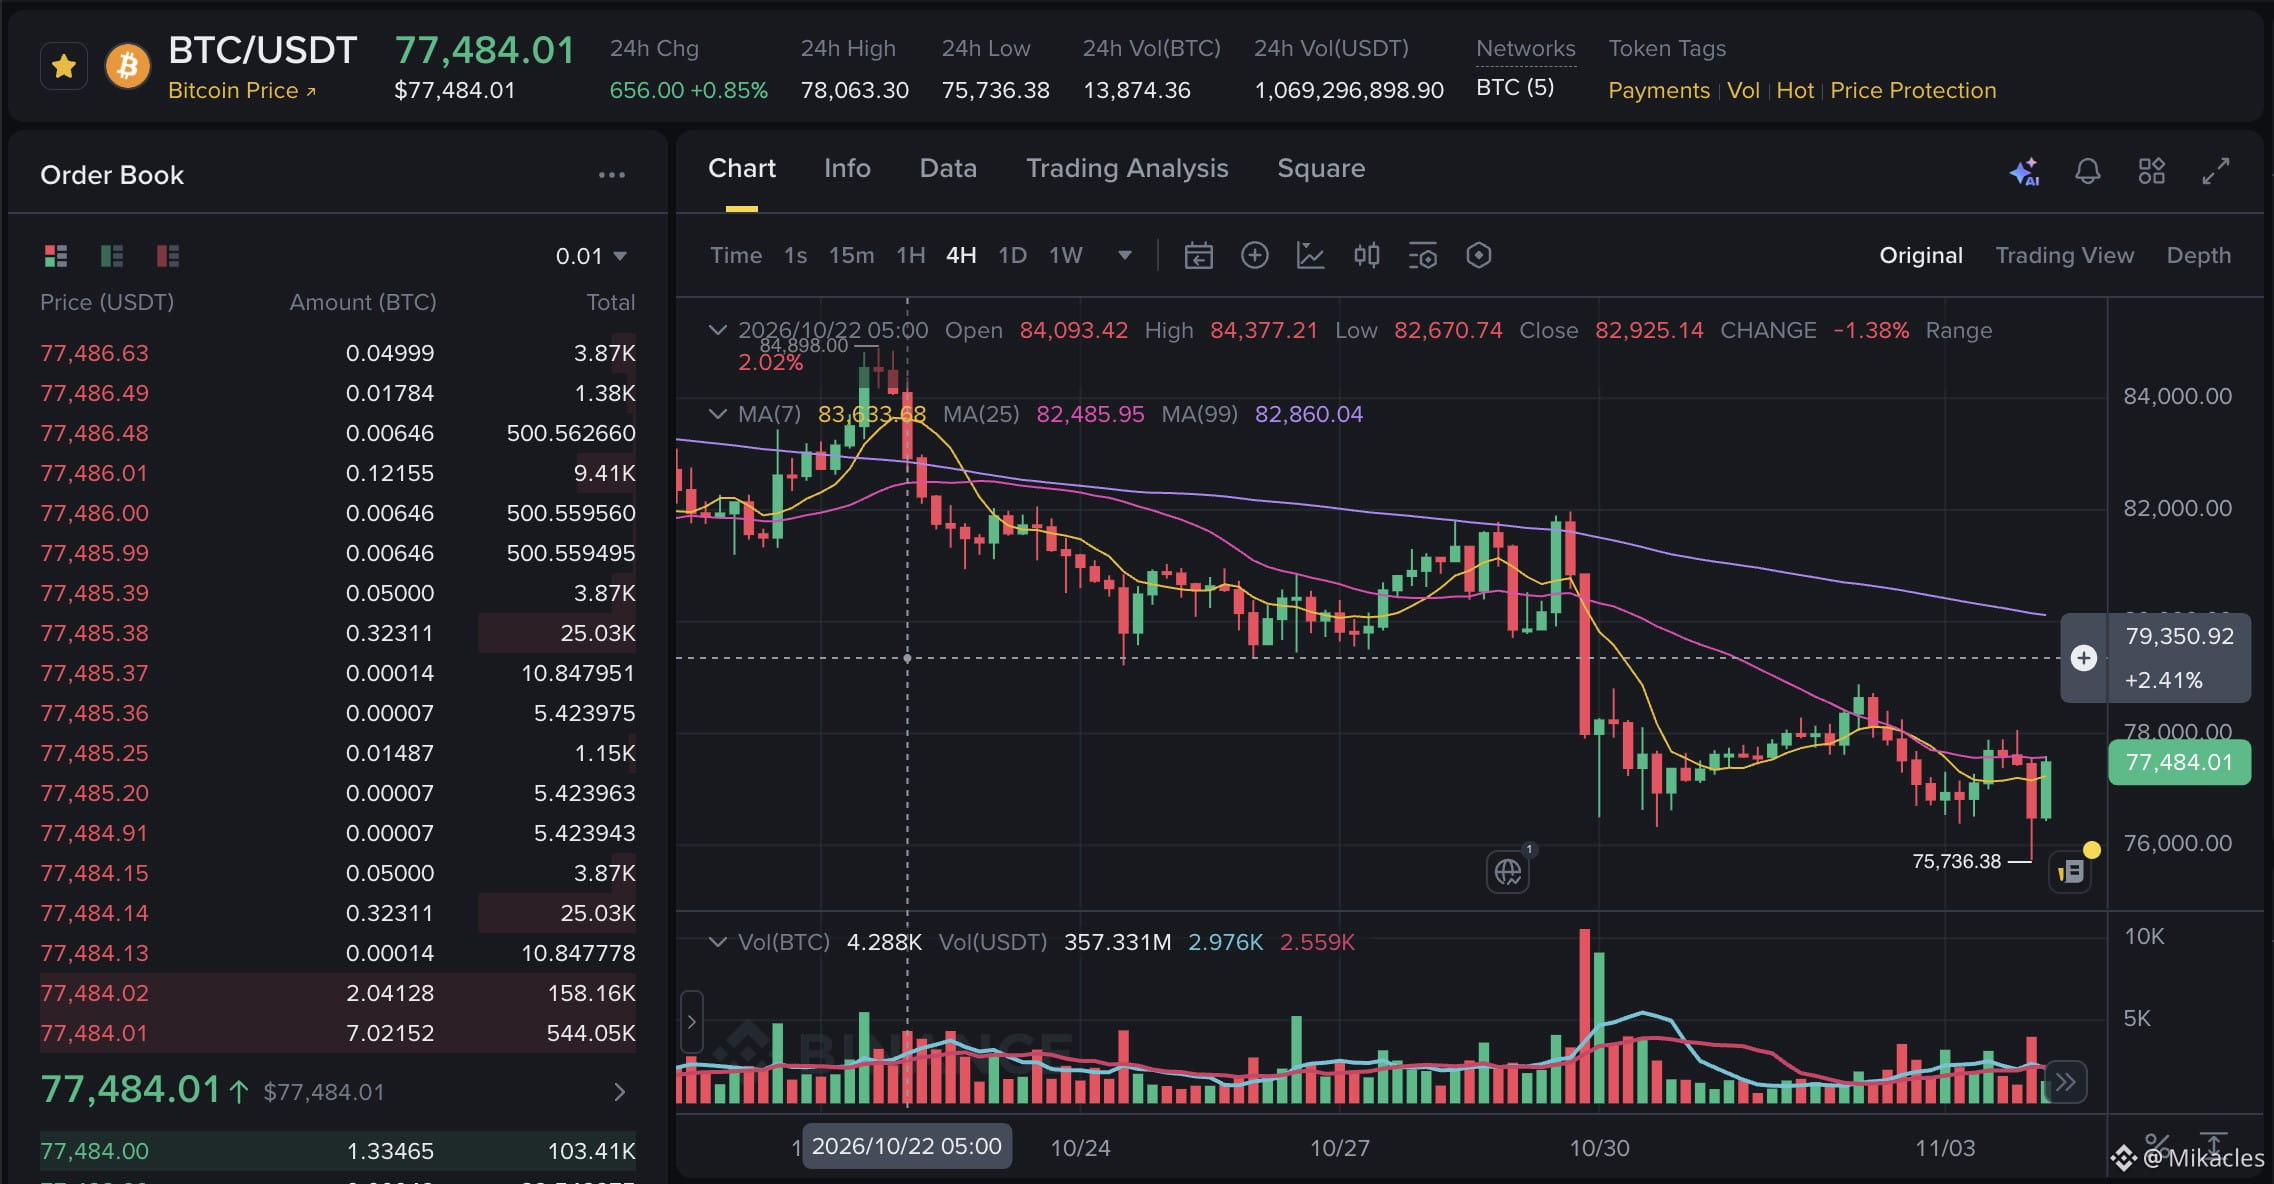
Yet every single time $BTC dipped toward the $76,000 support zone over the last 48 hours, it snapped right back to $77,800+. Why? Because retail is reading scary headlines while whales are reading the order book:
Institutions Are Still Accumulating ($BTC ): While frightened short-term ETF holders sold the bottom, Strategy (MSTR) quietly stepped in and bought another 811 BTC ($65.5M), pushing their total treasury to 849,327 BTC. As long as $76,000 holds on the 4H chart, every dip is being absorbed by spot limit orders.
Relative Strength Leaders (XRP & $ZEC): The easiest way to find the next breakout is watching which coins stay green when the market chops. Both XRP and ZEC defied the sell-off and pushed higher yesterday while late shorts got trapped at support.
The High-Volume Bounce Play ($SOL): After flushing down to $91.56 during Monday's withdrawal FUD, $SOL reclaimed $93.70+ with strong spot volume. Reclaiming the $95.00 psychological level opens a clean intraday run back toward $100.
3 Rules to Survive Post-Election Volatility Today:
Stop shorting right into major daily support ($76K on$BTC and $91.50 on$SOL) after a multi-day flush.
Wait for the initial election result candle wicks to sweep both sides of liquidity before entering leverage.
Focus your trades on high-volume pairs showing real buyer absorption rather than dead low-caps.
Tap the Like button if this gave you clarity today, and drop the #1 coin you are trading this week in the comments so we can chart the levels together! 👇📈
#Bitcoin #CryptoMarket #TradingStrategy #Altcoins #BinanceSquare
SMART MONEY ALERT: COINB BREAKOUT CONFIRMED BY INSTITUTIONAL FLOW ⚡ DATA-DRIVEN SETUP: COINB 📊 24h Flow: +6.19% 🔹 Entry Level: 145.5884 🎯 Profit Target: 158.0256 ⚠️ Invalid Level (SL): 137.5408 Sustained institutional flow confirming the technical breakout above the entry level signals a high-probability continuation, contingent on disciplined risk management at the invalidation point. Is your strategy aligned with this validated institutional move? #COINB #BinanceSquare #TradingStrategy
SMART MONEY ALERT: COINB BREAKOUT CONFIRMED BY INSTITUTIONAL FLOW

⚡ DATA-DRIVEN SETUP: COINB
📊 24h Flow: +6.19%
🔹 Entry Level: 145.5884
🎯 Profit Target: 158.0256
⚠️ Invalid Level (SL): 137.5408

Sustained institutional flow confirming the technical breakout above the entry level signals a high-probability continuation, contingent on disciplined risk management at the invalidation point.

Is your strategy aligned with this validated institutional move?

#COINB #BinanceSquare #TradingStrategy
·
--
Bullish
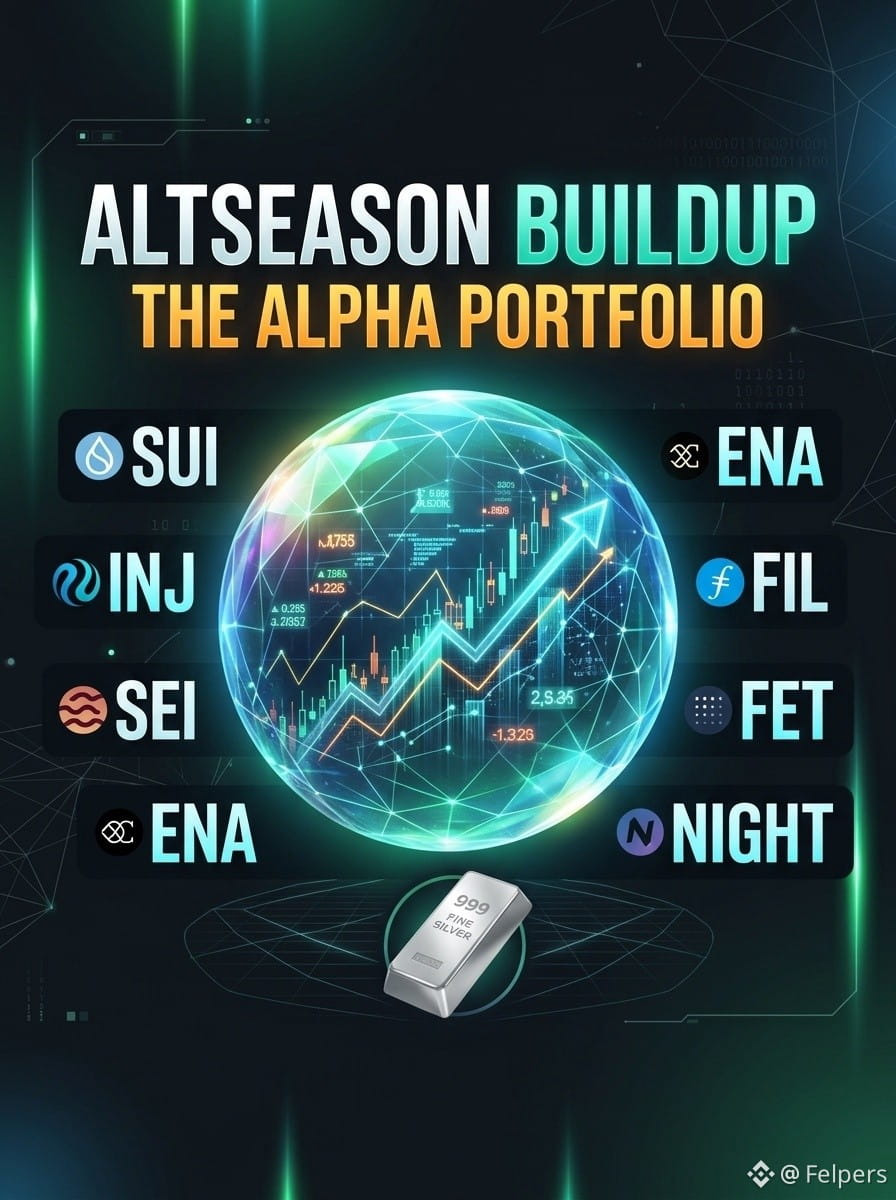
🚀 The Pre-Alt Season Buildup is Real : Are You Positioned? Bitcoin is holding strong at $77,700, consolidating beautifully. Meanwhile, BTC Dominance sits high at 57.66%. History tells us exactly what comes next: The Capital Rotation Cycle. As Bitcoin goes sideways, profits are quietly flowing into high-conviction Altcoins. We are in the final accumulation phase before the real blast. Here is a look at a powerhouse, diversified portfolio primed to lead the next leg up: ⚡ High-Performance L1s: $SUI and $SEI — The speed kings capturing massive on-chain volume and TVL. 🤖 The AI Leader: $FET — Positioned at the absolute epicenter of the biggest narrative in tech. 🌐 DeFi & DePIN Heavyweights: $INJ (Injective) and $FIL (Filecoin) — Crucial structural infrastructure with massive institutional backings. 💸 Synthetic Yield: $ENA (Ethena) — Thriving on market volatility and picking up rapid adoption. 🌌 The Ecosystem Mover: $NIGHT (Midnight) — Emerging momentum token catching eyes in this rotation wave. The most undervalued coin in crypto world. 🥈 The Macro Hedge: Silver — A brilliant, rock-solid addition for real-world wealth preservation while crypto handles the high-velocity upside. 🎯 The Strategy Don’t chase green candles or give in to FOMO. Use this consolidation phase to accumulate fundamentally strong projects that haven't pumped yet. The foundation is set, and the rotation has begun. What are your top 3 Altcoins picks for this cycle? Drop them below! 👇 #AltSeason #bitcoin #TradingStrategy
🚀 The Pre-Alt Season Buildup is Real : Are You Positioned?

Bitcoin is holding strong at $77,700, consolidating beautifully. Meanwhile, BTC Dominance sits high at 57.66%. History tells us exactly what comes next: The Capital Rotation Cycle.

As Bitcoin goes sideways, profits are quietly flowing into high-conviction Altcoins. We are in the final accumulation phase before the real blast.

Here is a look at a powerhouse, diversified portfolio primed to lead the next leg up:

⚡ High-Performance L1s: $SUI and $SEI — The speed kings capturing massive on-chain volume and TVL.

🤖 The AI Leader: $FET — Positioned at the absolute epicenter of the biggest narrative in tech.

🌐 DeFi & DePIN Heavyweights: $INJ (Injective) and $FIL (Filecoin) — Crucial structural infrastructure with massive institutional backings.

💸 Synthetic Yield: $ENA (Ethena) — Thriving on market volatility and picking up rapid adoption.

🌌 The Ecosystem Mover: $NIGHT (Midnight) — Emerging momentum token catching eyes in this rotation wave. The most undervalued coin in crypto world.

🥈 The Macro Hedge: Silver — A brilliant, rock-solid addition for real-world wealth preservation while crypto handles the high-velocity upside.

🎯 The Strategy

Don’t chase green candles or give in to FOMO. Use this consolidation phase to accumulate fundamentally strong projects that haven't pumped yet. The foundation is set, and the rotation has begun.

What are your top 3 Altcoins picks for this cycle? Drop them below! 👇

#AltSeason #bitcoin #TradingStrategy
Mastering Risk Management in Crypto Trading: A Systematic Framework for Capital PreservationIn the digital asset market, retail and intermediate traders often spend hundreds of hours researching entry signals, chart patterns, and technical indicators. However, market history consistently demonstrates that operational survival relies far less on entry precision and far more on risk management. Digital assets operate in a 24/7 trading environment characterized by sharp volatility, rapid liquidity shifts, and macroeconomic sensitivity. Without a structured risk framework, even a strategy with a high win rate can succumb to sudden drawdowns. This article provides a practical, quantitative framework designed for intermediate traders looking to transition from speculative trading to systematic capital preservation. --- ### 1. The Mathematics of Capital Preservation To build a resilient trading strategy, one must first understand the asymmetric nature of financial drawdowns. Loss recovery is non-linear; as losses deepen, the gain required to break even expands exponentially. * A **10% loss** requires an **11.1% gain** to regain starting capital. * A **25% loss** requires a **33.3% gain** to break even. * A **50% loss** requires a **100% gain** to recover. * An **80% loss** requires a **400% gain** to return to baseline. When capital declines significantly, a trader is forced to take on disproportionately higher risk simply to regain initial balance. The primary objective of any systematic trader, therefore, is not maximizing returns on winning trades, but limiting drawdowns so that compounding interest can function over long time horizons. --- ### 2. The Core Rule: Account Equity Risk Sizing One of the most frequent mistakes made by intermediate traders is confusing **position size** with **trade risk**. Risk is defined strictly as the absolute dollar amount lost if a trade hits its invalidation point (stop-loss). A standard benchmark utilized by quantitative funds and professional traders is the **1% to 2% Rule**. Under this constraint, a trader never risks more than 1% to 2% of their total account equity on any single setup. #### The Position Sizing Formula To calculate precise position sizing based on risk tolerance, use the following equation: $$\text{Trade Risk Amount (\$) } = \text{Total Portfolio Value} \times \text{Risk Percentage}$$ $$\text{Position Size (in units)} = \frac{\text{Trade Risk Amount (\$)}}{\text{Entry Price} - \text{Stop-Loss Price}}$$ #### Practical Example Consider a trader with a portfolio value of **$10,000** who wishes to risk **1.5%** on a trade setup. 1. **Calculate Total Risk Amount**: $$\$10,000 \times 0.015 = \$150$$ The maximum allowable loss for this trade is $150. 2. **Define Technical Invalidation**: Suppose Bitcoin is trading at **$60,000**, and technical support dictates that the trade thesis is invalid if the price breaks below **$57,000**. $$\text{Risk per Unit} = \$60,000 - \$57,000 = \$3,000$$ 3. **Determine Position Size**: $$\text{Position Size} = \frac{\$150}{\$3,000} = 0.05 \text{ Bitcoin}$$ 4. **Calculate Total Capital Allocated**: $$0.05 \text{ Bitcoin} \times \$60,000 = \$3,000$$ In this scenario, the trader enters a position worth $3,000 (30% of portfolio capital), but the actual monetary risk remains strictly locked at $150 (1.5% of equity). If the price touches $57,000, the trade triggers a stop-loss, leaving the remaining portfolio equity at $9,850. --- ### 3. Structural vs. Arbitrary Stop-Loss Placement A common pitfall is assigning arbitrary percentage-based stop-losses (e.g., placing a stop exactly 2% below entry regardless of chart context). Markets do not respect arbitrary percentages; they react to structural supply and demand zones, liquidity pools, and volatility ranges. #### Technical Structure Placement Stop-loss levels should be placed at points of technical invalidation—prices where the initial trade thesis becomes explicitly wrong. This includes levels slightly beyond major swing highs/lows, established order blocks, or key support levels. #### Volatility-Adjusted Stops (ATR) Because market volatility fluctuates constantly, static distance stops can lead to premature exits during high-volatility regimes. Utilizing tools like the Average True Range (ATR) helps adjust stop distance based on market conditions. For instance, setting a stop at a distance of $1.5 \times \text{ATR}$ below a support zone provides market noise buffer while maintaining logical boundaries. --- ### 4. Mathematical Expectancy and Risk-to-Reward Ratios A profitable trading system does not require a high win rate. In fact, many successful trend-following systems operate with win rates between 35% and 45%. The viability of a system depends on the interaction between its **win rate** and its **Risk-to-Reward Ratio (RRR)**. #### Defining Expected Value (EV) mathematical expectancy measures the average amount a trader can expect to win or lose per dollar at risk. $$\text{EV} = (\text{Win Rate} \times \text{Average Win}) - (\text{Loss Rate} \times \text{Average Loss})$$ #### Comparing Two Strategies * **Strategy A (High Win Rate, Poor RRR)**: * Win Rate: 80% * Average Win: $50 * Average Loss: $250 * $$\text{EV} = (0.80 \times 50) - (0.20 \times 250) = 40 - 50 = -\$10$$ * *Result*: Negative expectancy. Despite winning 8 out of 10 trades, the strategy loses capital over time. * **Strategy B (Lower Win Rate, Strong RRR)**: * Win Rate: 40% * Average Win: $300 (1:3 Risk-to-Reward) * Average Loss: $100 * $$\text{EV} = (0.40 \times 300) - (0.60 \times 100) = 120 - 60 = +\$60$$ * *Result*: Positive expectancy. The strategy generates average gains of $60 per trade over a statistical sample size. Maintaining a minimum target RRR of 1:2 ensures that a trader remains profitable even if more than half of their executed trades hit stop-loss levels. --- ### 5. Managing Correlation and Macro Portfolio Exposure Crypto assets exhibit high cross-asset correlation. During market-wide corrections, altcoins generally display high directional beta relative to major benchmark assets like Bitcoin and Ethereum. #### The Fallacy of Multi-Asset Diversification If a trader opens five distinct long positions on alternative Layer-1 tokens simultaneously, they may believe they have diversified their holdings. However, if those assets possess a correlation coefficient close to +0.9 relative to Bitcoin, the trader has actually opened one single, large position split across five assets. If the broader market contracts, all five positions are likely to hit their stop-loss levels simultaneously, compounding total account drawdown to 5x the intended single-trade risk. #### Rule for Aggregate Portfolio Exposure * Limit aggregate open risk across all correlated trades to a fixed maximum (e.g., 5% total account risk). * If three active trades each carry 1.5% risk, new trade setups should be rejected until existing positions are closed or stop-losses are trailed to break-even. --- ### 6. Limitations, Systemic Risks, and Execution Realities While quantitative frameworks provide structure, risk models carry practical constraints that traders must factor into execution: 1. **Slippage in Illiquid Markets**: During extreme market events, buy/sell order books thin out rapidy. A stop-market order placed at a specific price may execute at a worse level if market liquidity is depleted. Position sizes must be scaled down when trading lower-market-cap assets with shallow depth. 2. **Leverage and Liquidation Hazards**: Leverage does not inherently alter market odds; it merely reduces required margin while accelerating capital depletion. When using leverage, position sizing calculations must remain tied to absolute asset values rather than margin collateral. Relying on exchange liquidation points instead of setting defined stop-losses introduces extreme capital ruin risk. 3. **Psychological Slippage**: The strongest risk management framework fails if execution breaks down due to psychological fatigue, revenge trading, or moving stop-loss orders mid-trade. Implementing mechanical rules—such as daily max loss limits (e.g., stopping trade activity for the day after 3 consecutive losses)—helps protect capital from emotional bias. --- ### Summary Checklist for Systematic Risk Management 1. **Determine Invalidation First**: Identify structural stop-loss levels prior to calculating entry points. 2. **Size Positions Dynamically**: Calculate unit size using account percentage risk (1-2%), not arbitrary dollar amounts. 3. **Enforce Positive Expectancy**: Target trades offering a structural Risk-to-Reward Ratio of at least 1:2. 4. **Monitor Asset Correlations**: Treat highly correlated digital assets as part of a single combined exposure pool. 5. **Respect Operational Constraints**: Adjust sizes downward during high-volatility regimes or low-liquidity market conditions. #CryptoEducation #RiskManagement #TradingStrategy

Mastering Risk Management in Crypto Trading: A Systematic Framework for Capital Preservation

In the digital asset market, retail and intermediate traders often spend hundreds of hours researching entry signals, chart patterns, and technical indicators. However, market history consistently demonstrates that operational survival relies far less on entry precision and far more on risk management. Digital assets operate in a 24/7 trading environment characterized by sharp volatility, rapid liquidity shifts, and macroeconomic sensitivity. Without a structured risk framework, even a strategy with a high win rate can succumb to sudden drawdowns.
This article provides a practical, quantitative framework designed for intermediate traders looking to transition from speculative trading to systematic capital preservation.
---
### 1. The Mathematics of Capital Preservation
To build a resilient trading strategy, one must first understand the asymmetric nature of financial drawdowns. Loss recovery is non-linear; as losses deepen, the gain required to break even expands exponentially.
* A **10% loss** requires an **11.1% gain** to regain starting capital.
* A **25% loss** requires a **33.3% gain** to break even.
* A **50% loss** requires a **100% gain** to recover.
* An **80% loss** requires a **400% gain** to return to baseline.
When capital declines significantly, a trader is forced to take on disproportionately higher risk simply to regain initial balance. The primary objective of any systematic trader, therefore, is not maximizing returns on winning trades, but limiting drawdowns so that compounding interest can function over long time horizons.
---
### 2. The Core Rule: Account Equity Risk Sizing
One of the most frequent mistakes made by intermediate traders is confusing **position size** with **trade risk**. Risk is defined strictly as the absolute dollar amount lost if a trade hits its invalidation point (stop-loss).
A standard benchmark utilized by quantitative funds and professional traders is the **1% to 2% Rule**. Under this constraint, a trader never risks more than 1% to 2% of their total account equity on any single setup.
#### The Position Sizing Formula
To calculate precise position sizing based on risk tolerance, use the following equation:
$$\text{Trade Risk Amount (\$) } = \text{Total Portfolio Value} \times \text{Risk Percentage}$$
$$\text{Position Size (in units)} = \frac{\text{Trade Risk Amount (\$)}}{\text{Entry Price} - \text{Stop-Loss Price}}$$
#### Practical Example
Consider a trader with a portfolio value of **$10,000** who wishes to risk **1.5%** on a trade setup.
1. **Calculate Total Risk Amount**:
$$\$10,000 \times 0.015 = \$150$$
The maximum allowable loss for this trade is $150.
2. **Define Technical Invalidation**:
Suppose Bitcoin is trading at **$60,000**, and technical support dictates that the trade thesis is invalid if the price breaks below **$57,000**.
$$\text{Risk per Unit} = \$60,000 - \$57,000 = \$3,000$$
3. **Determine Position Size**:
$$\text{Position Size} = \frac{\$150}{\$3,000} = 0.05 \text{ Bitcoin}$$
4. **Calculate Total Capital Allocated**:
$$0.05 \text{ Bitcoin} \times \$60,000 = \$3,000$$
In this scenario, the trader enters a position worth $3,000 (30% of portfolio capital), but the actual monetary risk remains strictly locked at $150 (1.5% of equity). If the price touches $57,000, the trade triggers a stop-loss, leaving the remaining portfolio equity at $9,850.
---
### 3. Structural vs. Arbitrary Stop-Loss Placement
A common pitfall is assigning arbitrary percentage-based stop-losses (e.g., placing a stop exactly 2% below entry regardless of chart context). Markets do not respect arbitrary percentages; they react to structural supply and demand zones, liquidity pools, and volatility ranges.
#### Technical Structure Placement
Stop-loss levels should be placed at points of technical invalidation—prices where the initial trade thesis becomes explicitly wrong. This includes levels slightly beyond major swing highs/lows, established order blocks, or key support levels.
#### Volatility-Adjusted Stops (ATR)
Because market volatility fluctuates constantly, static distance stops can lead to premature exits during high-volatility regimes. Utilizing tools like the Average True Range (ATR) helps adjust stop distance based on market conditions. For instance, setting a stop at a distance of $1.5 \times \text{ATR}$ below a support zone provides market noise buffer while maintaining logical boundaries.
---
### 4. Mathematical Expectancy and Risk-to-Reward Ratios
A profitable trading system does not require a high win rate. In fact, many successful trend-following systems operate with win rates between 35% and 45%. The viability of a system depends on the interaction between its **win rate** and its **Risk-to-Reward Ratio (RRR)**.
#### Defining Expected Value (EV)
mathematical expectancy measures the average amount a trader can expect to win or lose per dollar at risk.
$$\text{EV} = (\text{Win Rate} \times \text{Average Win}) - (\text{Loss Rate} \times \text{Average Loss})$$
#### Comparing Two Strategies
* **Strategy A (High Win Rate, Poor RRR)**:
* Win Rate: 80%
* Average Win: $50
* Average Loss: $250
* $$\text{EV} = (0.80 \times 50) - (0.20 \times 250) = 40 - 50 = -\$10$$
* *Result*: Negative expectancy. Despite winning 8 out of 10 trades, the strategy loses capital over time.
* **Strategy B (Lower Win Rate, Strong RRR)**:
* Win Rate: 40%
* Average Win: $300 (1:3 Risk-to-Reward)
* Average Loss: $100
* $$\text{EV} = (0.40 \times 300) - (0.60 \times 100) = 120 - 60 = +\$60$$
* *Result*: Positive expectancy. The strategy generates average gains of $60 per trade over a statistical sample size.
Maintaining a minimum target RRR of 1:2 ensures that a trader remains profitable even if more than half of their executed trades hit stop-loss levels.
---
### 5. Managing Correlation and Macro Portfolio Exposure
Crypto assets exhibit high cross-asset correlation. During market-wide corrections, altcoins generally display high directional beta relative to major benchmark assets like Bitcoin and Ethereum.
#### The Fallacy of Multi-Asset Diversification
If a trader opens five distinct long positions on alternative Layer-1 tokens simultaneously, they may believe they have diversified their holdings. However, if those assets possess a correlation coefficient close to +0.9 relative to Bitcoin, the trader has actually opened one single, large position split across five assets. If the broader market contracts, all five positions are likely to hit their stop-loss levels simultaneously, compounding total account drawdown to 5x the intended single-trade risk.
#### Rule for Aggregate Portfolio Exposure
* Limit aggregate open risk across all correlated trades to a fixed maximum (e.g., 5% total account risk).
* If three active trades each carry 1.5% risk, new trade setups should be rejected until existing positions are closed or stop-losses are trailed to break-even.
---
### 6. Limitations, Systemic Risks, and Execution Realities
While quantitative frameworks provide structure, risk models carry practical constraints that traders must factor into execution:
1. **Slippage in Illiquid Markets**: During extreme market events, buy/sell order books thin out rapidy. A stop-market order placed at a specific price may execute at a worse level if market liquidity is depleted. Position sizes must be scaled down when trading lower-market-cap assets with shallow depth.
2. **Leverage and Liquidation Hazards**: Leverage does not inherently alter market odds; it merely reduces required margin while accelerating capital depletion. When using leverage, position sizing calculations must remain tied to absolute asset values rather than margin collateral. Relying on exchange liquidation points instead of setting defined stop-losses introduces extreme capital ruin risk.
3. **Psychological Slippage**: The strongest risk management framework fails if execution breaks down due to psychological fatigue, revenge trading, or moving stop-loss orders mid-trade. Implementing mechanical rules—such as daily max loss limits (e.g., stopping trade activity for the day after 3 consecutive losses)—helps protect capital from emotional bias.
---
### Summary Checklist for Systematic Risk Management
1. **Determine Invalidation First**: Identify structural stop-loss levels prior to calculating entry points.
2. **Size Positions Dynamically**: Calculate unit size using account percentage risk (1-2%), not arbitrary dollar amounts.
3. **Enforce Positive Expectancy**: Target trades offering a structural Risk-to-Reward Ratio of at least 1:2.
4. **Monitor Asset Correlations**: Treat highly correlated digital assets as part of a single combined exposure pool.
5. **Respect Operational Constraints**: Adjust sizes downward during high-volatility regimes or low-liquidity market conditions.
#CryptoEducation #RiskManagement #TradingStrategy
Not every market decline creates a buying opportunity. Patience and confirmation remain essential in uncertain conditions. $NEAR : Watch for a volume-supported recovery before expecting a trend reversal. $PEPE : Sudden volume increases could create fast opportunities in either direction. $UNI : A breakout with strong volume could provide a clearer trading signal. #NEAR #PEPE #UNI #CryptoSignals #TradingStrategy

Not every market decline creates a buying opportunity. Patience and confirmation remain essential in uncertain conditions.

$NEAR : Watch for a volume-supported recovery before expecting a trend reversal.
$PEPE : Sudden volume increases could create fast opportunities in either direction.
$UNI : A breakout with strong volume could provide a clearer trading signal.

#NEAR #PEPE #UNI #CryptoSignals #TradingStrategy

·
--
Looking for Guidance from Experienced Traders! I'm new to crypto trading, and I've recently discovered a Multi-Timeframe Trading Strategy that I find interesting. I want to properly backtest this strategy before using it in live trading, but honestly, I have no experience with backtesting yet. I'd really appreciate guidance from experienced traders on: - How should I start backtesting a strategy? - Which tools or platforms do you recommend? - How many historical trades should I test? - What key metrics should I track? I'm planning to start with $SOL . Any tips, resources, or advice would be highly appreciated. I'm here to learn! #Backtesting #bitcoin #Ethereum #tradingStrategy {spot}(SOLUSDT)
Looking for Guidance from Experienced Traders!

I'm new to crypto trading, and I've recently discovered a Multi-Timeframe Trading Strategy that I find interesting.

I want to properly backtest this strategy before using it in live trading, but honestly, I have no experience with backtesting yet.

I'd really appreciate guidance from experienced traders on:

- How should I start backtesting a strategy?
- Which tools or platforms do you recommend?
- How many historical trades should I test?
- What key metrics should I track?

I'm planning to start with $SOL .

Any tips, resources, or advice would be highly appreciated. I'm here to learn!

#Backtesting #bitcoin #Ethereum #tradingStrategy
$XAU | GOLD TRADING INSIGHT Every impulsive entry has a hidden cost: spread, emotional pressure, and unnecessary risk. Before opening an XAUUSD position, define three things: 📍 Entry — Where is the opportunity? 🛑 Stop-loss — Where is the idea invalid? 🎯 Target — Is the potential reward worth the risk? A trade without a plan is just a guess with money behind it. Do you plan your trades or trade your predictions? #XAUUSD #goldtrading #tradingStrategy #RiskManagement #BinanceSquare {future}(XAUUSDT)
$XAU | GOLD TRADING INSIGHT

Every impulsive entry has a hidden cost: spread, emotional pressure, and unnecessary risk.

Before opening an XAUUSD position, define three things:

📍 Entry — Where is the opportunity?
🛑 Stop-loss — Where is the idea invalid?
🎯 Target — Is the potential reward worth the risk?

A trade without a plan is just a guess with money behind it. Do you plan your trades or trade your predictions?

#XAUUSD #goldtrading #tradingStrategy #RiskManagement #BinanceSquare
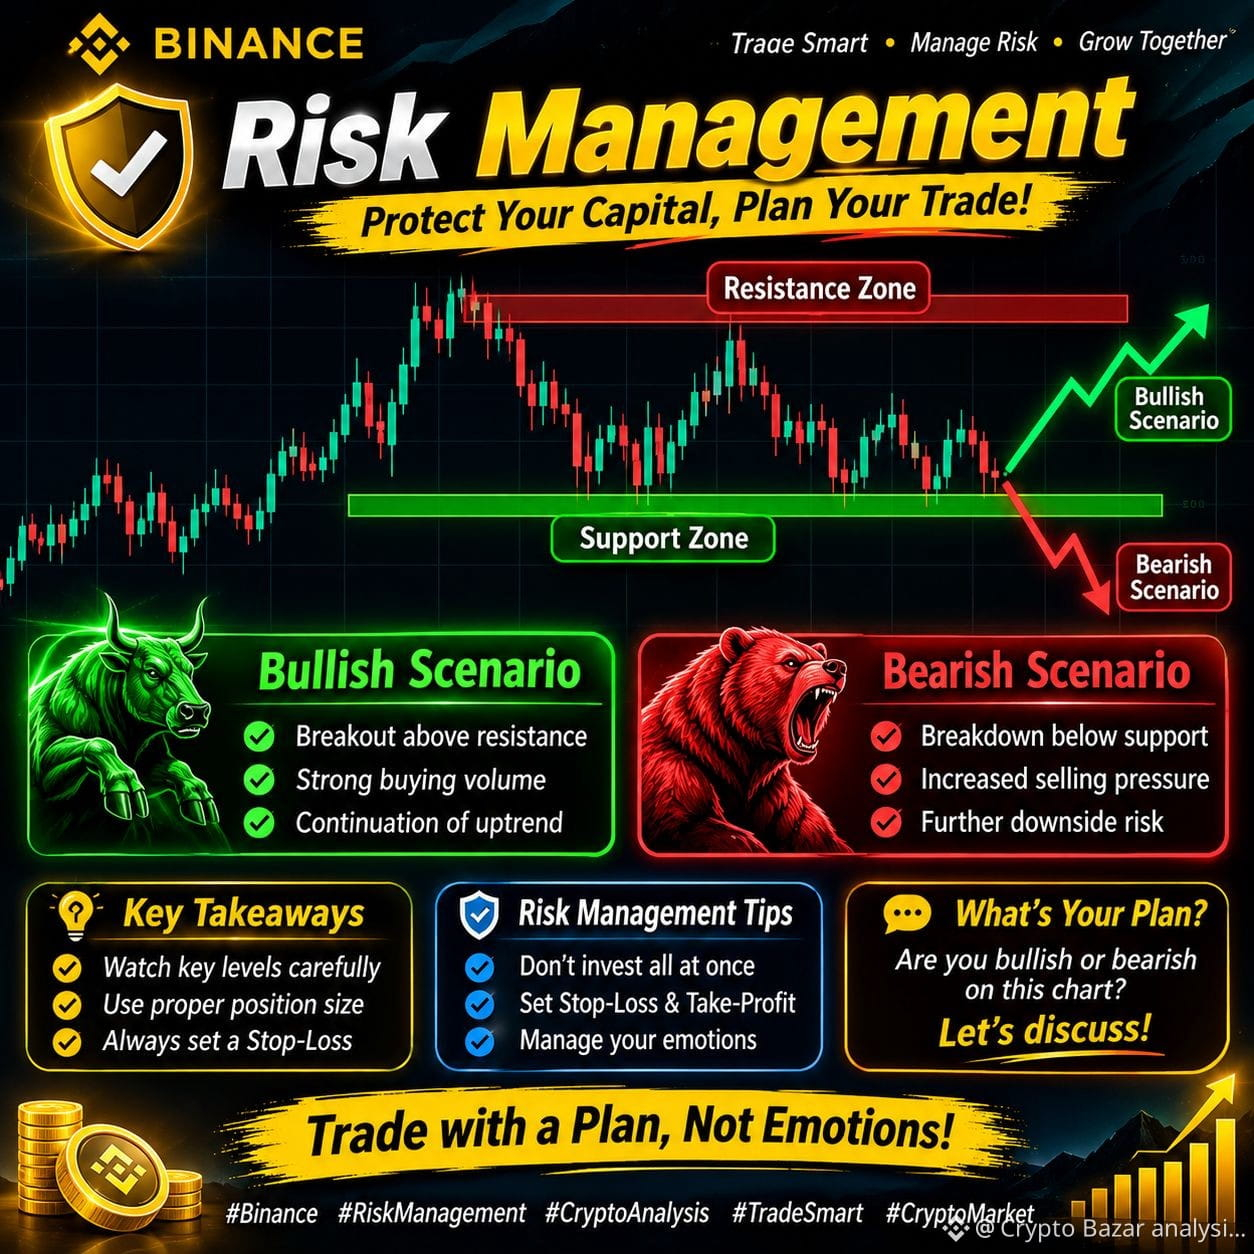
Why the "buy the dip" strategy can backfire 📉 Every dip looks like a discount, until it keeps dipping. 🔻 A falling price isn't automatically cheap. Sometimes it's falling for a reason 🔻 Catching a falling knife often means buying way too early 🔻 Going all-in on the first red candle leaves no cash for lower levels What works better for me: ✅ Split entries into 3-4 parts ✅ Wait for signs of stabilization (volume, support holding) ✅ Decide the invalidation level before buying Buying dips can work, but only with a plan. Do you buy dips or wait for confirmation? 👇 $BTC $ETH $BNB #BuyTheDip #TradingStrategy #RiskManagement #BinanceSquare Not financial advice.

Why the "buy the dip" strategy can backfire 📉

Every dip looks like a discount, until it keeps dipping.

🔻 A falling price isn't automatically cheap. Sometimes it's falling for a reason
🔻 Catching a falling knife often means buying way too early
🔻 Going all-in on the first red candle leaves no cash for lower levels

What works better for me:
✅ Split entries into 3-4 parts
✅ Wait for signs of stabilization (volume, support holding)
✅ Decide the invalidation level before buying

Buying dips can work, but only with a plan.

Do you buy dips or wait for confirmation? 👇

$BTC $ETH $BNB
#BuyTheDip #TradingStrategy #RiskManagement #BinanceSquare
Not financial advice.
·
--
Bullish
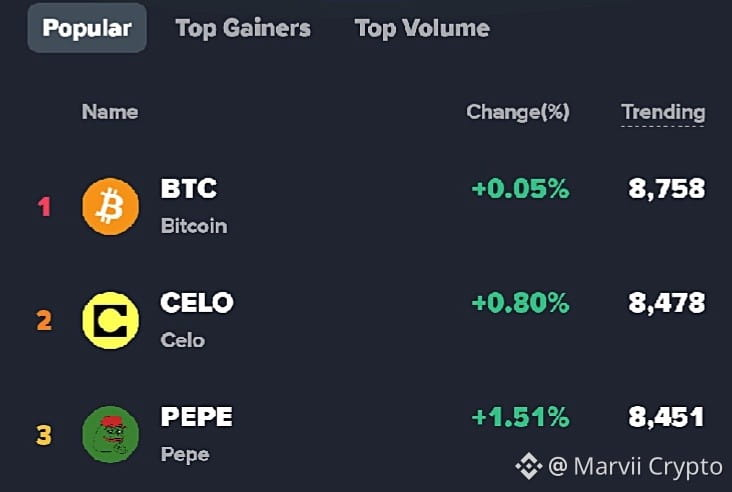
🔥 3 COINS TO WATCH TODAY | BTC • CELO • PEPE 📊 1. $BTC {spot}(BTCUSDT) – Bitcoin - Bias: Short-term bearish - Entry: $78,350–$78,600 (only after reclaim) - TP1: $79,100 - TP2: $79,566 - SL: $77,700 - Analysis: BTC needs to reclaim $78.3K to strengthen bullish momentum. Below this level, sellers remain in control. 📊 2. $CELO {spot}(CELOUSDT) – Celo - Bias: Bearish until breakout - Entry: $0.0728–$0.0732 (after confirmation) - TP1: $0.0750 - TP2: $0.0763 - SL: $0.0705 - Analysis: CELO is facing selling pressure. A confirmed breakout above resistance could trigger a recovery. 📊 3. $PEPE {spot}(PEPEUSDT) – Pepe - Bias: Bullish - Entry: $0.00000475–$0.00000482 - TP1: $0.00000499 - TP2: $0.00000520 - SL: $0.00000458 - Analysis: PEPE is showing positive technical momentum. Holding support could open the door for another upward move. ⚡ Trading Strategy: Wait for confirmation, manage risk, and avoid chasing sudden pumps. Which coin has the strongest potential today? BTC, CELO or PEPE? #BinanceSquare #CryptoAnalysis #TradingStrategy #Write2Earn‬

🔥 3 COINS TO WATCH TODAY | BTC • CELO • PEPE

📊 1. $BTC
– Bitcoin

- Bias: Short-term bearish
- Entry: $78,350–$78,600 (only after reclaim)
- TP1: $79,100
- TP2: $79,566
- SL: $77,700
- Analysis: BTC needs to reclaim $78.3K to strengthen bullish momentum. Below this level, sellers remain in control.

📊 2. $CELO
– Celo

- Bias: Bearish until breakout
- Entry: $0.0728–$0.0732 (after confirmation)
- TP1: $0.0750
- TP2: $0.0763
- SL: $0.0705
- Analysis: CELO is facing selling pressure. A confirmed breakout above resistance could trigger a recovery.

📊 3. $PEPE
– Pepe

- Bias: Bullish
- Entry: $0.00000475–$0.00000482
- TP1: $0.00000499
- TP2: $0.00000520
- SL: $0.00000458
- Analysis: PEPE is showing positive technical momentum. Holding support could open the door for another upward move.

⚡ Trading Strategy: Wait for confirmation, manage risk, and avoid chasing sudden pumps.

Which coin has the strongest potential today? BTC, CELO or PEPE?

#BinanceSquare #CryptoAnalysis #TradingStrategy #Write2Earn‬

·
--
Bullish
Verified
🚀 TRADER’S PLAYBOOK: US PMI Shock, AI Chip Battle ($SKHYNIX vs $SNDK ) 🇺🇸🇰🇷 📊 1. The Macro Fuel: US ISM PMI Hits 55.5! The US Manufacturing PMI just came in strong at 55.5 (beating the 54.7 forecast)! 🍀The Good: Economy is expanding! Demand is back for tech, industrials, and cyclical stocks. 🤯The Trap: Strong economic data = Fed might keep rates higher for longer. Expect short-term volatility spikes around major sessions! ⚔️ 2. The Chip Battle 🇰🇷 SK Hynix ($SKHYNIX): The AI Memory King. Record-breaking earnings driven by its near-monopoly on HBM chips for Nvidia AI GPUs. Solid fundamental backing = great candidate to scalp high-liquidity sessions with tight risk control! 🇺🇸 SanDisk ($SNDK): The Flush-Out. Strong long-term NAND tech, but the price pumped too fast earlier and is now facing a heavy technical profit-taking shakeout. ⚠️ 3. Golden Trading 🥂Keep Size Small: Always size your positions based on risk, not greed! ✌️No Blind DCA: If a setup is invalid or dumping hard, wait for clear reversal signs or take the small cut. Preserve your capital to fight another day! 💡 Final Takeaway: Trade what you see, lock in your SL to stay risk-free, and let the market pay you! 🎯 👇 What’s your game plan for today’s session? Are you Longing SKHYNIX or waiting onSNDK? Let’s discuss below! 🔥 Smash that LIKE, RETWEET, and FOLLOW button for daily real-time trade setups & risk management guides! 🔥 #BinanceSquare #tradingStrategy

🚀 TRADER’S PLAYBOOK: US PMI Shock, AI Chip Battle ($SKHYNIX vs $SNDK ) 🇺🇸🇰🇷
📊 1. The Macro Fuel: US ISM PMI Hits 55.5!
The US Manufacturing PMI just came in strong at 55.5 (beating the 54.7 forecast)!
🍀The Good: Economy is expanding! Demand is back for tech, industrials, and cyclical stocks.
🤯The Trap: Strong economic data = Fed might keep rates higher for longer. Expect short-term volatility spikes around major sessions!

⚔️ 2. The Chip Battle
🇰🇷 SK Hynix ($SKHYNIX ): The AI Memory King. Record-breaking earnings driven by its near-monopoly on HBM chips for Nvidia AI GPUs. Solid fundamental backing = great candidate to scalp high-liquidity sessions with tight risk control!

🇺🇸 SanDisk ($SNDK ): The Flush-Out. Strong long-term NAND tech, but the price pumped too fast earlier and is now facing a heavy technical profit-taking shakeout.

⚠️ 3. Golden Trading
🥂Keep Size Small: Always size your positions based on risk, not greed!
✌️No Blind DCA: If a setup is invalid or dumping hard, wait for clear reversal signs or take the small cut. Preserve your capital to fight another day!
💡 Final Takeaway:
Trade what you see, lock in your SL to stay risk-free, and let the market pay you! 🎯

👇 What’s your game plan for today’s session? Are you Longing SKHYNIX or waiting onSNDK? Let’s discuss below!
🔥 Smash that LIKE, RETWEET, and FOLLOW button for daily real-time trade setups & risk management guides! 🔥
#BinanceSquare #tradingStrategy
·
--
QVX trend filter just flipped to SHORT. Price is 77022.01, pinned below resistance at 78878.01 and holding a thin cushion above support at 76850.0. The QVX plan is to sell into a rally toward resistance rather than chase the print. Entry zone: 78500–78878 on a rejection candle. Stop: 79350, roughly 500–850 points above entry. First target: 76850; second target: 76200 on a support break. Risk per trade capped at 0.5% of equity; position size derived from stop distance. Invalidations: a daily close above 78878.01 or a failed retest of 76850. The Iran headline is a sentiment pop, not a trend change — QVX stays SHORT while price stays under resistance. Flat, waiting for the next signal. 📉 Full QVX strategy details & real-time signals here: https://www.qilanx.com/ #QVX #BTC #TradingStrategy
QVX trend filter just flipped to SHORT.

Price is 77022.01, pinned below resistance at 78878.01 and holding a thin cushion above support at 76850.0. The QVX plan is to sell into a rally toward resistance rather than chase the print. Entry zone: 78500–78878 on a rejection candle. Stop: 79350, roughly 500–850 points above entry. First target: 76850; second target: 76200 on a support break. Risk per trade capped at 0.5% of equity; position size derived from stop distance. Invalidations: a daily close above 78878.01 or a failed retest of 76850. The Iran headline is a sentiment pop, not a trend change — QVX stays SHORT while price stays under resistance. Flat, waiting for the next signal. 📉

Full QVX strategy details & real-time signals here: https://www.qilanx.com/

#QVX #BTC #TradingStrategy
⚠️ LITE BULLS UNDER PRESSURE — SELLERS ARE TESTING THE MARKET! Another wave of leveraged buyers has been caught offside! 🔴 Long Liquidation: $70.6K 📍 Execution Price: $749.15 📉 What Does This Signal? The $70.6K long wipeout indicates that bearish pressure is still affecting leveraged traders. With another batch of bullish positions forced out, the market could face additional volatility as traders reassess their exposure. 🎯 Next Move — My Trading Perspective 🐻 Downside Risk: If LITE struggles to recover above $749.15, sellers could attempt another leg lower. 🐂 Recovery Setup: A strong rebound with increasing buying volume could invalidate the immediate bearish pressure and open the door to a relief rally. 🔥 My Verdict: Avoid chasing either direction. I would wait for a confirmed breakout or breakdown before taking a position. The next reaction around $749 deserves close attention. Trade smart. Let confirmation lead, not emotions. #LITE #LiquidationAlert #CryptoSignals #FuturesTrading #TradingStrategy #BinanceWithdrawalScamWarning #USMidtermElections #AppleEarningsAhead-CanStockHitNewHigh #Verify1to1BinanceReserves {stock_us}(LITE.US)
⚠️ LITE BULLS UNDER PRESSURE — SELLERS ARE TESTING THE MARKET!
Another wave of leveraged buyers has been caught offside!
🔴 Long Liquidation: $70.6K
📍 Execution Price: $749.15
📉 What Does This Signal?
The $70.6K long wipeout indicates that bearish pressure is still affecting leveraged traders. With another batch of bullish positions forced out, the market could face additional volatility as traders reassess their exposure.
🎯 Next Move — My Trading Perspective
🐻 Downside Risk: If LITE struggles to recover above $749.15, sellers could attempt another leg lower.
🐂 Recovery Setup: A strong rebound with increasing buying volume could invalidate the immediate bearish pressure and open the door to a relief rally.
🔥 My Verdict: Avoid chasing either direction. I would wait for a confirmed breakout or breakdown before taking a position. The next reaction around $749 deserves close attention.
Trade smart. Let confirmation lead, not emotions.
#LITE #LiquidationAlert #CryptoSignals #FuturesTrading #TradingStrategy

#BinanceWithdrawalScamWarning #USMidtermElections #AppleEarningsAhead-CanStockHitNewHigh #Verify1to1BinanceReserves
LITEUS-3.76%
📊 The Market Is at a Decision Point — Breakout or Breakdown? Crypto markets don't always move in one direction. Sometimes, the most important signal is how price reacts around key levels. 📈 Bullish Scenario: If buyers defend the support zone and price breaks above resistance with strong volume, bullish momentum could return. A confirmed breakout may open the door for further upside. 📉 Bearish Scenario: If support fails to hold, selling pressure could increase. A breakdown below this zone may lead to further downside. 🎯 My Trading Strategy: I'm watching the reaction around support and resistance rather than chasing every price movement. Proper position sizing, stop-loss placement, and patience are essential. 💡 Remember: Protecting your capital is just as important as finding profitable opportunities. What's your view? Will buyers take control, or will sellers push the market lower? #CryptoAnalysis #RiskManagement #BinanceSquare #TradingStrategy #CryptoMarket
📊 The Market Is at a Decision Point — Breakout or Breakdown?

Crypto markets don't always move in one direction. Sometimes, the most important signal is how price reacts around key levels.

📈 Bullish Scenario: If buyers defend the support zone and price breaks above resistance with strong volume, bullish momentum could return. A confirmed breakout may open the door for further upside.

📉 Bearish Scenario: If support fails to hold, selling pressure could increase. A breakdown below this zone may lead to further downside.

🎯 My Trading Strategy: I'm watching the reaction around support and resistance rather than chasing every price movement. Proper position sizing, stop-loss placement, and patience are essential.

💡 Remember: Protecting your capital is just as important as finding profitable opportunities.

What's your view? Will buyers take control, or will sellers push the market lower?

#CryptoAnalysis #RiskManagement #BinanceSquare #TradingStrategy #CryptoMarket
🚨 $EVAA : THE NEXT MOVE COULD BE DECISIVE! EVAA is showing strong momentum after gaining around 17.5% in 24 hours, but chasing a sharp pump is not a strategy. 📊 Key levels to watch: - Resistance: $1.45–$1.455 - Breakout targets: $1.48–$1.50 - Near support: $1.38–$1.40 - Deeper support: $1.34–$1.36 🎯 Trading game plan: 🟢 LONG setup: Wait for a 15-minute candle close above $1.455 with strong volume. Then watch for a successful retest before considering an entry. 🟡 Pullback setup: If price returns to $1.38–$1.40, wait for bullish confirmation. No confirmation = no trade. 🔴 Warning: A rejection at resistance followed by a break below $1.38 could weaken the bullish structure. My approach: WAIT FOR CONFIRMATION, DON'T CHASE THE PUMP. Drop your scenario below! 👇 #EVAA #CryptoAnalysis #BinanceSquare #tradingStrategy {future}(EVAAUSDT)
🚨 $EVAA : THE NEXT MOVE COULD BE DECISIVE!

EVAA is showing strong momentum after gaining around 17.5% in 24 hours, but chasing a sharp pump is not a strategy.

📊 Key levels to watch:

- Resistance: $1.45–$1.455
- Breakout targets: $1.48–$1.50
- Near support: $1.38–$1.40
- Deeper support: $1.34–$1.36

🎯 Trading game plan:

🟢 LONG setup: Wait for a 15-minute candle close above $1.455 with strong volume. Then watch for a successful retest before considering an entry.

🟡 Pullback setup: If price returns to $1.38–$1.40, wait for bullish confirmation. No confirmation = no trade.

🔴 Warning: A rejection at resistance followed by a break below $1.38 could weaken the bullish structure.

My approach: WAIT FOR CONFIRMATION, DON'T CHASE THE PUMP.

Drop your scenario below! 👇

#EVAA #CryptoAnalysis #BinanceSquare #tradingStrategy
Breakout above $1.455
100%
Pullback toward $1.38
0%
No trade
0%
3 votes • Voting closed
$VXX.ETF MARKET WATCH – VOLATILITY TRADERS! VXX is on the radar as traders watch market volatility and uncertainty. 📊 ⚡ Trading Strategy: Bullish setup: Watch for a breakout above resistance with strong volume. Bearish setup: Look for rejection at resistance and weakening momentum. Entry: Wait for confirmation before taking a position. Risk management: Use tight stop-losses and avoid chasing sudden moves. 🎯 **Traders, watch volatility closely! Are you positioning for a volatility spike or expecting the market to calm down? #VXX #Volatility #TradingStrategy #StockMarket #daytrading {etf_us}(VXX.ETF)
$VXX.ETF MARKET WATCH – VOLATILITY TRADERS!
VXX is on the radar as traders watch market volatility and uncertainty. 📊
⚡ Trading Strategy:
Bullish setup: Watch for a breakout above resistance with strong volume.
Bearish setup: Look for rejection at resistance and weakening momentum.
Entry: Wait for confirmation before taking a position.
Risk management: Use tight stop-losses and avoid chasing sudden moves.
🎯 **Traders, watch volatility closely! Are you positioning for a volatility spike or expecting the market to calm down?
#VXX #Volatility #TradingStrategy #StockMarket #daytrading
VXXETF-3.86%
🚨🔥 BNB/USDT — INSTITUTIONAL-STYLE TECHNICAL BREAKDOWN 💎 BINANCE COIN | NOVEMBER 2, 2026 BNB is approaching an important technical decision zone. Short-term momentum remains weak, but its longer-term structure is still above the 200-day moving average. 📊 MARKET DATA Reference Price: $713.63 RSI (14): 42.9 ADX (14): 26 MACD: Bearish 50-Day SMA: $748.45 200-Day SMA: $655.36 🔴 KEY RESISTANCE: R1: $726.12 R2: $753.90 R3: $782.64 🟢 KEY SUPPORT: S1: $688.42 S2: $671.41 S3: $647.33 🚀 BULLISH TRADE SETUP A confirmed daily close above $726.12, followed by a successful retest, could strengthen buying momentum. 🎯 TP1: $748.45 🎯 TP2: $753.90 🎯 TP3: $782.64 📉 BEARISH TRADE SETUP A confirmed daily breakdown below $688.42 could expose lower support zones. 🎯 TP1: $671.41 🎯 TP2: $655.36 🎯 TP3: $647.33 🧠 PROFESSIONAL TRADER'S VIEW • RSI below 50 indicates weak momentum. • MACD confirms short-term selling pressure. • ADX indicates an established trend. • Price below the 50-day average shows short-term weakness. • Price above the 200-day average preserves a constructive longer-term structure. 🔥 MY STRATEGY: I am watching $726.12 for a potential bullish reclaim and $688.42 for a bearish breakdown. No blind entries. Confirmation first. Risk management always. 📢 FOLLOW FOR MORE BNB, BTC, ETH, SOL AND XRP ANALYSIS, TRADING SIGNALS AND CRYPTO MARKET UPDATES. Let's grow together! 🚀 ⚠️ Educational technical analysis, not guaranteed financial advice. Reference prices are historical closing data. Verify the live Binance chart before trading. #BNB #BNBUSDT #BinanceSquare #BinanceCoin #CryptoSignals #TechnicalAnalysis #CryptoTrading #Bitcoin #Altcoins #tradingStrategy
🚨🔥 BNB/USDT — INSTITUTIONAL-STYLE TECHNICAL BREAKDOWN

💎 BINANCE COIN | NOVEMBER 2, 2026

BNB is approaching an important technical decision zone. Short-term momentum remains weak, but its longer-term structure is still above the 200-day moving average.

📊 MARKET DATA

Reference Price: $713.63

RSI (14): 42.9
ADX (14): 26
MACD: Bearish
50-Day SMA: $748.45
200-Day SMA: $655.36

🔴 KEY RESISTANCE:
R1: $726.12
R2: $753.90
R3: $782.64

🟢 KEY SUPPORT:
S1: $688.42
S2: $671.41
S3: $647.33

🚀 BULLISH TRADE SETUP

A confirmed daily close above $726.12, followed by a successful retest, could strengthen buying momentum.

🎯 TP1: $748.45
🎯 TP2: $753.90
🎯 TP3: $782.64

📉 BEARISH TRADE SETUP

A confirmed daily breakdown below $688.42 could expose lower support zones.

🎯 TP1: $671.41
🎯 TP2: $655.36
🎯 TP3: $647.33

🧠 PROFESSIONAL TRADER'S VIEW

• RSI below 50 indicates weak momentum.
• MACD confirms short-term selling pressure.
• ADX indicates an established trend.
• Price below the 50-day average shows short-term weakness.
• Price above the 200-day average preserves a constructive longer-term structure.

🔥 MY STRATEGY:
I am watching $726.12 for a potential bullish reclaim and $688.42 for a bearish breakdown.

No blind entries. Confirmation first. Risk management always.

📢 FOLLOW FOR MORE BNB, BTC, ETH, SOL AND XRP ANALYSIS, TRADING SIGNALS AND CRYPTO MARKET UPDATES.

Let's grow together! 🚀

⚠️ Educational technical analysis, not guaranteed financial advice. Reference prices are historical closing data. Verify the live Binance chart before trading.

#BNB #BNBUSDT #BinanceSquare #BinanceCoin #CryptoSignals #TechnicalAnalysis #CryptoTrading #Bitcoin #Altcoins #tradingStrategy
Log in to explore more content
Join global crypto users on Binance Square
⚡️ Get latest and useful information about crypto.
💬 Trusted by the world’s largest crypto exchange.
👍 Discover real insights from verified creators.
Email / Phone number