Binance Square
#backtesting

backtesting

26,873 views
89 Discussing
NeuralTraderAz
·
--
🚨 $AI MODELS ELIMINATE LOOK-AHEAD BIAS WITH INSTITUTIONAL TIME-MACHINE DATA SEARCH 🧠 Exa has launched Snapshot, indexing over 400 billion historical web pages across 20 years to solve a critical institutional flaw: look-ahead bias in data evaluations. 💡 Algorithmic trading models and financial backtesting protocols can now lock search parameters to precise historical timestamps, ensuring models only analyze information available at execution time without peeking into future answers. 🔍 While current tier access restricts general queries to a five-month lookback window, point-in-time web reading marks a structural leap forward for quantitative research and agentic precision. 📊 💬 Will temporal data integrity redefine how institutional quant models backtest market structure setups? 👇 ⚠️ Not financial advice. Always manage your risk. 🛡️ 🏷️ #AI #Backtesting #Crypto #QuantitativeAnalysis ⚡ 📊
🚨 $AI MODELS ELIMINATE LOOK-AHEAD BIAS WITH INSTITUTIONAL TIME-MACHINE DATA SEARCH 🧠

Exa has launched Snapshot, indexing over 400 billion historical web pages across 20 years to solve a critical institutional flaw: look-ahead bias in data evaluations.

💡 Algorithmic trading models and financial backtesting protocols can now lock search parameters to precise historical timestamps, ensuring models only analyze information available at execution time without peeking into future answers. 🔍

While current tier access restricts general queries to a five-month lookback window, point-in-time web reading marks a structural leap forward for quantitative research and agentic precision. 📊 💬 Will temporal data integrity redefine how institutional quant models backtest market structure setups? 👇

⚠️ Not financial advice. Always manage your risk. 🛡️

🏷️ #AI #Backtesting #Crypto #QuantitativeAnalysis

⚡ 📊
·
--
A strategy isn’t “proven” because it worked three times this week. 🧪 That’s not confidence. That’s a small sample wearing a big ego. Before risking real money, backtest the idea on past charts. Example: Your rule is to trade a breakout only when price closes beyond resistance, retests it, and holds. Don’t scroll until you find one beautiful winner. Review at least 30 similar setups and log each one: • Entry trigger • Stop location • Target or exit rule • Result in R • What market condition existed: trend or range? Why does this matter? Because a setup may look great in a strong trend but fail repeatedly in choppy conditions. Backtesting exposes where your strategy works, where it struggles, and whether your rules are actually clear. Practical rule: test the exact same rules every time. If you change the entry, stop, or target halfway through the review, you are not testing a strategy—you are collecting screenshots. ⚠️ Backtesting cannot predict the next trade. But it can replace “I think this works” with evidence. Test first. Risk later. 🎯 Have you ever tracked a strategy over 30+ past setups? 👇 #Backtesting #CryptoTrading #TradingEducation #RiskManagement
A strategy isn’t “proven” because it worked three times this week. 🧪

That’s not confidence. That’s a small sample wearing a big ego.

Before risking real money, backtest the idea on past charts.

Example:
Your rule is to trade a breakout only when price closes beyond resistance, retests it, and holds.

Don’t scroll until you find one beautiful winner. Review at least 30 similar setups and log each one:

• Entry trigger
• Stop location
• Target or exit rule
• Result in R
• What market condition existed: trend or range?

Why does this matter?

Because a setup may look great in a strong trend but fail repeatedly in choppy conditions. Backtesting exposes where your strategy works, where it struggles, and whether your rules are actually clear.

Practical rule: test the exact same rules every time. If you change the entry, stop, or target halfway through the review, you are not testing a strategy—you are collecting screenshots. ⚠️

Backtesting cannot predict the next trade. But it can replace “I think this works” with evidence.

Test first. Risk later. 🎯

Have you ever tracked a strategy over 30+ past setups? 👇

#Backtesting #CryptoTrading #TradingEducation #RiskManagement
My own backtester says my strategy lost to doing nothing. Golden Cross, 50/200 SMA, BTCUSDT perp at 1x, 2019-09-08 to today. Against buy and hold, over the same window. Buy and hold: +651%, max drawdown 77% Golden Cross: +202%, max drawdown 70% Six trades over seven years, to end up $44,954 behind someone who bought once and went outside. I'm posting it because this is the comparison almost nobody runs, and it is the only one that decides whether a strategy is worth anything. A strategy isn't competing with zero. It's competing with the thing you would have done anyway. Where it earns its keep, if it earns it at all: the drawdown. Holding meant watching 77% evaporate and not selling. The strategy's worst stretch was 70% — better, but not by enough to justify six decisions and six years of attention. That's a real result from my own tool, and it says the strategy is not good enough. A backtester that can only flatter you is a toy. Compare yours to buy and hold before you trade it 👉 https://virtuum-lab.com #BTC #Backtesting #TradingStrategy
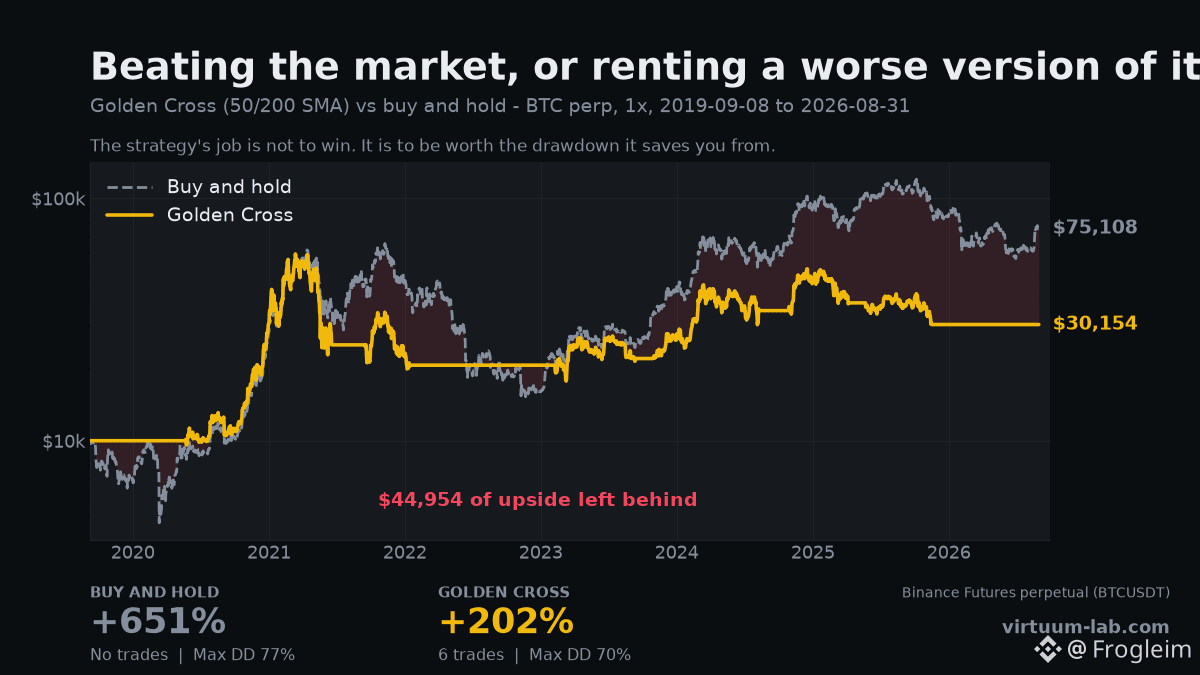
My own backtester says my strategy lost to doing nothing.

Golden Cross, 50/200 SMA, BTCUSDT perp at 1x, 2019-09-08 to today. Against buy and hold, over the same window.

Buy and hold: +651%, max drawdown 77%
Golden Cross: +202%, max drawdown 70%

Six trades over seven years, to end up $44,954 behind someone who bought once and went outside.

I'm posting it because this is the comparison almost nobody runs, and it is the only one that decides whether a strategy is worth anything. A strategy isn't competing with zero. It's competing with the thing you would have done anyway.

Where it earns its keep, if it earns it at all: the drawdown. Holding meant watching 77% evaporate and not selling. The strategy's worst stretch was 70% — better, but not by enough to justify six decisions and six years of attention.

That's a real result from my own tool, and it says the strategy is not good enough. A backtester that can only flatter you is a toy.

Compare yours to buy and hold before you trade it 👉 https://virtuum-lab.com

#BTC #Backtesting #TradingStrategy
Same strategy. Same pair. Same five trades, on the same days. Two exchanges, 14 points apart. Golden Cross, 50/200 SMA, 3x long BTCUSDT perp, 2020-03-25 to today, each venue charged its own settled funding. Binance: −16% — $9,888 of funding paid Bybit: −29% — $9,641 of funding paid The entries and exits are identical. Same signal dates, all 5 of them. And the funding bills are within a few hundred dollars of each other, so that isn't the explanation either. The gap is the candles. Every exchange prints its own price, and a rule that reads "close above the 200 SMA" reads a slightly different close on each one. Same rule, different prints, different fills — and 14 points of difference by the end. Which means a backtest is only as real as the venue it was run on. If you tested on one exchange's data and traded on another's, you tested a strategy you did not deploy. It also puts a floor on precision. If two honest data sources disagree by 14 points on the same rules, no backtest result is accurate to the decimal place, and anyone quoting you one is selling something. Pick the exchange you actually trade on 👉 https://virtuum-lab.com #BTC #Binance #Bybit #Backtesting
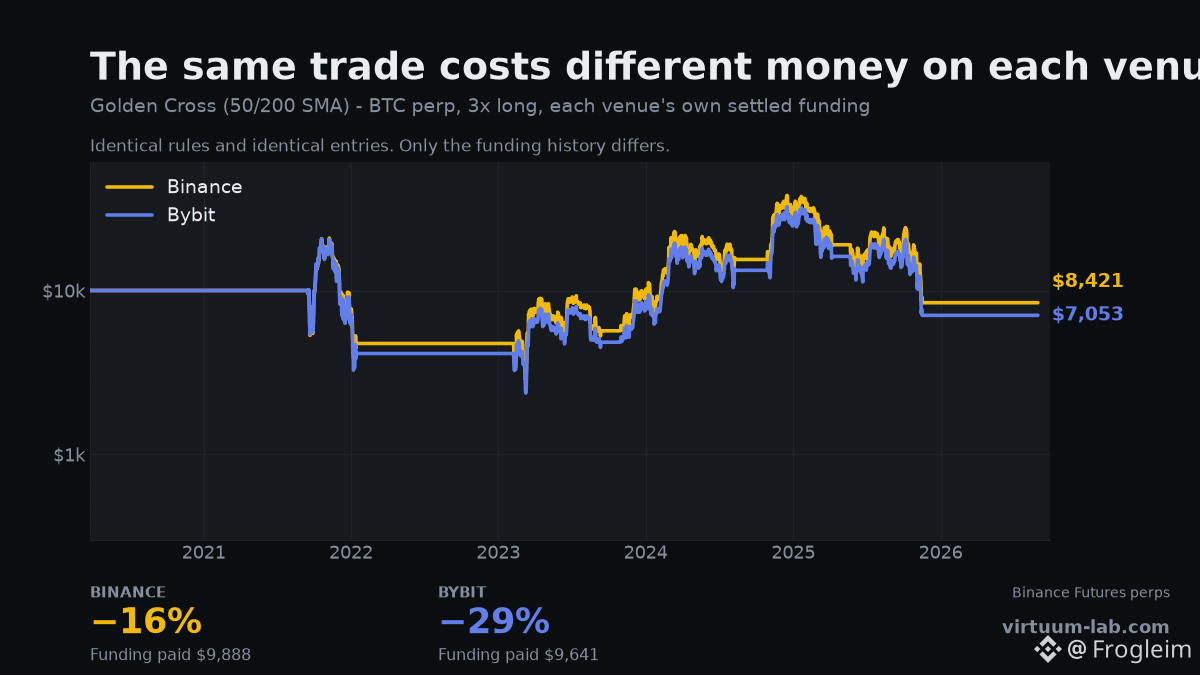
Same strategy. Same pair. Same five trades, on the same days. Two exchanges, 14 points apart.

Golden Cross, 50/200 SMA, 3x long BTCUSDT perp, 2020-03-25 to today, each venue charged its own settled funding.

Binance: −16% — $9,888 of funding paid
Bybit: −29% — $9,641 of funding paid

The entries and exits are identical. Same signal dates, all 5 of them. And the funding bills are within a few hundred dollars of each other, so that isn't the explanation either.

The gap is the candles. Every exchange prints its own price, and a rule that reads "close above the 200 SMA" reads a slightly different close on each one. Same rule, different prints, different fills — and 14 points of difference by the end.

Which means a backtest is only as real as the venue it was run on. If you tested on one exchange's data and traded on another's, you tested a strategy you did not deploy.

It also puts a floor on precision. If two honest data sources disagree by 14 points on the same rules, no backtest result is accurate to the decimal place, and anyone quoting you one is selling something.

Pick the exchange you actually trade on 👉 https://virtuum-lab.com

#BTC #Binance #Bybit #Backtesting
Same rule. Three clocks. 1,301 points apart. 9/21 EMA cross, 3x long BTCUSDT perp, real Binance funding, same window on all three so nothing gets a head start. 4 hour: +50% — 318 trades, max drawdown 98% Daily: +1,351% — 46 trades, max drawdown 96% Weekly: +508% — 7 trades, max drawdown 91% Nobody chose a timeframe for a reason. You picked the one your chart opened on. The 4 hour version trades 318 times and hands almost all of it back — every crossing costs fees, slippage and funding, and on a fast clock most crossings are noise. The weekly version takes 7 trades in 41 years and keeps more of what it makes. The uncomfortable read: if a strategy only works on one timeframe, the timeframe is doing the work, not the strategy. A real edge degrades gracefully when you change the clock. This one doesn't — it swings by 1,301 points. Before you trust a backtest, run it on the timeframe either side of the one you like. Change the clock and see what survives 👉 https://virtuum-lab.com #BTC #TradingStrategy #Backtesting
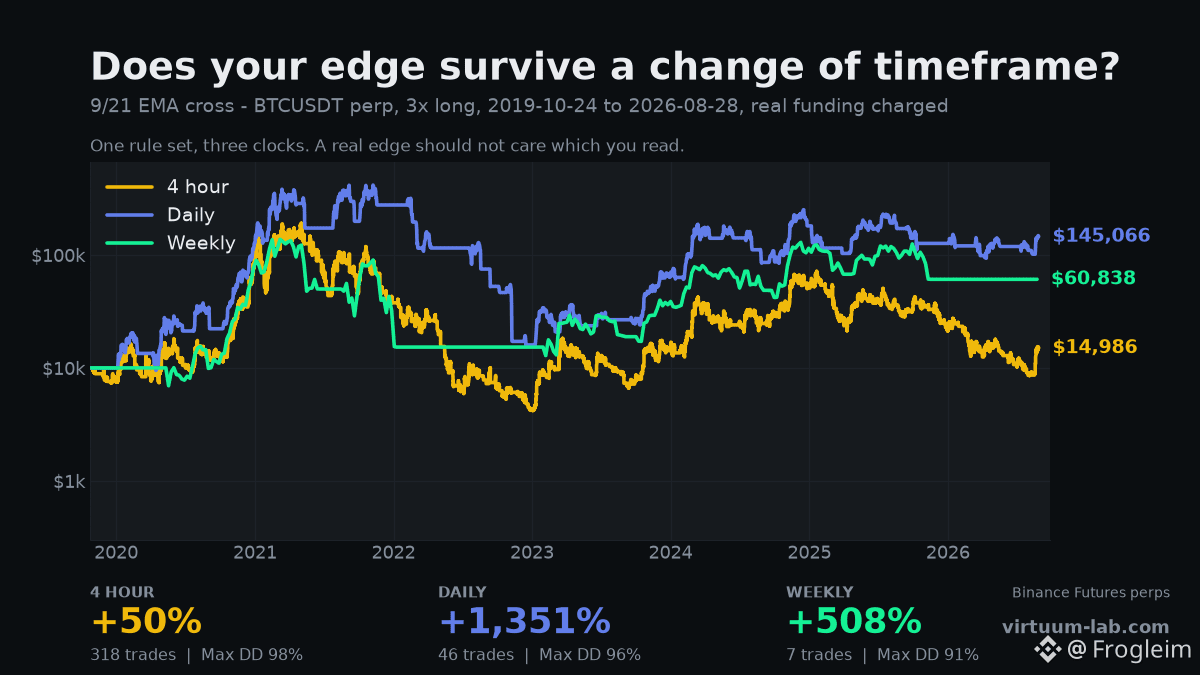
Same rule. Three clocks. 1,301 points apart.

9/21 EMA cross, 3x long BTCUSDT perp, real Binance funding, same window on all three so nothing gets a head start.

4 hour: +50% — 318 trades, max drawdown 98%
Daily: +1,351% — 46 trades, max drawdown 96%
Weekly: +508% — 7 trades, max drawdown 91%

Nobody chose a timeframe for a reason. You picked the one your chart opened on.

The 4 hour version trades 318 times and hands almost all of it back — every crossing costs fees, slippage and funding, and on a fast clock most crossings are noise. The weekly version takes 7 trades in 41 years and keeps more of what it makes.

The uncomfortable read: if a strategy only works on one timeframe, the timeframe is doing the work, not the strategy. A real edge degrades gracefully when you change the clock. This one doesn't — it swings by 1,301 points.

Before you trust a backtest, run it on the timeframe either side of the one you like.

Change the clock and see what survives 👉 https://virtuum-lab.com

#BTC #TradingStrategy #Backtesting
0.1% a trade cost this strategy 486 points. 9/21 EMA cross on BTCUSDT perp, 4 hour bars, 1x, 2019-10-23 to today. 318 trades. The strategy never changes — only what each trade costs. No costs at all: +574% 5 bps per side: +256% 10 bps per side: +88% 10 bps is 0.1%. It is roughly what you actually pay as a taker once spread and slippage are counted, and it turns a spectacular backtest into an ordinary one. The reason it bites this hard is 318 trades. Cost is charged per trade, so it scales with activity while your edge does not. A slow strategy can ignore fees. A strategy that trades every few days cannot — it is paying rent 318 times. This is why the most common backtesting mistake isn't a bad indicator. It's a zero in the fee box. Every high-frequency strategy looks brilliant at 0 bps. If your backtester doesn't charge commission and slippage per side, it isn't testing your strategy. It's testing a fantasy version that trades for free. Charge yourself what your exchange charges you 👉 https://virtuum-lab.com #BTC #TradingFees #Backtesting
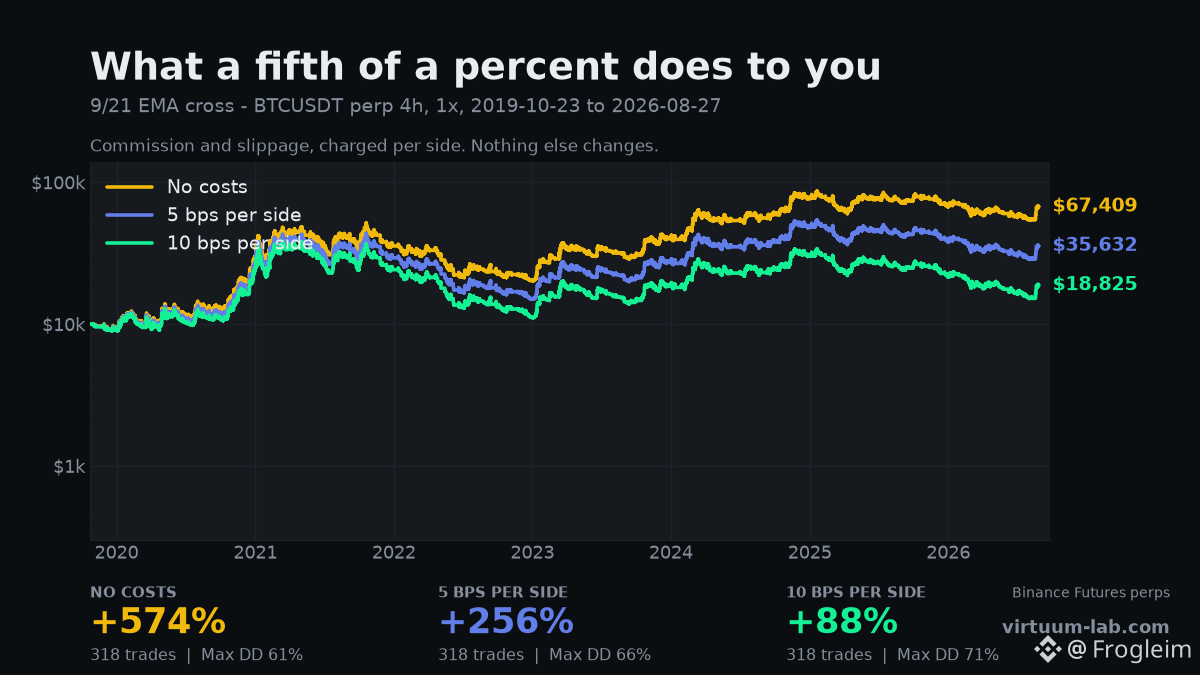
0.1% a trade cost this strategy 486 points.

9/21 EMA cross on BTCUSDT perp, 4 hour bars, 1x, 2019-10-23 to today. 318 trades. The strategy never changes — only what each trade costs.

No costs at all: +574%
5 bps per side: +256%
10 bps per side: +88%

10 bps is 0.1%. It is roughly what you actually pay as a taker once spread and slippage are counted, and it turns a spectacular backtest into an ordinary one.

The reason it bites this hard is 318 trades. Cost is charged per trade, so it scales with activity while your edge does not. A slow strategy can ignore fees. A strategy that trades every few days cannot — it is paying rent 318 times.

This is why the most common backtesting mistake isn't a bad indicator. It's a zero in the fee box. Every high-frequency strategy looks brilliant at 0 bps.

If your backtester doesn't charge commission and slippage per side, it isn't testing your strategy. It's testing a fantasy version that trades for free.

Charge yourself what your exchange charges you 👉 https://virtuum-lab.com

#BTC #TradingFees #Backtesting
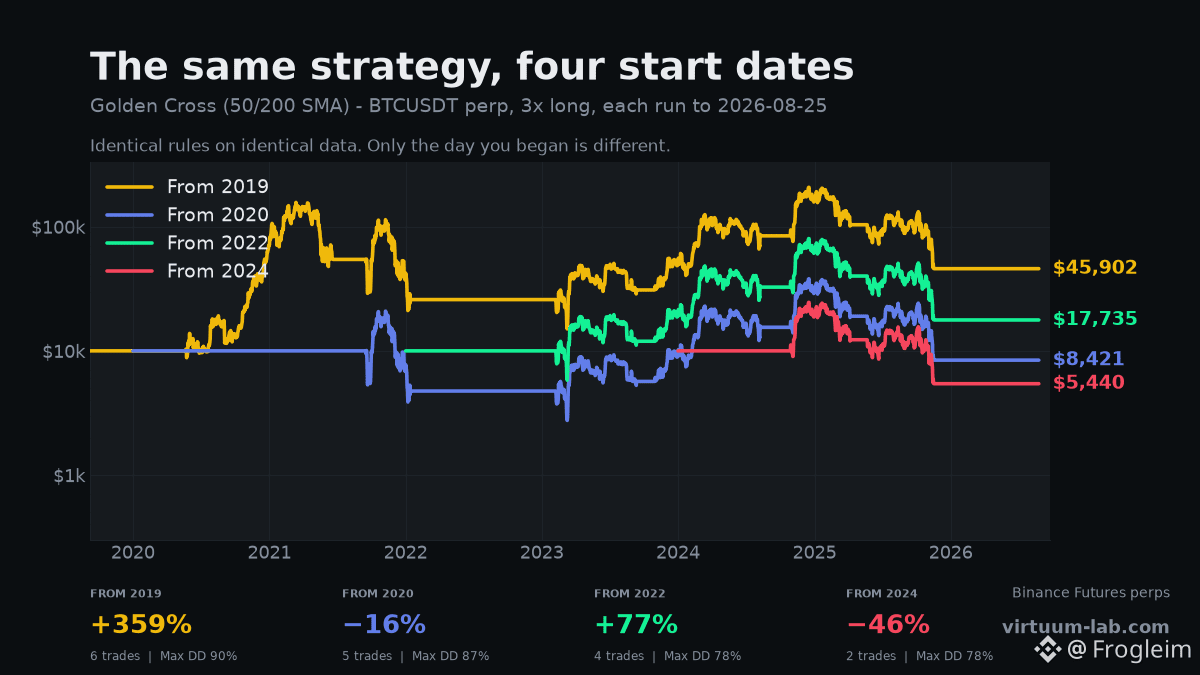
The same strategy made +359% and −46%. The only difference was the day I started. Golden Cross, 50/200 SMA, 3x long BTCUSDT perp, real Binance funding charged. Identical rules, identical data, all four running to today. The only variable is when you switched it on. Started 2019: +359% Started 2020: −16% Started 2022: +77% Started 2024: −46% 405 points of spread, and not one line of the strategy changed. This is the number nobody publishes. When someone shows you a backtest, they have already chosen the start date — and they chose it after seeing the result. Move it by a year and the same rules go from a fortune to a hole. It isn't luck evening out over time, either. The 2019 run caught one enormous trend early enough that it paid for everything after. The 2024 run took 2 trades and never got that gift. What to do about it: run your rules from several start dates before you believe any of them. If the answer only works from one particular Tuesday, it isn't an edge — it's a coincidence with good marketing. Test the same rules from every start date you like 👉 https://virtuum-lab.com #BTC #Backtesting #TradingStrategy
The same strategy made +359% and −46%. The only difference was the day I started.

Golden Cross, 50/200 SMA, 3x long BTCUSDT perp, real Binance funding charged. Identical rules, identical data, all four running to today. The only variable is when you switched it on.

Started 2019: +359%
Started 2020: −16%
Started 2022: +77%
Started 2024: −46%

405 points of spread, and not one line of the strategy changed.

This is the number nobody publishes. When someone shows you a backtest, they have already chosen the start date — and they chose it after seeing the result. Move it by a year and the same rules go from a fortune to a hole.

It isn't luck evening out over time, either. The 2019 run caught one enormous trend early enough that it paid for everything after. The 2024 run took 2 trades and never got that gift.

What to do about it: run your rules from several start dates before you believe any of them. If the answer only works from one particular Tuesday, it isn't an edge — it's a coincidence with good marketing.

Test the same rules from every start date you like 👉 https://virtuum-lab.com

#BTC #Backtesting #TradingStrategy
·
--
Article
Backtest Promised 28.72%. Runs with Real Money Returns 23.46%.The backtest promised my hourly volume alerts would hit +10% within 12 hours—28.72% of the time. The machine has been running for real. 170 alerts closed the window. Score: **23.46%** on 162 clean orders. Lower than the backtest by 5.26 points. Just as in every backtest: the real trade performs worse than the “paper” one. But still **3.56 times** better than a random hour (6.59%). The edge is real, just smaller than the advertisement’s claim. Three things that come with that number. **One.** 8 warnings are still open and **are not counted**. A position not finished within the time window isn’t a win.

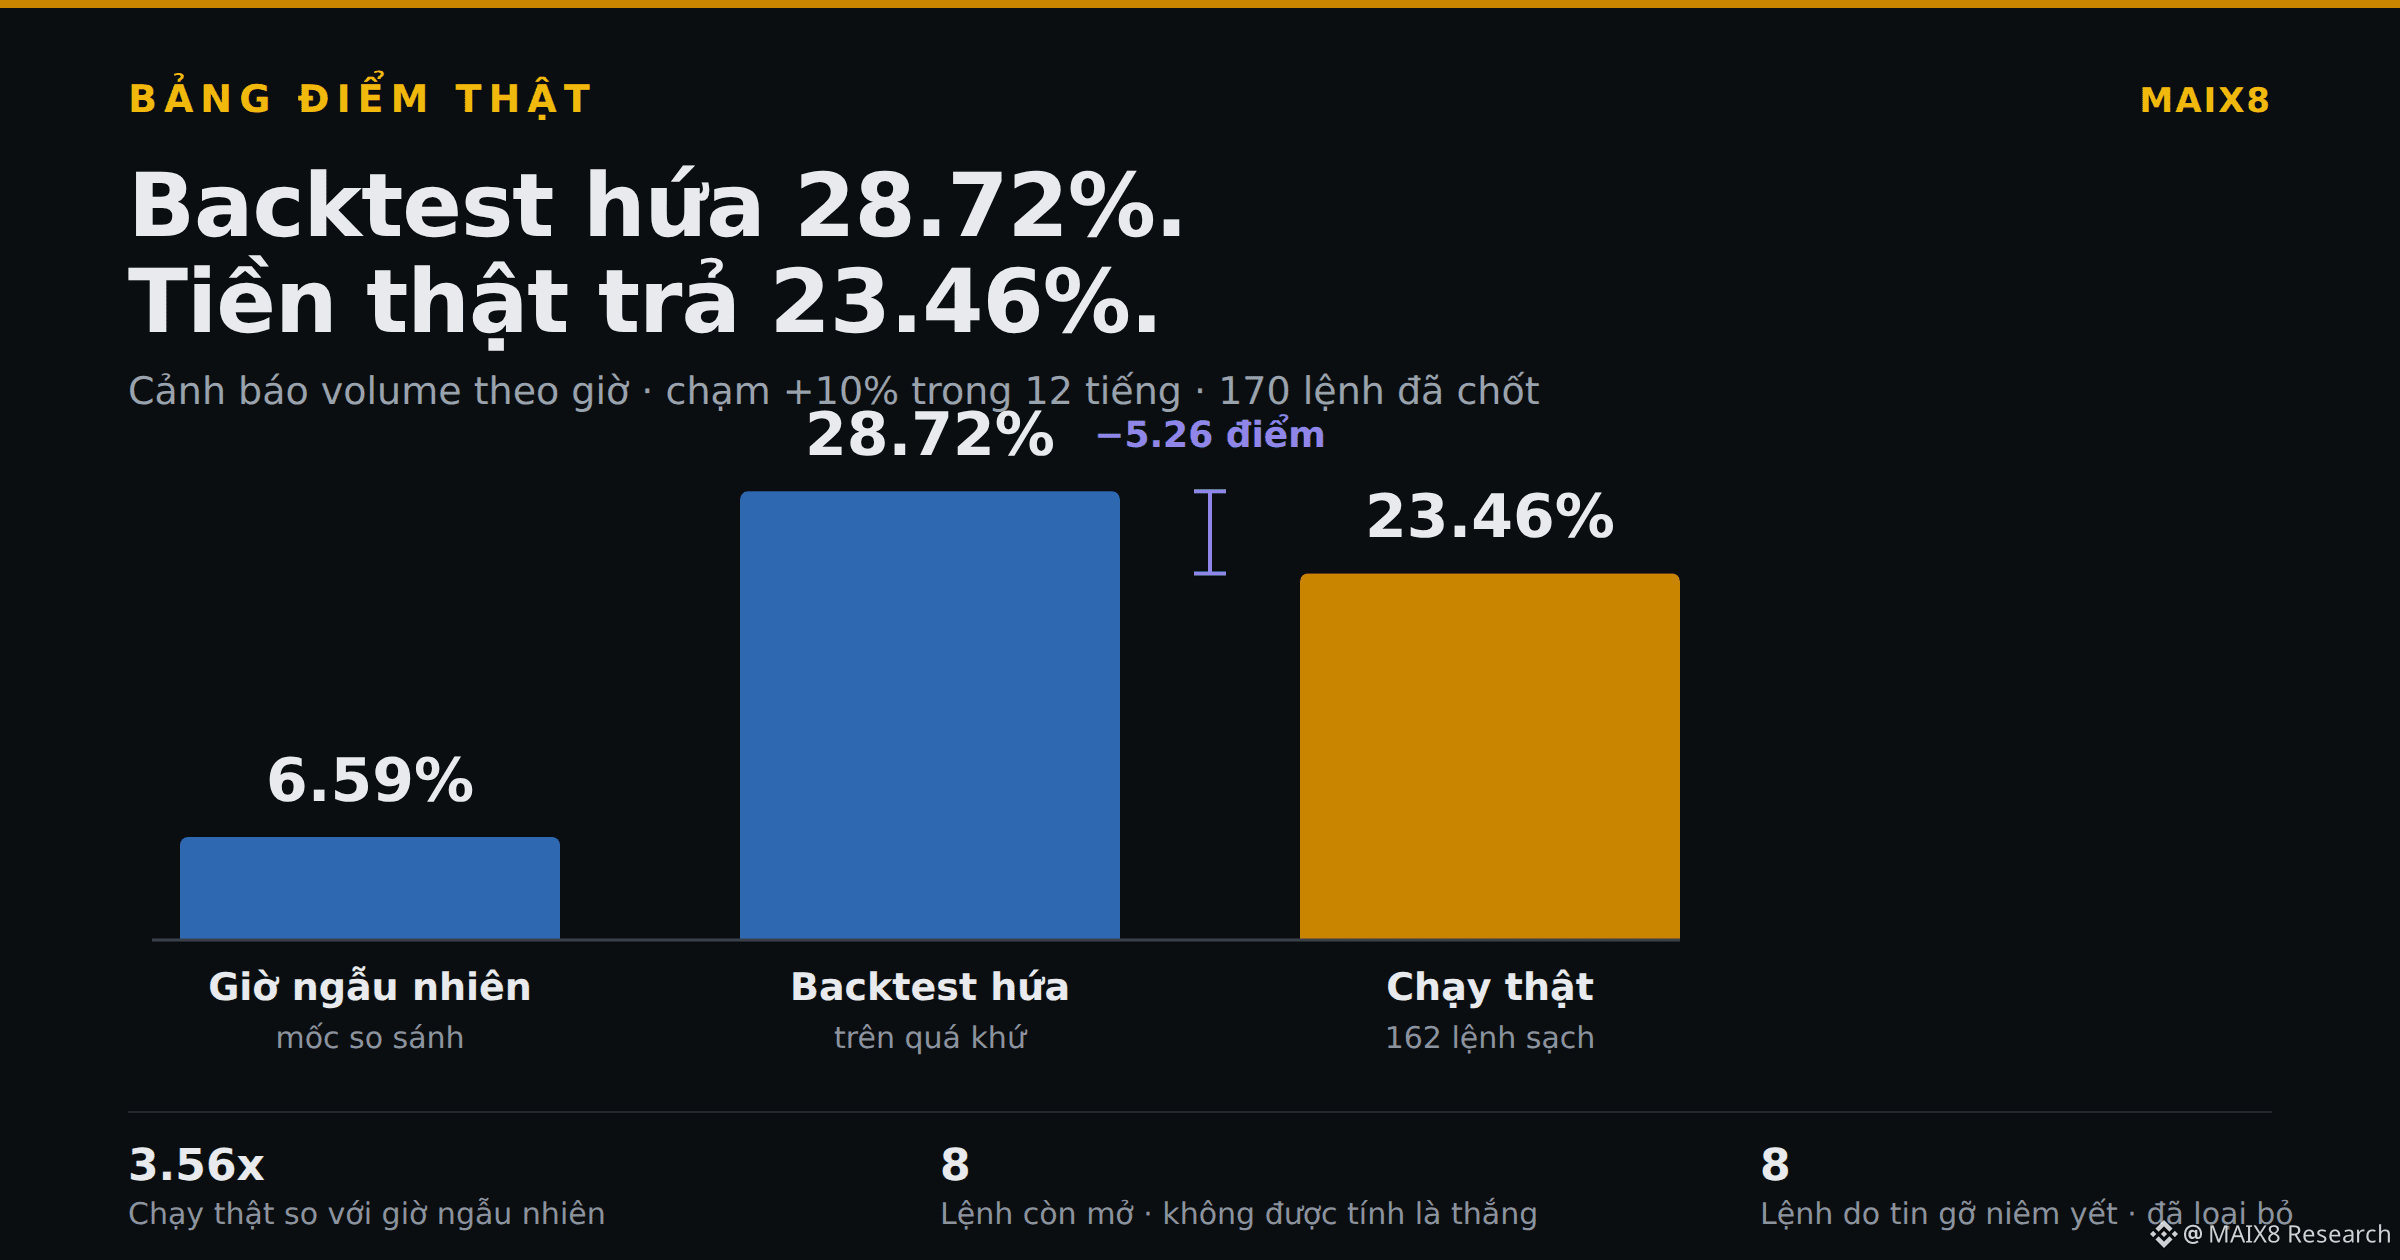
Backtest Promised 28.72%. Runs with Real Money Returns 23.46%.

The backtest promised my hourly volume alerts would hit +10% within 12 hours—28.72% of the time.
The machine has been running for real. 170 alerts closed the window. Score:
**23.46%** on 162 clean orders.
Lower than the backtest by 5.26 points. Just as in every backtest: the real trade performs worse than the “paper” one.
But still **3.56 times** better than a random hour (6.59%). The edge is real, just smaller than the advertisement’s claim.
Three things that come with that number.
**One.** 8 warnings are still open and **are not counted**. A position not finished within the time window isn’t a win.
Article
TRADING IS LIKE A MUSTANG: IT'S BORN IN A LABIn my confessions as a rookie trader, today I want to tell you why trading without a system is like driving blind... I must confess that when I started in this game, one of the hardest things for me was remembering that an RSI of 70 meant overbought and 30 meant oversold. Something so 'basic' created a terrifying void in my mind. And no, it wasn't due to a lack of intelligence; it's just that trading with dyslexia and dyscalculia forces you to live in a universe where numbers and directions sometimes turn into a dead-end tunnel.

TRADING IS LIKE A MUSTANG: IT'S BORN IN A LAB

In my confessions as a rookie trader, today I want to tell you why trading without a system is like driving blind...
I must confess that when I started in this game, one of the hardest things for me was remembering that an RSI of 70 meant overbought and 30 meant oversold. Something so 'basic' created a terrifying void in my mind. And no, it wasn't due to a lack of intelligence; it's just that trading with dyslexia and dyscalculia forces you to live in a universe where numbers and directions sometimes turn into a dead-end tunnel.
·
--
Bullish
We believe crypto should feel less like a casino. And more like a well-tested system for sustainable growth. That's why CryptoGates exists: → Build strategies — don't guess them → Backtest on real historical data — don't assume → Predict & optimize — don't hope → Automate with discipline — don't react Earning without stress. Participating without obsession. Growing without gambling. No signup. No credit card. Just build.👇 $BTC $BNB #Backtesting
We believe crypto should feel less like a casino.
And more like a well-tested system for sustainable growth.
That's why CryptoGates exists:

→ Build strategies — don't guess them
→ Backtest on real historical data — don't assume
→ Predict & optimize — don't hope
→ Automate with discipline — don't react

Earning without stress.
Participating without obsession.
Growing without gambling.

No signup. No credit card. Just build.👇
$BTC $BNB #Backtesting
Article
Universal Signal Backtester: Find Out If Your Trading Signal Actually WorksA trading signal can look perfect on a chart. Green arrow. Price moves higher. The setup looks obvious. But there is one question most traders don't answer: What would have happened if I had taken every signal? That's where the Universal Signal Backtester by LuxAlgo becomes useful. Instead of testing a strategy manually trade by trade, the indicator lets you simulate different entry signals directly on the chart and see how they performed under different take-profit, stop-loss and trading-cost conditions. And the interesting part is that you're not limited to one strategy. You can test everything from a simple 9/21 EMA crossover to signals generated by another indicator. 🧪 What Does the Universal Signal Backtester Actually Do? Think of it as a testing laboratory for trading signals. You provide the signal. The backtester simulates what would have happened if you had traded it. You can then examine things like: How many trades occurred? How often did they win? How profitable were they? Which TP level performed best? Were certain market sessions better than others? Did the strategy behave differently on different days or months? This makes it easier to move from: “This indicator looks good.” to: “I have actually tested what happens when I follow its signals.” ⚙️ How Does It Generate Trades? The first step is choosing where the trading signals come from. There are three main options. 1️⃣ Predefined Crosses You can test common moving-average strategies without connecting another indicator. For example: 9 EMA / 21 EMA 12 EMA / 26 EMA 50 SMA / 200 SMA The last one is commonly known as the Golden Cross / Death Cross approach. This gives you a quick way to see how a basic crossover strategy would have behaved historically. 2️⃣ External Crossovers You can also select two external plots and test when they cross. For example: RSI crossing a specific level or One custom moving average crossing another This makes the backtester much more flexible than simply testing built-in moving averages. 3️⃣ External Signals This is where things become particularly interesting. You can connect discrete Buy/Sell signals from another indicator. So if you have an indicator that produces: 🟢 Buy signal 🔴 Sell signal you can use the Universal Signal Backtester to investigate how those signals performed historically. That means you can test the signal itself instead of simply looking at the chart and assuming it works. 🎯 What Happens After a Signal? Once a valid entry appears, the backtester simulates the trade. You can configure up to: 3 Take Profits and 3 Stop Loss levels This lets you test different trade-management approaches. For example: TP1 → conservative target TP2 → medium target TP3 → aggressive target You can also experiment with different stop distances. The important part is that you're not locked into one exit strategy. You can investigate which combination makes the most sense for the signal you're testing. 👀 The Chart Shows You What Happened The indicator isn't just a table of numbers. It also visualizes the simulated trades directly on the chart. 📍 Sign Posts When a trade begins, a label appears above or below the candle. The label can suggest which TP level is currently performing best according to the selected metric, such as Hit Rate or Expected Profit. ━ Active Exit Lines Horizontal dashed lines show the selected TP and SL levels. When a level is reached, the result is marked visually: ✓ = Hit ✗ = Not Hit This makes it much easier to understand how the strategy behaves without having to inspect every trade manually. 📊 The Dashboard Is Where It Gets Interesting A backtest isn't very useful if all you know is: “I had 63% winning trades.” Win rate alone doesn't tell the whole story. The dashboard provides several additional measurements. Core Metrics You can examine: Total Trades How many simulated trades occurred. Win Rate The percentage of trades that were profitable. Profit Factor A comparison of gross profits against gross losses. Sharpe Ratio A measure used to evaluate returns relative to volatility. Recovery Factor Shows how effectively the strategy recovers from drawdowns. Looking at several metrics together gives you a much better picture than focusing on win rate alone. 📈 Watch the Equity Curve The dashboard also includes an equity curve. This gives you a visual representation of how the simulated account balance developed over time. This can reveal things that a simple win rate hides. For example: A strategy might have a high win rate but suffer from occasional large losses. Another strategy might win less frequently but produce a smoother equity curve. That's why looking at the entire performance profile matters. 🕐 When Does the Strategy Perform Best? One of the most useful features is the ability to break performance down by time. The dashboard includes an hourly performance histogram. This can help answer questions such as: Are my signals actually better during certain hours? For crypto, this can be especially interesting because market activity can change significantly between major trading sessions. The indicator also provides heatmaps for: Days of the Week or Months This can help identify periods where the tested strategy historically performed better or worse. But remember: A historical pattern isn't a guarantee of future performance. 💸 Don't Forget Trading Costs This is one of the easiest things to overlook when testing a strategy. A backtest can look fantastic before fees. Then reality arrives. You pay: Spread Commission Slippage And suddenly the results look very different. The Universal Signal Backtester includes a cost simulation engine that allows users to apply predefined profiles for: Forex Crypto Stocks You can also enter manual costs to better match your broker or exchange. This is important because a strategy that makes tiny profits on each trade can be heavily affected by transaction costs. 🌪️ What About Choppy Markets? The indicator also includes an optional ATR Choppiness Filter. When enabled, the system can ignore signals occurring during low-volatility, choppy conditions. Why does this matter? Because some strategies work beautifully when the market is moving strongly but produce a long series of weak signals when price starts moving sideways. A filter can help investigate whether the strategy performs better when certain market conditions are removed. 🧠 The Real Value: Testing the Idea, Not Just the Indicator This is where I think beginners can get the most value from a tool like this. Imagine you find an indicator online that claims: “My Buy signals are extremely accurate.” You don't have to simply believe it. You can ask: How many signals were generated? What's the actual win rate? What happens with a 1R target? What happens with a 2R target? What happens with a wider stop? Does it still work after trading costs? Does it work during every session? Does performance remain consistent across different periods? Those questions are much more useful than simply looking at a few winning examples. 🔬 A Simple Example Suppose you're testing a 9/21 EMA crossover. You could configure the backtester to: Entry: 9 EMA crosses 21 EMA Direction: Long + Short TP: 1R / 2R / 3R SL: Defined distance Costs: Crypto profile Then you can inspect the results. Maybe the 1R target produces a high hit rate. But perhaps the 3R target produces better overall expected profit. Or maybe the strategy performs well during London and New York but struggles during quieter hours. Now you have something useful: Evidence to investigate. Not just a nice-looking chart. ⚠️ Backtesting Doesn't Predict the Future This is probably the most important lesson. A backtest tells you: “This is what happened under these historical conditions.” It does not tell you: “This will definitely happen next.” Markets change. Volatility changes. Liquidity changes. Fees change. The behavior of traders changes. A strategy that performed well historically can still fail in live markets. So the purpose of a backtester shouldn't be to find a magical strategy with a perfect win rate. It should be to stress-test your idea and understand its weaknesses. 🧠 The Bottom Line The Universal Signal Backtester is essentially a testing laboratory for trading signals. You can connect: Moving-average crosses External crossovers Custom Buy/Sell signals Then test them using different: Take Profits Stop Losses Trading costs Market conditions Time periods and trade directions. The biggest advantage isn't finding a strategy that looks amazing. It's discovering whether the strategy still makes sense after you remove the guesswork. Before risking real money on a signal, ask yourself: Have I actually tested it, or do I just like the way it looks on the chart? That one question can save a trader from a lot of unnecessary losses. ⚠️ This article is for educational purposes only and is not financial advice. Backtested performance does not guarantee future results. Always account for fees, slippage, market conditions and risk before trading real capital. #trading #cryptotrading #Backtesting #TechnicalAnalysis #RiskManagement

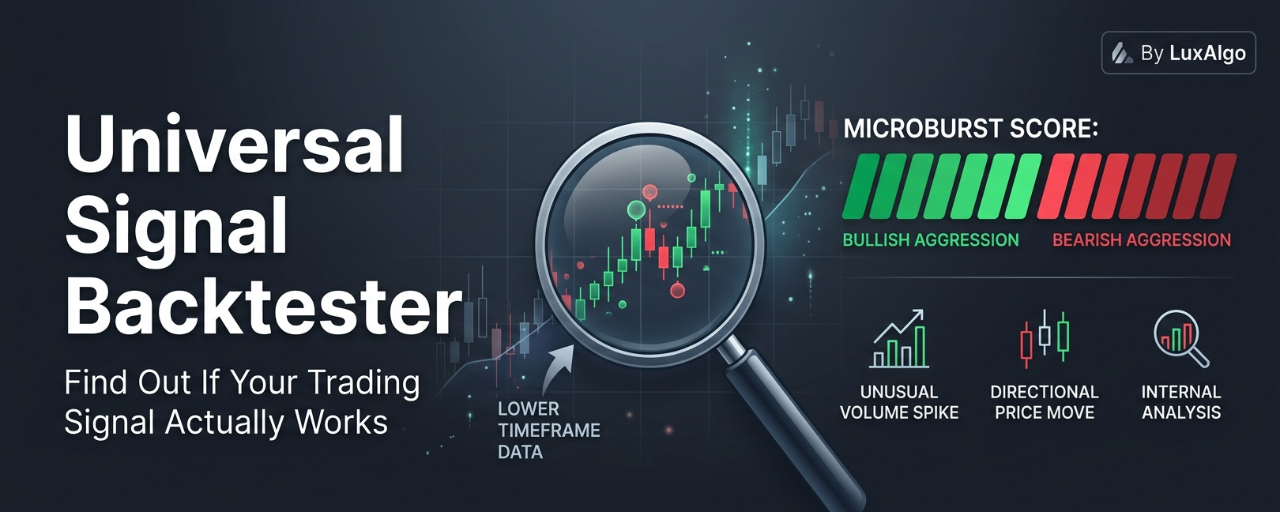
Universal Signal Backtester: Find Out If Your Trading Signal Actually Works

A trading signal can look perfect on a chart.
Green arrow.
Price moves higher.
The setup looks obvious.
But there is one question most traders don't answer:
What would have happened if I had taken every signal?
That's where the Universal Signal Backtester by LuxAlgo becomes useful.
Instead of testing a strategy manually trade by trade, the indicator lets you simulate different entry signals directly on the chart and see how they performed under different take-profit, stop-loss and trading-cost conditions.
And the interesting part is that you're not limited to one strategy.
You can test everything from a simple 9/21 EMA crossover to signals generated by another indicator.
🧪 What Does the Universal Signal Backtester Actually Do?
Think of it as a testing laboratory for trading signals.
You provide the signal.
The backtester simulates what would have happened if you had traded it.
You can then examine things like:
How many trades occurred?
How often did they win?
How profitable were they?
Which TP level performed best?
Were certain market sessions better than others?
Did the strategy behave differently on different days or months?
This makes it easier to move from:
“This indicator looks good.”
to:
“I have actually tested what happens when I follow its signals.”
⚙️ How Does It Generate Trades?
The first step is choosing where the trading signals come from.
There are three main options.
1️⃣ Predefined Crosses
You can test common moving-average strategies without connecting another indicator.
For example:
9 EMA / 21 EMA
12 EMA / 26 EMA
50 SMA / 200 SMA
The last one is commonly known as the Golden Cross / Death Cross approach.
This gives you a quick way to see how a basic crossover strategy would have behaved historically.
2️⃣ External Crossovers
You can also select two external plots and test when they cross.
For example:
RSI crossing a specific level
or
One custom moving average crossing another
This makes the backtester much more flexible than simply testing built-in moving averages.
3️⃣ External Signals
This is where things become particularly interesting.
You can connect discrete Buy/Sell signals from another indicator.
So if you have an indicator that produces:
🟢 Buy signal
🔴 Sell signal
you can use the Universal Signal Backtester to investigate how those signals performed historically.
That means you can test the signal itself instead of simply looking at the chart and assuming it works.
🎯 What Happens After a Signal?
Once a valid entry appears, the backtester simulates the trade.
You can configure up to:
3 Take Profits
and
3 Stop Loss levels
This lets you test different trade-management approaches.
For example:
TP1 → conservative target
TP2 → medium target
TP3 → aggressive target
You can also experiment with different stop distances.
The important part is that you're not locked into one exit strategy.
You can investigate which combination makes the most sense for the signal you're testing.
👀 The Chart Shows You What Happened
The indicator isn't just a table of numbers.
It also visualizes the simulated trades directly on the chart.
📍 Sign Posts
When a trade begins, a label appears above or below the candle.
The label can suggest which TP level is currently performing best according to the selected metric, such as Hit Rate or Expected Profit.
━ Active Exit Lines
Horizontal dashed lines show the selected TP and SL levels.
When a level is reached, the result is marked visually:
✓ = Hit
✗ = Not Hit
This makes it much easier to understand how the strategy behaves without having to inspect every trade manually.
📊 The Dashboard Is Where It Gets Interesting
A backtest isn't very useful if all you know is:
“I had 63% winning trades.”
Win rate alone doesn't tell the whole story.
The dashboard provides several additional measurements.
Core Metrics
You can examine:
Total Trades
How many simulated trades occurred.
Win Rate
The percentage of trades that were profitable.
Profit Factor
A comparison of gross profits against gross losses.
Sharpe Ratio
A measure used to evaluate returns relative to volatility.
Recovery Factor
Shows how effectively the strategy recovers from drawdowns.
Looking at several metrics together gives you a much better picture than focusing on win rate alone.
📈 Watch the Equity Curve
The dashboard also includes an equity curve.
This gives you a visual representation of how the simulated account balance developed over time.
This can reveal things that a simple win rate hides.
For example:
A strategy might have a high win rate but suffer from occasional large losses.
Another strategy might win less frequently but produce a smoother equity curve.
That's why looking at the entire performance profile matters.
🕐 When Does the Strategy Perform Best?
One of the most useful features is the ability to break performance down by time.
The dashboard includes an hourly performance histogram.
This can help answer questions such as:
Are my signals actually better during certain hours?
For crypto, this can be especially interesting because market activity can change significantly between major trading sessions.
The indicator also provides heatmaps for:
Days of the Week
or
Months
This can help identify periods where the tested strategy historically performed better or worse.
But remember:
A historical pattern isn't a guarantee of future performance.
💸 Don't Forget Trading Costs
This is one of the easiest things to overlook when testing a strategy.
A backtest can look fantastic before fees.
Then reality arrives.
You pay:
Spread
Commission
Slippage
And suddenly the results look very different.
The Universal Signal Backtester includes a cost simulation engine that allows users to apply predefined profiles for:
Forex
Crypto
Stocks
You can also enter manual costs to better match your broker or exchange.
This is important because a strategy that makes tiny profits on each trade can be heavily affected by transaction costs.
🌪️ What About Choppy Markets?
The indicator also includes an optional ATR Choppiness Filter.
When enabled, the system can ignore signals occurring during low-volatility, choppy conditions.
Why does this matter?
Because some strategies work beautifully when the market is moving strongly but produce a long series of weak signals when price starts moving sideways.
A filter can help investigate whether the strategy performs better when certain market conditions are removed.
🧠 The Real Value: Testing the Idea, Not Just the Indicator
This is where I think beginners can get the most value from a tool like this.
Imagine you find an indicator online that claims:
“My Buy signals are extremely accurate.”
You don't have to simply believe it.
You can ask:
How many signals were generated?
What's the actual win rate?
What happens with a 1R target?
What happens with a 2R target?
What happens with a wider stop?
Does it still work after trading costs?
Does it work during every session?
Does performance remain consistent across different periods?
Those questions are much more useful than simply looking at a few winning examples.
🔬 A Simple Example
Suppose you're testing a 9/21 EMA crossover.
You could configure the backtester to:
Entry: 9 EMA crosses 21 EMA
Direction: Long + Short
TP: 1R / 2R / 3R
SL: Defined distance
Costs: Crypto profile
Then you can inspect the results.
Maybe the 1R target produces a high hit rate.
But perhaps the 3R target produces better overall expected profit.
Or maybe the strategy performs well during London and New York but struggles during quieter hours.
Now you have something useful:
Evidence to investigate.
Not just a nice-looking chart.
⚠️ Backtesting Doesn't Predict the Future
This is probably the most important lesson.
A backtest tells you:
“This is what happened under these historical conditions.”
It does not tell you:
“This will definitely happen next.”
Markets change.
Volatility changes.
Liquidity changes.
Fees change.
The behavior of traders changes.
A strategy that performed well historically can still fail in live markets.
So the purpose of a backtester shouldn't be to find a magical strategy with a perfect win rate.
It should be to stress-test your idea and understand its weaknesses.
🧠 The Bottom Line
The Universal Signal Backtester is essentially a testing laboratory for trading signals.
You can connect:
Moving-average crosses
External crossovers
Custom Buy/Sell signals
Then test them using different:
Take Profits
Stop Losses
Trading costs
Market conditions
Time periods
and trade directions.
The biggest advantage isn't finding a strategy that looks amazing.
It's discovering whether the strategy still makes sense after you remove the guesswork.
Before risking real money on a signal, ask yourself:
Have I actually tested it, or do I just like the way it looks on the chart?
That one question can save a trader from a lot of unnecessary losses.
⚠️ This article is for educational purposes only and is not financial advice. Backtested performance does not guarantee future results. Always account for fees, slippage, market conditions and risk before trading real capital.
#trading #cryptotrading #Backtesting #TechnicalAnalysis #RiskManagement
A strategy can look flawless on daily candles and still get rekt live. Why? Daily data smooths over intraday wicks and fake breakouts your bot never got tested against. CG backtests DCA, Grid, and Rebalance bots on 1-min OHLCV data - no shortcuts. Stress test yours... #Bitcoin #CryptoTrading #Backtesting
A strategy can look flawless on daily candles and still get rekt live.
Why?

Daily data smooths over intraday wicks and fake breakouts your bot never got tested against.

CG backtests DCA, Grid, and Rebalance bots on 1-min OHLCV data - no shortcuts.

Stress test yours...

#Bitcoin #CryptoTrading #Backtesting
Batchild
·
--
Universal Signal Backtester: Find Out If Your Trading Signal Actually Works
A trading signal can look perfect on a chart.
Green arrow.
Price moves higher.
The setup looks obvious.
But there is one question most traders don't answer:
What would have happened if I had taken every signal?
That's where the Universal Signal Backtester by LuxAlgo becomes useful.
Instead of testing a strategy manually trade by trade, the indicator lets you simulate different entry signals directly on the chart and see how they performed under different take-profit, stop-loss and trading-cost conditions.
And the interesting part is that you're not limited to one strategy.
You can test everything from a simple 9/21 EMA crossover to signals generated by another indicator.

🧪 What Does the Universal Signal Backtester Actually Do?
Think of it as a testing laboratory for trading signals.
You provide the signal.
The backtester simulates what would have happened if you had traded it.
You can then examine things like:
How many trades occurred?
How often did they win?
How profitable were they?
Which TP level performed best?
Were certain market sessions better than others?
Did the strategy behave differently on different days or months?
This makes it easier to move from:
“This indicator looks good.”
to:
“I have actually tested what happens when I follow its signals.”

⚙️ How Does It Generate Trades?
The first step is choosing where the trading signals come from.
There are three main options.
1️⃣ Predefined Crosses
You can test common moving-average strategies without connecting another indicator.
For example:
9 EMA / 21 EMA
12 EMA / 26 EMA
50 SMA / 200 SMA
The last one is commonly known as the Golden Cross / Death Cross approach.
This gives you a quick way to see how a basic crossover strategy would have behaved historically.

2️⃣ External Crossovers
You can also select two external plots and test when they cross.
For example:
RSI crossing a specific level
or
One custom moving average crossing another
This makes the backtester much more flexible than simply testing built-in moving averages.

3️⃣ External Signals
This is where things become particularly interesting.
You can connect discrete Buy/Sell signals from another indicator.
So if you have an indicator that produces:
🟢 Buy signal
🔴 Sell signal
you can use the Universal Signal Backtester to investigate how those signals performed historically.
That means you can test the signal itself instead of simply looking at the chart and assuming it works.

🎯 What Happens After a Signal?
Once a valid entry appears, the backtester simulates the trade.
You can configure up to:
3 Take Profits
and
3 Stop Loss levels
This lets you test different trade-management approaches.
For example:
TP1 → conservative target
TP2 → medium target
TP3 → aggressive target
You can also experiment with different stop distances.
The important part is that you're not locked into one exit strategy.
You can investigate which combination makes the most sense for the signal you're testing.

👀 The Chart Shows You What Happened
The indicator isn't just a table of numbers.
It also visualizes the simulated trades directly on the chart.
📍 Sign Posts
When a trade begins, a label appears above or below the candle.
The label can suggest which TP level is currently performing best according to the selected metric, such as Hit Rate or Expected Profit.
━ Active Exit Lines
Horizontal dashed lines show the selected TP and SL levels.
When a level is reached, the result is marked visually:
✓ = Hit
✗ = Not Hit
This makes it much easier to understand how the strategy behaves without having to inspect every trade manually.

📊 The Dashboard Is Where It Gets Interesting
A backtest isn't very useful if all you know is:
“I had 63% winning trades.”
Win rate alone doesn't tell the whole story.
The dashboard provides several additional measurements.
Core Metrics
You can examine:
Total Trades
How many simulated trades occurred.
Win Rate
The percentage of trades that were profitable.
Profit Factor
A comparison of gross profits against gross losses.
Sharpe Ratio
A measure used to evaluate returns relative to volatility.
Recovery Factor
Shows how effectively the strategy recovers from drawdowns.
Looking at several metrics together gives you a much better picture than focusing on win rate alone.

📈 Watch the Equity Curve
The dashboard also includes an equity curve.
This gives you a visual representation of how the simulated account balance developed over time.
This can reveal things that a simple win rate hides.
For example:
A strategy might have a high win rate but suffer from occasional large losses.
Another strategy might win less frequently but produce a smoother equity curve.
That's why looking at the entire performance profile matters.

🕐 When Does the Strategy Perform Best?
One of the most useful features is the ability to break performance down by time.
The dashboard includes an hourly performance histogram.
This can help answer questions such as:
Are my signals actually better during certain hours?
For crypto, this can be especially interesting because market activity can change significantly between major trading sessions.
The indicator also provides heatmaps for:
Days of the Week
or
Months
This can help identify periods where the tested strategy historically performed better or worse.
But remember:
A historical pattern isn't a guarantee of future performance.

💸 Don't Forget Trading Costs
This is one of the easiest things to overlook when testing a strategy.
A backtest can look fantastic before fees.
Then reality arrives.
You pay:
Spread
Commission
Slippage
And suddenly the results look very different.
The Universal Signal Backtester includes a cost simulation engine that allows users to apply predefined profiles for:
Forex
Crypto
Stocks
You can also enter manual costs to better match your broker or exchange.
This is important because a strategy that makes tiny profits on each trade can be heavily affected by transaction costs.

🌪️ What About Choppy Markets?
The indicator also includes an optional ATR Choppiness Filter.
When enabled, the system can ignore signals occurring during low-volatility, choppy conditions.
Why does this matter?
Because some strategies work beautifully when the market is moving strongly but produce a long series of weak signals when price starts moving sideways.
A filter can help investigate whether the strategy performs better when certain market conditions are removed.

🧠 The Real Value: Testing the Idea, Not Just the Indicator
This is where I think beginners can get the most value from a tool like this.
Imagine you find an indicator online that claims:
“My Buy signals are extremely accurate.”
You don't have to simply believe it.
You can ask:
How many signals were generated?
What's the actual win rate?
What happens with a 1R target?
What happens with a 2R target?
What happens with a wider stop?
Does it still work after trading costs?
Does it work during every session?
Does performance remain consistent across different periods?
Those questions are much more useful than simply looking at a few winning examples.

🔬 A Simple Example
Suppose you're testing a 9/21 EMA crossover.
You could configure the backtester to:
Entry: 9 EMA crosses 21 EMA
Direction: Long + Short
TP: 1R / 2R / 3R
SL: Defined distance
Costs: Crypto profile
Then you can inspect the results.
Maybe the 1R target produces a high hit rate.
But perhaps the 3R target produces better overall expected profit.
Or maybe the strategy performs well during London and New York but struggles during quieter hours.
Now you have something useful:
Evidence to investigate.
Not just a nice-looking chart.

⚠️ Backtesting Doesn't Predict the Future
This is probably the most important lesson.
A backtest tells you:
“This is what happened under these historical conditions.”
It does not tell you:
“This will definitely happen next.”
Markets change.
Volatility changes.
Liquidity changes.
Fees change.
The behavior of traders changes.
A strategy that performed well historically can still fail in live markets.
So the purpose of a backtester shouldn't be to find a magical strategy with a perfect win rate.
It should be to stress-test your idea and understand its weaknesses.

🧠 The Bottom Line
The Universal Signal Backtester is essentially a testing laboratory for trading signals.
You can connect:
Moving-average crosses
External crossovers
Custom Buy/Sell signals
Then test them using different:
Take Profits
Stop Losses
Trading costs
Market conditions
Time periods
and trade directions.
The biggest advantage isn't finding a strategy that looks amazing.
It's discovering whether the strategy still makes sense after you remove the guesswork.
Before risking real money on a signal, ask yourself:
Have I actually tested it, or do I just like the way it looks on the chart?
That one question can save a trader from a lot of unnecessary losses.
⚠️ This article is for educational purposes only and is not financial advice. Backtested performance does not guarantee future results. Always account for fees, slippage, market conditions and risk before trading real capital.
#trading #cryptotrading #Backtesting #TechnicalAnalysis #RiskManagement

·
--
Winner screenshots can make a weak strategy look unstoppable. ⚠️ That’s survivorship bias: studying trades that worked while ignoring the ones that failed. You see 10 clean breakout winners and think, “Breakouts are easy.” But what about the fakeouts, stopped-out retests, and breakouts that ran into higher-timeframe resistance? Reviewing only winners teaches the entry pattern—not its full risk. 🧠 A trader posting a long that broke resistance and rallied hard may be useful, but one winner doesn’t show: • How often the setup failed • How large losses were • Whether conditions were trending or choppy • Whether the same rules were followed every time Practical rule: collect every valid setup over a period—not just the pretty ones. Log winners, losers, breakevens, and missed trades using consistent entry and exit rules. Judge a strategy by the whole sample, not its best screenshots. 🎯 Study the losses—they often show where the real edge ends. Do you save losing setups for review, or only winners? 👇 #TradingPsychology #Backtesting #CryptoTrading #RiskManagement
Winner screenshots can make a weak strategy look unstoppable. ⚠️

That’s survivorship bias: studying trades that worked while ignoring the ones that failed.

You see 10 clean breakout winners and think, “Breakouts are easy.”

But what about the fakeouts, stopped-out retests, and breakouts that ran into higher-timeframe resistance?

Reviewing only winners teaches the entry pattern—not its full risk. 🧠

A trader posting a long that broke resistance and rallied hard may be useful, but one winner doesn’t show:
• How often the setup failed
• How large losses were
• Whether conditions were trending or choppy
• Whether the same rules were followed every time

Practical rule: collect every valid setup over a period—not just the pretty ones. Log winners, losers, breakevens, and missed trades using consistent entry and exit rules.

Judge a strategy by the whole sample, not its best screenshots. 🎯

Study the losses—they often show where the real edge ends.

Do you save losing setups for review, or only winners? 👇

#TradingPsychology #Backtesting #CryptoTrading #RiskManagement
#Backtesting your trading strategies – do you do it? How accurate do you find backtesting results? Does it improve your live strategy performance? What tools do you use for backtesting? Biggest limitation you’ve faced with it? Comment or suggest me..👍
#Backtesting your trading strategies – do you do it?
How accurate do you find backtesting results?
Does it improve your live strategy performance?
What tools do you use for backtesting?
Biggest limitation you’ve faced with it?
Comment or suggest me..👍
yes,always
50%
sometimes
22%
Rarely
7%
Never
21%
14 votes • Voting closed

I had another #Breakeven en $XRP The price reacted at my entry point, it reached #ROI +30% but it didn’t reach my target of #ROI +60% For me, this is not bad news; I’m still in an #Backtesting process. My entries were correct! I just need to fine-tune my take-profit point better... Maybe for next time I’ll try with a larger entry or with a bit more leverage. #BreakEvenIsProfit
I had another #Breakeven en $XRP
The price reacted at my entry point, it reached #ROI +30% but it didn’t reach my target of #ROI +60%

For me, this is not bad news; I’m still in an #Backtesting process.

My entries were correct! I just need to fine-tune my take-profit point better...

Maybe for next time I’ll try with a larger entry or with a bit more leverage.

#BreakEvenIsProfit
UNLOCK REAL CONSISTENCY BY BACKTESTING $BTC CHARTS BEFORE EXECUTING TRADES 💡 💥 Passive reading builds zero edge when market momentum shifts faster than scrollers can react. 📊 Real technical mastery comes from opening a clean $BTC or altcoin structure and backtesting every setup across multiple market cycles until execution becomes second nature. 💡 Consistent profitability is never gifted to spectators—it is forged by traders who build, test, and master their own personal trading style. Stop observing from the sidelines and start applying these insights directly to live price action. 💬 Which technical setup on your charts has delivered your highest win-rate this month? 👇 ⚠️ Not financial advice. Always manage your risk. 🛡️ 🏷️ #BTC #TradingStrategy #TechnicalAnalysis #Backtesting #Crypto 💎 ⚡
UNLOCK REAL CONSISTENCY BY BACKTESTING $BTC CHARTS BEFORE EXECUTING TRADES 💡 💥

Passive reading builds zero edge when market momentum shifts faster than scrollers can react. 📊 Real technical mastery comes from opening a clean $BTC or altcoin structure and backtesting every setup across multiple market cycles until execution becomes second nature.

💡 Consistent profitability is never gifted to spectators—it is forged by traders who build, test, and master their own personal trading style. Stop observing from the sidelines and start applying these insights directly to live price action. 💬 Which technical setup on your charts has delivered your highest win-rate this month? 👇

⚠️ Not financial advice. Always manage your risk. 🛡️

🏷️ #BTC #TradingStrategy #TechnicalAnalysis #Backtesting #Crypto

💎 ⚡
Article
📊100 Trades Project — Breakdown Backtest | Case #003 $BRU/USDT ( Success )BRU/USDT — Counter-Trend Short in a Bull Market For Case #003 of my 100-Trades Project, I backtested a Breakdown Short setup on BRU. This trade is especially interesting because I was looking for a short opportunity while the broader market was still bullish. 📖 The Candle Story BRU started with a strong pump: 0.20 → 0.349 After the pump, price entered a consolidation zone between approximately 0.32 and 0.30. Then the important move happened: 🔻 Price broke down through 0.28 Instead of entering immediately on the breakdown, I waited for confirmation. Price retested the 0.30 area, but the retest failed. After that rejection, price dropped toward 0.26. Then price tested the 0.28 breakdown area again. This time, price failed to reclaim 0.28 and continued to hold around 0.26. That created my short setup. 🎯 Trade Plan Short Entry: 0.26 Stop Loss: 0.30 Take Profit: 0.20 Risk: 0.04 Potential Reward: 0.06 ➡️ Risk/Reward = 1 : 1.5 🧠 Why I Took the Short My thesis was not simply: “Price broke down, so I short.” The setup was based on a sequence: Pump → Consolidation → Breakdown → Retest → Retest Failure → Lower Low → Failed Reclaim → Short The most important confirmation for me was the failure to reclaim the 0.28 breakdown level after price had already rejected from 0.30. ⚠️ The Biggest Risk This is a counter-trend short. The price had previously pumped from 0.20 to 0.349, meaning bullish pressure could still be present. Therefore, I cannot automatically consider the breakdown a complete trend reversal. The short thesis is better described as: «A bearish correction setup inside a bullish market, rather than a confirmed full trend reversal.» If price reclaims 0.30, my bearish thesis is invalidated. 📚 What I Learned From Case #003 1. Breakdown alone is not enough. A breakdown becomes stronger when followed by a failed retest. 2. Retest failure gives better confirmation. Waiting for the market to reject the broken level can reduce the risk of entering directly into a fake breakdown. 3. Failed reclaim is important. The inability to reclaim 0.28 after the breakdown strengthened my short thesis. 4. Counter-trend trades require extra caution. Even when the LTF structure looks bearish, the broader bullish trend can still produce a strong recovery pump. 5. A logical SL is more important than a random SL. I placed the invalidation at 0.30 because reclaiming that area would weaken the entire breakdown thesis. ⭐ Backtest Score Case #003 Setup Quality: 8/10 Breakdown Confirmation: 9/10 Retest & Rejection: 9/10 Entry Quality: 7/10 SL Placement: 9/10 RR: 7/10 Counter-Trend Risk: 6/10 🔥 Final Thought Case #003 is not about whether this short wins or loses. The real purpose of my 100-Trades Project is to collect enough trades to discover whether this specific Breakdown model has a real statistical edge. I am testing one setup, documenting the story, following predefined Entry/SL/TP rules, and recording the lesson from every result. Case #003 — BRU Breakdown Short Entry: 0.26 SL: 0.30 TP: 0.20 RR: 1:1.5 Let's see what the market teaches me next. 📈📉 #100TradesProject #TradingJournal #Backtesting #Breakdown #cryptotrading $BTC $ZEC $BR

📊100 Trades Project — Breakdown Backtest | Case #003 $BRU/USDT ( Success )

BRU/USDT — Counter-Trend Short in a Bull Market
For Case #003 of my 100-Trades Project, I backtested a Breakdown Short setup on BRU.
This trade is especially interesting because I was looking for a short opportunity while the broader market was still bullish.
📖 The Candle Story
BRU started with a strong pump:
0.20 → 0.349
After the pump, price entered a consolidation zone between approximately 0.32 and 0.30.
Then the important move happened:
🔻 Price broke down through 0.28
Instead of entering immediately on the breakdown, I waited for confirmation.
Price retested the 0.30 area, but the retest failed.
After that rejection, price dropped toward 0.26.
Then price tested the 0.28 breakdown area again.
This time, price failed to reclaim 0.28 and continued to hold around 0.26.
That created my short setup.
🎯 Trade Plan
Short Entry: 0.26
Stop Loss: 0.30
Take Profit: 0.20
Risk: 0.04
Potential Reward: 0.06
➡️ Risk/Reward = 1 : 1.5
🧠 Why I Took the Short
My thesis was not simply:
“Price broke down, so I short.”
The setup was based on a sequence:
Pump → Consolidation → Breakdown → Retest → Retest Failure → Lower Low → Failed Reclaim → Short
The most important confirmation for me was the failure to reclaim the 0.28 breakdown level after price had already rejected from 0.30.
⚠️ The Biggest Risk
This is a counter-trend short.
The price had previously pumped from 0.20 to 0.349, meaning bullish pressure could still be present.
Therefore, I cannot automatically consider the breakdown a complete trend reversal.
The short thesis is better described as:
«A bearish correction setup inside a bullish market, rather than a confirmed full trend reversal.»
If price reclaims 0.30, my bearish thesis is invalidated.
📚 What I Learned From Case #003
1. Breakdown alone is not enough.
A breakdown becomes stronger when followed by a failed retest.
2. Retest failure gives better confirmation.
Waiting for the market to reject the broken level can reduce the risk of entering directly into a fake breakdown.
3. Failed reclaim is important.
The inability to reclaim 0.28 after the breakdown strengthened my short thesis.
4. Counter-trend trades require extra caution.
Even when the LTF structure looks bearish, the broader bullish trend can still produce a strong recovery pump.
5. A logical SL is more important than a random SL.
I placed the invalidation at 0.30 because reclaiming that area would weaken the entire breakdown thesis.
⭐ Backtest Score
Case #003 Setup Quality: 8/10
Breakdown Confirmation: 9/10
Retest & Rejection: 9/10
Entry Quality: 7/10
SL Placement: 9/10
RR: 7/10
Counter-Trend Risk: 6/10
🔥 Final Thought
Case #003 is not about whether this short wins or loses.
The real purpose of my 100-Trades Project is to collect enough trades to discover whether this specific Breakdown model has a real statistical edge.
I am testing one setup, documenting the story, following predefined Entry/SL/TP rules, and recording the lesson from every result.
Case #003 — BRU Breakdown Short
Entry: 0.26
SL: 0.30
TP: 0.20
RR: 1:1.5
Let's see what the market teaches me next. 📈📉
#100TradesProject
#TradingJournal #Backtesting #Breakdown #cryptotrading
$BTC
$ZEC
$BR
Log in to explore more content
Join global crypto users on Binance Square
⚡️ Get latest and useful information about crypto.
💬 Trusted by the world’s largest crypto exchange.
👍 Discover real insights from verified creators.
Email / Phone number