

#technicalanalysise
technicalanalysise
4,608 views
24 Discussing
Hot
Latest

·
--
Bullish
📊 $ETC
Relief Bounce in Play?
After printing a local base around the 7.06–7.07 zone, $ETC is showing signs of life on the 1-hour chart, printing consecutive green candles and pushing back toward 7.13.
Support: 7.12 – 7.13 USDT
Immediate Resistance: 7.137 – 7.141 USDT order book wall
Target Zone: Eyes on a potential run back to 7.20 – 7.25 $USDT if buyers chew through current overhead supply.
Are you catching this bounce or waiting for a cleaner breakout? Let me know your levels below! 👇
#ETC #CryptoTrading #BinanceSquare #TechnicalAnalysise
{spot}(ETCUSDT)
📊 $ETC
Relief Bounce in Play?
After printing a local base around the 7.06–7.07 zone, $ETC is showing signs of life on the 1-hour chart, printing consecutive green candles and pushing back toward 7.13.
Support: 7.12 – 7.13 USDT
Immediate Resistance: 7.137 – 7.141 USDT order book wall
Target Zone: Eyes on a potential run back to 7.20 – 7.25 $USDT if buyers chew through current overhead supply.
Are you catching this bounce or waiting for a cleaner breakout? Let me know your levels below! 👇
#ETC #CryptoTrading #BinanceSquare #TechnicalAnalysise
Relief Bounce in Play?
After printing a local base around the 7.06–7.07 zone, $ETC is showing signs of life on the 1-hour chart, printing consecutive green candles and pushing back toward 7.13.
Support: 7.12 – 7.13 USDT
Immediate Resistance: 7.137 – 7.141 USDT order book wall
Target Zone: Eyes on a potential run back to 7.20 – 7.25 $USDT if buyers chew through current overhead supply.
Are you catching this bounce or waiting for a cleaner breakout? Let me know your levels below! 👇
#ETC #CryptoTrading #BinanceSquare #TechnicalAnalysise
124

·
--
$BTCUSDT — Bearish Continuation Setup | Futures Analysis
Bitcoin is showing bearish momentum after losing ground near the $80,000 psychological resistance. Sellers remain in control while BTC trades below the $79,000–$80,000 recovery zone.
A relief bounce into resistance could offer a realistic short opportunity, but chasing the current decline is not recommended.
EP: $79,000–$79,500
TP1: $78,000
TP2: $77,500
TP3: $76,800
SL: $80,000
The $78,000 area is an important nearby liquidity zone. A confirmed rejection near entry would support the bearish structure, while a sustained move above $80,000 would invalidate this setup. Wait for a pullback and seller confirmation before entering.
#BTC #Bitcoin #FuturesTrading #TechnicalAnalysise #HeYiSaysWithdrawalsExpectedtoResumeWithin42Hours $BTC
{future}(BTCUSDT)
$BTCUSDT — Bearish Continuation Setup | Futures Analysis
Bitcoin is showing bearish momentum after losing ground near the $80,000 psychological resistance. Sellers remain in control while BTC trades below the $79,000–$80,000 recovery zone.
A relief bounce into resistance could offer a realistic short opportunity, but chasing the current decline is not recommended.
EP: $79,000–$79,500
TP1: $78,000
TP2: $77,500
TP3: $76,800
SL: $80,000
The $78,000 area is an important nearby liquidity zone. A confirmed rejection near entry would support the bearish structure, while a sustained move above $80,000 would invalidate this setup. Wait for a pullback and seller confirmation before entering.
#BTC #Bitcoin #FuturesTrading #TechnicalAnalysise #HeYiSaysWithdrawalsExpectedtoResumeWithin42Hours $BTC
Bitcoin is showing bearish momentum after losing ground near the $80,000 psychological resistance. Sellers remain in control while BTC trades below the $79,000–$80,000 recovery zone.
A relief bounce into resistance could offer a realistic short opportunity, but chasing the current decline is not recommended.
EP: $79,000–$79,500
TP1: $78,000
TP2: $77,500
TP3: $76,800
SL: $80,000
The $78,000 area is an important nearby liquidity zone. A confirmed rejection near entry would support the bearish structure, while a sustained move above $80,000 would invalidate this setup. Wait for a pullback and seller confirmation before entering.
#BTC #Bitcoin #FuturesTrading #TechnicalAnalysise #HeYiSaysWithdrawalsExpectedtoResumeWithin42Hours $BTC
20

·
--
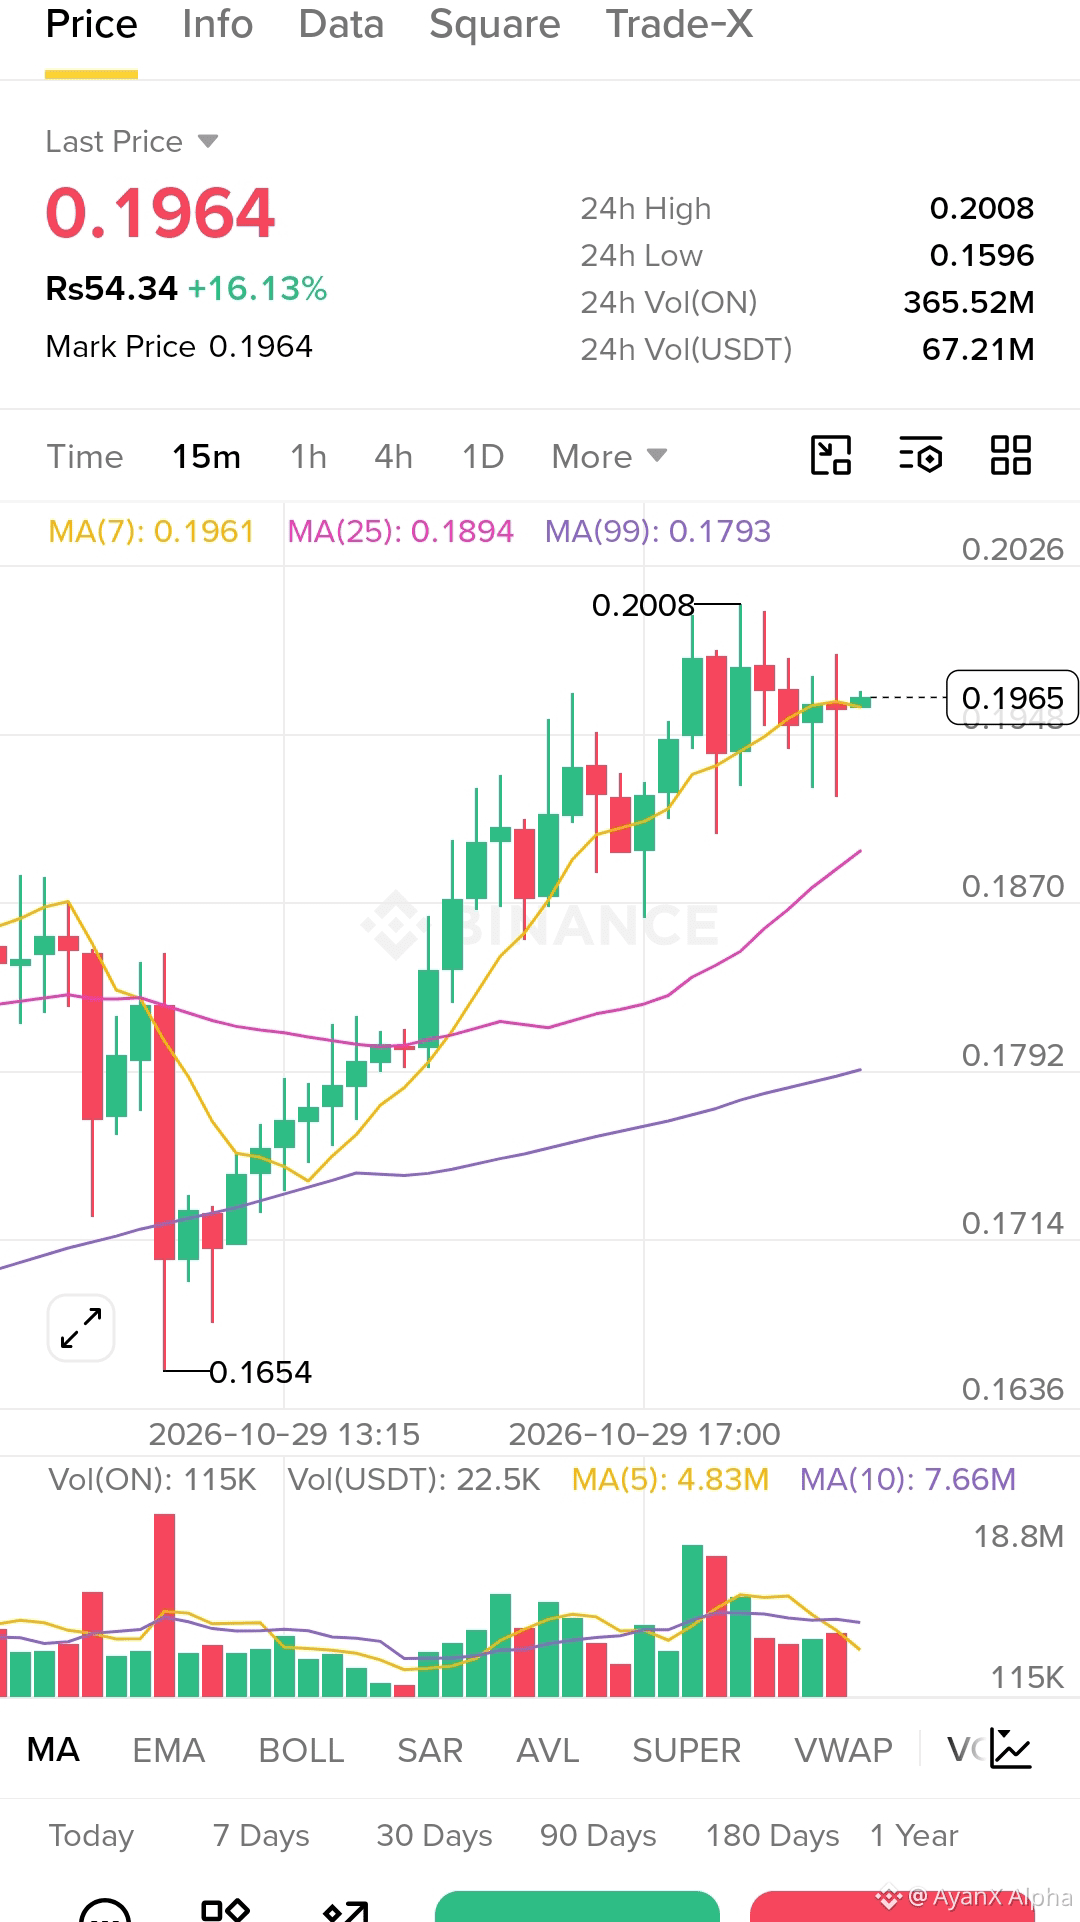
🚨 **$ON: BULLISH REVERSAL OR ANOTHER FAKEOUT? 📈**
$ON
{future}(ONUSDT)
$ON has shown strong volatility, and traders are watching for a potential breakout.
🎯 **Key Levels to Watch**
🟢 Entry zone: $0.1940–$0.1970 *(reclaim required)*
🎯 TP1: $0.2120
🎯 TP2: $0.2360
🚀 Final target: $0.2500
🛑 Stop-loss: $0.1700
**What confirms the setup?**
• A strong candle close above $0.2120
• Rising buying volume
• Successful breakout retest
⚠️ Don't chase the pump. Wait for confirmation and manage leverage carefully. 10x leverage can liquidate your position quickly.
👀 Can $ON reach $0.2500, or will sellers reject the breakout?
Follow **AyanX Alpha** for more crypto setups.
#ON #ONUSDT #CryptoTrading. #Altcoins #TechnicalAnalysise #AyanXAlpha
🚨 **$ON : BULLISH REVERSAL OR ANOTHER FAKEOUT? 📈**
$ON
$ON has shown strong volatility, and traders are watching for a potential breakout.
🎯 **Key Levels to Watch**
🟢 Entry zone: $0.1940–$0.1970 *(reclaim required)*
🎯 TP1: $0.2120
🎯 TP2: $0.2360
🚀 Final target: $0.2500
🛑 Stop-loss: $0.1700
**What confirms the setup?**
• A strong candle close above $0.2120
• Rising buying volume
• Successful breakout retest
⚠️ Don't chase the pump. Wait for confirmation and manage leverage carefully. 10x leverage can liquidate your position quickly.
👀 Can $ON reach $0.2500, or will sellers reject the breakout?
Follow **AyanX Alpha** for more crypto setups.
#ON #ONUSDT #CryptoTrading. #Altcoins #TechnicalAnalysise #AyanXAlpha
$ON
$ON has shown strong volatility, and traders are watching for a potential breakout.
🎯 **Key Levels to Watch**
🟢 Entry zone: $0.1940–$0.1970 *(reclaim required)*
🎯 TP1: $0.2120
🎯 TP2: $0.2360
🚀 Final target: $0.2500
🛑 Stop-loss: $0.1700
**What confirms the setup?**
• A strong candle close above $0.2120
• Rising buying volume
• Successful breakout retest
⚠️ Don't chase the pump. Wait for confirmation and manage leverage carefully. 10x leverage can liquidate your position quickly.
👀 Can $ON reach $0.2500, or will sellers reject the breakout?
Follow **AyanX Alpha** for more crypto setups.
#ON #ONUSDT #CryptoTrading. #Altcoins #TechnicalAnalysise #AyanXAlpha
291

·
--
Bearish
$BTC
{spot}(BTCUSDT)
#BTC scalping
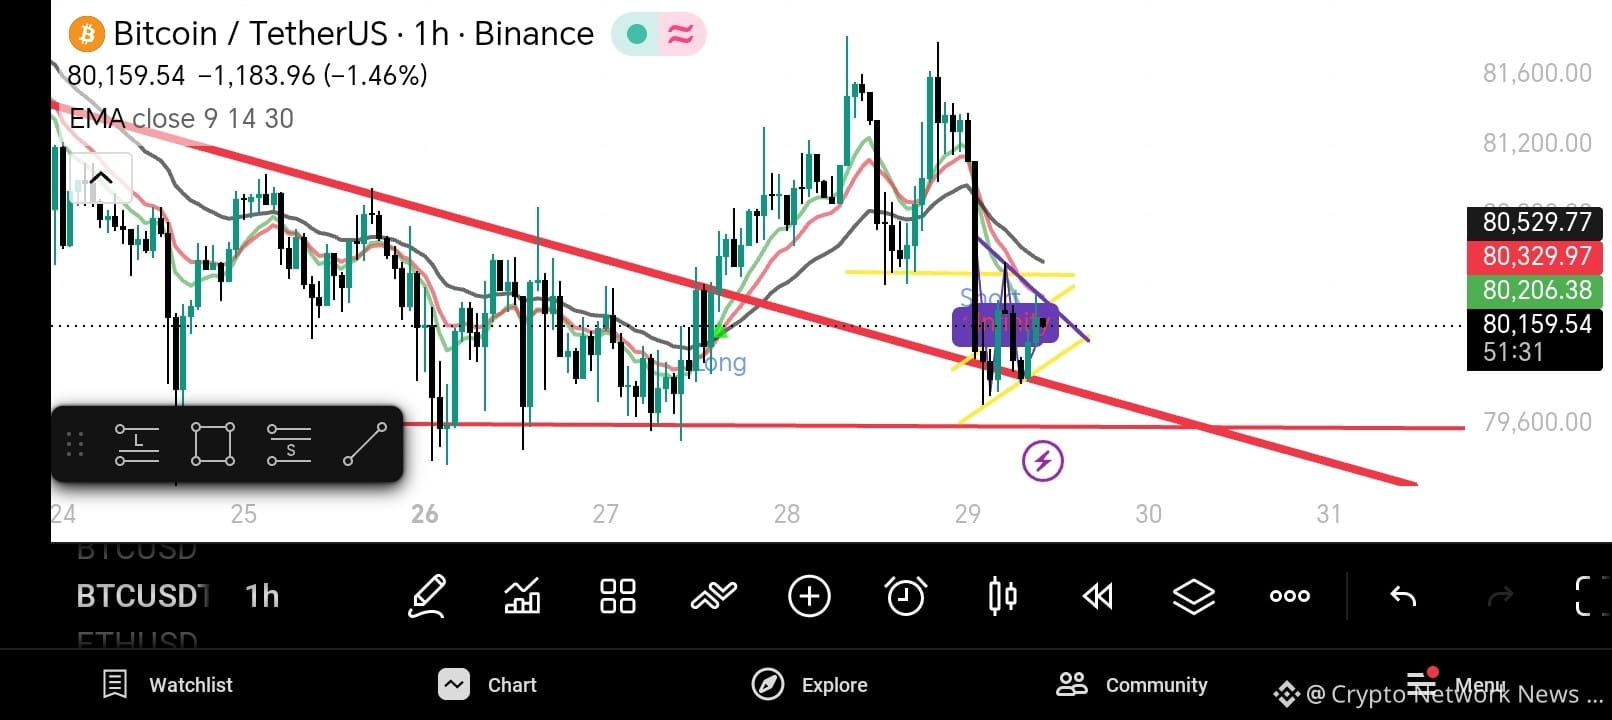
🚀 BTC Consolidation: Breakout or Retest Next? 📊
Bitcoin ($80,215) is compressing at a critical pivot zone. After facing rejection at the $84.5K–$85K ceiling, the market is locked in a tight tug-of-war.
⚡ The Technical Landscape
• Bull Target: A daily close above $80,900 opens the doors to $81,600 and $83,650.
• Bear Risk: Dropping below $79,400 support risks a cascading slide to $78,600 or the macro floor at $75.5K.
🔥 Core Fundamentals & High Volumes
• Leverage Building: A massive 10% surge in Derivatives Open Interest indicates heavy leveraged capital primed for a violent directional breakout.
• Institutional Backing: On-chain data shows steady spot ETF absorption and climbing network hash rates, keeping long-term structural demand incredibly strong.
• Macro Headwinds: Rising U.S. Treasury yields are acting as a temporary drag, cooling off immediate aggressive spot buying.
🔮 The Verdict: Keep a close eye on the $79.4K support and $80.9K resistance. Volume is building, and the next expansion move will be sharp.
#Bitcoin #BTC #CryptoAnalysis #BinanceSquare #TechnicalAnalysise
$BTC
#BTC scalping
🚀 BTC Consolidation: Breakout or Retest Next? 📊
Bitcoin ($80,215) is compressing at a critical pivot zone. After facing rejection at the $84.5K–$85K ceiling, the market is locked in a tight tug-of-war.
⚡ The Technical Landscape
• Bull Target: A daily close above $80,900 opens the doors to $81,600 and $83,650.
• Bear Risk: Dropping below $79,400 support risks a cascading slide to $78,600 or the macro floor at $75.5K.
🔥 Core Fundamentals & High Volumes
• Leverage Building: A massive 10% surge in Derivatives Open Interest indicates heavy leveraged capital primed for a violent directional breakout.
• Institutional Backing: On-chain data shows steady spot ETF absorption and climbing network hash rates, keeping long-term structural demand incredibly strong.
• Macro Headwinds: Rising U.S. Treasury yields are acting as a temporary drag, cooling off immediate aggressive spot buying.
🔮 The Verdict: Keep a close eye on the $79.4K support and $80.9K resistance. Volume is building, and the next expansion move will be sharp.
#Bitcoin #BTC #CryptoAnalysis #BinanceSquare #TechnicalAnalysise
#BTC scalping
🚀 BTC Consolidation: Breakout or Retest Next? 📊
Bitcoin ($80,215) is compressing at a critical pivot zone. After facing rejection at the $84.5K–$85K ceiling, the market is locked in a tight tug-of-war.
⚡ The Technical Landscape
• Bull Target: A daily close above $80,900 opens the doors to $81,600 and $83,650.
• Bear Risk: Dropping below $79,400 support risks a cascading slide to $78,600 or the macro floor at $75.5K.
🔥 Core Fundamentals & High Volumes
• Leverage Building: A massive 10% surge in Derivatives Open Interest indicates heavy leveraged capital primed for a violent directional breakout.
• Institutional Backing: On-chain data shows steady spot ETF absorption and climbing network hash rates, keeping long-term structural demand incredibly strong.
• Macro Headwinds: Rising U.S. Treasury yields are acting as a temporary drag, cooling off immediate aggressive spot buying.
🔮 The Verdict: Keep a close eye on the $79.4K support and $80.9K resistance. Volume is building, and the next expansion move will be sharp.
#Bitcoin #BTC #CryptoAnalysis #BinanceSquare #TechnicalAnalysise
1
2
119

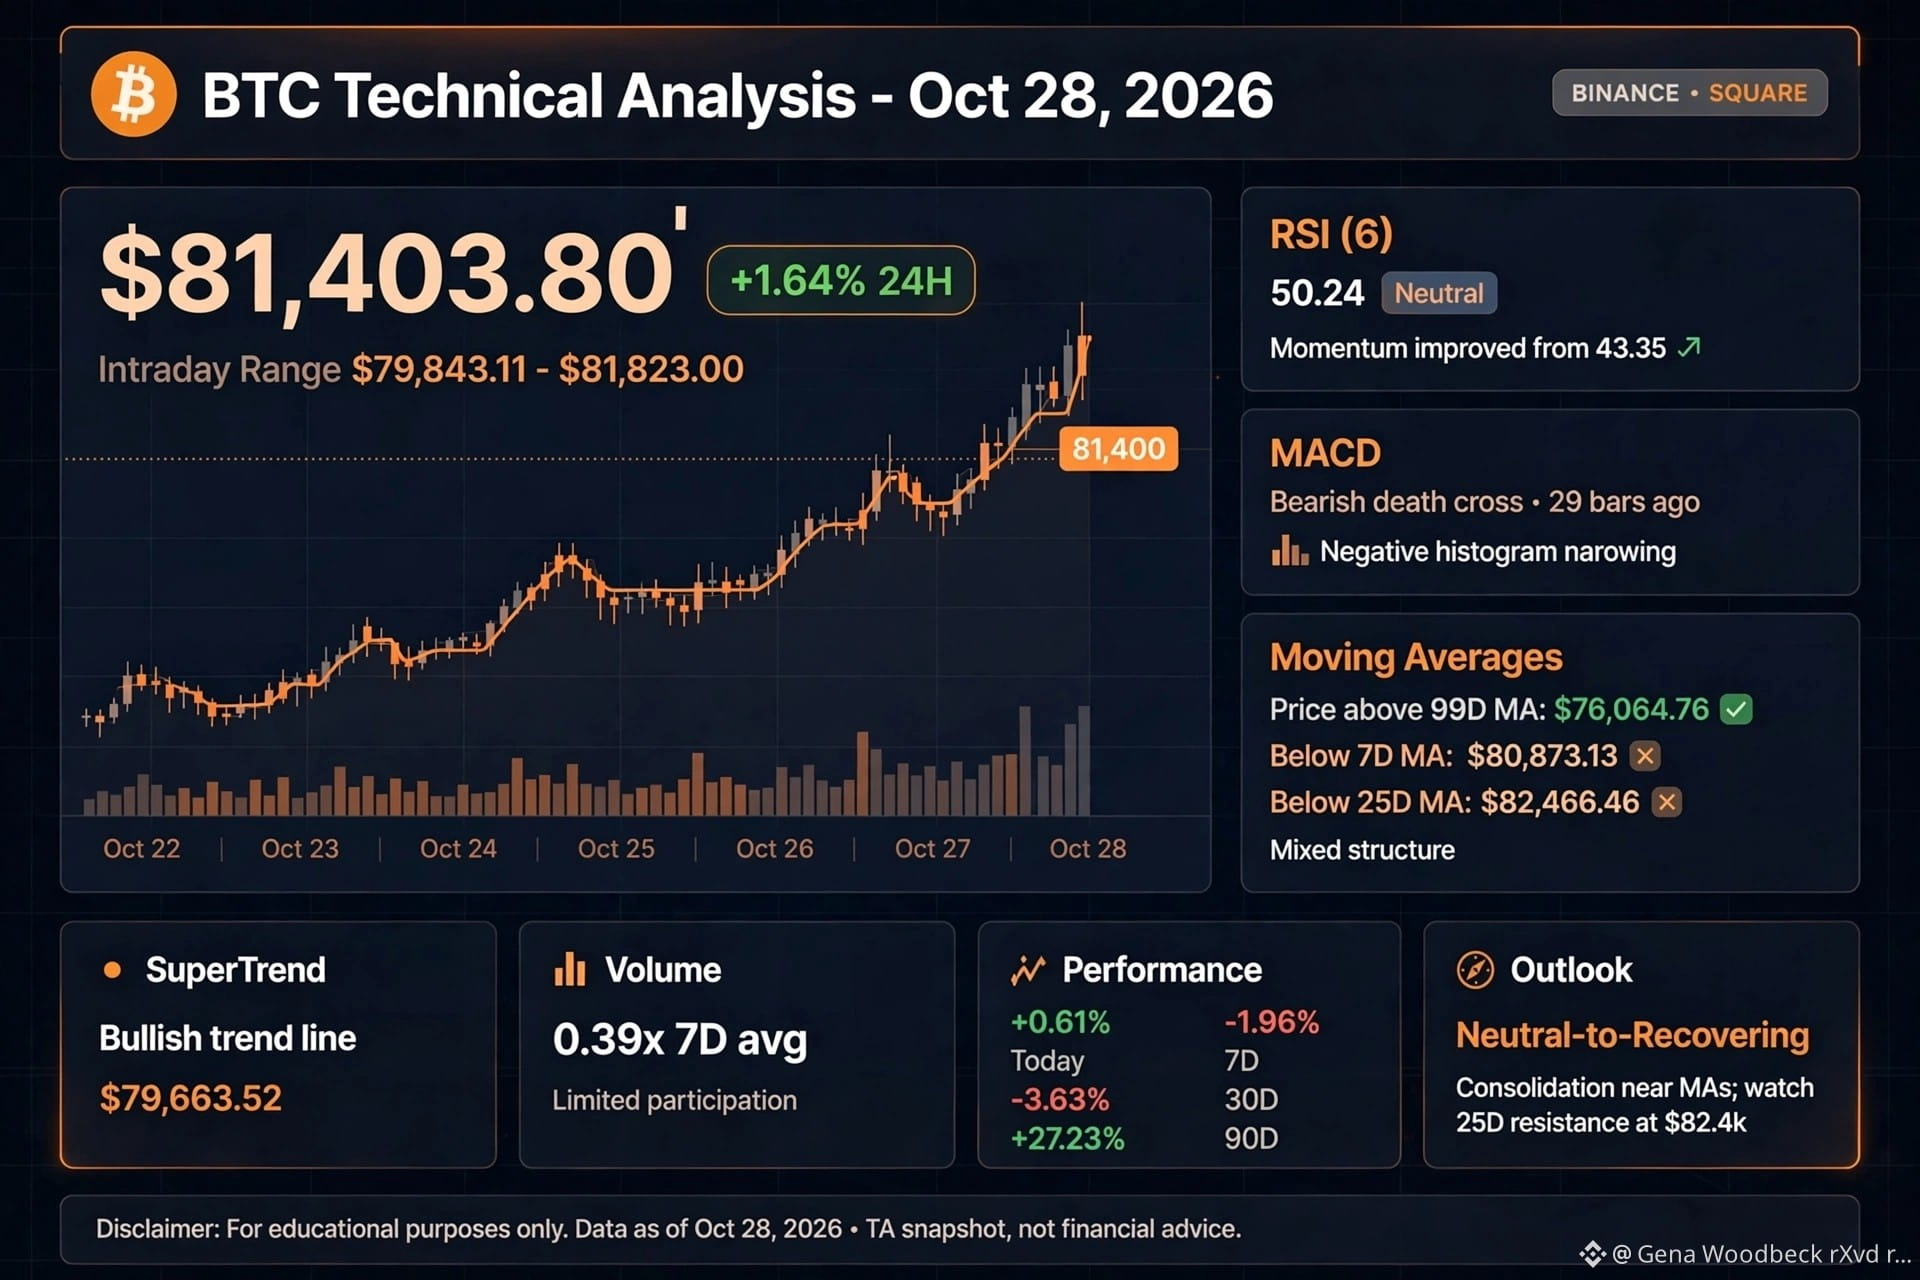
BTC Technical Analysis - Oct 28, 2026 | $81,403.80 (+1.64%)
As of 2026-10-28: BTC trading at $81,403.80, intraday $79,843.11–$81,823.00.
RSI(6): 50.24 — Neutral. Momentum improved from 43.35, not overbought.
MACD: Bearish, death cross 29 bars ago. Negative histogram narrowing — downside momentum easing but not yet positive.
MAs: Price above 99D MA ($76,064.76) but below 7D ($80,873.13) and 25D ($82,466.46). Mixed structure: longer-term support intact, short-term recovery being tested.
SuperTrend: Bullish, trend line $79,663.52.
Volume: 0.39x 7D avg — rebound has limited participation.
Performance: +0.61% Today, -1.96% 7D, -3.63% 30D, +27.23% 90D.
Outlook: Neutral-to-recovering, not decisively bullish. Need stronger volume for confirmation. Hold above $79,663.52 SuperTrend support key; break below increases downside pressure. Watch $82,466 25D MA as resistance.
Not financial advice. DYOR.
#BTC #Bitcoin #TechnicalAnalysise #writetoearn #writetoernBinance #write2earnonbinancesquare #BTC🔥🔥🔥🔥🔥 $BTC $BTC
{spot}(BTCUSDT)
BTC Technical Analysis - Oct 28, 2026 | $81,403.80 (+1.64%)
As of 2026-10-28: BTC trading at $81,403.80, intraday $79,843.11–$81,823.00.
RSI(6): 50.24 — Neutral. Momentum improved from 43.35, not overbought.
MACD: Bearish, death cross 29 bars ago. Negative histogram narrowing — downside momentum easing but not yet positive.
MAs: Price above 99D MA ($76,064.76) but below 7D ($80,873.13) and 25D ($82,466.46). Mixed structure: longer-term support intact, short-term recovery being tested.
SuperTrend: Bullish, trend line $79,663.52.
Volume: 0.39x 7D avg — rebound has limited participation.
Performance: +0.61% Today, -1.96% 7D, -3.63% 30D, +27.23% 90D.
Outlook: Neutral-to-recovering, not decisively bullish. Need stronger volume for confirmation. Hold above $79,663.52 SuperTrend support key; break below increases downside pressure. Watch $82,466 25D MA as resistance.
Not financial advice. DYOR.
#BTC #Bitcoin #TechnicalAnalysise #writetoearn #writetoernBinance #write2earnonbinancesquare #BTC🔥🔥🔥🔥🔥 $BTC $BTC
As of 2026-10-28: BTC trading at $81,403.80, intraday $79,843.11–$81,823.00.
RSI(6): 50.24 — Neutral. Momentum improved from 43.35, not overbought.
MACD: Bearish, death cross 29 bars ago. Negative histogram narrowing — downside momentum easing but not yet positive.
MAs: Price above 99D MA ($76,064.76) but below 7D ($80,873.13) and 25D ($82,466.46). Mixed structure: longer-term support intact, short-term recovery being tested.
SuperTrend: Bullish, trend line $79,663.52.
Volume: 0.39x 7D avg — rebound has limited participation.
Performance: +0.61% Today, -1.96% 7D, -3.63% 30D, +27.23% 90D.
Outlook: Neutral-to-recovering, not decisively bullish. Need stronger volume for confirmation. Hold above $79,663.52 SuperTrend support key; break below increases downside pressure. Watch $82,466 25D MA as resistance.
Not financial advice. DYOR.
#BTC #Bitcoin #TechnicalAnalysise #writetoearn #writetoernBinance #write2earnonbinancesquare #BTC🔥🔥🔥🔥🔥 $BTC $BTC
64

·
--
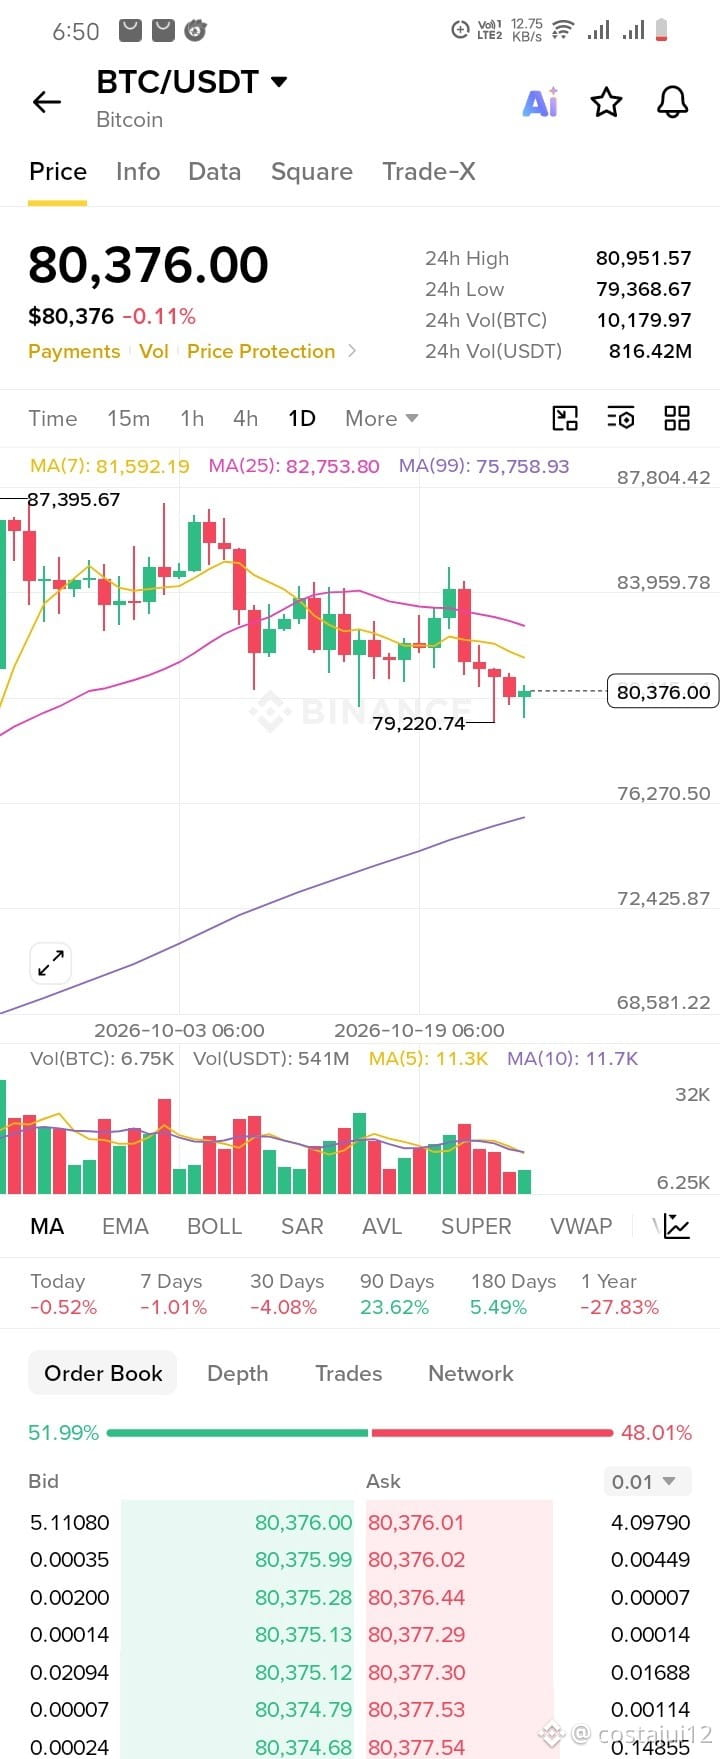
₿ BTC at $80,376: What's Happening at This Level?
Bitcoin is trading at $80,376 right now, down 0.11% in 24 hours. Let's break down the chart:
📊 Price Range (24h)
High: $80,951
Low: $79,368
Volume: about 10,180 BTC (≈ $816M)
📉 Trend Analysis
On the daily chart, price is below MA(7) at $81,592 and MA(25) at $82,753, which means there is significant short-term pressure.
However, price is well above MA(99) at $75,758, so the larger trend is still intact.
Recent support zone: around $79,200.
Resistance: $81,500 – $82,700 (the MA line area).
⏳ Performance
7 Days: -1.01%
30 Days: -4.08%
90 Days: +23.62%
1 Year: -27.83%
⚖️ Order Book
Bid 51.99% vs Ask 48.01%. Buyers have a slight edge, but the gap is very small, so the market is currently undecided.
🎯 My View
If price holds the $79,200 support, a rebound is possible. If it breaks, keep an eye on the next support level. Reclaiming MA(7) could bring momentum back.
⚠️ Disclaimer: This is not financial advice, just personal analysis. Always do your own research (DYOR) and follow proper risk management before trading.
What's your take on BTC's next move? 🐂 or 🐻? Let me know in the comments 👇
#BTC #bitcoin #BinanceSquare #TechnicalAnalysise #writetoearn
$BTC $USDT $BNB
{spot}(BTCUSDT)
{spot}(BNBUSDT)
{future}(USDCUSDT)
₿ BTC at $80,376: What's Happening at This Level?
Bitcoin is trading at $80,376 right now, down 0.11% in 24 hours. Let's break down the chart:
📊 Price Range (24h)
High: $80,951
Low: $79,368
Volume: about 10,180 BTC (≈ $816M)
📉 Trend Analysis
On the daily chart, price is below MA(7) at $81,592 and MA(25) at $82,753, which means there is significant short-term pressure.
However, price is well above MA(99) at $75,758, so the larger trend is still intact.
Recent support zone: around $79,200.
Resistance: $81,500 – $82,700 (the MA line area).
⏳ Performance
7 Days: -1.01%
30 Days: -4.08%
90 Days: +23.62%
1 Year: -27.83%
⚖️ Order Book
Bid 51.99% vs Ask 48.01%. Buyers have a slight edge, but the gap is very small, so the market is currently undecided.
🎯 My View
If price holds the $79,200 support, a rebound is possible. If it breaks, keep an eye on the next support level. Reclaiming MA(7) could bring momentum back.
⚠️ Disclaimer: This is not financial advice, just personal analysis. Always do your own research (DYOR) and follow proper risk management before trading.
What's your take on BTC's next move? 🐂 or 🐻? Let me know in the comments 👇
#BTC #bitcoin #BinanceSquare #TechnicalAnalysise #writetoearn
$BTC $USDT $BNB
Bitcoin is trading at $80,376 right now, down 0.11% in 24 hours. Let's break down the chart:
📊 Price Range (24h)
High: $80,951
Low: $79,368
Volume: about 10,180 BTC (≈ $816M)
📉 Trend Analysis
On the daily chart, price is below MA(7) at $81,592 and MA(25) at $82,753, which means there is significant short-term pressure.
However, price is well above MA(99) at $75,758, so the larger trend is still intact.
Recent support zone: around $79,200.
Resistance: $81,500 – $82,700 (the MA line area).
⏳ Performance
7 Days: -1.01%
30 Days: -4.08%
90 Days: +23.62%
1 Year: -27.83%
⚖️ Order Book
Bid 51.99% vs Ask 48.01%. Buyers have a slight edge, but the gap is very small, so the market is currently undecided.
🎯 My View
If price holds the $79,200 support, a rebound is possible. If it breaks, keep an eye on the next support level. Reclaiming MA(7) could bring momentum back.
⚠️ Disclaimer: This is not financial advice, just personal analysis. Always do your own research (DYOR) and follow proper risk management before trading.
What's your take on BTC's next move? 🐂 or 🐻? Let me know in the comments 👇
#BTC #bitcoin #BinanceSquare #TechnicalAnalysise #writetoearn
$BTC $USDT $BNB
6
82
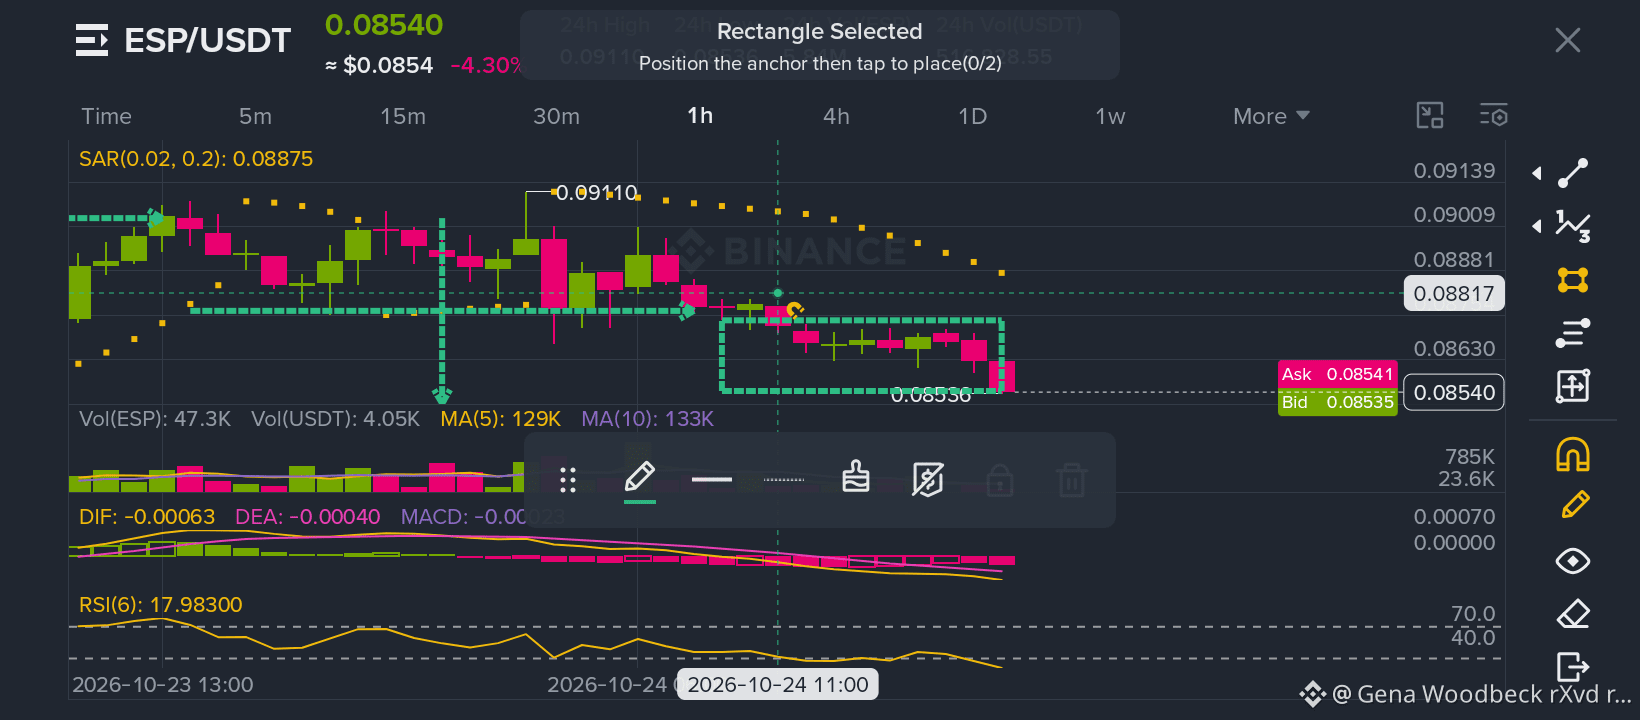
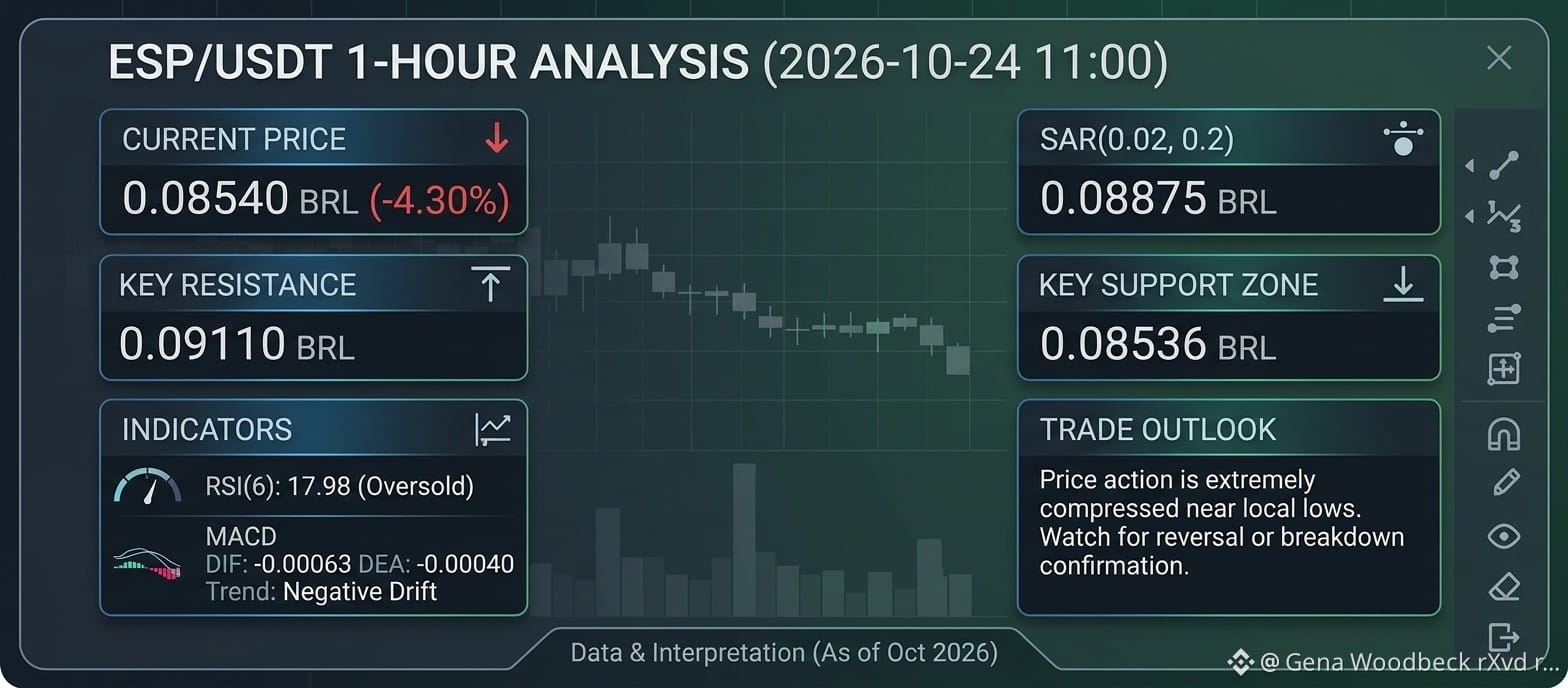
ESP/USDT 1-Hour Chart Update 📊 Price testing key support at 0.08536! RSI is highly oversold. Check out the clean technical indicators and market structure in the image below. 👇
#BinanceSquareTurkey #Write2Earn #ESPUSDT #CryptoTrading #TechnicalAnalysise #write2earnonbinancesquare #writetoearn #ESPUSDT $ESP
{spot}(ESPUSDT)
ESP/USDT 1-Hour Chart Update 📊 Price testing key support at 0.08536! RSI is highly oversold. Check out the clean technical indicators and market structure in the image below. 👇
#BinanceSquareTurkey #Write2Earn #ESPUSDT #CryptoTrading #TechnicalAnalysise #write2earnonbinancesquare #writetoearn #ESPUSDT $ESP
#BinanceSquareTurkey #Write2Earn #ESPUSDT #CryptoTrading #TechnicalAnalysise #write2earnonbinancesquare #writetoearn #ESPUSDT $ESP
97

·
--
📉 BINANCE TRADING | ETH/USDT
🐻 Plan Your Trade. Execute with Discipline.
Successful trading starts with a clear strategy and proper risk management.
📊 Trading Analysis:
- Trading Pair: ETH/USDT
- Direction: Short (Sell)
- Entry Price: 4,523 USDT
- Exit Price: 4,472 USDT
- Illustrative Profit: +1.13%
💡 Trading Tip: Never enter a trade based on emotions. Study price movements and establish your entry and exit levels before trading.
Trade with a plan, not with emotions.
#Binance #Ethereum #ETH #CryptoMarket #TradingStrategy #TechnicalAnalysise #FedWatch
📉 BINANCE TRADING | ETH/USDT
🐻 Plan Your Trade. Execute with Discipline.
Successful trading starts with a clear strategy and proper risk management.
📊 Trading Analysis:
- Trading Pair: ETH/USDT
- Direction: Short (Sell)
- Entry Price: 4,523 USDT
- Exit Price: 4,472 USDT
- Illustrative Profit: +1.13%
💡 Trading Tip: Never enter a trade based on emotions. Study price movements and establish your entry and exit levels before trading.
Trade with a plan, not with emotions.
#Binance #Ethereum #ETH #CryptoMarket #TradingStrategy #TechnicalAnalysise #FedWatch
🐻 Plan Your Trade. Execute with Discipline.
Successful trading starts with a clear strategy and proper risk management.
📊 Trading Analysis:
- Trading Pair: ETH/USDT
- Direction: Short (Sell)
- Entry Price: 4,523 USDT
- Exit Price: 4,472 USDT
- Illustrative Profit: +1.13%
💡 Trading Tip: Never enter a trade based on emotions. Study price movements and establish your entry and exit levels before trading.
Trade with a plan, not with emotions.
#Binance #Ethereum #ETH #CryptoMarket #TradingStrategy #TechnicalAnalysise #FedWatch
53

·
--
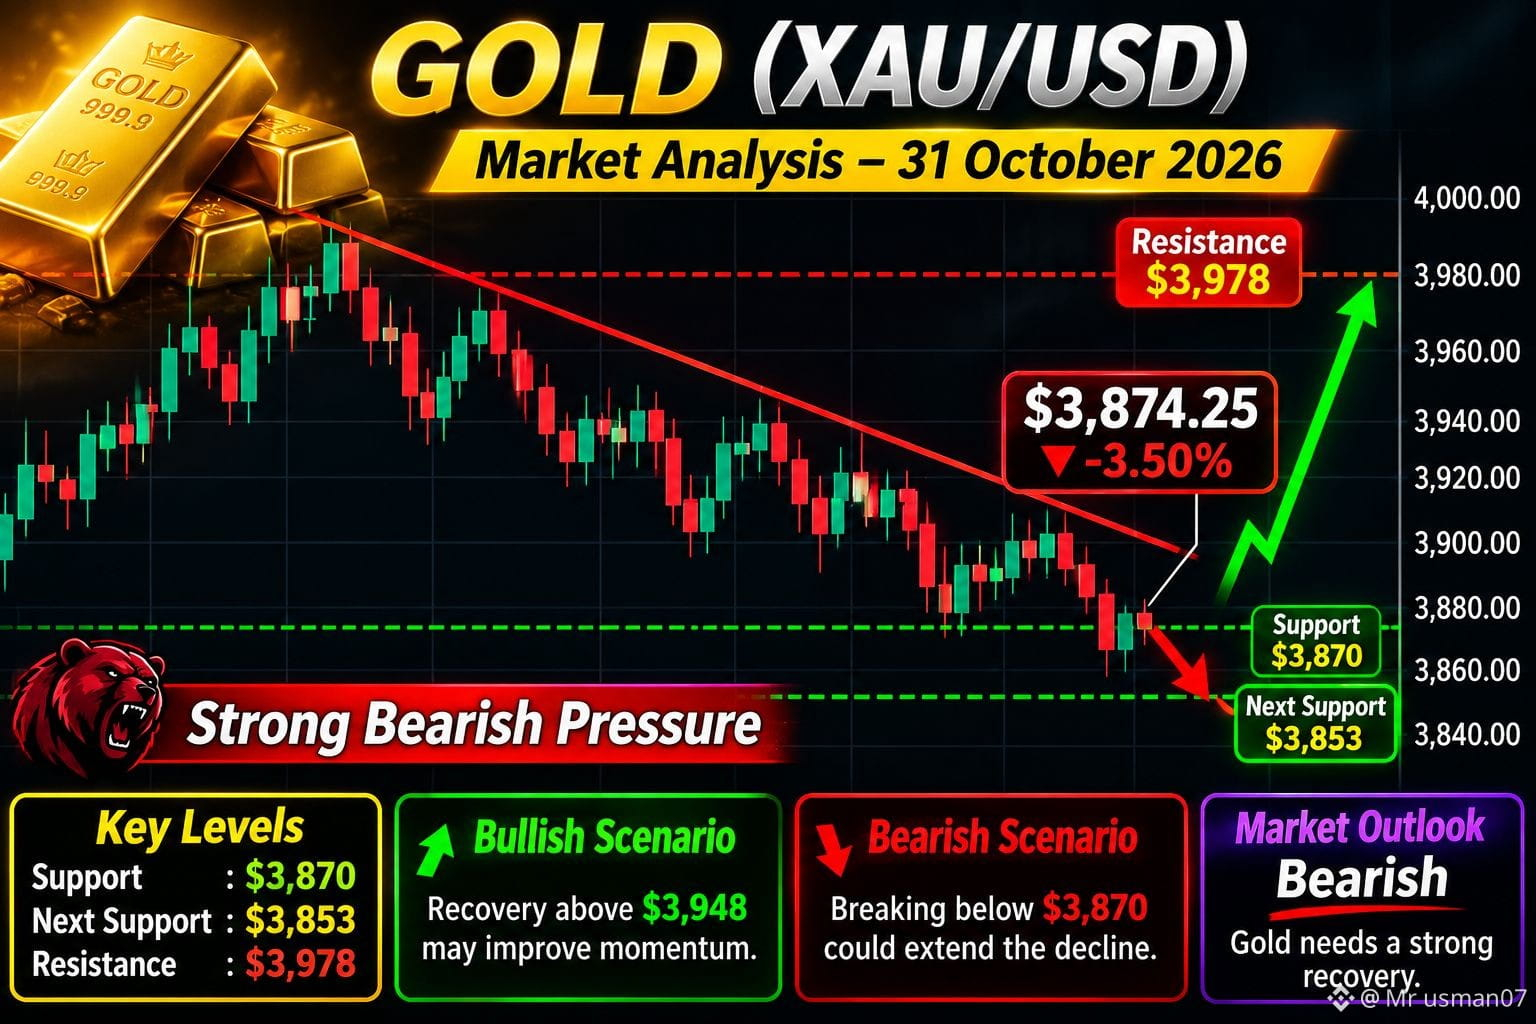
Gold is under bearish pressure.$XAU Watch the $3,870 support level closely. A breakdown could increase selling pressure.
$XAU #goldanalysis #ForexTradingCommunity #GoldMarkets #TechnicalAnalysise #CryptoNews #MarketAnalysis #blockchains
Gold is under bearish pressure.$XAU Watch the $3,870 support level closely. A breakdown could increase selling pressure.
$XAU #goldanalysis #ForexTradingCommunity #GoldMarkets #TechnicalAnalysise #CryptoNews #MarketAnalysis #blockchains
$XAU #goldanalysis #ForexTradingCommunity #GoldMarkets #TechnicalAnalysise #CryptoNews #MarketAnalysis #blockchains
204

·
--
$BNB – A Critical Moment for the Market.
$BNB remains one of the most influential assets in the cryptocurrency market, supported by its strong utility, extensive blockchain ecosystem, and growing on-chain activity. However, current market conditions are testing investor confidence and short-term price stability.
Recent developments surrounding Binance have triggered significant market volatility, putting additional selling pressure on $BNB. This makes the daily (1D) timeframe particularly important for identifying the next major market direction.
From a technical perspective, traders should closely monitor key support and resistance zones. A strong recovery above resistance, supported by increasing trading volume, could indicate renewed buying interest and open the door to a bullish reversal. On the other hand, continued weakness below support may extend bearish pressure and create further downside risks.
Beyond short-term price movements, BNB maintains important long-term fundamentals. Its role in transaction fees, staking, decentralized applications, and the wider BNB Chain ecosystem continues to provide real utility. Regular token burns also contribute to its long-term supply reduction mechanism.
Trading Outlook: The short-term bias remains cautious until buyers establish clear strength. Avoid emotional entries and wait for confirmation through volume and daily candle structure.
Final Verdict: BNB has strong ecosystem fundamentals, but market confidence and security developments will be critical drivers of its next major move. Patience and disciplined risk management are essential.
#bnb #TechnicalAnalysise #BNBChain #CryptoTradingPrediction #MarketOutlook
$BNB
{future}(BNBUSDT)
$BNB – A Critical Moment for the Market.
$BNB remains one of the most influential assets in the cryptocurrency market, supported by its strong utility, extensive blockchain ecosystem, and growing on-chain activity. However, current market conditions are testing investor confidence and short-term price stability.
Recent developments surrounding Binance have triggered significant market volatility, putting additional selling pressure on $BNB . This makes the daily (1D) timeframe particularly important for identifying the next major market direction.
From a technical perspective, traders should closely monitor key support and resistance zones. A strong recovery above resistance, supported by increasing trading volume, could indicate renewed buying interest and open the door to a bullish reversal. On the other hand, continued weakness below support may extend bearish pressure and create further downside risks.
Beyond short-term price movements, BNB maintains important long-term fundamentals. Its role in transaction fees, staking, decentralized applications, and the wider BNB Chain ecosystem continues to provide real utility. Regular token burns also contribute to its long-term supply reduction mechanism.
Trading Outlook: The short-term bias remains cautious until buyers establish clear strength. Avoid emotional entries and wait for confirmation through volume and daily candle structure.
Final Verdict: BNB has strong ecosystem fundamentals, but market confidence and security developments will be critical drivers of its next major move. Patience and disciplined risk management are essential.
#bnb #TechnicalAnalysise #BNBChain #CryptoTradingPrediction #MarketOutlook
$BNB
$BNB remains one of the most influential assets in the cryptocurrency market, supported by its strong utility, extensive blockchain ecosystem, and growing on-chain activity. However, current market conditions are testing investor confidence and short-term price stability.
Recent developments surrounding Binance have triggered significant market volatility, putting additional selling pressure on $BNB . This makes the daily (1D) timeframe particularly important for identifying the next major market direction.
From a technical perspective, traders should closely monitor key support and resistance zones. A strong recovery above resistance, supported by increasing trading volume, could indicate renewed buying interest and open the door to a bullish reversal. On the other hand, continued weakness below support may extend bearish pressure and create further downside risks.
Beyond short-term price movements, BNB maintains important long-term fundamentals. Its role in transaction fees, staking, decentralized applications, and the wider BNB Chain ecosystem continues to provide real utility. Regular token burns also contribute to its long-term supply reduction mechanism.
Trading Outlook: The short-term bias remains cautious until buyers establish clear strength. Avoid emotional entries and wait for confirmation through volume and daily candle structure.
Final Verdict: BNB has strong ecosystem fundamentals, but market confidence and security developments will be critical drivers of its next major move. Patience and disciplined risk management are essential.
#bnb #TechnicalAnalysise #BNBChain #CryptoTradingPrediction #MarketOutlook
$BNB
1
92

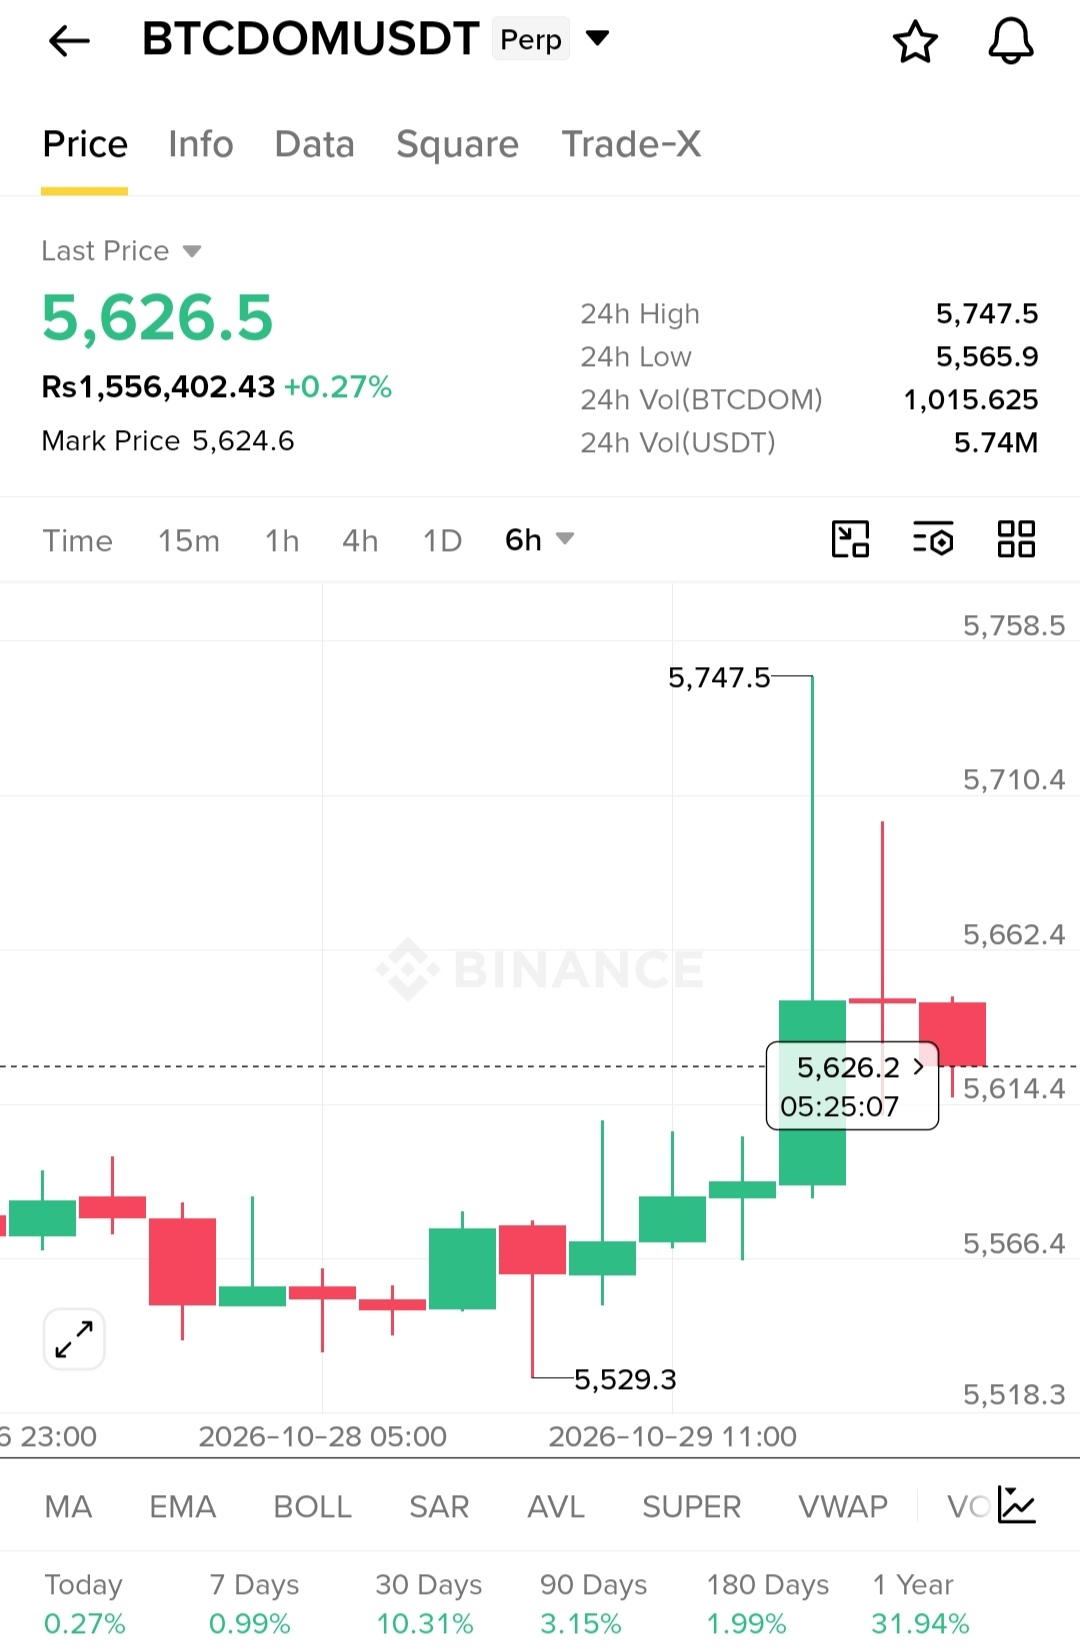
🚨 $BTCDOM SHORT SETUP — ENTRY IS LIVE! 🔴
Bitcoin Dominance is showing bearish momentum as sellers break below the previous candle’s low following a sustained upward move. The bearish trigger is confirmed, putting downside targets in focus.
📉 SHORT TRADE SETUP
🔻 Entry: 5,630.1
🛑 Stop Loss: 5,649.2
🎯 Take Profit Targets:
TP1: 5,601.4
TP2: 5,582.3
TP3: 5,553.7
⚠️ Invalidation: Above 5,649.2
Stay disciplined, respect your stop loss, and consider securing partial profits as each target is reached. Always manage risk and avoid emotional trading.
#btcdome #BitcoinDominance #CryptoTrading. #ShortSetups #TechnicalAnalysise #BTC
🚨 $BTCDOM SHORT SETUP — ENTRY IS LIVE! 🔴
Bitcoin Dominance is showing bearish momentum as sellers break below the previous candle’s low following a sustained upward move. The bearish trigger is confirmed, putting downside targets in focus.
📉 SHORT TRADE SETUP
🔻 Entry: 5,630.1
🛑 Stop Loss: 5,649.2
🎯 Take Profit Targets:
TP1: 5,601.4
TP2: 5,582.3
TP3: 5,553.7
⚠️ Invalidation: Above 5,649.2
Stay disciplined, respect your stop loss, and consider securing partial profits as each target is reached. Always manage risk and avoid emotional trading.
#btcdome #BitcoinDominance #CryptoTrading. #ShortSetups #TechnicalAnalysise #BTC
Bitcoin Dominance is showing bearish momentum as sellers break below the previous candle’s low following a sustained upward move. The bearish trigger is confirmed, putting downside targets in focus.
📉 SHORT TRADE SETUP
🔻 Entry: 5,630.1
🛑 Stop Loss: 5,649.2
🎯 Take Profit Targets:
TP1: 5,601.4
TP2: 5,582.3
TP3: 5,553.7
⚠️ Invalidation: Above 5,649.2
Stay disciplined, respect your stop loss, and consider securing partial profits as each target is reached. Always manage risk and avoid emotional trading.
#btcdome #BitcoinDominance #CryptoTrading. #ShortSetups #TechnicalAnalysise #BTC
252
·
--
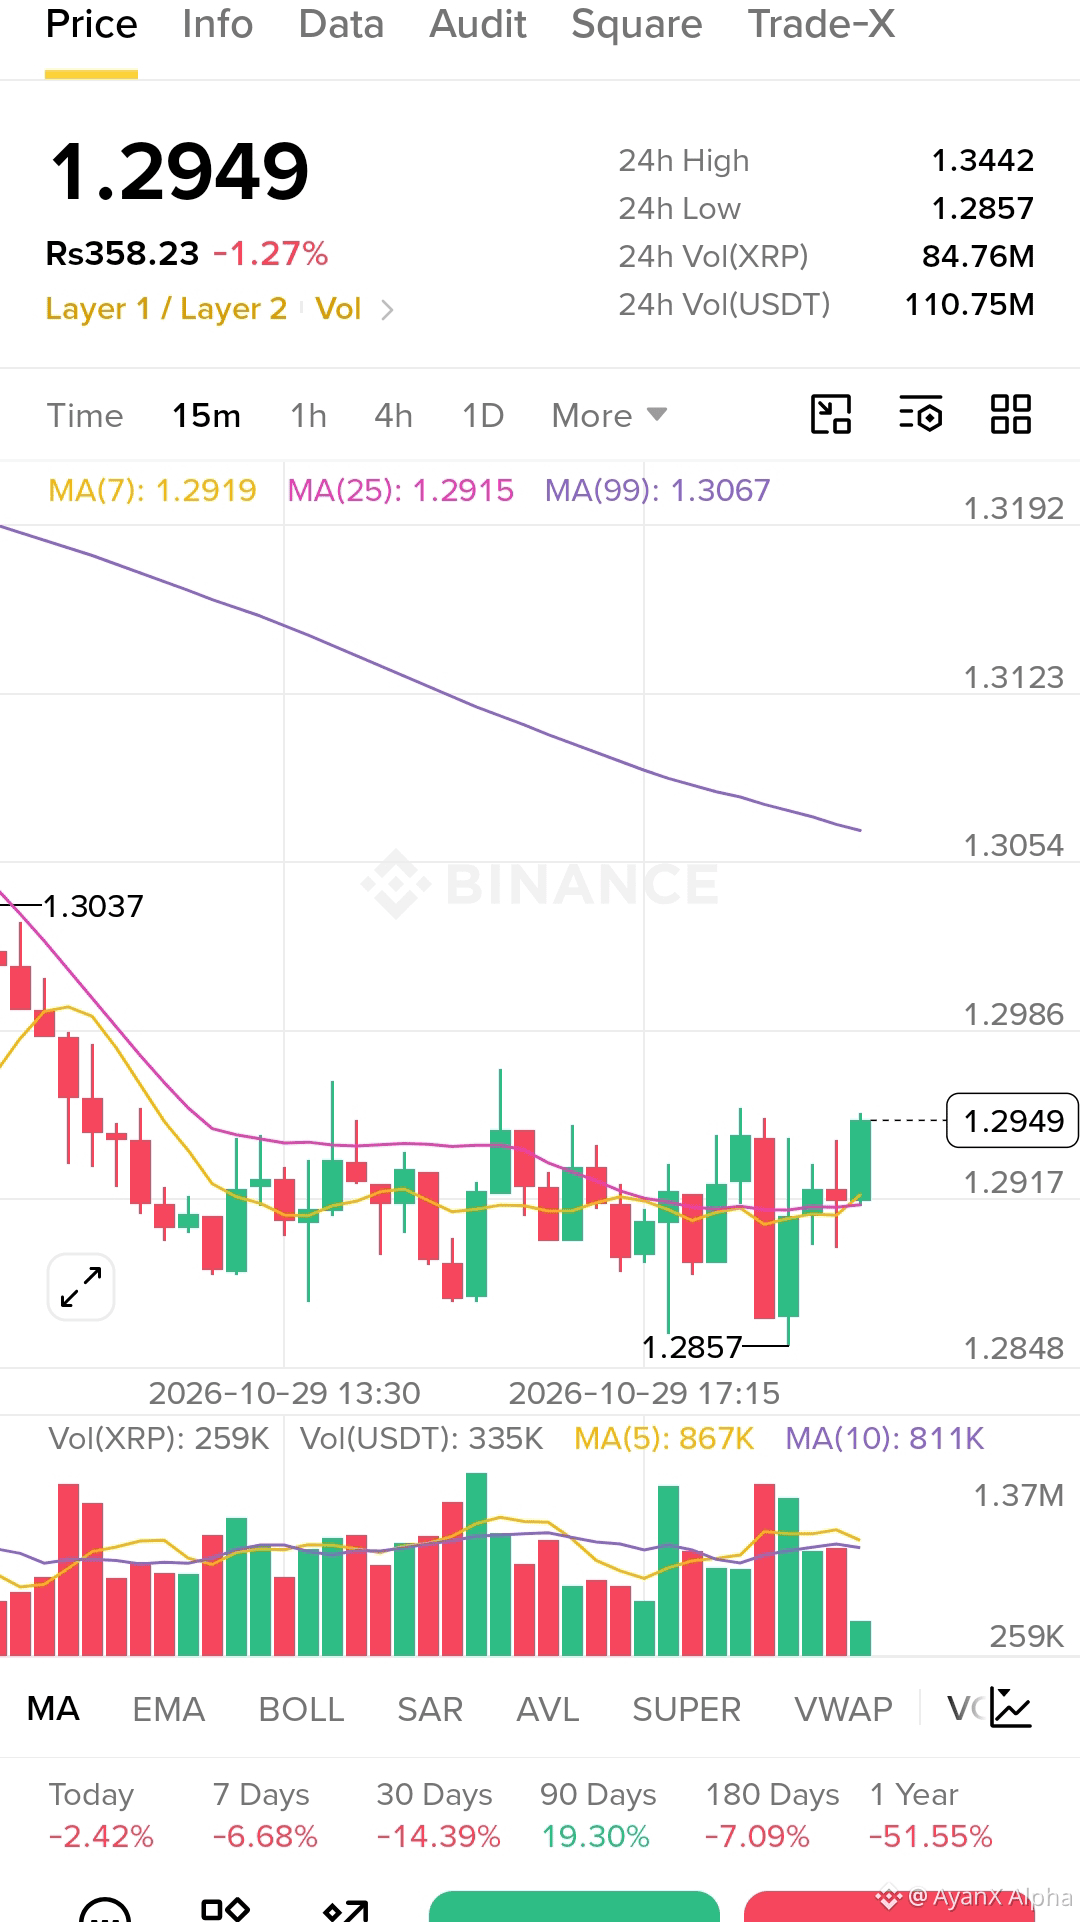
🚨 $XRP: BULLS ARE WATCHING FOR A RECOVERY! 📈
$XRP
{spot}(XRPUSDT)
$XRP is trading near a key support zone, and traders are watching for a potential 4H reversal.
🎯 Trade Setup
🟢 Entry: $1.2911 – $1.2925
🎯 TP1: $1.2996
🎯 TP2: $1.3100
🚀 TP3: $1.3200
🛑 Stop-loss: $1.2775
👀 What confirms the move?
• Strong bullish 4H candle
• Increasing buying volume
• Break and hold above $1.3000
⚠️ XRP remains under short-term pressure. Wait for confirmation instead of entering blindly, and always manage your risk.
Can $XRP reclaim $1.32 next? What's your target? 👇
Follow AyanX Alpha for more crypto setups.
#XRP #Ripple #CryptoTrading. #Altcoins! #TechnicalAnalysise #AyanXAlpha
🚨 $XRP : BULLS ARE WATCHING FOR A RECOVERY! 📈
$XRP
$XRP is trading near a key support zone, and traders are watching for a potential 4H reversal.
🎯 Trade Setup
🟢 Entry: $1.2911 – $1.2925
🎯 TP1: $1.2996
🎯 TP2: $1.3100
🚀 TP3: $1.3200
🛑 Stop-loss: $1.2775
👀 What confirms the move?
• Strong bullish 4H candle
• Increasing buying volume
• Break and hold above $1.3000
⚠️ XRP remains under short-term pressure. Wait for confirmation instead of entering blindly, and always manage your risk.
Can $XRP reclaim $1.32 next? What's your target? 👇
Follow AyanX Alpha for more crypto setups.
#XRP #Ripple #CryptoTrading. #Altcoins! #TechnicalAnalysise #AyanXAlpha
$XRP
$XRP is trading near a key support zone, and traders are watching for a potential 4H reversal.
🎯 Trade Setup
🟢 Entry: $1.2911 – $1.2925
🎯 TP1: $1.2996
🎯 TP2: $1.3100
🚀 TP3: $1.3200
🛑 Stop-loss: $1.2775
👀 What confirms the move?
• Strong bullish 4H candle
• Increasing buying volume
• Break and hold above $1.3000
⚠️ XRP remains under short-term pressure. Wait for confirmation instead of entering blindly, and always manage your risk.
Can $XRP reclaim $1.32 next? What's your target? 👇
Follow AyanX Alpha for more crypto setups.
#XRP #Ripple #CryptoTrading. #Altcoins! #TechnicalAnalysise #AyanXAlpha
75


·
--
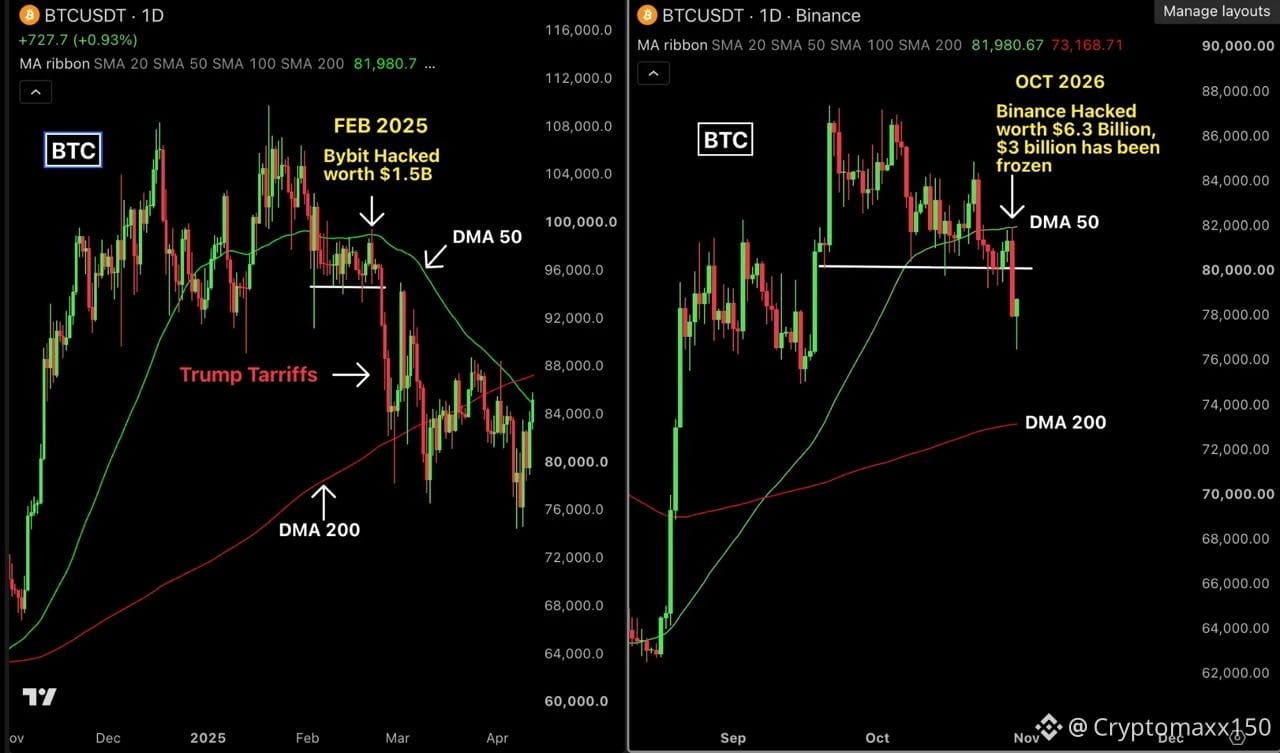
History repeating itself? A massive Binance hack puts Bitcoin under the microscope again. 🔍
In February 2025, the $1.5 billion Bybit hack shook the market.
Bitcoin fell 3.5% and clearly rejected the 50-day moving average.
Then Trump’s tariffs added pressure and made things worse.
But it found strong support at the 200-day moving average near $80,000.
Today, the $6.3 billion Binance hack is repeating the scenario.
Bitcoin fell 5.5% and rejected the 50-day moving average again.
It also broke an important support level at $79,000.
But there’s a bigger problem: global markets are showing clear weakness right now.
The Nasdaq is down 2%, and major stocks like Google and Amazon are declining.
Oil is trading above $100, putting pressure on assets.
Notably, both hacks led to a rejection at the 50-day moving average.
Previously, Bitcoin bounced back to test the 200-day moving average.
Today, that average is around the $73,000 area.
Continued weakness could push the price to test this level.
To recover, Bitcoin must reclaim and hold above $82,000.
$82,000 is the reclaim zone, while $79,000 is key support.
Meanwhile, $73,000 marks the 200-day moving average and deeper support.
Do you expect Bitcoin to hold up, or fall toward $73,000? 🤔
Share your predictions and technical analysis in the comments below now. 👇
#Bitcoin #BTC #Crypto #Binance #TechnicalAnalysise
History repeating itself? A massive Binance hack puts Bitcoin under the microscope again. 🔍
In February 2025, the $1.5 billion Bybit hack shook the market.
Bitcoin fell 3.5% and clearly rejected the 50-day moving average.
Then Trump’s tariffs added pressure and made things worse.
But it found strong support at the 200-day moving average near $80,000.
Today, the $6.3 billion Binance hack is repeating the scenario.
Bitcoin fell 5.5% and rejected the 50-day moving average again.
It also broke an important support level at $79,000.
But there’s a bigger problem: global markets are showing clear weakness right now.
The Nasdaq is down 2%, and major stocks like Google and Amazon are declining.
Oil is trading above $100, putting pressure on assets.
Notably, both hacks led to a rejection at the 50-day moving average.
Previously, Bitcoin bounced back to test the 200-day moving average.
Today, that average is around the $73,000 area.
Continued weakness could push the price to test this level.
To recover, Bitcoin must reclaim and hold above $82,000.
$82,000 is the reclaim zone, while $79,000 is key support.
Meanwhile, $73,000 marks the 200-day moving average and deeper support.
Do you expect Bitcoin to hold up, or fall toward $73,000? 🤔
Share your predictions and technical analysis in the comments below now. 👇
#Bitcoin #BTC #Crypto #Binance #TechnicalAnalysise
In February 2025, the $1.5 billion Bybit hack shook the market.
Bitcoin fell 3.5% and clearly rejected the 50-day moving average.
Then Trump’s tariffs added pressure and made things worse.
But it found strong support at the 200-day moving average near $80,000.
Today, the $6.3 billion Binance hack is repeating the scenario.
Bitcoin fell 5.5% and rejected the 50-day moving average again.
It also broke an important support level at $79,000.
But there’s a bigger problem: global markets are showing clear weakness right now.
The Nasdaq is down 2%, and major stocks like Google and Amazon are declining.
Oil is trading above $100, putting pressure on assets.
Notably, both hacks led to a rejection at the 50-day moving average.
Previously, Bitcoin bounced back to test the 200-day moving average.
Today, that average is around the $73,000 area.
Continued weakness could push the price to test this level.
To recover, Bitcoin must reclaim and hold above $82,000.
$82,000 is the reclaim zone, while $79,000 is key support.
Meanwhile, $73,000 marks the 200-day moving average and deeper support.
Do you expect Bitcoin to hold up, or fall toward $73,000? 🤔
Share your predictions and technical analysis in the comments below now. 👇
#Bitcoin #BTC #Crypto #Binance #TechnicalAnalysise
Domitila Moulder KwEe:
فلوسي سرقت
4
9
8.3k

#TechnicalAnalysise Market plunges, down $73,000
#TechnicalAnalysise Market plunges, down $73,000
81

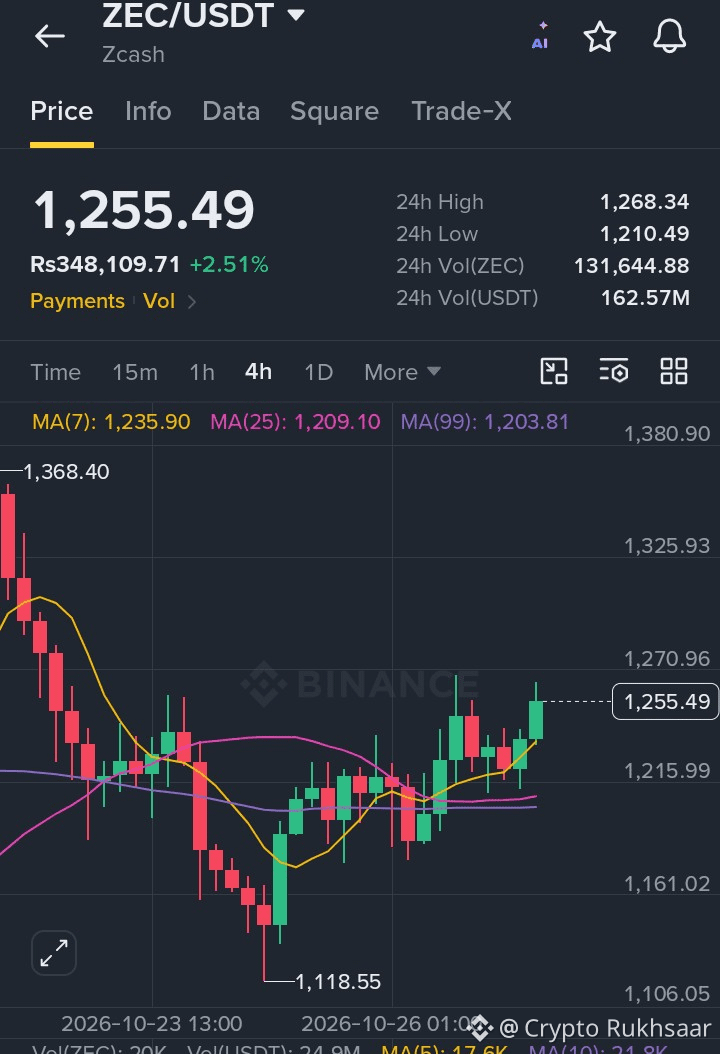
🔥 $$ZEC — Bullish Reversal or Another Pullback?
Zcash is showing signs of recovery, but the next move depends on whether buyers can overcome key resistance levels.
📈 Bullish Scenario: A confirmed breakout above $1,260, followed by a move toward $1,315, could strengthen the recovery.
⚠️ Bearish Scenario: A breakdown below the $1,185 support zone could expose lower levels around $1,100–$1,050.
📊 Market Outlook: ZEC remains at a critical technical point. Price action and trading volume will be essential for confirming the next direction.
💬 What do you think — can $ZEC regain bullish momentum, or is another pullback ahead?
$ZEC $BTC $USDT
#zcash #CryptoAnalysis #PricePredictions #TechnicalAnalysise #CryptoMarkets
🔥 $$ZEC — Bullish Reversal or Another Pullback?
Zcash is showing signs of recovery, but the next move depends on whether buyers can overcome key resistance levels.
📈 Bullish Scenario: A confirmed breakout above $1,260, followed by a move toward $1,315, could strengthen the recovery.
⚠️ Bearish Scenario: A breakdown below the $1,185 support zone could expose lower levels around $1,100–$1,050.
📊 Market Outlook: ZEC remains at a critical technical point. Price action and trading volume will be essential for confirming the next direction.
💬 What do you think — can $ZEC regain bullish momentum, or is another pullback ahead?
$ZEC $BTC $USDT
#zcash #CryptoAnalysis #PricePredictions #TechnicalAnalysise #CryptoMarkets
Zcash is showing signs of recovery, but the next move depends on whether buyers can overcome key resistance levels.
📈 Bullish Scenario: A confirmed breakout above $1,260, followed by a move toward $1,315, could strengthen the recovery.
⚠️ Bearish Scenario: A breakdown below the $1,185 support zone could expose lower levels around $1,100–$1,050.
📊 Market Outlook: ZEC remains at a critical technical point. Price action and trading volume will be essential for confirming the next direction.
💬 What do you think — can $ZEC regain bullish momentum, or is another pullback ahead?
$ZEC $BTC $USDT
#zcash #CryptoAnalysis #PricePredictions #TechnicalAnalysise #CryptoMarkets
2
192

·
--
👀 $ETH IS AT A DECISION POINT — BREAKOUT OR FAKEOUT?
Ethereum traders, don't let one green candle make your decision for you. 📊
After a strong move, the real question is whether buyers can maintain control or sellers will push the price back down.
🔴 BEARISH SCENARIO
If ETH gets rejected near resistance and loses its recent support, selling pressure could increase.
A failed breakout may trap late buyers who entered too early.
🟢 BULLISH SCENARIO
If ETH breaks above resistance with convincing price action and holds that level on a retest, it could strengthen the bullish case.
But confirmation is important. No breakout is guaranteed to succeed.
📊 THREE THINGS I'M WATCHING
1️⃣ Candle closes around resistance
2️⃣ Trading volume during the move
3️⃣ Whether the breakout level holds as support
⚠️ NO BLIND ENTRIES. NO GUARANTEED PREDICTIONS.
A good trader prepares for both outcomes instead of falling in love with one direction.
💬 YOUR TURN:
What would you prefer to see before entering ETH?
A) A confirmed breakout
B) A rejection from resistance
C) A retest of support
Drop your answer below and share your reasoning! 👇
Follow for practical crypto education, technical analysis, and risk-management insights.
#Ethereum✅ #ETHETFS #CryptoTrading #TechnicalAnalysise #BinanceSquare
👀 $ETH IS AT A DECISION POINT — BREAKOUT OR FAKEOUT?
Ethereum traders, don't let one green candle make your decision for you. 📊
After a strong move, the real question is whether buyers can maintain control or sellers will push the price back down.
🔴 BEARISH SCENARIO
If ETH gets rejected near resistance and loses its recent support, selling pressure could increase.
A failed breakout may trap late buyers who entered too early.
🟢 BULLISH SCENARIO
If ETH breaks above resistance with convincing price action and holds that level on a retest, it could strengthen the bullish case.
But confirmation is important. No breakout is guaranteed to succeed.
📊 THREE THINGS I'M WATCHING
1️⃣ Candle closes around resistance
2️⃣ Trading volume during the move
3️⃣ Whether the breakout level holds as support
⚠️ NO BLIND ENTRIES. NO GUARANTEED PREDICTIONS.
A good trader prepares for both outcomes instead of falling in love with one direction.
💬 YOUR TURN:
What would you prefer to see before entering ETH?
A) A confirmed breakout
B) A rejection from resistance
C) A retest of support
Drop your answer below and share your reasoning! 👇
Follow for practical crypto education, technical analysis, and risk-management insights.
#Ethereum✅ #ETHETFS #CryptoTrading #TechnicalAnalysise #BinanceSquare
Ethereum traders, don't let one green candle make your decision for you. 📊
After a strong move, the real question is whether buyers can maintain control or sellers will push the price back down.
🔴 BEARISH SCENARIO
If ETH gets rejected near resistance and loses its recent support, selling pressure could increase.
A failed breakout may trap late buyers who entered too early.
🟢 BULLISH SCENARIO
If ETH breaks above resistance with convincing price action and holds that level on a retest, it could strengthen the bullish case.
But confirmation is important. No breakout is guaranteed to succeed.
📊 THREE THINGS I'M WATCHING
1️⃣ Candle closes around resistance
2️⃣ Trading volume during the move
3️⃣ Whether the breakout level holds as support
⚠️ NO BLIND ENTRIES. NO GUARANTEED PREDICTIONS.
A good trader prepares for both outcomes instead of falling in love with one direction.
💬 YOUR TURN:
What would you prefer to see before entering ETH?
A) A confirmed breakout
B) A rejection from resistance
C) A retest of support
Drop your answer below and share your reasoning! 👇
Follow for practical crypto education, technical analysis, and risk-management insights.
#Ethereum✅ #ETHETFS #CryptoTrading #TechnicalAnalysise #BinanceSquare
12

·
--
Bearish
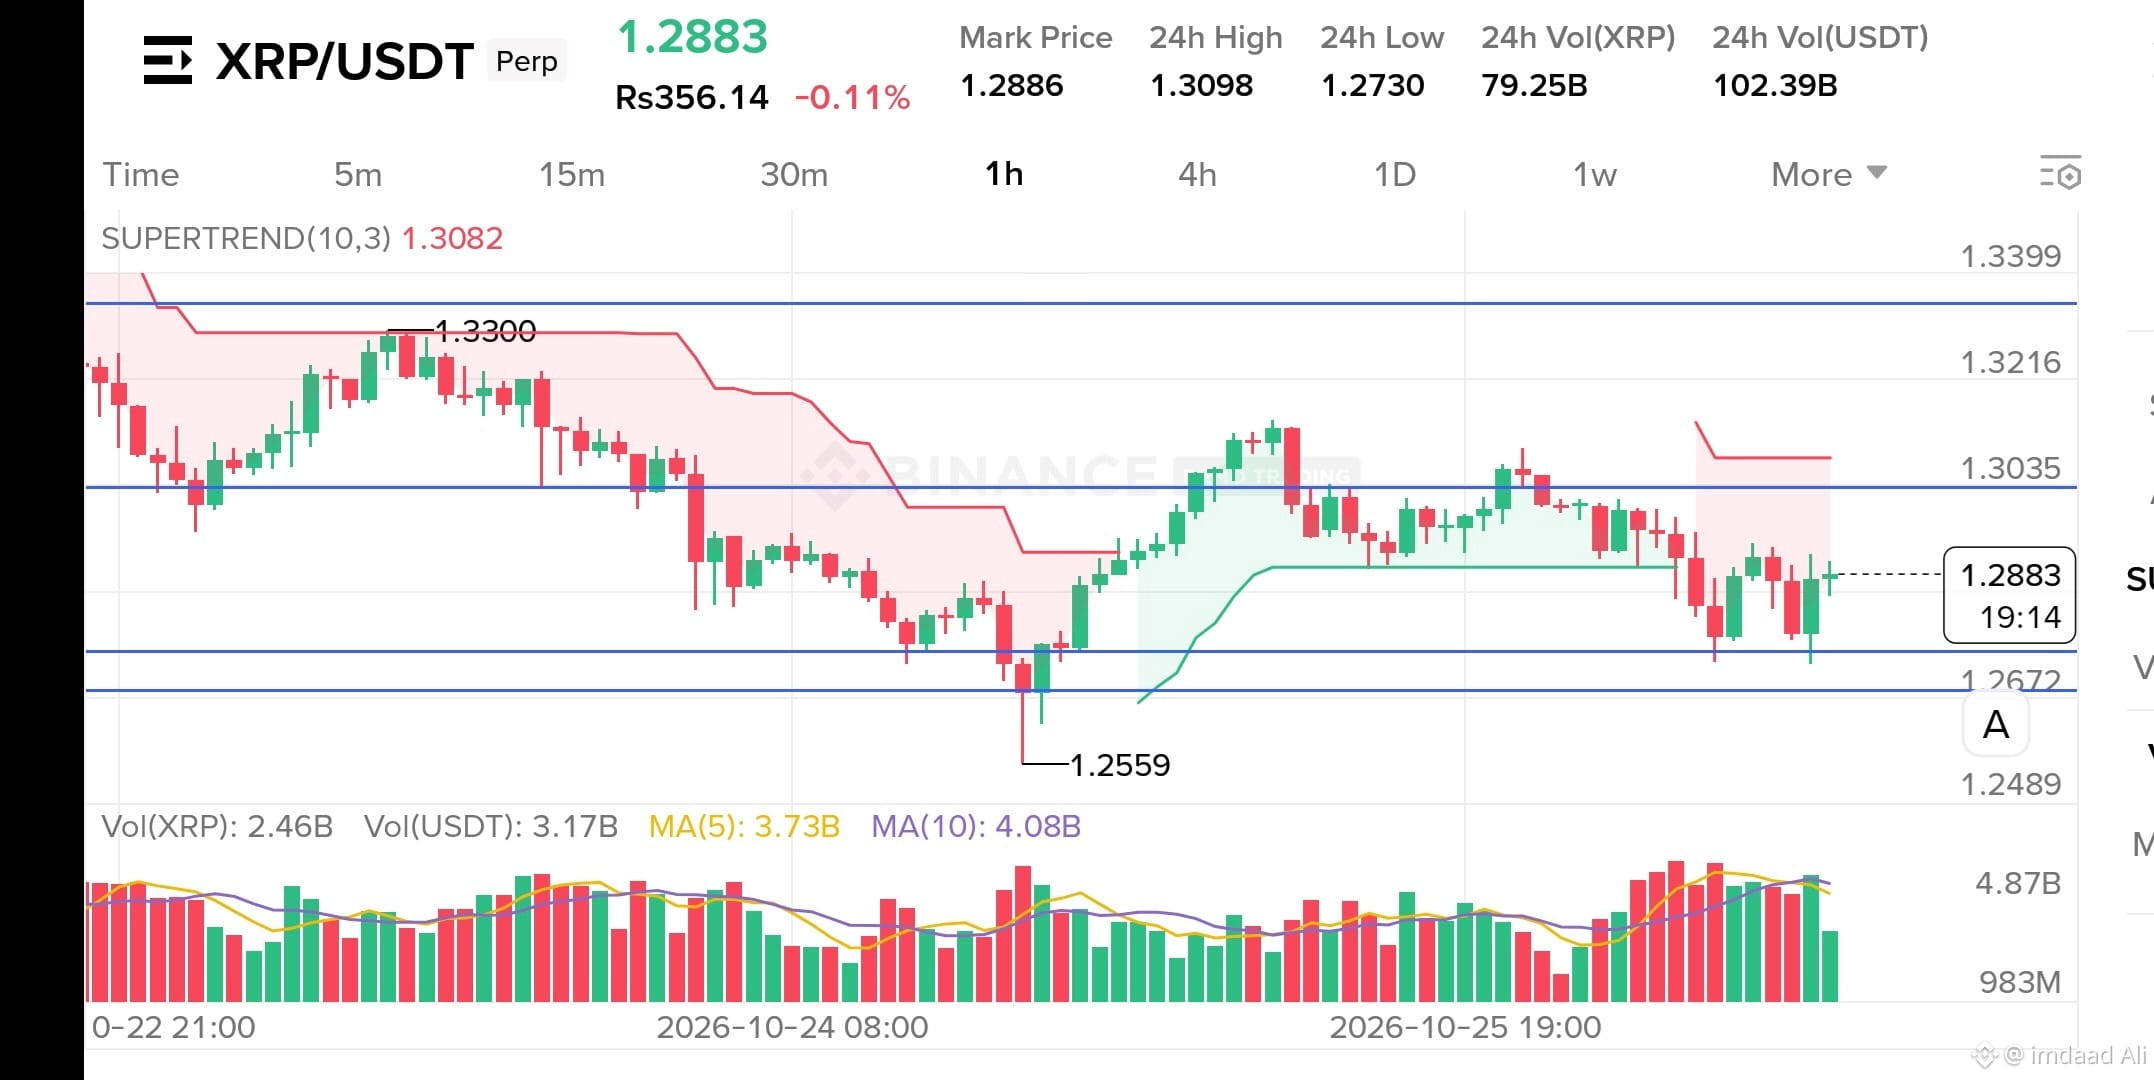
$XRP 🔴 XRP/USDT — BEARISH SETUP 📉 ⚠️ SHORT OPPORTUNITY | 1H TECHNICAL ANALYSIS
XRP is showing bearish pressure on the 1H timeframe. Price is trading below the Supertrend, while the $1.3035 resistance zone continues to act as a major barrier for buyers.
📊 TRADE PLAN
🔻 Direction: SHORT 🎯 Entry Zone: 1.2880 – 1.2960 🛑 Stop Loss: 1.3060
✅ TAKE PROFIT TARGETS 🥇 TP1: 1.2800 🥈 TP2: 1.2760 🥉 TP3: 1.2670
📉 WHY SHORT? ▪️ Price remains below the 1H Supertrend at 1.3082. ▪️ Resistance around 1.3035 has rejected price previously. ▪️ Buyers have not yet confirmed a breakout above resistance. ▪️ A breakdown below 1.2760 could open the door to further downside toward 1.2670.
⚠️ ENTRY CONFIRMATION Avoid chasing the price. Look for bearish rejection near the entry zone or a confirmed breakdown with a 1H candle close.
❌ If XRP breaks above resistance with strong bullish momentum, reassess the short setup.
💎 Trade the setup, not the hype. Manage risk carefully and never enter without a defined stop loss.
👇 Are you bullish or bearish on XRP? Comment your analysis below!
#XRP #XRPUSDT #BinanceSquareFamily g #ShortSignaln l #TechnicalAnalysise
$XRP 🔴 XRP/USDT — BEARISH SETUP 📉 ⚠️ SHORT OPPORTUNITY | 1H TECHNICAL ANALYSIS
XRP is showing bearish pressure on the 1H timeframe. Price is trading below the Supertrend, while the $1.3035 resistance zone continues to act as a major barrier for buyers.
📊 TRADE PLAN
🔻 Direction: SHORT 🎯 Entry Zone: 1.2880 – 1.2960 🛑 Stop Loss: 1.3060
✅ TAKE PROFIT TARGETS 🥇 TP1: 1.2800 🥈 TP2: 1.2760 🥉 TP3: 1.2670
📉 WHY SHORT? ▪️ Price remains below the 1H Supertrend at 1.3082. ▪️ Resistance around 1.3035 has rejected price previously. ▪️ Buyers have not yet confirmed a breakout above resistance. ▪️ A breakdown below 1.2760 could open the door to further downside toward 1.2670.
⚠️ ENTRY CONFIRMATION Avoid chasing the price. Look for bearish rejection near the entry zone or a confirmed breakdown with a 1H candle close.
❌ If XRP breaks above resistance with strong bullish momentum, reassess the short setup.
💎 Trade the setup, not the hype. Manage risk carefully and never enter without a defined stop loss.
👇 Are you bullish or bearish on XRP? Comment your analysis below!
#XRP #XRPUSDT #BinanceSquareFamily g #ShortSignaln l #TechnicalAnalysise
XRP is showing bearish pressure on the 1H timeframe. Price is trading below the Supertrend, while the $1.3035 resistance zone continues to act as a major barrier for buyers.
📊 TRADE PLAN
🔻 Direction: SHORT 🎯 Entry Zone: 1.2880 – 1.2960 🛑 Stop Loss: 1.3060
✅ TAKE PROFIT TARGETS 🥇 TP1: 1.2800 🥈 TP2: 1.2760 🥉 TP3: 1.2670
📉 WHY SHORT? ▪️ Price remains below the 1H Supertrend at 1.3082. ▪️ Resistance around 1.3035 has rejected price previously. ▪️ Buyers have not yet confirmed a breakout above resistance. ▪️ A breakdown below 1.2760 could open the door to further downside toward 1.2670.
⚠️ ENTRY CONFIRMATION Avoid chasing the price. Look for bearish rejection near the entry zone or a confirmed breakdown with a 1H candle close.
❌ If XRP breaks above resistance with strong bullish momentum, reassess the short setup.
💎 Trade the setup, not the hype. Manage risk carefully and never enter without a defined stop loss.
👇 Are you bullish or bearish on XRP? Comment your analysis below!
#XRP #XRPUSDT #BinanceSquareFamily g #ShortSignaln l #TechnicalAnalysise
1
85

·
--
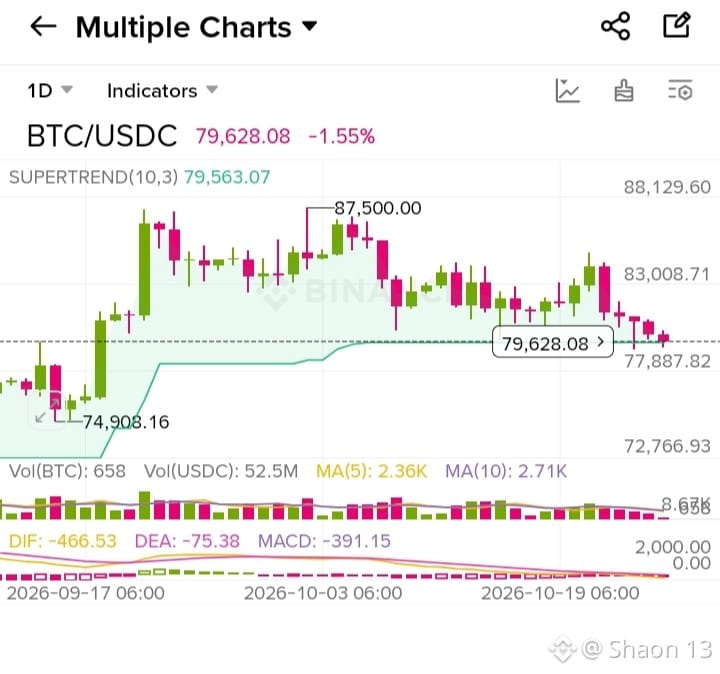
BTC/USDC Technical Analysis (1D Chart)
🔹 Current Price: $79,628.08 (-1.55%)
🔹 Trend Overview: The market is currently showing consolidation with a slight downward correction, hovering near a crucial support zone.
📊 Key Technical Indicators Breakdown:
Supertrend (10,3):
Level: $79,563.07
Analysis: Price is currently trading right around the Supertrend line, acting as an immediate psychological and technical pivot point. Holding above this level is vital for a bullish continuation.
MACD Indicator:
DIF: -466.53 | DEA: -75.38 | MACD Histogram: -391.15
Analysis: The MACD lines remain in negative territory with weak momentum, indicating that sellers are currently putting short-term pressure on the market, requiring patience before a strong reversal.
Moving Averages (MA):
MA(5): 2.36K | MA(10): 2.71K
Analysis: Volume moving averages reflect a cooling-off period following previous volatility near the local highs.
🎯 Key Levels to Watch:
Resistance: $83,008 – $87,500 (Breakout above this range could trigger a strong rally towards higher targets)
Support: $77,887 – $74,908 (Crucial demand zones to watch for potential bounce-backs)
💡 Market Sentiment: Neutral to Cautious. Keep an eye on volume changes and how the price reacts around the Supertrend support!
Disclaimer: This analysis is for educational purposes only and does not constitute financial advice. Always do your own research (DYOR) before trading.
Tags: #bitcoin #BTC #CryptoAnalysis" #BinanceSquareFamily #TechnicalAnalysise
{spot}(BTCUSDT)
$BTC $BTC
BTC/USDC Technical Analysis (1D Chart)
🔹 Current Price: $79,628.08 (-1.55%)
🔹 Trend Overview: The market is currently showing consolidation with a slight downward correction, hovering near a crucial support zone.
📊 Key Technical Indicators Breakdown:
Supertrend (10,3):
Level: $79,563.07
Analysis: Price is currently trading right around the Supertrend line, acting as an immediate psychological and technical pivot point. Holding above this level is vital for a bullish continuation.
MACD Indicator:
DIF: -466.53 | DEA: -75.38 | MACD Histogram: -391.15
Analysis: The MACD lines remain in negative territory with weak momentum, indicating that sellers are currently putting short-term pressure on the market, requiring patience before a strong reversal.
Moving Averages (MA):
MA(5): 2.36K | MA(10): 2.71K
Analysis: Volume moving averages reflect a cooling-off period following previous volatility near the local highs.
🎯 Key Levels to Watch:
Resistance: $83,008 – $87,500 (Breakout above this range could trigger a strong rally towards higher targets)
Support: $77,887 – $74,908 (Crucial demand zones to watch for potential bounce-backs)
💡 Market Sentiment: Neutral to Cautious. Keep an eye on volume changes and how the price reacts around the Supertrend support!
Disclaimer: This analysis is for educational purposes only and does not constitute financial advice. Always do your own research (DYOR) before trading.
Tags: #bitcoin #BTC #CryptoAnalysis" #BinanceSquareFamily #TechnicalAnalysise
$BTC $BTC
🔹 Current Price: $79,628.08 (-1.55%)
🔹 Trend Overview: The market is currently showing consolidation with a slight downward correction, hovering near a crucial support zone.
📊 Key Technical Indicators Breakdown:
Supertrend (10,3):
Level: $79,563.07
Analysis: Price is currently trading right around the Supertrend line, acting as an immediate psychological and technical pivot point. Holding above this level is vital for a bullish continuation.
MACD Indicator:
DIF: -466.53 | DEA: -75.38 | MACD Histogram: -391.15
Analysis: The MACD lines remain in negative territory with weak momentum, indicating that sellers are currently putting short-term pressure on the market, requiring patience before a strong reversal.
Moving Averages (MA):
MA(5): 2.36K | MA(10): 2.71K
Analysis: Volume moving averages reflect a cooling-off period following previous volatility near the local highs.
🎯 Key Levels to Watch:
Resistance: $83,008 – $87,500 (Breakout above this range could trigger a strong rally towards higher targets)
Support: $77,887 – $74,908 (Crucial demand zones to watch for potential bounce-backs)
💡 Market Sentiment: Neutral to Cautious. Keep an eye on volume changes and how the price reacts around the Supertrend support!
Disclaimer: This analysis is for educational purposes only and does not constitute financial advice. Always do your own research (DYOR) before trading.
Tags: #bitcoin #BTC #CryptoAnalysis" #BinanceSquareFamily #TechnicalAnalysise
$BTC $BTC
2
50
Log in to explore more content
Join global crypto users on Binance Square
⚡️ Get latest and useful information about crypto.
💬 Trusted by the world’s largest crypto exchange.
👍 Discover real insights from verified creators.
Email / Phone number
Trending Topics
1
#BinanceHadAlreadyCovered$6BofHackLoss
381 views
7 Discussing
2
#FBIConfirmsNorthKoreaIsResponsibleForBinanceCryptoHack
1,011 views
22 Discussing
3
#BinanceSAFUFundTransferCompleted7499BTC
57,235 views
1,038 Discussing
4
#BinanceRecovery90% of stolen assets
173,634 views
194 Discussing
5
#YiHe:ProofOfReserves:10TokensAt100%Backing
159,584 views
905 Discussing
6
#BackedNotBroken:RichardTengSaysUsersBearNoLoss
55,238 views
582 Discussing
7
#B14gReportsUnauthorizedTransferOfAbout97MCORE
2,172 views
63 Discussing
8
#USSpotETHETFsPost23StraightDaysOfNetOutflows
2,182 views
66 Discussing
9
#CZSaysCompensationIsinPlaceUsersAreProtected
144,437 views
1,476 Discussing
10
#IntelHasItsWorstDaySince1974
58,008 views
758 Discussing