

#tza
tza
5,433 views
83 Discussing
Hot
Latest


·
--
Bullish
Guys, I have just opened a long position on $TZA with 20x leverage....
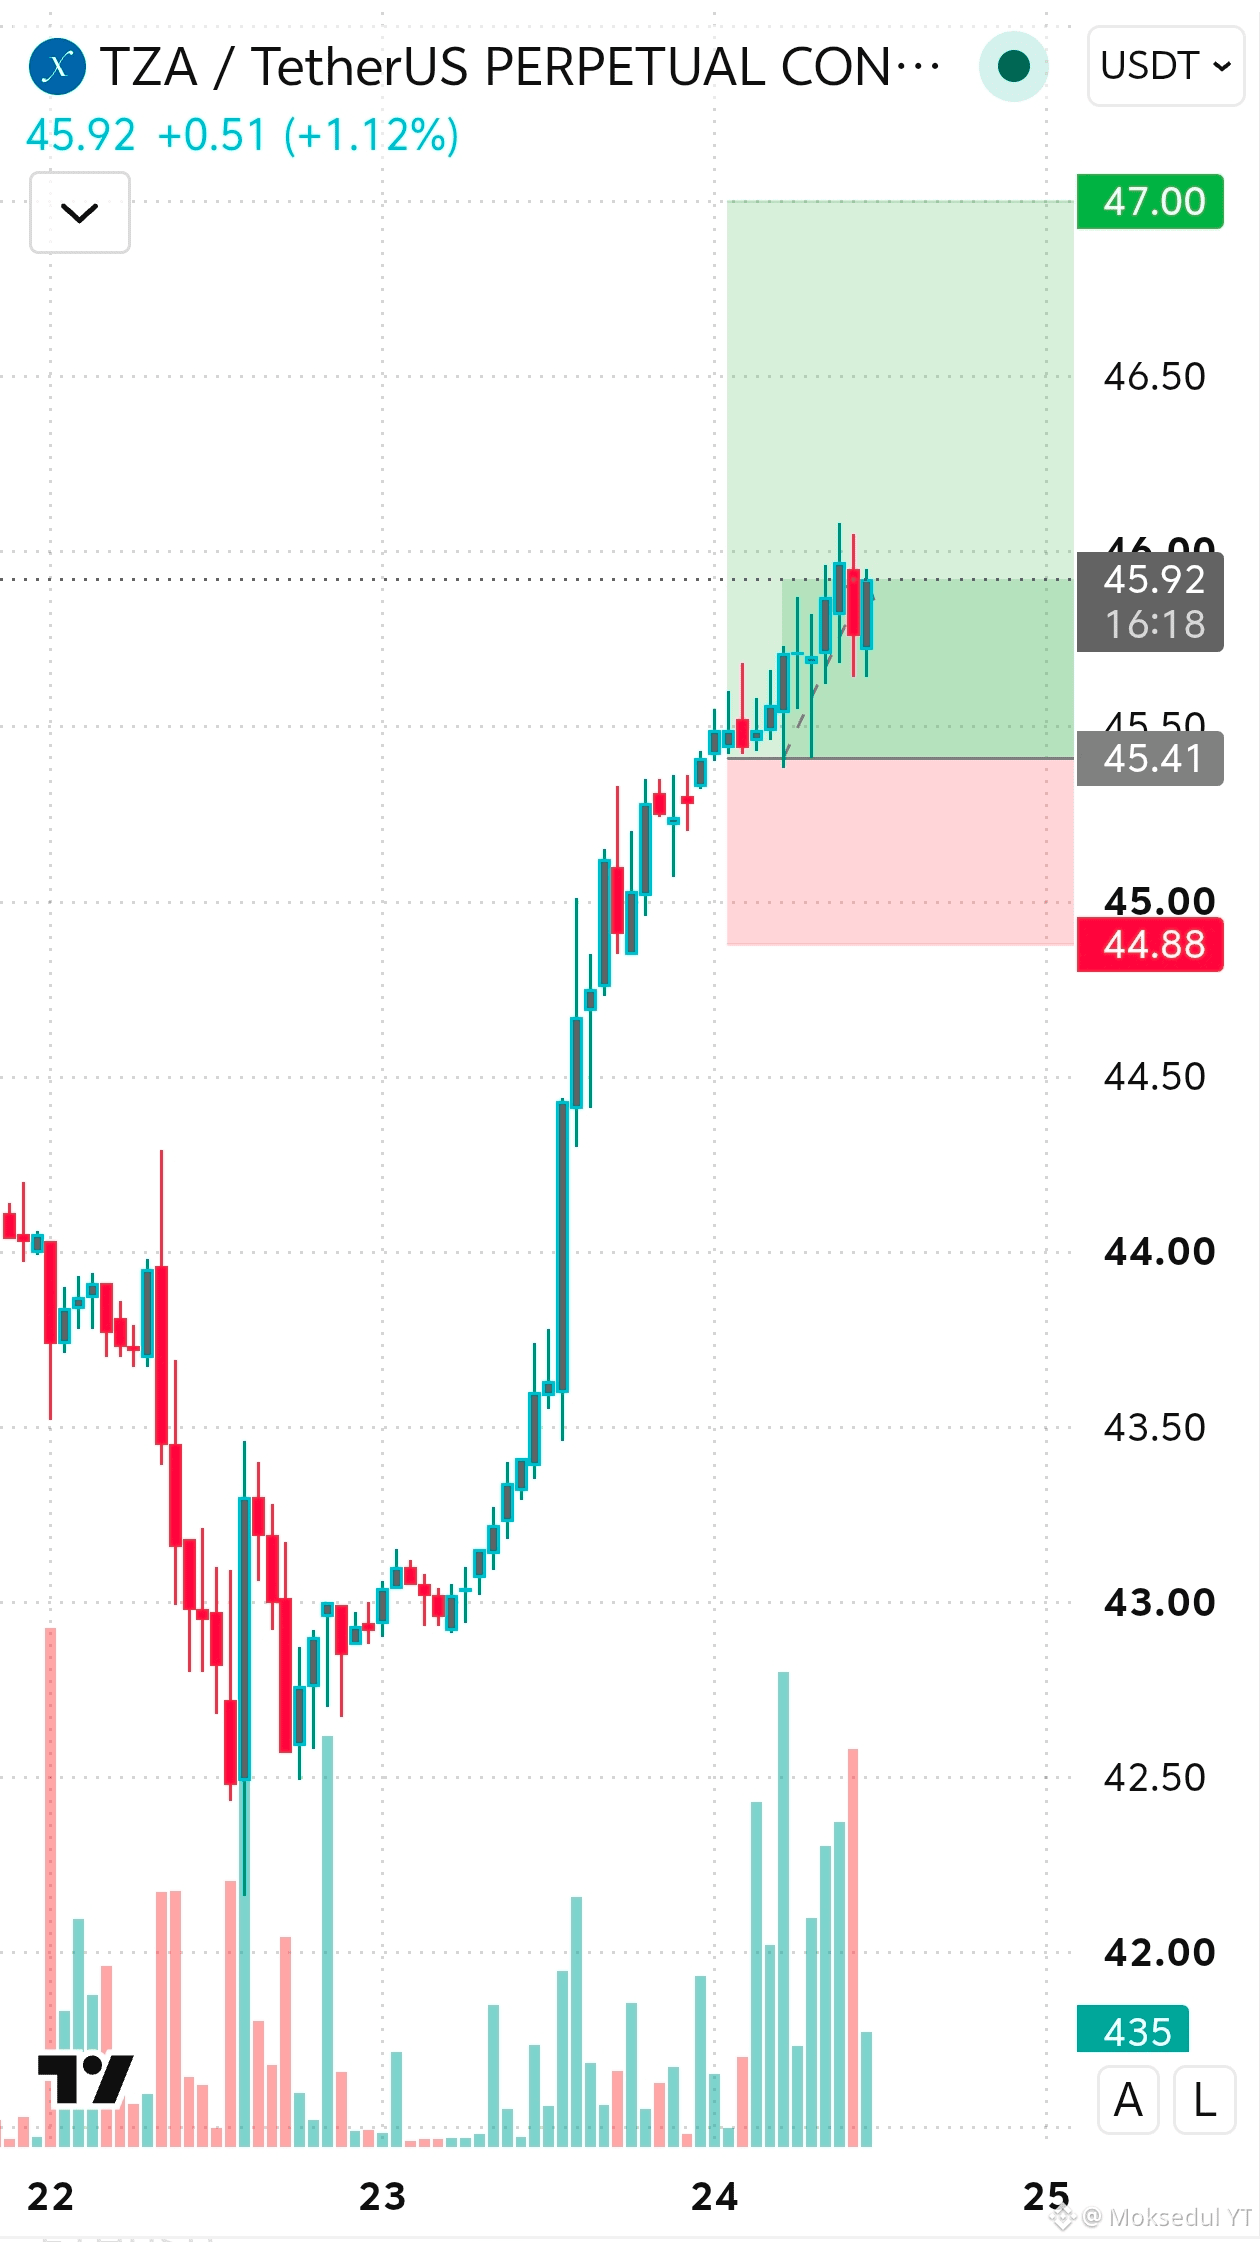
#TZA is breaking out from a consolidation zone, with buyers pushing price toward the recent highs with strong momentum.
A break above $47.00 could open the way toward $48.00 → $49.00, while losing $45.00 may bring another pullback.
Entry: $45.80–$46.00
TP: $48.00 → $49.00 → $50.00
SL: $44.50
Buy and Trade
{future}(TZAUSDT)
$NIL
{future}(NILUSDT)
$LSK
{future}(LSKUSDT)
Guys, I have just opened a long position on $TZA with 20x leverage....
#TZA is breaking out from a consolidation zone, with buyers pushing price toward the recent highs with strong momentum.
A break above $47.00 could open the way toward $48.00 → $49.00, while losing $45.00 may bring another pullback.
Entry: $45.80–$46.00
TP: $48.00 → $49.00 → $50.00
SL: $44.50
Buy and Trade
$NIL
$LSK
#TZA is breaking out from a consolidation zone, with buyers pushing price toward the recent highs with strong momentum.
A break above $47.00 could open the way toward $48.00 → $49.00, while losing $45.00 may bring another pullback.
Entry: $45.80–$46.00
TP: $48.00 → $49.00 → $50.00
SL: $44.50
Buy and Trade
$NIL
$LSK
1
299

·
--
$TZA in the past 24 hours rose 5.543%, but the funding rate remained at 0. This combination is quite interesting.
Up 5.5%, yet the funding rate doesn’t budge—suggesting this rally wasn’t driven by a crowded long chasing after prices. The cost structure stays balanced. One possibility is that shorts passively get liquidated or that spot buying dominates, without any one-sided sentiment taking hold in the derivatives market.
On the flip side, both longs and shorts are quiet. The market may also be waiting for a macro catalyst before making a directional bet. Only if OI increases significantly and the funding rate flips direction will a one-sided move be triggered.
Trading tag: #TradFi #链上美股 #TZA
Where do you think this assessment is most likely to be wrong?
$TZA in the past 24 hours rose 5.543%, but the funding rate remained at 0. This combination is quite interesting.
Up 5.5%, yet the funding rate doesn’t budge—suggesting this rally wasn’t driven by a crowded long chasing after prices. The cost structure stays balanced. One possibility is that shorts passively get liquidated or that spot buying dominates, without any one-sided sentiment taking hold in the derivatives market.
On the flip side, both longs and shorts are quiet. The market may also be waiting for a macro catalyst before making a directional bet. Only if OI increases significantly and the funding rate flips direction will a one-sided move be triggered.
Trading tag: #TradFi #链上美股 #TZA
Where do you think this assessment is most likely to be wrong?
Up 5.5%, yet the funding rate doesn’t budge—suggesting this rally wasn’t driven by a crowded long chasing after prices. The cost structure stays balanced. One possibility is that shorts passively get liquidated or that spot buying dominates, without any one-sided sentiment taking hold in the derivatives market.
On the flip side, both longs and shorts are quiet. The market may also be waiting for a macro catalyst before making a directional bet. Only if OI increases significantly and the funding rate flips direction will a one-sided move be triggered.
Trading tag: #TradFi #链上美股 #TZA
Where do you think this assessment is most likely to be wrong?
20

The coin’s trading volume keeps falling—keep staying short until it hits 0.
The data is here, take a look yourself.
🔥 TZA #TZA 【Main】
Current price 43.3000, 24h change +0.81%
24h trading value is only $332k, bottom of the whole market
→ Trading volume down 35.9%; the longs have lost their confidence—continue to hold the short until it reaches 0
Moving sideways without going up is weakness
Place a short limit order at 51.9600, stop-loss 10% (57.1560). Don’t hold a losing position
These are also good opportunities to short:
····
VTHO
Current 0.000682, 24h change -18.68%
Entry timing: short at 0.000818 with a stop-loss set at 10% (0.000900)
····
LAB
Current 0.051410, 24h change -23.85%
Entry timing: short at 0.061692 with a stop-loss set at 10% (0.067861)
····
⚠️ Small capital—test cautiously, use strict stop-losses, and don’t trade without risk control
#Live-trade log
The coin’s trading volume keeps falling—keep staying short until it hits 0.
The data is here, take a look yourself.
🔥 TZA #TZA 【Main】
Current price 43.3000, 24h change +0.81%
24h trading value is only $332k, bottom of the whole market
→ Trading volume down 35.9%; the longs have lost their confidence—continue to hold the short until it reaches 0
Moving sideways without going up is weakness
Place a short limit order at 51.9600, stop-loss 10% (57.1560). Don’t hold a losing position
These are also good opportunities to short:
····
VTHO
Current 0.000682, 24h change -18.68%
Entry timing: short at 0.000818 with a stop-loss set at 10% (0.000900)
····
LAB
Current 0.051410, 24h change -23.85%
Entry timing: short at 0.061692 with a stop-loss set at 10% (0.067861)
····
⚠️ Small capital—test cautiously, use strict stop-losses, and don’t trade without risk control
#Live-trade log
The data is here, take a look yourself.
🔥 TZA #TZA 【Main】
Current price 43.3000, 24h change +0.81%
24h trading value is only $332k, bottom of the whole market
→ Trading volume down 35.9%; the longs have lost their confidence—continue to hold the short until it reaches 0
Moving sideways without going up is weakness
Place a short limit order at 51.9600, stop-loss 10% (57.1560). Don’t hold a losing position
These are also good opportunities to short:
····
VTHO
Current 0.000682, 24h change -18.68%
Entry timing: short at 0.000818 with a stop-loss set at 10% (0.000900)
····
LAB
Current 0.051410, 24h change -23.85%
Entry timing: short at 0.061692 with a stop-loss set at 10% (0.067861)
····
⚠️ Small capital—test cautiously, use strict stop-losses, and don’t trade without risk control
#Live-trade log
6

·
--
Bullish
$TZA
{future}(TZAUSDT)
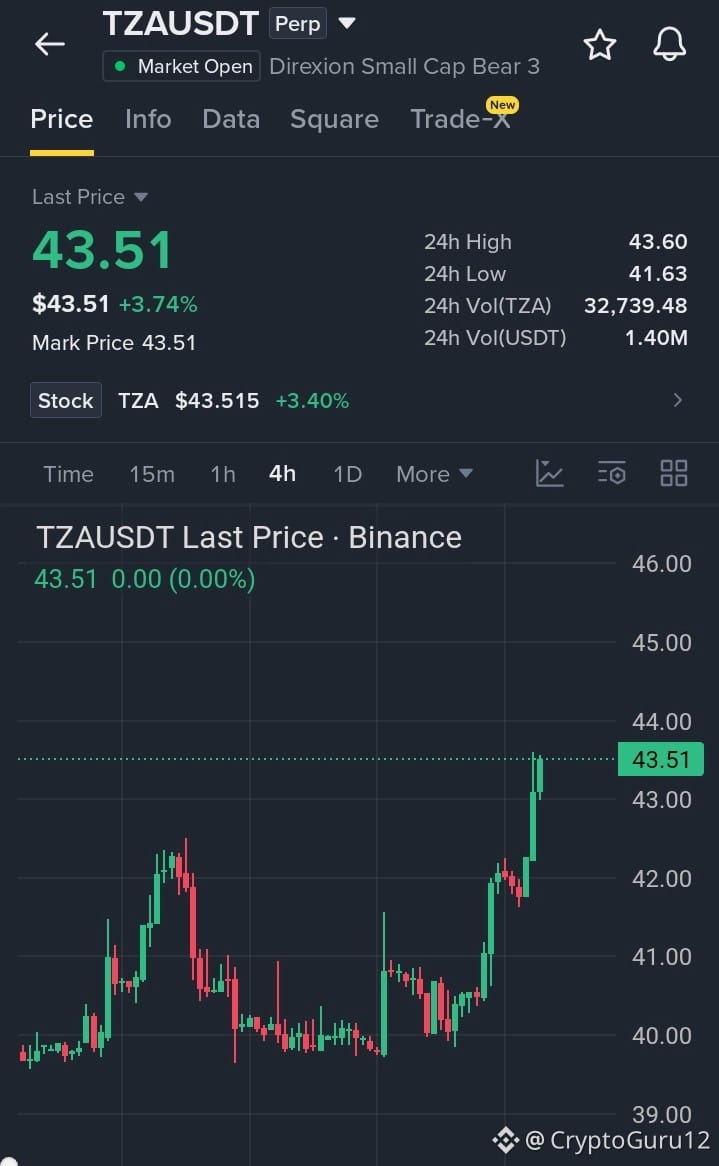
$TZA is holding firm after a strong upward move, with buyers defending the 43.40 area. If candles break and hold above 43.60, momentum could extend toward the next resistance levels.
Entry: 43.40–43.60
TP1: 44.00
TP2: 44.50
SL: 42.95
#TZA #LongTrade
$TZA
$TZA is holding firm after a strong upward move, with buyers defending the 43.40 area. If candles break and hold above 43.60, momentum could extend toward the next resistance levels.
Entry: 43.40–43.60
TP1: 44.00
TP2: 44.50
SL: 42.95
#TZA #LongTrade
$TZA is holding firm after a strong upward move, with buyers defending the 43.40 area. If candles break and hold above 43.60, momentum could extend toward the next resistance levels.
Entry: 43.40–43.60
TP1: 44.00
TP2: 44.50
SL: 42.95
#TZA #LongTrade

1
2

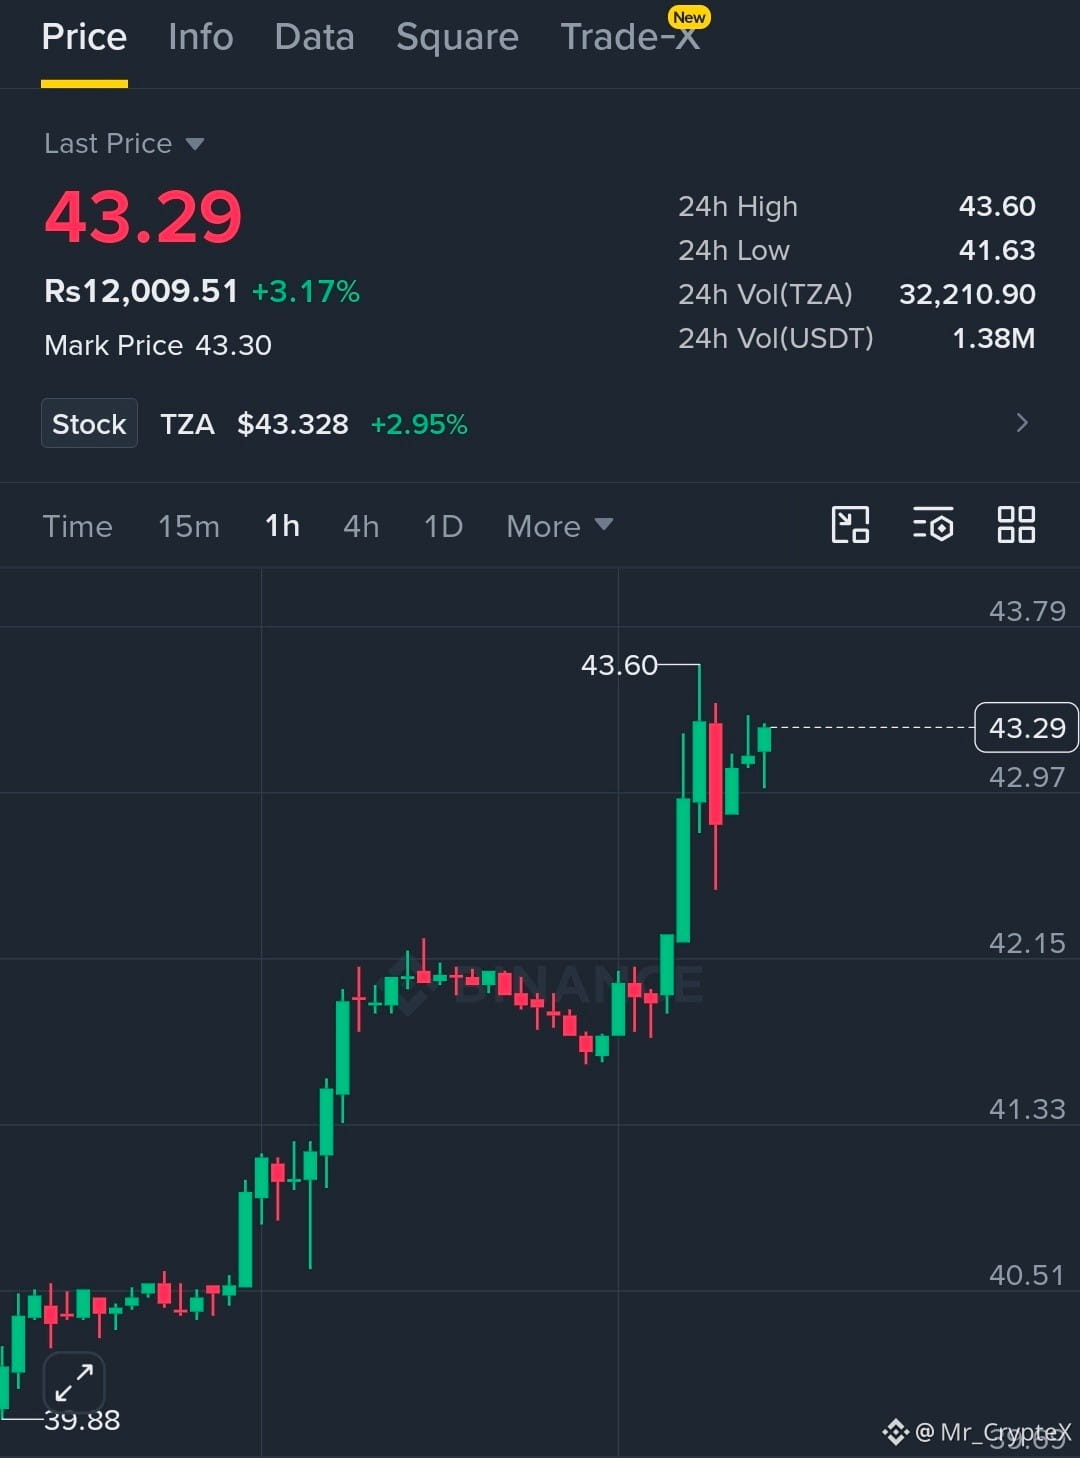
🚀 $TZA BREAKING $43.60 RESISTANCE, MOMENTUM ON RAMPAGE! 📈
Entry: $43.20 ⚡
Target: $44.25 🚀
Stop Loss: $42.80 ⚠️
📊 Buyers have ripped through the $42.00 barrier and now sit firm around $43.50, feeding a clean higher‑high, higher‑low pattern. 🦈 The $43.20‑$43.50 zone acts as a fresh order block; a decisive close above $43.60 could unleash a wave toward $44.25 and beyond. ⚡ Volume is swelling on the 4‑hour chart, confirming that smart money is flipping the script.
💬 Are you loading your bids at $43.20 or waiting for the next liquidity sweep? 👇
⚠️ Not financial advice. Always manage your risk. 🛡️
🏷️ #TZA #LongSetup #Breakout #Crypto
🔥 💎
🚀 $TZA BREAKING $43.60 RESISTANCE, MOMENTUM ON RAMPAGE! 📈
Entry: $43.20 ⚡
Target: $44.25 🚀
Stop Loss: $42.80 ⚠️
📊 Buyers have ripped through the $42.00 barrier and now sit firm around $43.50, feeding a clean higher‑high, higher‑low pattern. 🦈 The $43.20‑$43.50 zone acts as a fresh order block; a decisive close above $43.60 could unleash a wave toward $44.25 and beyond. ⚡ Volume is swelling on the 4‑hour chart, confirming that smart money is flipping the script.
💬 Are you loading your bids at $43.20 or waiting for the next liquidity sweep? 👇
⚠️ Not financial advice. Always manage your risk. 🛡️
🏷️ #TZA #LongSetup #Breakout #Crypto
🔥 💎
Entry: $43.20 ⚡
Target: $44.25 🚀
Stop Loss: $42.80 ⚠️
📊 Buyers have ripped through the $42.00 barrier and now sit firm around $43.50, feeding a clean higher‑high, higher‑low pattern. 🦈 The $43.20‑$43.50 zone acts as a fresh order block; a decisive close above $43.60 could unleash a wave toward $44.25 and beyond. ⚡ Volume is swelling on the 4‑hour chart, confirming that smart money is flipping the script.
💬 Are you loading your bids at $43.20 or waiting for the next liquidity sweep? 👇
⚠️ Not financial advice. Always manage your risk. 🛡️
🏷️ #TZA #LongSetup #Breakout #Crypto
🔥 💎

55

·
--
🚀🟢 $TZA SURGES PAST $42 RESISTANCE – BULLISH BREAKOUT ALERT
Entry: 43.20-43.60 ⚡
Target: 44.00-45.00 🚀
Stop Loss: 42.60 ⚠️
The breakout above $42 has cleared a key liquidity wall, and the market is now chewing the $43.20‑$43.60 zone with aggressive buying pressure ⚡. 📊 Volume on the 1‑hour chart is expanding, confirming the shift.
Each successive bullish candle is retesting the demand block, suggesting smart‑money accumulation before a push toward the next resistance cluster around $44‑$45 🌊. The retest of the breakout zone will be the decisive trigger for entries.
💬 Do you see the next wave riding the $44‑$45 corridor or waiting for a deeper pullback? 👇
⚠️ Not financial advice. Always manage your risk. 🛡️
🏷️ #TZA #LongSetup #Breakout #Crypto
🔥 💎
🚀🟢 $TZA SURGES PAST $42 RESISTANCE – BULLISH BREAKOUT ALERT
Entry: 43.20-43.60 ⚡
Target: 44.00-45.00 🚀
Stop Loss: 42.60 ⚠️
The breakout above $42 has cleared a key liquidity wall, and the market is now chewing the $43.20‑$43.60 zone with aggressive buying pressure ⚡. 📊 Volume on the 1‑hour chart is expanding, confirming the shift.
Each successive bullish candle is retesting the demand block, suggesting smart‑money accumulation before a push toward the next resistance cluster around $44‑$45 🌊. The retest of the breakout zone will be the decisive trigger for entries.
💬 Do you see the next wave riding the $44‑$45 corridor or waiting for a deeper pullback? 👇
⚠️ Not financial advice. Always manage your risk. 🛡️
🏷️ #TZA #LongSetup #Breakout #Crypto
🔥 💎
Entry: 43.20-43.60 ⚡
Target: 44.00-45.00 🚀
Stop Loss: 42.60 ⚠️
The breakout above $42 has cleared a key liquidity wall, and the market is now chewing the $43.20‑$43.60 zone with aggressive buying pressure ⚡. 📊 Volume on the 1‑hour chart is expanding, confirming the shift.
Each successive bullish candle is retesting the demand block, suggesting smart‑money accumulation before a push toward the next resistance cluster around $44‑$45 🌊. The retest of the breakout zone will be the decisive trigger for entries.
💬 Do you see the next wave riding the $44‑$45 corridor or waiting for a deeper pullback? 👇
⚠️ Not financial advice. Always manage your risk. 🛡️
🏷️ #TZA #LongSetup #Breakout #Crypto
🔥 💎

27

·
--
🚀 $TZA SURGES THROUGH $42 RESISTANCE, EYES $44‑45 CLIMB! 💥
Entry: 43.20‑43.60 ⚡
Target: 44.00 🚀
Stop Loss: 42.60 ⚠️
📊 Buyers have ripped the $42 barrier, hammering the order block and flipping the pressure to the upside. Consecutive bullish candles now sit near $43.50, signaling a fresh wave of smart‑money inflow. 🌊 If the breakout holds, the next liquidity pool sits around $44‑45, where sellers may scramble to dump. 💡 Watch the retest of the $43.20‑$43.40 zone for a clean entry signal.
💬 Are you ready to ride this momentum or waiting for a tighter retest? 👇
⚠️ Not financial advice. Always manage your risk. 🛡️
🏷️ #TZA #LongSetup #Breakout #Crypto
🔥 💎
🚀 $TZA SURGES THROUGH $42 RESISTANCE, EYES $44‑45 CLIMB! 💥
Entry: 43.20‑43.60 ⚡
Target: 44.00 🚀
Stop Loss: 42.60 ⚠️
📊 Buyers have ripped the $42 barrier, hammering the order block and flipping the pressure to the upside. Consecutive bullish candles now sit near $43.50, signaling a fresh wave of smart‑money inflow. 🌊 If the breakout holds, the next liquidity pool sits around $44‑45, where sellers may scramble to dump. 💡 Watch the retest of the $43.20‑$43.40 zone for a clean entry signal.
💬 Are you ready to ride this momentum or waiting for a tighter retest? 👇
⚠️ Not financial advice. Always manage your risk. 🛡️
🏷️ #TZA #LongSetup #Breakout #Crypto
🔥 💎
Entry: 43.20‑43.60 ⚡
Target: 44.00 🚀
Stop Loss: 42.60 ⚠️
📊 Buyers have ripped the $42 barrier, hammering the order block and flipping the pressure to the upside. Consecutive bullish candles now sit near $43.50, signaling a fresh wave of smart‑money inflow. 🌊 If the breakout holds, the next liquidity pool sits around $44‑45, where sellers may scramble to dump. 💡 Watch the retest of the $43.20‑$43.40 zone for a clean entry signal.
💬 Are you ready to ride this momentum or waiting for a tighter retest? 👇
⚠️ Not financial advice. Always manage your risk. 🛡️
🏷️ #TZA #LongSetup #Breakout #Crypto
🔥 💎

55

·
--
Bullish
$TZA LONG SETUP ..... BUYERS ARE BREAKING ABOVE RESISTANCE
#TZA is showing strong bullish momentum after breaking above the $42.00 resistance area. Price has pushed toward $43.50 with consecutive bullish candles, indicating strong buyer control. If the breakout holds, the move could continue toward the next nearby resistance levels.
Trade Setup
Entry: $43.20–$43.60
TP1: $44.00
TP2: $44.50
TP3: $45.00
Stop Loss: $42.60
Risk Management: Wait for a successful retest of the $43.20–$43.40 breakout zone before entering.
Buy and Trade
{future}(TZAUSDT)
$ZEC
{future}(ZECUSDT)
$IOST
{future}(IOSTUSDT)
$TZA LONG SETUP ..... BUYERS ARE BREAKING ABOVE RESISTANCE
#TZA is showing strong bullish momentum after breaking above the $42.00 resistance area. Price has pushed toward $43.50 with consecutive bullish candles, indicating strong buyer control. If the breakout holds, the move could continue toward the next nearby resistance levels.
Trade Setup
Entry: $43.20–$43.60
TP1: $44.00
TP2: $44.50
TP3: $45.00
Stop Loss: $42.60
Risk Management: Wait for a successful retest of the $43.20–$43.40 breakout zone before entering.
Buy and Trade
$ZEC
$IOST
#TZA is showing strong bullish momentum after breaking above the $42.00 resistance area. Price has pushed toward $43.50 with consecutive bullish candles, indicating strong buyer control. If the breakout holds, the move could continue toward the next nearby resistance levels.
Trade Setup
Entry: $43.20–$43.60
TP1: $44.00
TP2: $44.50
TP3: $45.00
Stop Loss: $42.60
Risk Management: Wait for a successful retest of the $43.20–$43.40 breakout zone before entering.
Buy and Trade
$ZEC
$IOST
2
285
·
--
Bullish
$TZA
{future}(TZAUSDT)
BULLISH BREAKOUT SETUP
$TZA is showing a strong bullish structure after bouncing firmly from the lower support zone. The recent candles are holding above the 42.90 area, while buyers are pushing toward the 43.60 resistance. A clean breakout and hold above this level could trigger the next upward move.
Entry Zone: 42.90–43.20
TP1: 43.80
TP2: 44.40
TP3: 45.00
#TZA #BullishSetup
$TZA
BULLISH BREAKOUT SETUP
$TZA is showing a strong bullish structure after bouncing firmly from the lower support zone. The recent candles are holding above the 42.90 area, while buyers are pushing toward the 43.60 resistance. A clean breakout and hold above this level could trigger the next upward move.
Entry Zone: 42.90–43.20
TP1: 43.80
TP2: 44.40
TP3: 45.00
#TZA #BullishSetup
BULLISH BREAKOUT SETUP
$TZA is showing a strong bullish structure after bouncing firmly from the lower support zone. The recent candles are holding above the 42.90 area, while buyers are pushing toward the 43.60 resistance. A clean breakout and hold above this level could trigger the next upward move.
Entry Zone: 42.90–43.20
TP1: 43.80
TP2: 44.40
TP3: 45.00
#TZA #BullishSetup
1
33

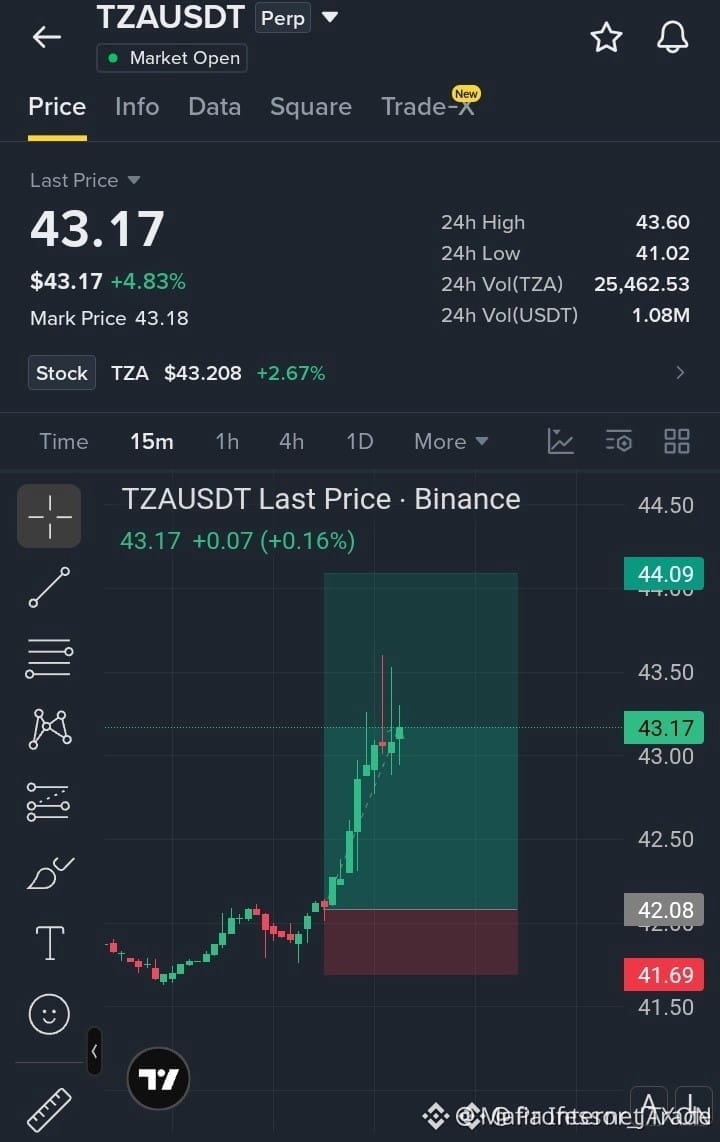
🚀 $TZA BREAKING THE $43 RESISTANCE ZONE – MOMENTUM ON FIRE!
Entry: $42.90–$43.20 ⚡
Target: $43.60 / $44.10 / $44.50 🚀
Stop Loss: $41.70 ⚠️
Buyers just ripped through the $42.90‑$43.20 corridor, flipping the last supply wall into fresh demand. 📊 The breakout is backed by a surge in 4‑hour volume, signaling that smart money is loading up ahead of the next resistance cluster.
Holding above $43.00 keeps the momentum train rolling toward the $43.60‑$44.50 ladder, where liquidity pools await hungry sellers. 🦈 Keep an eye on the order flow; a clean retest could lock in the upside swing.
💬 Are you riding this breakout or waiting for a deeper pullback? 👇
⚠️ Not financial advice. Always manage your risk. 🛡️
🏷️ #TZA #LongSetup #Breakout #Momentum #Crypto
🔥 💎
🚀 $TZA BREAKING THE $43 RESISTANCE ZONE – MOMENTUM ON FIRE!
Entry: $42.90–$43.20 ⚡
Target: $43.60 / $44.10 / $44.50 🚀
Stop Loss: $41.70 ⚠️
Buyers just ripped through the $42.90‑$43.20 corridor, flipping the last supply wall into fresh demand. 📊 The breakout is backed by a surge in 4‑hour volume, signaling that smart money is loading up ahead of the next resistance cluster.
Holding above $43.00 keeps the momentum train rolling toward the $43.60‑$44.50 ladder, where liquidity pools await hungry sellers. 🦈 Keep an eye on the order flow; a clean retest could lock in the upside swing.
💬 Are you riding this breakout or waiting for a deeper pullback? 👇
⚠️ Not financial advice. Always manage your risk. 🛡️
🏷️ #TZA #LongSetup #Breakout #Momentum #Crypto
🔥 💎
Entry: $42.90–$43.20 ⚡
Target: $43.60 / $44.10 / $44.50 🚀
Stop Loss: $41.70 ⚠️
Buyers just ripped through the $42.90‑$43.20 corridor, flipping the last supply wall into fresh demand. 📊 The breakout is backed by a surge in 4‑hour volume, signaling that smart money is loading up ahead of the next resistance cluster.
Holding above $43.00 keeps the momentum train rolling toward the $43.60‑$44.50 ladder, where liquidity pools await hungry sellers. 🦈 Keep an eye on the order flow; a clean retest could lock in the upside swing.
💬 Are you riding this breakout or waiting for a deeper pullback? 👇
⚠️ Not financial advice. Always manage your risk. 🛡️
🏷️ #TZA #LongSetup #Breakout #Momentum #Crypto
🔥 💎
17
·
--
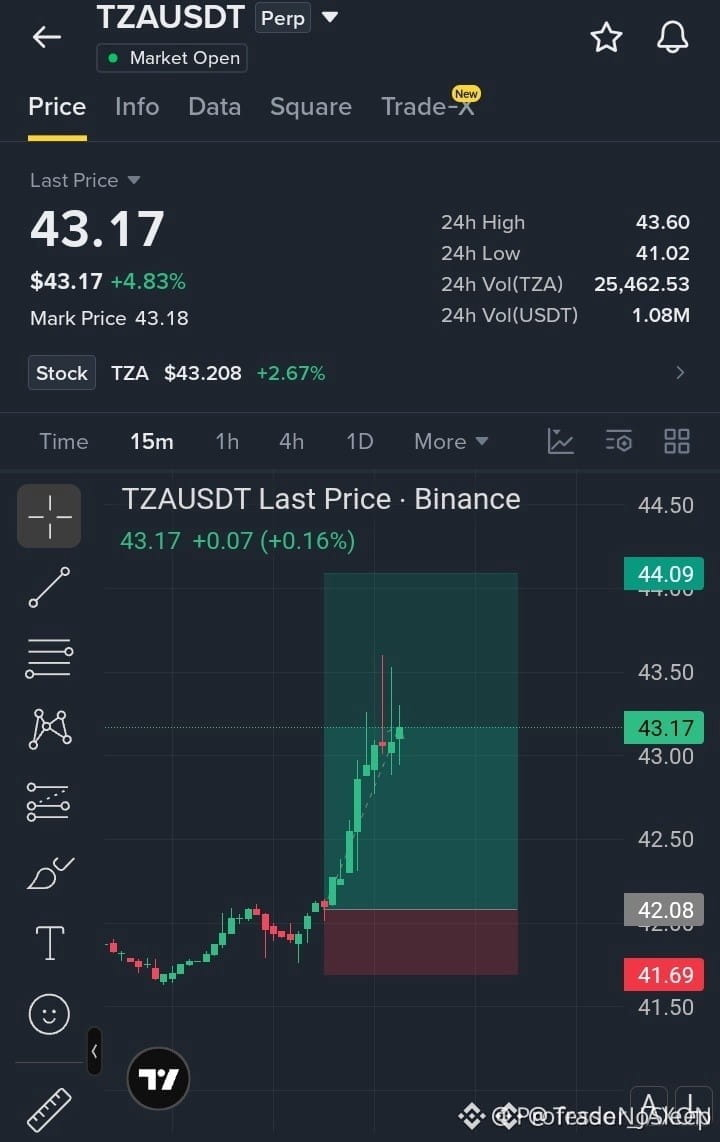
🚀 $TZA BREAKS $43 RESISTANCE INTO BULLISH ASCENT 📈
Entry: 42.90-43.20 ⚡
Target: 43.60 🚀
Stop Loss: 41.70 ⚠️
📊 The consolidation range dissolved as smart‑money liquidity was swept above $42.90, establishing a fresh order block that now serves as a demand anchor. ⚡ Volume is accelerating on the 4‑hour chart while RSI remains firmly bullish, indicating institutional accumulation.
📌 Holding above the $42.90‑$43.00 band sets the stage for a measured push toward the $43.60‑$44.50 ceiling, offering a tight risk‑reward profile for disciplined longs. 💬 Are you positioning for the next leg or waiting for a deeper pullback? 👇
⚠️ Not financial advice. Always manage your risk. 🛡️
🏷️ #TZA #LongSetup #Breakout #ETF #Crypto
🔥 💎
🚀 $TZA BREAKS $43 RESISTANCE INTO BULLISH ASCENT 📈
Entry: 42.90-43.20 ⚡
Target: 43.60 🚀
Stop Loss: 41.70 ⚠️
📊 The consolidation range dissolved as smart‑money liquidity was swept above $42.90, establishing a fresh order block that now serves as a demand anchor. ⚡ Volume is accelerating on the 4‑hour chart while RSI remains firmly bullish, indicating institutional accumulation.
📌 Holding above the $42.90‑$43.00 band sets the stage for a measured push toward the $43.60‑$44.50 ceiling, offering a tight risk‑reward profile for disciplined longs. 💬 Are you positioning for the next leg or waiting for a deeper pullback? 👇
⚠️ Not financial advice. Always manage your risk. 🛡️
🏷️ #TZA #LongSetup #Breakout #ETF #Crypto
🔥 💎
Entry: 42.90-43.20 ⚡
Target: 43.60 🚀
Stop Loss: 41.70 ⚠️
📊 The consolidation range dissolved as smart‑money liquidity was swept above $42.90, establishing a fresh order block that now serves as a demand anchor. ⚡ Volume is accelerating on the 4‑hour chart while RSI remains firmly bullish, indicating institutional accumulation.
📌 Holding above the $42.90‑$43.00 band sets the stage for a measured push toward the $43.60‑$44.50 ceiling, offering a tight risk‑reward profile for disciplined longs. 💬 Are you positioning for the next leg or waiting for a deeper pullback? 👇
⚠️ Not financial advice. Always manage your risk. 🛡️
🏷️ #TZA #LongSetup #Breakout #ETF #Crypto
🔥 💎
8

·
--
Bullish
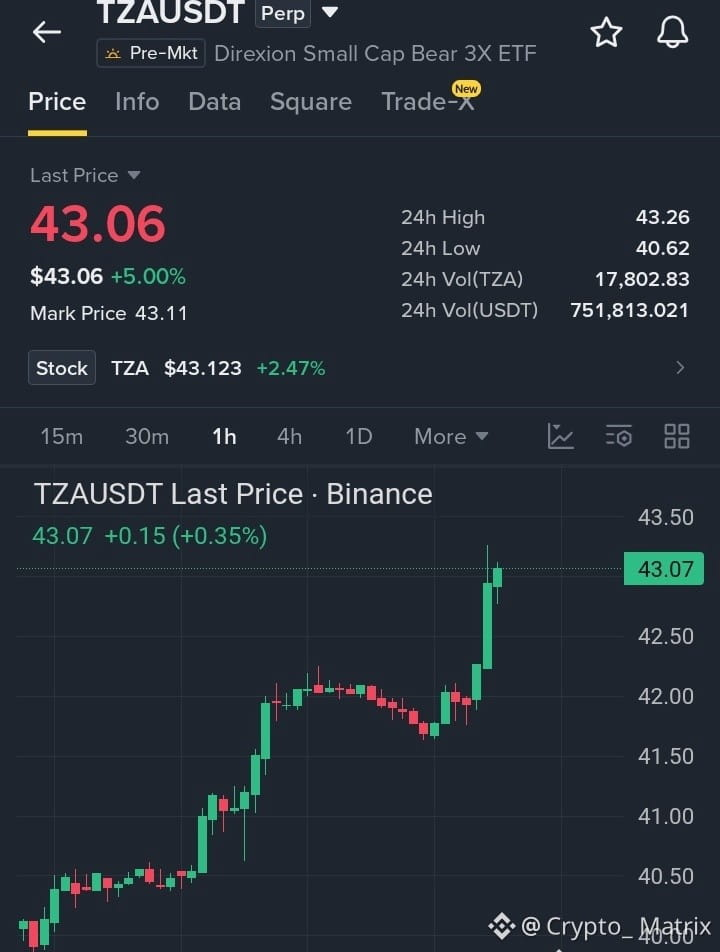
Could $TZA Be Preparing For Another Big Upward Move…!!
#TZA is displaying strong bullish momentum after breaking out from its recent consolidation range near the 42.00 level If this upward drive holds the next potential targets to keep an eye on are 43.50 and 44.20 while 40.62 remains key underlying support
{future}(TZAUSDT)
$NEWT
{future}(NEWTUSDT)
$TRUMP
{future}(TRUMPUSDT)
Could $TZA Be Preparing For Another Big Upward Move…!!
#TZA is displaying strong bullish momentum after breaking out from its recent consolidation range near the 42.00 level If this upward drive holds the next potential targets to keep an eye on are 43.50 and 44.20 while 40.62 remains key underlying support
$NEWT
$TRUMP
#TZA is displaying strong bullish momentum after breaking out from its recent consolidation range near the 42.00 level If this upward drive holds the next potential targets to keep an eye on are 43.50 and 44.20 while 40.62 remains key underlying support
$NEWT
$TRUMP
2
179
·
--
Bullish
Guys, I have just opened a long position on $TZA with 20x leverage....
#TZA is breaking out from a consolidation zone, with buyers pushing price toward the recent highs with strong momentum.
A break above $43.26 could open the way toward $44.00 → $45.00, while losing $42.00 may bring another pullback.
Entry: $42.50–$43.10
TP: $44.00 → $45.00 → $46.00
SL: $41.50
Buy and Trade
{future}(TZAUSDT)
$BULLA
{future}(BULLAUSDT)
$ZEC
{future}(ZECUSDT)
Guys, I have just opened a long position on $TZA with 20x leverage....
#TZA is breaking out from a consolidation zone, with buyers pushing price toward the recent highs with strong momentum.
A break above $43.26 could open the way toward $44.00 → $45.00, while losing $42.00 may bring another pullback.
Entry: $42.50–$43.10
TP: $44.00 → $45.00 → $46.00
SL: $41.50
Buy and Trade
$BULLA
$ZEC
#TZA is breaking out from a consolidation zone, with buyers pushing price toward the recent highs with strong momentum.
A break above $43.26 could open the way toward $44.00 → $45.00, while losing $42.00 may bring another pullback.
Entry: $42.50–$43.10
TP: $44.00 → $45.00 → $46.00
SL: $41.50
Buy and Trade
$BULLA
$ZEC

2
458
·
--
Bullish
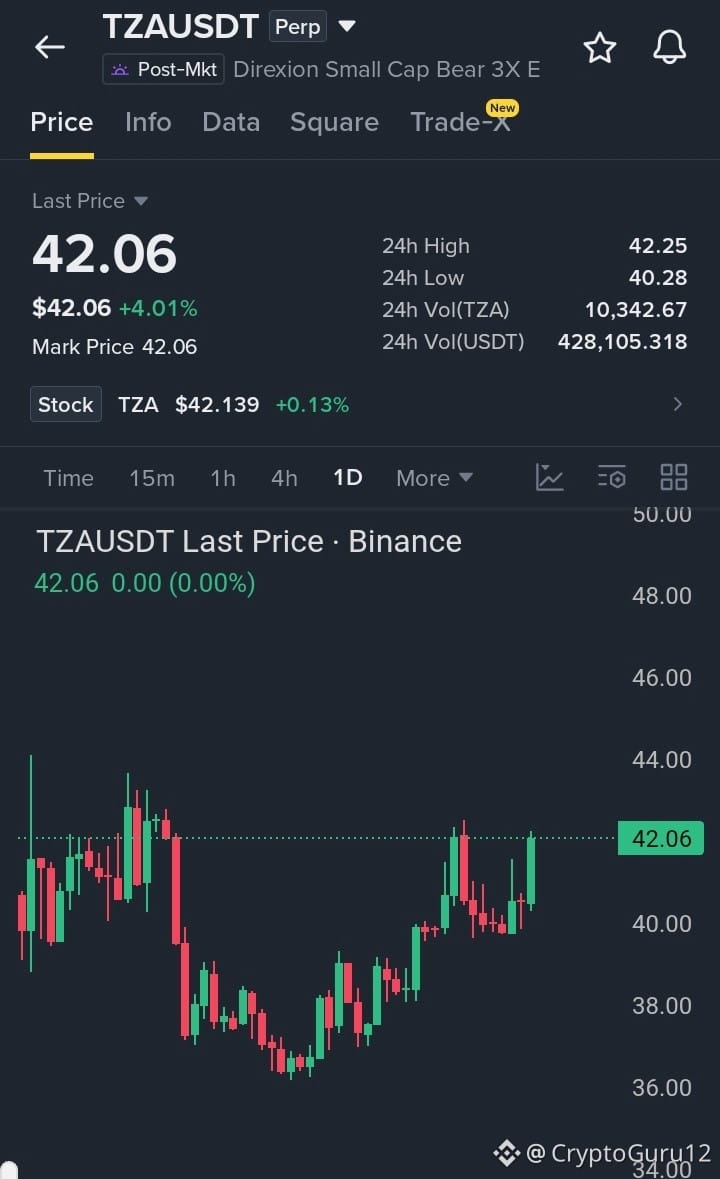
$TZA Breakout Setup Is Building... Buyers Testing Resistance
#TZA is showing strong recovery momentum on the 1D chart after reclaiming the $40 area. Price is now around $42.06 and pressing into the $42.25–$42.50 resistance zone.
A clean daily break above $42.50 could confirm continuation toward the next resistance levels. If price gets rejected and loses $40.00, the setup weakens.
Entry: $41.80–$42.20
TP1: $42.80
TP2: $43.50
TP3: $44.50
SL: $40.80
BUY
{future}(TZAUSDT)
$ZEC
{future}(ZECUSDT)
$IOST
{future}(IOSTUSDT)
$TZA Breakout Setup Is Building... Buyers Testing Resistance
#TZA is showing strong recovery momentum on the 1D chart after reclaiming the $40 area. Price is now around $42.06 and pressing into the $42.25–$42.50 resistance zone.
A clean daily break above $42.50 could confirm continuation toward the next resistance levels. If price gets rejected and loses $40.00, the setup weakens.
Entry: $41.80–$42.20
TP1: $42.80
TP2: $43.50
TP3: $44.50
SL: $40.80
BUY
$ZEC
$IOST
#TZA is showing strong recovery momentum on the 1D chart after reclaiming the $40 area. Price is now around $42.06 and pressing into the $42.25–$42.50 resistance zone.
A clean daily break above $42.50 could confirm continuation toward the next resistance levels. If price gets rejected and loses $40.00, the setup weakens.
Entry: $41.80–$42.20
TP1: $42.80
TP2: $43.50
TP3: $44.50
SL: $40.80
BUY
$ZEC
$IOST
2
407

·
--
[M1_mag7]
$TZA surged against the trend by 5.086% in the past 24 hours, and its current price is 41.94, yet the funding rate is holding steady at exactly zero—0000000000. When a leveraged product rises, you’d normally expect the long and short sides to pay each other, but on-chain perpetual contracts like this, that kind of “balanced” state is relatively uncommon.
Old dog took a look at its positioning: it’s an on-chain U.S.-stock perpetual contract linked to a 3x short Russell 2000 ETF. This type of product is inherently leveraged and directional, which is exactly where long/short competition should be the fiercest. Now that the funding rate is back to zero, it suggests longs haven’t been aggressively adding after the rally, and shorts haven’t been cornered into giving up.
Open interest is 19,373.05, and trading volume is 344,506.7282—these two figures don’t conflict. The market completed this leg up without showing signs of being overly crowded. This matches my view that the shorts are closing positions calmly, not getting forcibly squeezed. On a single signal basis, its price action has started to diverge from the broader market’s beta and is running on its own independent rhythm.
I judge that this is when on-chain capital’s concentrated bets on a pullback in U.S. small/mid caps begin to take effect. The problem, though, is that I currently can’t compare with secondary meme data from other benchmark coins, so I can’t confirm whether this is $TZA’s unique performance or whether the whole sector is turning. It’s outperforming, but the logic chain behind the leadership is missing a key link. For now, I’ll choose to observe follow-through. If $TZA’s price can hold above the current level and open interest increases moderately, I’ll consider a small entry near the previous high. Conversely, if the funding rate suddenly flips positive and the price stalls while failing to push higher, I’ll immediately retreat—because that would mean longs are starting to chase after the rally, and we’re likely not far from a near-term top.
The strongest counter-evidence is: this 5% rise might just be a technical rebound after the prior big selloff—the shorts didn’t really leave; they’re simply taking a break. Once the broader market stabilizes, $TZA could drop even harder. I disagree with this view for one reason: the funding rate is zero. If shorts were truly firm and longs were attacking aggressively, the funding rate should have turned negative already. With it at zero, it looks more like shorts are advancing and retreating rather than being locked in for a fight.
Next step: if $TZA continues to maintain this independent strength, it may attract a group of on-chain traders positioning for a U.S. stocks pullback to crowd together. Its open interest would rise, and only then might the funding rate be pushed positive. At that point, the risk of longs becoming crowded would truly emerge. The cost will be borne by the last batch of late buyers who chase entries.
Trading tag: #BinanceFutures #TradFi #USDⓈM #TZA #TZAUSDT $TZA
[M1_mag7]
$TZA surged against the trend by 5.086% in the past 24 hours, and its current price is 41.94, yet the funding rate is holding steady at exactly zero—0000000000. When a leveraged product rises, you’d normally expect the long and short sides to pay each other, but on-chain perpetual contracts like this, that kind of “balanced” state is relatively uncommon.
Old dog took a look at its positioning: it’s an on-chain U.S.-stock perpetual contract linked to a 3x short Russell 2000 ETF. This type of product is inherently leveraged and directional, which is exactly where long/short competition should be the fiercest. Now that the funding rate is back to zero, it suggests longs haven’t been aggressively adding after the rally, and shorts haven’t been cornered into giving up.
Open interest is 19,373.05, and trading volume is 344,506.7282—these two figures don’t conflict. The market completed this leg up without showing signs of being overly crowded. This matches my view that the shorts are closing positions calmly, not getting forcibly squeezed. On a single signal basis, its price action has started to diverge from the broader market’s beta and is running on its own independent rhythm.
I judge that this is when on-chain capital’s concentrated bets on a pullback in U.S. small/mid caps begin to take effect. The problem, though, is that I currently can’t compare with secondary meme data from other benchmark coins, so I can’t confirm whether this is $TZA ’s unique performance or whether the whole sector is turning. It’s outperforming, but the logic chain behind the leadership is missing a key link. For now, I’ll choose to observe follow-through. If $TZA ’s price can hold above the current level and open interest increases moderately, I’ll consider a small entry near the previous high. Conversely, if the funding rate suddenly flips positive and the price stalls while failing to push higher, I’ll immediately retreat—because that would mean longs are starting to chase after the rally, and we’re likely not far from a near-term top.
The strongest counter-evidence is: this 5% rise might just be a technical rebound after the prior big selloff—the shorts didn’t really leave; they’re simply taking a break. Once the broader market stabilizes, $TZA could drop even harder. I disagree with this view for one reason: the funding rate is zero. If shorts were truly firm and longs were attacking aggressively, the funding rate should have turned negative already. With it at zero, it looks more like shorts are advancing and retreating rather than being locked in for a fight.
Next step: if $TZA continues to maintain this independent strength, it may attract a group of on-chain traders positioning for a U.S. stocks pullback to crowd together. Its open interest would rise, and only then might the funding rate be pushed positive. At that point, the risk of longs becoming crowded would truly emerge. The cost will be borne by the last batch of late buyers who chase entries.
Trading tag: #BinanceFutures #TradFi #USDⓈM #TZA #TZAUSDT $TZA
$TZA surged against the trend by 5.086% in the past 24 hours, and its current price is 41.94, yet the funding rate is holding steady at exactly zero—0000000000. When a leveraged product rises, you’d normally expect the long and short sides to pay each other, but on-chain perpetual contracts like this, that kind of “balanced” state is relatively uncommon.
Old dog took a look at its positioning: it’s an on-chain U.S.-stock perpetual contract linked to a 3x short Russell 2000 ETF. This type of product is inherently leveraged and directional, which is exactly where long/short competition should be the fiercest. Now that the funding rate is back to zero, it suggests longs haven’t been aggressively adding after the rally, and shorts haven’t been cornered into giving up.
Open interest is 19,373.05, and trading volume is 344,506.7282—these two figures don’t conflict. The market completed this leg up without showing signs of being overly crowded. This matches my view that the shorts are closing positions calmly, not getting forcibly squeezed. On a single signal basis, its price action has started to diverge from the broader market’s beta and is running on its own independent rhythm.
I judge that this is when on-chain capital’s concentrated bets on a pullback in U.S. small/mid caps begin to take effect. The problem, though, is that I currently can’t compare with secondary meme data from other benchmark coins, so I can’t confirm whether this is $TZA ’s unique performance or whether the whole sector is turning. It’s outperforming, but the logic chain behind the leadership is missing a key link. For now, I’ll choose to observe follow-through. If $TZA ’s price can hold above the current level and open interest increases moderately, I’ll consider a small entry near the previous high. Conversely, if the funding rate suddenly flips positive and the price stalls while failing to push higher, I’ll immediately retreat—because that would mean longs are starting to chase after the rally, and we’re likely not far from a near-term top.
The strongest counter-evidence is: this 5% rise might just be a technical rebound after the prior big selloff—the shorts didn’t really leave; they’re simply taking a break. Once the broader market stabilizes, $TZA could drop even harder. I disagree with this view for one reason: the funding rate is zero. If shorts were truly firm and longs were attacking aggressively, the funding rate should have turned negative already. With it at zero, it looks more like shorts are advancing and retreating rather than being locked in for a fight.
Next step: if $TZA continues to maintain this independent strength, it may attract a group of on-chain traders positioning for a U.S. stocks pullback to crowd together. Its open interest would rise, and only then might the funding rate be pushed positive. At that point, the risk of longs becoming crowded would truly emerge. The cost will be borne by the last batch of late buyers who chase entries.
Trading tag: #BinanceFutures #TradFi #USDⓈM #TZA #TZAUSDT $TZA
30
·
--
$TZA over the past 24 hours has risen 2.359%, with the price staying pinned around $40.78. Trading volume is 558,000, not a breakout-level spike. The funding rate has stayed steadily at zero—neither longs nor shorts have paid the other.
A funding rate of zero in on-chain contracts isn’t very common. It suggests the market currently has no clear one-sided pressure: it’s neither like a positive funding rate where longs pay to push higher, nor like a negative funding rate where shorts actively look to open positions. Open interest is close to 20,000 contracts, and paired with this neutral funding rate, it indicates most of the existing positions are in a wait-and-see or balanced state—no side has been cornered and forced into liquidation. This ~2% up move looks more like a gentle push from existing liquidity rather than fresh FOMO from new long entries.
The old dog’s take is that $TZA has entered a short-term neutral consolidation range. My move is to wait—not to just watch, but to wait for a clearer signal. If the price breaks above $42 with increased volume and the funding rate turns positive, I’ll consider following. Conversely, if it breaks below $40.5, I’ll cut part of my position. With the funding rate currently at zero, I’m choosing to observe with less than half exposure.
The biggest risk with this view is an external shock.
Trading tag: #BinanceFutures #TradFi #USDⓈM #TZA #TZAUSDT $TZA
$TZA over the past 24 hours has risen 2.359%, with the price staying pinned around $40.78. Trading volume is 558,000, not a breakout-level spike. The funding rate has stayed steadily at zero—neither longs nor shorts have paid the other.
A funding rate of zero in on-chain contracts isn’t very common. It suggests the market currently has no clear one-sided pressure: it’s neither like a positive funding rate where longs pay to push higher, nor like a negative funding rate where shorts actively look to open positions. Open interest is close to 20,000 contracts, and paired with this neutral funding rate, it indicates most of the existing positions are in a wait-and-see or balanced state—no side has been cornered and forced into liquidation. This ~2% up move looks more like a gentle push from existing liquidity rather than fresh FOMO from new long entries.
The old dog’s take is that $TZA has entered a short-term neutral consolidation range. My move is to wait—not to just watch, but to wait for a clearer signal. If the price breaks above $42 with increased volume and the funding rate turns positive, I’ll consider following. Conversely, if it breaks below $40.5, I’ll cut part of my position. With the funding rate currently at zero, I’m choosing to observe with less than half exposure.
The biggest risk with this view is an external shock.
Trading tag: #BinanceFutures #TradFi #USDⓈM #TZA #TZAUSDT $TZA
A funding rate of zero in on-chain contracts isn’t very common. It suggests the market currently has no clear one-sided pressure: it’s neither like a positive funding rate where longs pay to push higher, nor like a negative funding rate where shorts actively look to open positions. Open interest is close to 20,000 contracts, and paired with this neutral funding rate, it indicates most of the existing positions are in a wait-and-see or balanced state—no side has been cornered and forced into liquidation. This ~2% up move looks more like a gentle push from existing liquidity rather than fresh FOMO from new long entries.
The old dog’s take is that $TZA has entered a short-term neutral consolidation range. My move is to wait—not to just watch, but to wait for a clearer signal. If the price breaks above $42 with increased volume and the funding rate turns positive, I’ll consider following. Conversely, if it breaks below $40.5, I’ll cut part of my position. With the funding rate currently at zero, I’m choosing to observe with less than half exposure.
The biggest risk with this view is an external shock.
Trading tag: #BinanceFutures #TradFi #USDⓈM #TZA #TZAUSDT $TZA
7
·
--
Old dog glanced at $TZA: in the past 24 hours it rose by 2.131%, and the price reached 40.74, but the funding rate is zero. This zero-fee rate is more interesting than the up-and-down itself—it means neither the long nor the short side has to pay the other right now, and the market is in a standoff phase.
From the perspective of M4_mover’s sudden activity, the price is nudged upward but the funding stays completely still. That looks more like retail players testing the waters rather than big money launching a coordinated, directional assault.
Trading tag: #BinanceFutures #TradFi #USDⓈM #TZA #TZAUSDT $TZA
Old dog glanced at $TZA : in the past 24 hours it rose by 2.131%, and the price reached 40.74, but the funding rate is zero. This zero-fee rate is more interesting than the up-and-down itself—it means neither the long nor the short side has to pay the other right now, and the market is in a standoff phase.
From the perspective of M4_mover’s sudden activity, the price is nudged upward but the funding stays completely still. That looks more like retail players testing the waters rather than big money launching a coordinated, directional assault.
Trading tag: #BinanceFutures #TradFi #USDⓈM #TZA #TZAUSDT $TZA
From the perspective of M4_mover’s sudden activity, the price is nudged upward but the funding stays completely still. That looks more like retail players testing the waters rather than big money launching a coordinated, directional assault.
Trading tag: #BinanceFutures #TradFi #USDⓈM #TZA #TZAUSDT $TZA

·
--
$TZA rose 2.385% over the past 24 hours, and the funding rate has stayed at 0.00010470. This small bullish candle is set against a slightly tighter geopolitical backdrop.
Key judgment: The current geopolitical tension is boosting demand for safe-haven assets. As a tool for shorting small-cap U.S. stocks, $TZA’s price-and-funding-rate combination suggests buyers are entering, but sentiment hasn’t become overheated yet.
The evidence chain hinges on these two numbers: a 2.385% price increase indicates there are buy orders, while a funding rate of 0.00010470 is positive but its absolute value is extremely low—meaning the leveraged long side’s cost is almost negligible. This is different from crowded conditions where the funding rate is pushed up to a few per mille; longs haven’t gone crazy. Open interest is 19,674; combined with this price level and trading volume, it falls within a normal activity range.
The strongest counterargument is: geopolitical risk events often come in pulse-like bursts. If the situation eases suddenly over the weekend and U.S. stock index futures rebound, $TZA would quickly give back its gains because the underlying it shorts has long-term decay.
Second-order impact: if the geopolitical event continues to escalate, volatility in U.S. equities would rise. That would force more capital to seek hedging tools, potentially lifting positions in inverse ETFs like $TZA.
Trading tag: #TradFi #链上美股 #TZA
Where do you think this thesis is most likely to be wrong?
$TZA rose 2.385% over the past 24 hours, and the funding rate has stayed at 0.00010470. This small bullish candle is set against a slightly tighter geopolitical backdrop.
Key judgment: The current geopolitical tension is boosting demand for safe-haven assets. As a tool for shorting small-cap U.S. stocks, $TZA ’s price-and-funding-rate combination suggests buyers are entering, but sentiment hasn’t become overheated yet.
The evidence chain hinges on these two numbers: a 2.385% price increase indicates there are buy orders, while a funding rate of 0.00010470 is positive but its absolute value is extremely low—meaning the leveraged long side’s cost is almost negligible. This is different from crowded conditions where the funding rate is pushed up to a few per mille; longs haven’t gone crazy. Open interest is 19,674; combined with this price level and trading volume, it falls within a normal activity range.
The strongest counterargument is: geopolitical risk events often come in pulse-like bursts. If the situation eases suddenly over the weekend and U.S. stock index futures rebound, $TZA would quickly give back its gains because the underlying it shorts has long-term decay.
Second-order impact: if the geopolitical event continues to escalate, volatility in U.S. equities would rise. That would force more capital to seek hedging tools, potentially lifting positions in inverse ETFs like $TZA .
Trading tag: #TradFi #链上美股 #TZA
Where do you think this thesis is most likely to be wrong?
Key judgment: The current geopolitical tension is boosting demand for safe-haven assets. As a tool for shorting small-cap U.S. stocks, $TZA ’s price-and-funding-rate combination suggests buyers are entering, but sentiment hasn’t become overheated yet.
The evidence chain hinges on these two numbers: a 2.385% price increase indicates there are buy orders, while a funding rate of 0.00010470 is positive but its absolute value is extremely low—meaning the leveraged long side’s cost is almost negligible. This is different from crowded conditions where the funding rate is pushed up to a few per mille; longs haven’t gone crazy. Open interest is 19,674; combined with this price level and trading volume, it falls within a normal activity range.
The strongest counterargument is: geopolitical risk events often come in pulse-like bursts. If the situation eases suddenly over the weekend and U.S. stock index futures rebound, $TZA would quickly give back its gains because the underlying it shorts has long-term decay.
Second-order impact: if the geopolitical event continues to escalate, volatility in U.S. equities would rise. That would force more capital to seek hedging tools, potentially lifting positions in inverse ETFs like $TZA .
Trading tag: #TradFi #链上美股 #TZA
Where do you think this thesis is most likely to be wrong?
25
·
--
$TZA 24 hours up 2.385%, quote 40.79, open interest 19674.73. As a 3x bearish small-cap ETF, this trend is directly linked to how geopolitical risk is priced.
Core view: The safe-haven sentiment hasn’t been fully priced in yet, and TZA can still rise. Evidence: the funding rate is 0.00010470 and positive—bulls are paying, which suggests the number of people betting that small caps will stay strong is increasing and costs are rising. Meanwhile, open interest hasn’t dropped meaningfully, indicating new longs are stepping in to buy.
When political and military tensions heat up, capital tends to flow instinctively toward tools that short high-beta assets.
Strongest counterargument: If the geopolitical conflict de-escalates quickly, or if the market concludes the Fed will turn more dovish, risk appetite could snap back, and a small-cap rebound would directly squeeze TZA shorts. Even if bulls are crowded, they may be betting on de-escalation.
Second-order effects: If the conflict escalates, anyone chasing longs in small-cap funds will be forced to cut exposure, and the shorting instruments will absorb the hedging demand. Once things de-escalate, all the chase-long money in TZA will get trapped at the top.
Invalidation conditions: If TZA breaks above 41.5 or falls below 38.5, the current view is invalid.
Action: Start with a small short position; set the stop-loss at 41.5. Don’t chase—wait for clearer geopolitical signals.
Trade tag: #TradFi #链上美股 #TZA
Where do you think this thesis is most likely to be wrong?
$TZA 24 hours up 2.385%, quote 40.79, open interest 19674.73. As a 3x bearish small-cap ETF, this trend is directly linked to how geopolitical risk is priced.
Core view: The safe-haven sentiment hasn’t been fully priced in yet, and TZA can still rise. Evidence: the funding rate is 0.00010470 and positive—bulls are paying, which suggests the number of people betting that small caps will stay strong is increasing and costs are rising. Meanwhile, open interest hasn’t dropped meaningfully, indicating new longs are stepping in to buy.
When political and military tensions heat up, capital tends to flow instinctively toward tools that short high-beta assets.
Strongest counterargument: If the geopolitical conflict de-escalates quickly, or if the market concludes the Fed will turn more dovish, risk appetite could snap back, and a small-cap rebound would directly squeeze TZA shorts. Even if bulls are crowded, they may be betting on de-escalation.
Second-order effects: If the conflict escalates, anyone chasing longs in small-cap funds will be forced to cut exposure, and the shorting instruments will absorb the hedging demand. Once things de-escalate, all the chase-long money in TZA will get trapped at the top.
Invalidation conditions: If TZA breaks above 41.5 or falls below 38.5, the current view is invalid.
Action: Start with a small short position; set the stop-loss at 41.5. Don’t chase—wait for clearer geopolitical signals.
Trade tag: #TradFi #链上美股 #TZA
Where do you think this thesis is most likely to be wrong?
Core view: The safe-haven sentiment hasn’t been fully priced in yet, and TZA can still rise. Evidence: the funding rate is 0.00010470 and positive—bulls are paying, which suggests the number of people betting that small caps will stay strong is increasing and costs are rising. Meanwhile, open interest hasn’t dropped meaningfully, indicating new longs are stepping in to buy.
When political and military tensions heat up, capital tends to flow instinctively toward tools that short high-beta assets.
Strongest counterargument: If the geopolitical conflict de-escalates quickly, or if the market concludes the Fed will turn more dovish, risk appetite could snap back, and a small-cap rebound would directly squeeze TZA shorts. Even if bulls are crowded, they may be betting on de-escalation.
Second-order effects: If the conflict escalates, anyone chasing longs in small-cap funds will be forced to cut exposure, and the shorting instruments will absorb the hedging demand. Once things de-escalate, all the chase-long money in TZA will get trapped at the top.
Invalidation conditions: If TZA breaks above 41.5 or falls below 38.5, the current view is invalid.
Action: Start with a small short position; set the stop-loss at 41.5. Don’t chase—wait for clearer geopolitical signals.
Trade tag: #TradFi #链上美股 #TZA
Where do you think this thesis is most likely to be wrong?
6
·
--
$TZA In the past 24 hours, it rose 2.385%. Current price: 40.79. Funding rate: 0.00010470. Longs are paying fees to shorts; the price is rising but the funding rate is positive. This is a typical signal of chasing costs accumulating.
The last time we saw this kind of structure—price rising while the funding rate was positive—longs supported it for three days before getting squeezed and blown up. Now there are 19,674.73 open contracts, and open interest hasn’t shrunk noticeably, which suggests longs haven’t run yet—they’re still holding and enduring the funding rate while waiting for a breakout.
Shorts’ costs are not high, and longs pay every day. If the price goes sideways or makes a slight pullback, the pressure on longs to hold positions will increase exponentially. Don’t chase longs now—wait for two signals: either the funding rate spikes above 0.0003 and I’ll consider switching to short, or the price strongly breaks above the previous high and the funding rate drops, and then I’ll go long. If neither happens, just watch.
Trading tag: #TradFi #链上美股 #TZA
Where do you think this analysis is most likely to be wrong?
$TZA In the past 24 hours, it rose 2.385%. Current price: 40.79. Funding rate: 0.00010470. Longs are paying fees to shorts; the price is rising but the funding rate is positive. This is a typical signal of chasing costs accumulating.
The last time we saw this kind of structure—price rising while the funding rate was positive—longs supported it for three days before getting squeezed and blown up. Now there are 19,674.73 open contracts, and open interest hasn’t shrunk noticeably, which suggests longs haven’t run yet—they’re still holding and enduring the funding rate while waiting for a breakout.
Shorts’ costs are not high, and longs pay every day. If the price goes sideways or makes a slight pullback, the pressure on longs to hold positions will increase exponentially. Don’t chase longs now—wait for two signals: either the funding rate spikes above 0.0003 and I’ll consider switching to short, or the price strongly breaks above the previous high and the funding rate drops, and then I’ll go long. If neither happens, just watch.
Trading tag: #TradFi #链上美股 #TZA
Where do you think this analysis is most likely to be wrong?
The last time we saw this kind of structure—price rising while the funding rate was positive—longs supported it for three days before getting squeezed and blown up. Now there are 19,674.73 open contracts, and open interest hasn’t shrunk noticeably, which suggests longs haven’t run yet—they’re still holding and enduring the funding rate while waiting for a breakout.
Shorts’ costs are not high, and longs pay every day. If the price goes sideways or makes a slight pullback, the pressure on longs to hold positions will increase exponentially. Don’t chase longs now—wait for two signals: either the funding rate spikes above 0.0003 and I’ll consider switching to short, or the price strongly breaks above the previous high and the funding rate drops, and then I’ll go long. If neither happens, just watch.
Trading tag: #TradFi #链上美股 #TZA
Where do you think this analysis is most likely to be wrong?
15
Log in to explore more content
Join global crypto users on Binance Square
⚡️ Get latest and useful information about crypto.
💬 Trusted by the world’s largest crypto exchange.
👍 Discover real insights from verified creators.
Email / Phone number
Trending Topics
1
#BinanceWillListHyperliquid(HYPE)
117,698 views
2,314 Discussing
2
#FedOctoberRateHikeOddsRiseTo69.7%
34,512 views
925 Discussing
3
#BitcoinFallsBelow$83,000
3,494 views
20 Discussing
4
#BitcoinFallsToAround$84,600ThisWeek
0 views
0 Discussing
5
#US30YearYieldHighestSince2004
29,661 views
730 Discussing
6
#ETHBreaksAbove$2,700
1,548 views
19 Discussing
7
#USWeighsPromotingDollarStablecoinsAbroad
63,993 views
1,621 Discussing
8
#US10YTreasuryYieldHits19YearHigh
65,597 views
1,310 Discussing
9
#SpotBitcoinETFsInflow$2.31BInFourDays
7,373 views
79 Discussing
10
#BitcoinRejectedAt$87,300Twice
0 views
0 Discussing