
#sp500nasdaqbreak200wmainbtcfirstsince2012
sp500nasdaqbreak200wmainbtcfirstsince2012
39,429 views
266 Discussing
Hot
Latest

·
--
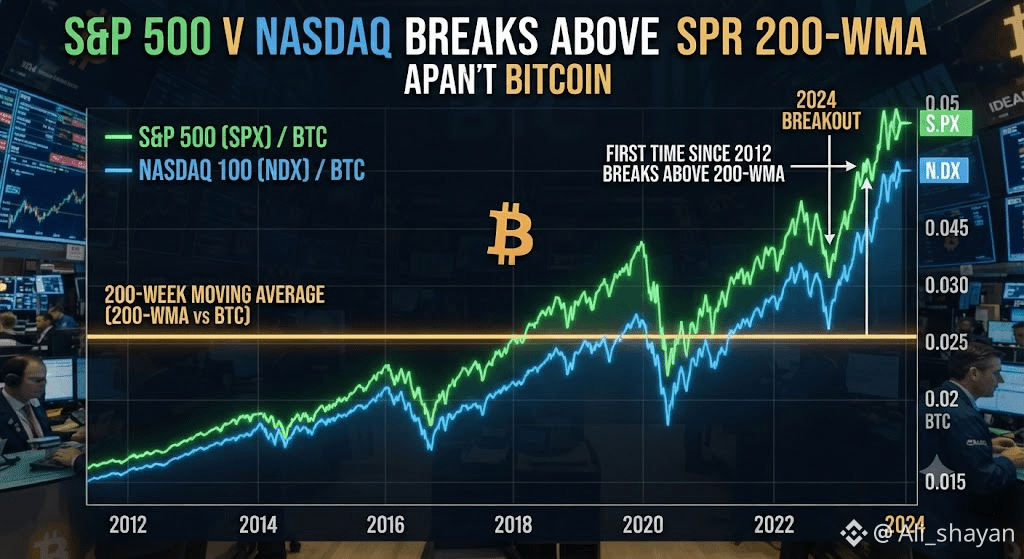
#sp500nasdaqbreak200wmainbtcfirstsince2012 The S&P 500 and Nasdaq indexes just did something they have not done in fourteen years. When measured against Bitcoin, both stock markets broke above their 200-week moving averages. Back in 2012, this same technical level used to act like a wall that stopped every market rally. Breaking past it now shows a huge shift in how traditional stocks are performing compared to crypto. Analysts are watching closely to see what happens next.
CLICK BELOW TO TRADE : $BTC $ETH $VANRY
{future}(VANRYUSDT)
{future}(ETHUSDT)
{future}(BTCUSDT)
#sp500nasdaqbreak200wmainbtcfirstsince2012 The S&P 500 and Nasdaq indexes just did something they have not done in fourteen years. When measured against Bitcoin, both stock markets broke above their 200-week moving averages. Back in 2012, this same technical level used to act like a wall that stopped every market rally. Breaking past it now shows a huge shift in how traditional stocks are performing compared to crypto. Analysts are watching closely to see what happens next.
CLICK BELOW TO TRADE : $BTC $ETH $VANRY
CLICK BELOW TO TRADE : $BTC $ETH $VANRY
1
2.9k

Historic Shift: S&P 500 & Nasdaq Break 200-WMA (Priced in BTC)
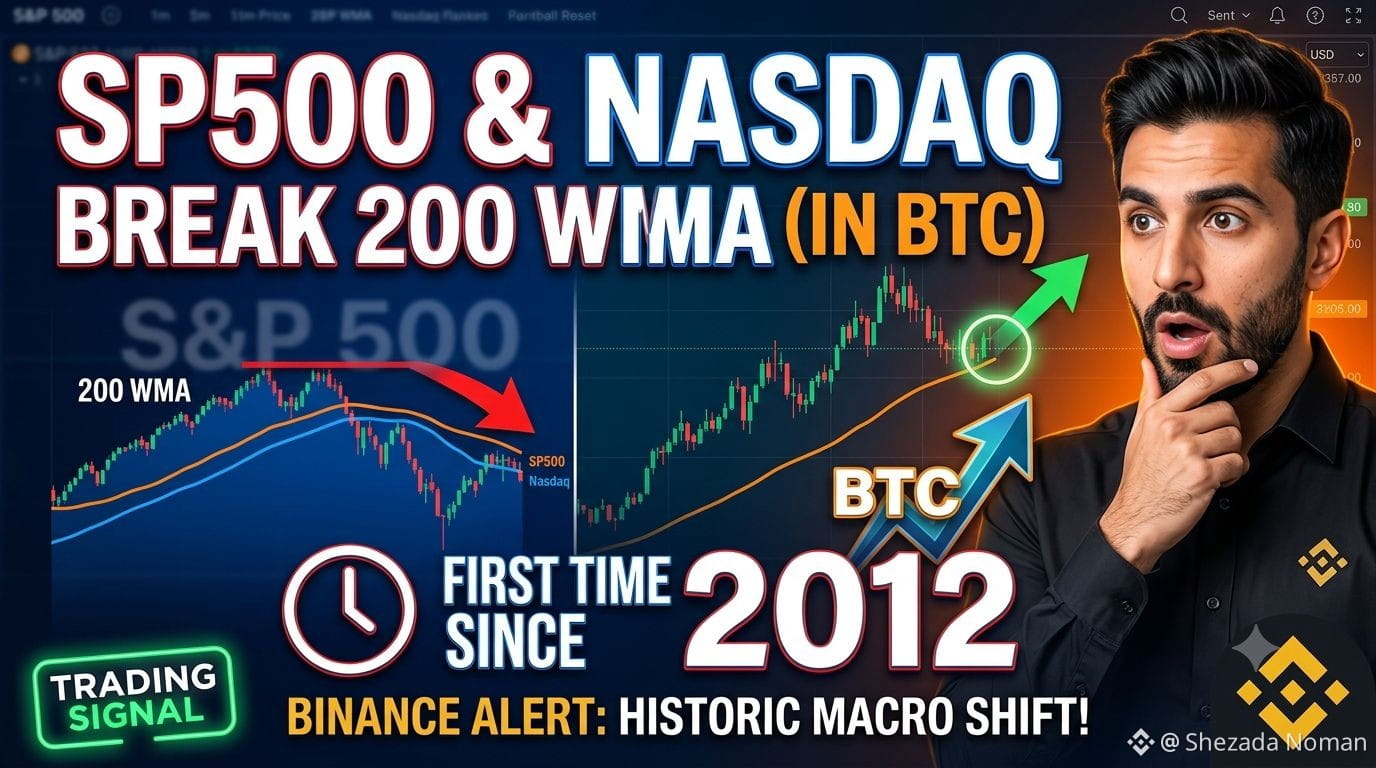
For the first time since 2012, the S&P 500 and Nasdaq indices (denominated in Bitcoin) have broken above their 200-week moving averages (200 WMA). Historically, this macro level acted as a firm ceiling, capping traditional stock outperformance against BTC for over a decade.
Macro Signal: TradFi equities are displaying strong relative strength against BTC on long-term timeframes.
Decade-First Event: This break flips a resistance barrier that has held firm since Bitcoin's earliest market cycles.
Trader Focus: Watch how BTC/USD responds near key support levels as capital flows balance between global equities and crypto assets.
Is this a temporary macro divergence before a major $BTC breakout, or are equities signaling a multi-year shift? Drop your thoughts below! 👇
{future}(BTCUSDT)
#SP500NasdaqBreak200WMAInBTCFirstSince2012
Historic Shift: S&P 500 & Nasdaq Break 200-WMA (Priced in BTC)
For the first time since 2012, the S&P 500 and Nasdaq indices (denominated in Bitcoin) have broken above their 200-week moving averages (200 WMA). Historically, this macro level acted as a firm ceiling, capping traditional stock outperformance against BTC for over a decade.
Macro Signal: TradFi equities are displaying strong relative strength against BTC on long-term timeframes.
Decade-First Event: This break flips a resistance barrier that has held firm since Bitcoin's earliest market cycles.
Trader Focus: Watch how BTC/USD responds near key support levels as capital flows balance between global equities and crypto assets.
Is this a temporary macro divergence before a major $BTC breakout, or are equities signaling a multi-year shift? Drop your thoughts below! 👇
#SP500NasdaqBreak200WMAInBTCFirstSince2012
For the first time since 2012, the S&P 500 and Nasdaq indices (denominated in Bitcoin) have broken above their 200-week moving averages (200 WMA). Historically, this macro level acted as a firm ceiling, capping traditional stock outperformance against BTC for over a decade.
Macro Signal: TradFi equities are displaying strong relative strength against BTC on long-term timeframes.
Decade-First Event: This break flips a resistance barrier that has held firm since Bitcoin's earliest market cycles.
Trader Focus: Watch how BTC/USD responds near key support levels as capital flows balance between global equities and crypto assets.
Is this a temporary macro divergence before a major $BTC breakout, or are equities signaling a multi-year shift? Drop your thoughts below! 👇
#SP500NasdaqBreak200WMAInBTCFirstSince2012
75

·
--
𝐈𝐬 𝐡𝐢𝐬𝐭𝐨𝐫𝐲 𝐫𝐞𝐩𝐞𝐚𝐭𝐢𝐧𝐠 𝐢𝐭𝐬𝐞𝐥𝐟?
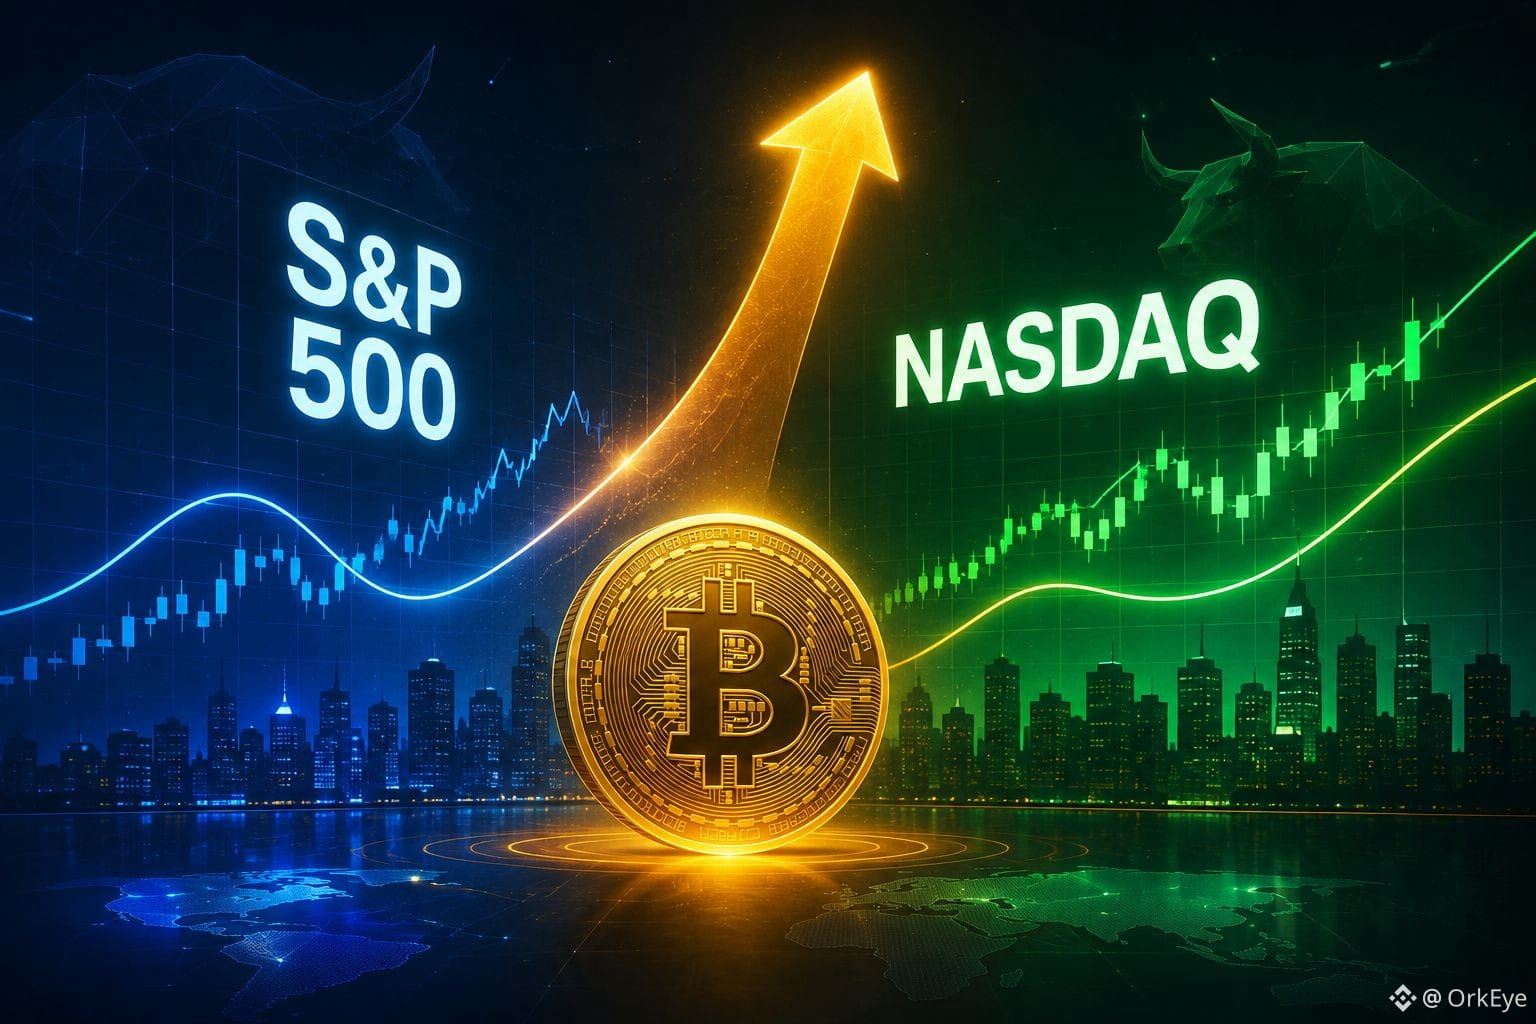
For the first time since 2012, both the S&P 500 and Nasdaq have climbed back above their 200-week moving averages while Bitcoin continues to hold strong in the broader market cycle. This rare combination is catching the attention of investors across both traditional finance and crypto.
Key Highlights:
📈 S&P 500 breaks above its 200-week MA.
🚀 Nasdaq also reclaims the 200-week MA.
₿ First time since 2012 this has happened alongside Bitcoin's current market cycle.
💰 Growing confidence is returning to both equities and digital assets.
👀 Could this be the beginning of another long-term bullish phase?
Markets never move in a straight line, but moments like these remind us why it's important to watch long-term trends instead of daily noise.
What do you think—does this signal more upside for Bitcoin and the broader market, or is caution still the best strategy?
{spot}(BTCUSDT)
#sp500nasdaqbreak200wmainbtcfirstsince2012
𝐈𝐬 𝐡𝐢𝐬𝐭𝐨𝐫𝐲 𝐫𝐞𝐩𝐞𝐚𝐭𝐢𝐧𝐠 𝐢𝐭𝐬𝐞𝐥𝐟?
For the first time since 2012, both the S&P 500 and Nasdaq have climbed back above their 200-week moving averages while Bitcoin continues to hold strong in the broader market cycle. This rare combination is catching the attention of investors across both traditional finance and crypto.
Key Highlights:
📈 S&P 500 breaks above its 200-week MA.
🚀 Nasdaq also reclaims the 200-week MA.
₿ First time since 2012 this has happened alongside Bitcoin's current market cycle.
💰 Growing confidence is returning to both equities and digital assets.
👀 Could this be the beginning of another long-term bullish phase?
Markets never move in a straight line, but moments like these remind us why it's important to watch long-term trends instead of daily noise.
What do you think—does this signal more upside for Bitcoin and the broader market, or is caution still the best strategy?
#sp500nasdaqbreak200wmainbtcfirstsince2012
For the first time since 2012, both the S&P 500 and Nasdaq have climbed back above their 200-week moving averages while Bitcoin continues to hold strong in the broader market cycle. This rare combination is catching the attention of investors across both traditional finance and crypto.
Key Highlights:
📈 S&P 500 breaks above its 200-week MA.
🚀 Nasdaq also reclaims the 200-week MA.
₿ First time since 2012 this has happened alongside Bitcoin's current market cycle.
💰 Growing confidence is returning to both equities and digital assets.
👀 Could this be the beginning of another long-term bullish phase?
Markets never move in a straight line, but moments like these remind us why it's important to watch long-term trends instead of daily noise.
What do you think—does this signal more upside for Bitcoin and the broader market, or is caution still the best strategy?
#sp500nasdaqbreak200wmainbtcfirstsince2012
774

·
--
Bullish
#sp500nasdaqbreak200wmainbtcfirstsince2012
🚨A historic milestone: the S&P 500 and Nasdaq have broken above their 200-week moving averages when measured in Bitcoin for the first time since 2012.
📈 Why it matters:
• Stocks are outperforming BTC on a long-term relative basis.
• Signals a major shift in cross-market momentum.
• Investors are closely watching whether Bitcoin can regain leadership.
• The next few weeks could be crucial for both equities and crypto.
Market leadership never stays the same forever. The key question is whether this marks the start of a new trend—or a temporary rotation before Bitcoin fights back.
💬 Is this the beginning of a new era for stocks, or will Bitcoin reclaim its dominance?
#bitcoin #SP500 #NASDAQ
#sp500nasdaqbreak200wmainbtcfirstsince2012
🚨A historic milestone: the S&P 500 and Nasdaq have broken above their 200-week moving averages when measured in Bitcoin for the first time since 2012.
📈 Why it matters:
• Stocks are outperforming BTC on a long-term relative basis.
• Signals a major shift in cross-market momentum.
• Investors are closely watching whether Bitcoin can regain leadership.
• The next few weeks could be crucial for both equities and crypto.
Market leadership never stays the same forever. The key question is whether this marks the start of a new trend—or a temporary rotation before Bitcoin fights back.
💬 Is this the beginning of a new era for stocks, or will Bitcoin reclaim its dominance?
#bitcoin #SP500 #NASDAQ
🚨A historic milestone: the S&P 500 and Nasdaq have broken above their 200-week moving averages when measured in Bitcoin for the first time since 2012.
📈 Why it matters:
• Stocks are outperforming BTC on a long-term relative basis.
• Signals a major shift in cross-market momentum.
• Investors are closely watching whether Bitcoin can regain leadership.
• The next few weeks could be crucial for both equities and crypto.
Market leadership never stays the same forever. The key question is whether this marks the start of a new trend—or a temporary rotation before Bitcoin fights back.
💬 Is this the beginning of a new era for stocks, or will Bitcoin reclaim its dominance?
#bitcoin #SP500 #NASDAQ
1
85

·
--
Bullish
Disputed
#sp500nasdaqbreak200wmainbtcfirstsince2012
🚨 HISTORIC MARKET DIVERGENCE! 📉₿
The S&P 500 and Nasdaq are showing weakness around their long-term 200-week moving averages, while Bitcoin remains above its own key 200-week MA. This rare divergence could become important for long-term market positioning.
📊 Why it matters:
Traditional equities are weakening, while BTC is holding a major historical support zone. Traders should watch whether stocks recover and whether BTC can maintain its 200-week MA.
🎯 TRADING VIEW: BUY BTC 📈
BTC holding above its 200-week MA gives it a relative-strength advantage. A sustained hold supports the bullish case, while a decisive break below would weaken it.
❓ Can BTC outperform stocks from here?
"CLICK ON THE BELOW YELLOW COIN TAG TO GO TO DESIRED TRADING PAGE TO GET BENEFIT TRADE"$BTC $ETH $LINK
#bitcoin #SP500
{spot}(LINKUSDT)
{spot}(ETHUSDT)
{spot}(BTCUSDT)
#sp500nasdaqbreak200wmainbtcfirstsince2012
🚨 HISTORIC MARKET DIVERGENCE! 📉₿
The S&P 500 and Nasdaq are showing weakness around their long-term 200-week moving averages, while Bitcoin remains above its own key 200-week MA. This rare divergence could become important for long-term market positioning.
📊 Why it matters:
Traditional equities are weakening, while BTC is holding a major historical support zone. Traders should watch whether stocks recover and whether BTC can maintain its 200-week MA.
🎯 TRADING VIEW: BUY BTC 📈
BTC holding above its 200-week MA gives it a relative-strength advantage. A sustained hold supports the bullish case, while a decisive break below would weaken it.
❓ Can BTC outperform stocks from here?
"CLICK ON THE BELOW YELLOW COIN TAG TO GO TO DESIRED TRADING PAGE TO GET BENEFIT TRADE"$BTC $ETH $LINK
#bitcoin #SP500
🚨 HISTORIC MARKET DIVERGENCE! 📉₿
The S&P 500 and Nasdaq are showing weakness around their long-term 200-week moving averages, while Bitcoin remains above its own key 200-week MA. This rare divergence could become important for long-term market positioning.
📊 Why it matters:
Traditional equities are weakening, while BTC is holding a major historical support zone. Traders should watch whether stocks recover and whether BTC can maintain its 200-week MA.
🎯 TRADING VIEW: BUY BTC 📈
BTC holding above its 200-week MA gives it a relative-strength advantage. A sustained hold supports the bullish case, while a decisive break below would weaken it.
❓ Can BTC outperform stocks from here?
"CLICK ON THE BELOW YELLOW COIN TAG TO GO TO DESIRED TRADING PAGE TO GET BENEFIT TRADE"$BTC $ETH $LINK
#bitcoin #SP500
2
1.4k

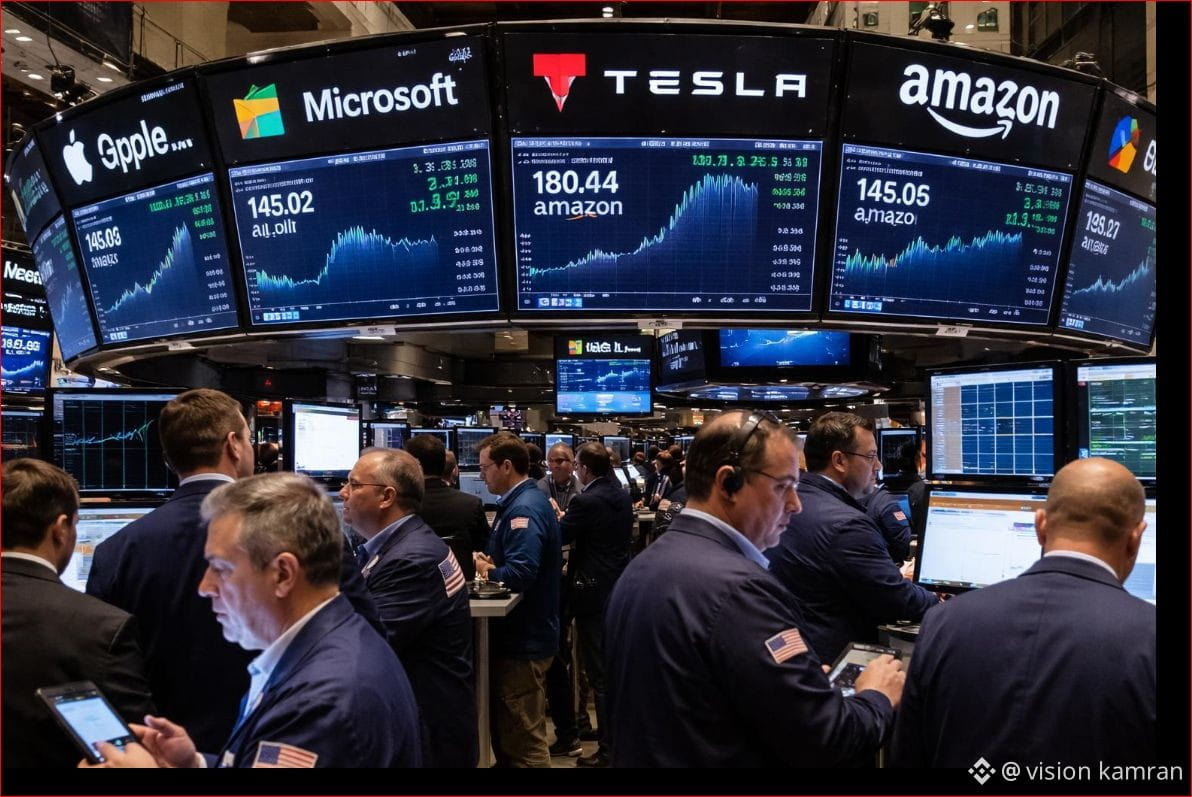
#sp500nasdaqbreak200wmainbtcfirstsince2012 The S&P 500 and Nasdaq indexes have achieved a significant technical milestone when measured against Bitcoin, breaking above their 200-week moving averages for the first time in more than a decade. According to analysts, this level acted as a major resistance zone since 2012, repeatedly limiting the strength of traditional equities relative to the cryptocurrency market.
The breakout suggests a potential shift in market leadership, with investors increasingly favoring traditional stocks, particularly technology and AI-related companies, compared with Bitcoin during this cycle. Strong corporate earnings, resilient economic data, and continued demand for artificial intelligence infrastructure have supported equity markets, helping major indexes outperform on a relative basis.
However, analysts caution that the move does not necessarily signal the end of Bitcoin's long-term potential. Crypto markets remain influenced by liquidity conditions, monetary policy expectations, institutional adoption, and risk appetite. The key question for investors is whether this represents a temporary rotation from digital assets into equities or the beginning of a longer-term trend favoring traditional markets.
Market Insight:
A sustained breakout above this historical technical level could mark an important change in the relationship between stocks and Bitcoin, highlighting the evolving balance between traditional finance and digital assets.
#sp500nasdaqbreak200wmainbtcfirstsince2012 The S&P 500 and Nasdaq indexes have achieved a significant technical milestone when measured against Bitcoin, breaking above their 200-week moving averages for the first time in more than a decade. According to analysts, this level acted as a major resistance zone since 2012, repeatedly limiting the strength of traditional equities relative to the cryptocurrency market.
The breakout suggests a potential shift in market leadership, with investors increasingly favoring traditional stocks, particularly technology and AI-related companies, compared with Bitcoin during this cycle. Strong corporate earnings, resilient economic data, and continued demand for artificial intelligence infrastructure have supported equity markets, helping major indexes outperform on a relative basis.
However, analysts caution that the move does not necessarily signal the end of Bitcoin's long-term potential. Crypto markets remain influenced by liquidity conditions, monetary policy expectations, institutional adoption, and risk appetite. The key question for investors is whether this represents a temporary rotation from digital assets into equities or the beginning of a longer-term trend favoring traditional markets.
Market Insight:
A sustained breakout above this historical technical level could mark an important change in the relationship between stocks and Bitcoin, highlighting the evolving balance between traditional finance and digital assets.
The breakout suggests a potential shift in market leadership, with investors increasingly favoring traditional stocks, particularly technology and AI-related companies, compared with Bitcoin during this cycle. Strong corporate earnings, resilient economic data, and continued demand for artificial intelligence infrastructure have supported equity markets, helping major indexes outperform on a relative basis.
However, analysts caution that the move does not necessarily signal the end of Bitcoin's long-term potential. Crypto markets remain influenced by liquidity conditions, monetary policy expectations, institutional adoption, and risk appetite. The key question for investors is whether this represents a temporary rotation from digital assets into equities or the beginning of a longer-term trend favoring traditional markets.
Market Insight:
A sustained breakout above this historical technical level could mark an important change in the relationship between stocks and Bitcoin, highlighting the evolving balance between traditional finance and digital assets.
1
36

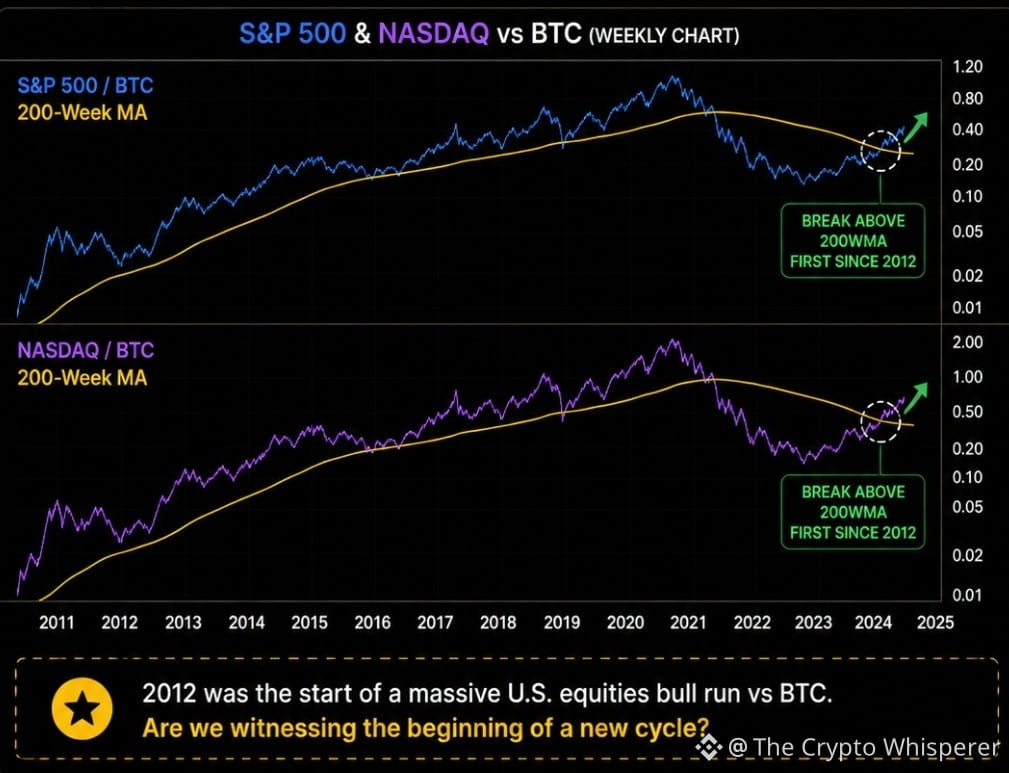
🚨The S&P 500 and Nasdaq are now trading above their 200-week moving averages when measured against Bitcoin for the first time since 2012—a rare macro signal that suggests traditional equities are regaining long-term relative strength.
If this breakout holds, global capital rotation could continue favoring U.S. stocks while BTC enters a consolidation phase. The coming weeks will be critical to confirm whether this is the start of a new multi-year leadership cycle or just a temporary divergence.
$BTC
{spot}(BTCUSDT)
#SP500NasdaqBreak200WMAInBTCFirstSince2012
🚨The S&P 500 and Nasdaq are now trading above their 200-week moving averages when measured against Bitcoin for the first time since 2012—a rare macro signal that suggests traditional equities are regaining long-term relative strength.
If this breakout holds, global capital rotation could continue favoring U.S. stocks while BTC enters a consolidation phase. The coming weeks will be critical to confirm whether this is the start of a new multi-year leadership cycle or just a temporary divergence.
$BTC
#SP500NasdaqBreak200WMAInBTCFirstSince2012
If this breakout holds, global capital rotation could continue favoring U.S. stocks while BTC enters a consolidation phase. The coming weeks will be critical to confirm whether this is the start of a new multi-year leadership cycle or just a temporary divergence.
$BTC
#SP500NasdaqBreak200WMAInBTCFirstSince2012
2
84

#sp500nasdaqbreak200wmainbtcfirstsince2012
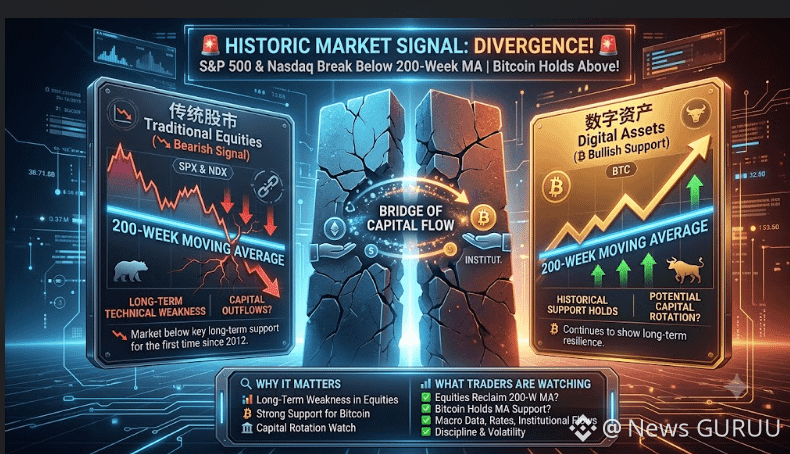
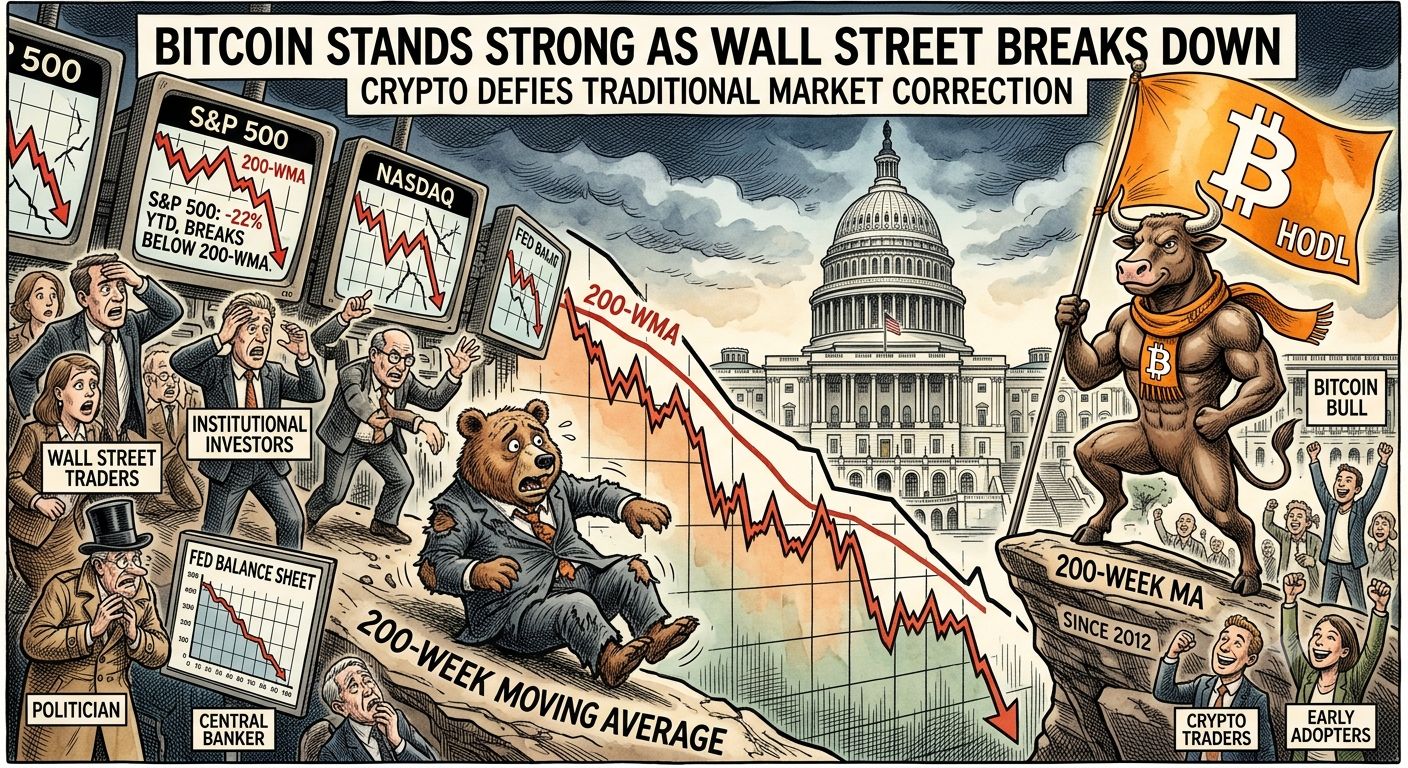
🚨 Historic Market Signal: S&P 500 & Nasdaq Break Below the 200-Week Moving Average While Bitcoin Holds Above It! 📉₿
For the first time since 2012, the S&P 500 and Nasdaq have fallen below their 200-week moving averages, while Bitcoin remains above its own 200-week MA. This rare divergence is catching the attention of investors looking for long-term market trends.
🔍 Why It Matters
📉 Traditional equity markets are showing signs of long-term technical weakness.
₿ Bitcoin continues to hold above a key historical support level.
🏦 Investors are closely watching whether capital rotates between traditional markets and digital assets.
⚡ This could become an important signal for long-term portfolio positioning if the trend continues.
📊 What Traders Are Watching
✅ Monitor whether the S&P 500 and Nasdaq reclaim the 200-week moving average.
✅ Watch Bitcoin's ability to maintain support above its 200-week MA.
✅ Keep an eye on macroeconomic data, interest rates, and institutional fund flows.
✅ Stay disciplined—major technical levels often bring increased volatility.
History doesn't guarantee the future, but major technical milestones like this often attract significant market attention.
⚠️ This post is for educational purposes only and is not financial advice. Always do your own research before making investment decisions.
#Bitcoin #BTC #SP500 #Nasdaq
$LINK
$BTC
$ETH
{spot}(ETHUSDT)
{spot}(BTCUSDT)
{spot}(LINKUSDT)
#sp500nasdaqbreak200wmainbtcfirstsince2012
🚨 Historic Market Signal: S&P 500 & Nasdaq Break Below the 200-Week Moving Average While Bitcoin Holds Above It! 📉₿
For the first time since 2012, the S&P 500 and Nasdaq have fallen below their 200-week moving averages, while Bitcoin remains above its own 200-week MA. This rare divergence is catching the attention of investors looking for long-term market trends.
🔍 Why It Matters
📉 Traditional equity markets are showing signs of long-term technical weakness.
₿ Bitcoin continues to hold above a key historical support level.
🏦 Investors are closely watching whether capital rotates between traditional markets and digital assets.
⚡ This could become an important signal for long-term portfolio positioning if the trend continues.
📊 What Traders Are Watching
✅ Monitor whether the S&P 500 and Nasdaq reclaim the 200-week moving average.
✅ Watch Bitcoin's ability to maintain support above its 200-week MA.
✅ Keep an eye on macroeconomic data, interest rates, and institutional fund flows.
✅ Stay disciplined—major technical levels often bring increased volatility.
History doesn't guarantee the future, but major technical milestones like this often attract significant market attention.
⚠️ This post is for educational purposes only and is not financial advice. Always do your own research before making investment decisions.
#Bitcoin #BTC #SP500 #Nasdaq
$LINK
$BTC
$ETH
🚨 Historic Market Signal: S&P 500 & Nasdaq Break Below the 200-Week Moving Average While Bitcoin Holds Above It! 📉₿
For the first time since 2012, the S&P 500 and Nasdaq have fallen below their 200-week moving averages, while Bitcoin remains above its own 200-week MA. This rare divergence is catching the attention of investors looking for long-term market trends.
🔍 Why It Matters
📉 Traditional equity markets are showing signs of long-term technical weakness.
₿ Bitcoin continues to hold above a key historical support level.
🏦 Investors are closely watching whether capital rotates between traditional markets and digital assets.
⚡ This could become an important signal for long-term portfolio positioning if the trend continues.
📊 What Traders Are Watching
✅ Monitor whether the S&P 500 and Nasdaq reclaim the 200-week moving average.
✅ Watch Bitcoin's ability to maintain support above its 200-week MA.
✅ Keep an eye on macroeconomic data, interest rates, and institutional fund flows.
✅ Stay disciplined—major technical levels often bring increased volatility.
History doesn't guarantee the future, but major technical milestones like this often attract significant market attention.
⚠️ This post is for educational purposes only and is not financial advice. Always do your own research before making investment decisions.
#Bitcoin #BTC #SP500 #Nasdaq
$LINK
$BTC
$ETH
2
485

·
--
#sp500nasdaqbreak200wmainbtcfirstsince2012
🚨📈 Historic! The #SP500 and the #Nasdaq have just broken the 200-week moving average, while #BTC achieves a milestone not seen since 2012.
🔥 This crossover marks a before and after:
🏦 Wall Street confirms weakness in key indices.
💎 Bitcoin positions itself as a leading asset amid the turbulence.
📊 A technical signal that could redefine the market cycle.
👉 ElCryptoBoy sums it up like this:
“When the giants fall, the digital king rises. 🚀👑”
⚡️ elcryptoboy community: Are we looking at the start of a new crypto era?
💬 Share your outlook and spread this post so no one gets left out.
🔗 Join the conversation on Binance Square, Instagram, Telegram, and X.
#sp500nasdaqbreak200wmainbtcfirstsince2012 #BTC #CryptoRevolution #ElCryptoBoy
#sp500nasdaqbreak200wmainbtcfirstsince2012
🚨📈 Historic! The #SP500 and the #Nasdaq have just broken the 200-week moving average, while #BTC achieves a milestone not seen since 2012.
🔥 This crossover marks a before and after:
🏦 Wall Street confirms weakness in key indices.
💎 Bitcoin positions itself as a leading asset amid the turbulence.
📊 A technical signal that could redefine the market cycle.
👉 ElCryptoBoy sums it up like this:
“When the giants fall, the digital king rises. 🚀👑”
⚡️ elcryptoboy community: Are we looking at the start of a new crypto era?
💬 Share your outlook and spread this post so no one gets left out.
🔗 Join the conversation on Binance Square, Instagram, Telegram, and X.
#sp500nasdaqbreak200wmainbtcfirstsince2012 #BTC #CryptoRevolution #ElCryptoBoy
🚨📈 Historic! The #SP500 and the #Nasdaq have just broken the 200-week moving average, while #BTC achieves a milestone not seen since 2012.
🔥 This crossover marks a before and after:
🏦 Wall Street confirms weakness in key indices.
💎 Bitcoin positions itself as a leading asset amid the turbulence.
📊 A technical signal that could redefine the market cycle.
👉 ElCryptoBoy sums it up like this:
“When the giants fall, the digital king rises. 🚀👑”
⚡️ elcryptoboy community: Are we looking at the start of a new crypto era?
💬 Share your outlook and spread this post so no one gets left out.
🔗 Join the conversation on Binance Square, Instagram, Telegram, and X.
#sp500nasdaqbreak200wmainbtcfirstsince2012 #BTC #CryptoRevolution #ElCryptoBoy
2
2.5k

#SP500NasdaqBreak200WMAInBTCFirstSince2012
📊 — A Rare Market Signal
The S&P 500 and Nasdaq breaking below their 200-week moving average when measured in Bitcoin is a rare event, last seen in 2012. It highlights Bitcoin's long-term outperformance relative to traditional equities over extended periods.
For investors, it's a reminder to compare asset performance across different market cycles—not just in U.S. dollars.
#Bitcoin #Nasdaq $BTC
#SP500NasdaqBreak200WMAInBTCFirstSince2012
📊 — A Rare Market Signal
The S&P 500 and Nasdaq breaking below their 200-week moving average when measured in Bitcoin is a rare event, last seen in 2012. It highlights Bitcoin's long-term outperformance relative to traditional equities over extended periods.
For investors, it's a reminder to compare asset performance across different market cycles—not just in U.S. dollars.
#Bitcoin #Nasdaq $BTC
📊 — A Rare Market Signal
The S&P 500 and Nasdaq breaking below their 200-week moving average when measured in Bitcoin is a rare event, last seen in 2012. It highlights Bitcoin's long-term outperformance relative to traditional equities over extended periods.
For investors, it's a reminder to compare asset performance across different market cycles—not just in U.S. dollars.
#Bitcoin #Nasdaq $BTC
98

·
--
Bullish
A historic signal that could reshape the relationship between stocks and Bitcoin!
For the first time since 2012, both the S&P 500 and Nasdaq broke their 200-week moving averages when measured in Bitcoin (BTC).
What does that mean?
Simply put, despite the strong performance of U.S. stocks in dollars, Bitcoin outperforms them when used as a unit for measuring value. This points to a shift in relative strength between traditional assets and digital assets.
📌 Why does it matter to investors?
It reflects Bitcoin’s continued outperformance over U.S. stocks in the long run.
It may prompt more investors to reassess how they allocate their investment portfolios.
It confirms that measuring performance in a different currency can reveal a completely different picture
of the markets.
This signal doesn’t necessarily mean that stocks have entered a bearish trend, but it highlights that Bitcoin continues to solidify its position as one of the strongest-performing assets over the past decade.
Are we seeing the beginning of a new phase in digital assets outperforming traditional markets?
{future}(QQQUSDT)
{future}(BTCUSDT)
{future}(MSTRUSDT)
#SP500NasdaqBreak200WMAInBTCFirstSince2012
A historic signal that could reshape the relationship between stocks and Bitcoin!
For the first time since 2012, both the S&P 500 and Nasdaq broke their 200-week moving averages when measured in Bitcoin (BTC).
What does that mean?
Simply put, despite the strong performance of U.S. stocks in dollars, Bitcoin outperforms them when used as a unit for measuring value. This points to a shift in relative strength between traditional assets and digital assets.
📌 Why does it matter to investors?
It reflects Bitcoin’s continued outperformance over U.S. stocks in the long run.
It may prompt more investors to reassess how they allocate their investment portfolios.
It confirms that measuring performance in a different currency can reveal a completely different picture
of the markets.
This signal doesn’t necessarily mean that stocks have entered a bearish trend, but it highlights that Bitcoin continues to solidify its position as one of the strongest-performing assets over the past decade.
Are we seeing the beginning of a new phase in digital assets outperforming traditional markets?
#SP500NasdaqBreak200WMAInBTCFirstSince2012
For the first time since 2012, both the S&P 500 and Nasdaq broke their 200-week moving averages when measured in Bitcoin (BTC).
What does that mean?
Simply put, despite the strong performance of U.S. stocks in dollars, Bitcoin outperforms them when used as a unit for measuring value. This points to a shift in relative strength between traditional assets and digital assets.
📌 Why does it matter to investors?
It reflects Bitcoin’s continued outperformance over U.S. stocks in the long run.
It may prompt more investors to reassess how they allocate their investment portfolios.
It confirms that measuring performance in a different currency can reveal a completely different picture
of the markets.
This signal doesn’t necessarily mean that stocks have entered a bearish trend, but it highlights that Bitcoin continues to solidify its position as one of the strongest-performing assets over the past decade.
Are we seeing the beginning of a new phase in digital assets outperforming traditional markets?
#SP500NasdaqBreak200WMAInBTCFirstSince2012

2
250
·
--
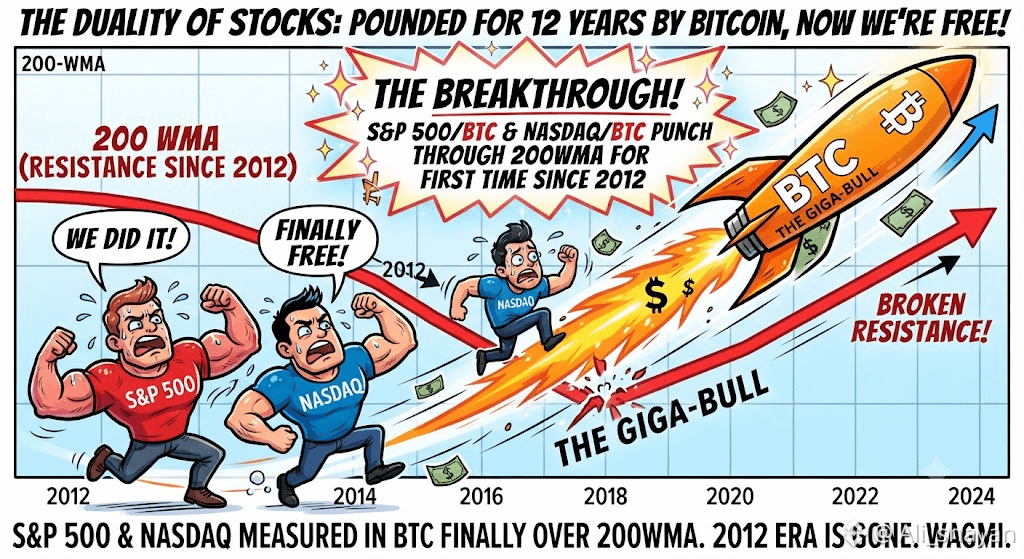
#sp500nasdaqbreak200wmainbtcfirstsince2012 The S&P 500 and Nasdaq indexes, when measured in Bitcoin, have just broken above their 200-week moving averages. This is a massive market milestone happening for the first time since 2012. For over a decade, this specific technical line acted as a solid ceiling holding traditional stock market growth back against crypto. Seeing this break now shows how fast asset dynamics are shifting between major global stocks and digital currency.
CLICK BELOW TO TRADE : $BTC $BNB $BEAT
{future}(BEATUSDT)
{future}(BNBUSDT)
{future}(BTCUSDT)
#sp500nasdaqbreak200wmainbtcfirstsince2012 The S&P 500 and Nasdaq indexes, when measured in Bitcoin, have just broken above their 200-week moving averages. This is a massive market milestone happening for the first time since 2012. For over a decade, this specific technical line acted as a solid ceiling holding traditional stock market growth back against crypto. Seeing this break now shows how fast asset dynamics are shifting between major global stocks and digital currency.
CLICK BELOW TO TRADE : $BTC $BNB $BEAT
CLICK BELOW TO TRADE : $BTC $BNB $BEAT
2
2
3.8k

#sp500nasdaqbreak200wmainbtcfirstsince2012
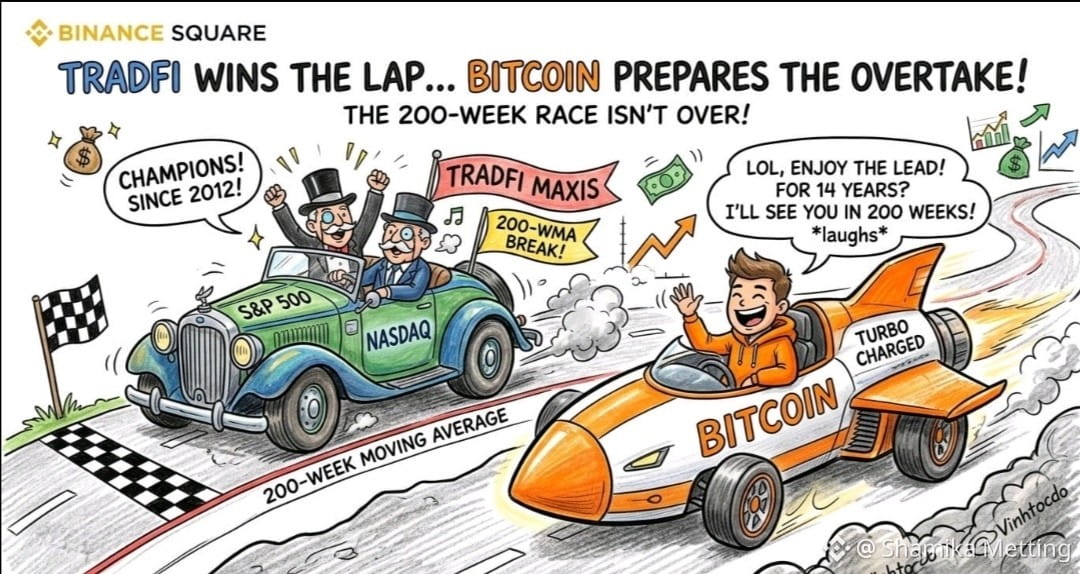
For the first time since 2012, both the S&P 500 and Nasdaq have just broken through their 200-week moving average from the perspective of Bitcoin! 🤯 Traditional finance enthusiasts celebrate like they’ve won the World Cup.
Has Wall Street really returned, or is BTC just letting them pass before switching to the turbo (payment) mode? 🏎️ A 14-year journey is long—but let’s see who’s laughing after another 200 weeks!
What should traders do? Keep accumulating positions or chase the stocks? 🧐
⚠️ This is not financial advice.
Follow-up, please
#stocks #crypto #trading
$BTC
{future}(BTCUSDT)
#sp500nasdaqbreak200wmainbtcfirstsince2012
For the first time since 2012, both the S&P 500 and Nasdaq have just broken through their 200-week moving average from the perspective of Bitcoin! 🤯 Traditional finance enthusiasts celebrate like they’ve won the World Cup.
Has Wall Street really returned, or is BTC just letting them pass before switching to the turbo (payment) mode? 🏎️ A 14-year journey is long—but let’s see who’s laughing after another 200 weeks!
What should traders do? Keep accumulating positions or chase the stocks? 🧐
⚠️ This is not financial advice.
Follow-up, please
#stocks #crypto #trading
$BTC
For the first time since 2012, both the S&P 500 and Nasdaq have just broken through their 200-week moving average from the perspective of Bitcoin! 🤯 Traditional finance enthusiasts celebrate like they’ve won the World Cup.
Has Wall Street really returned, or is BTC just letting them pass before switching to the turbo (payment) mode? 🏎️ A 14-year journey is long—but let’s see who’s laughing after another 200 weeks!
What should traders do? Keep accumulating positions or chase the stocks? 🧐
⚠️ This is not financial advice.
Follow-up, please
#stocks #crypto #trading
$BTC
1
3
4.4k

·
--
#sp500nasdaqbreak200wmainbtcfirstsince2012
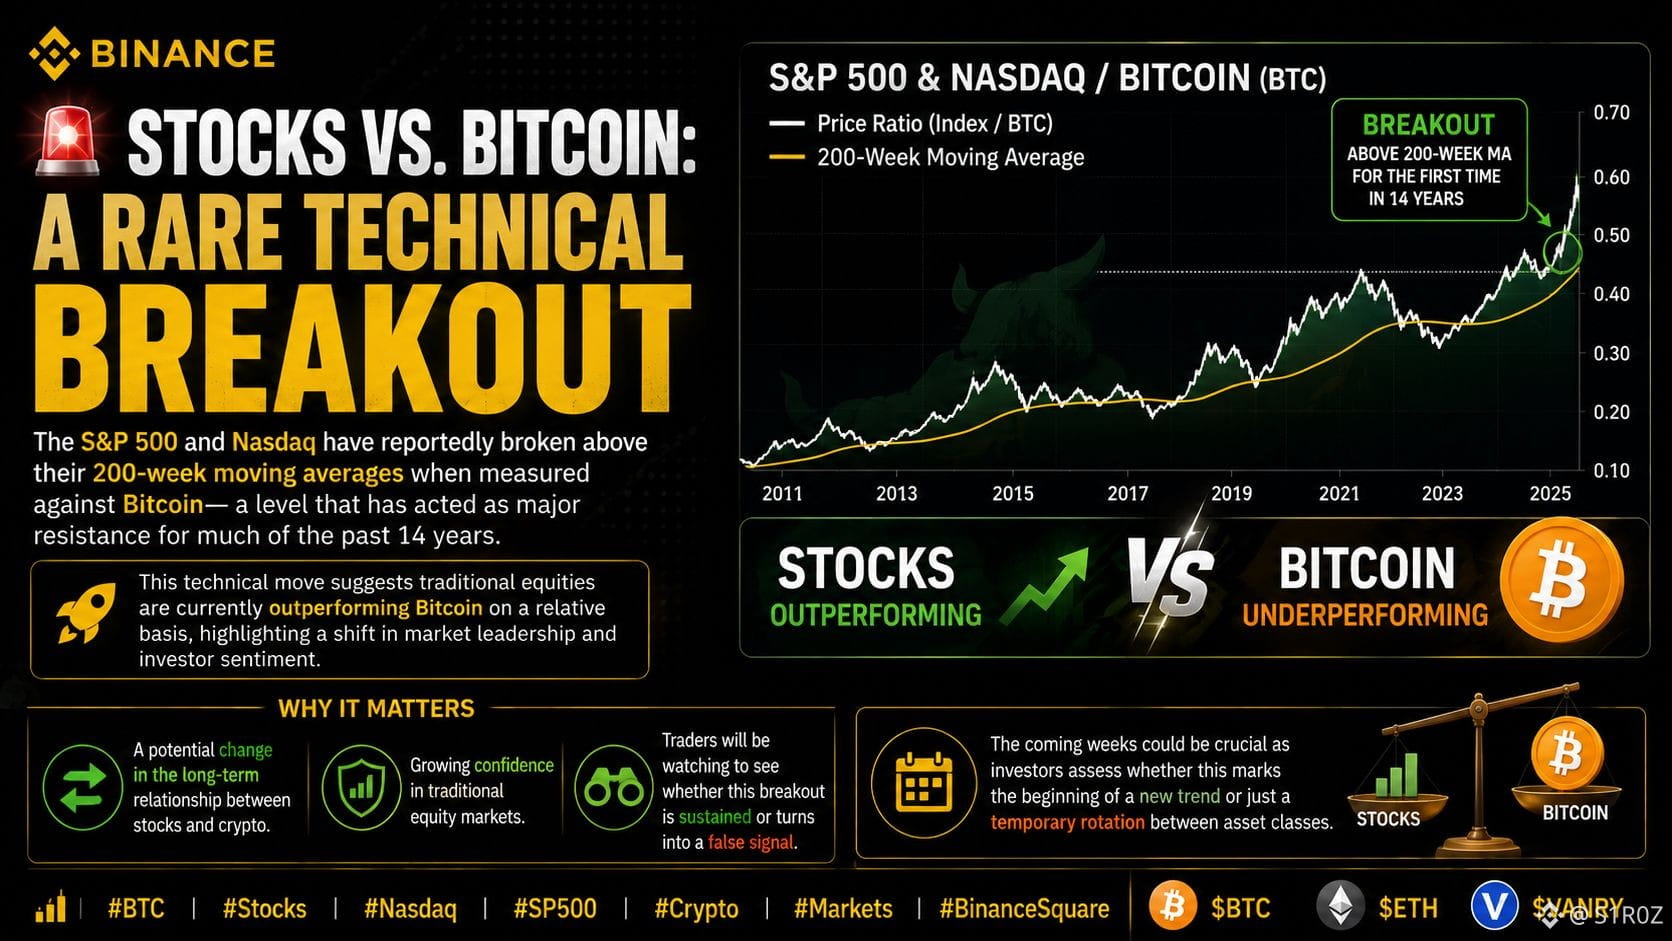
🚨 Stocks vs. Bitcoin: A Rare Technical Breakout
The S&P 500 and Nasdaq have reportedly broken above their 200-week moving averages when measured against Bitcoin—a level that has acted as major resistance for much of the past 14 years.
$BTC
{spot}(BTCUSDT)
$ETH
{spot}(ETHUSDT)
$VANRY
{spot}(VANRYUSDT)
This technical move suggests traditional equities are currently outperforming Bitcoin on a relative basis, highlighting a shift in market leadership and investor sentiment.
📊 Why It Matters
• A potential change in the long-term relationship between stocks and crypto.
• Growing confidence in traditional equity markets.
• Traders will be watching to see whether this breakout is sustained or turns into a false signal.
The coming weeks could be crucial as investors assess whether this marks the beginning of a new trend or just a temporary rotation between asset classes.
#BTC #Stocks #Nasdaq #SP500 #Crypto #Markets #BinanceSquare
#sp500nasdaqbreak200wmainbtcfirstsince2012
🚨 Stocks vs. Bitcoin: A Rare Technical Breakout
The S&P 500 and Nasdaq have reportedly broken above their 200-week moving averages when measured against Bitcoin—a level that has acted as major resistance for much of the past 14 years.
$BTC
$ETH
$VANRY
This technical move suggests traditional equities are currently outperforming Bitcoin on a relative basis, highlighting a shift in market leadership and investor sentiment.
📊 Why It Matters
• A potential change in the long-term relationship between stocks and crypto.
• Growing confidence in traditional equity markets.
• Traders will be watching to see whether this breakout is sustained or turns into a false signal.
The coming weeks could be crucial as investors assess whether this marks the beginning of a new trend or just a temporary rotation between asset classes.
#BTC #Stocks #Nasdaq #SP500 #Crypto #Markets #BinanceSquare
🚨 Stocks vs. Bitcoin: A Rare Technical Breakout
The S&P 500 and Nasdaq have reportedly broken above their 200-week moving averages when measured against Bitcoin—a level that has acted as major resistance for much of the past 14 years.
$BTC
$ETH
$VANRY
This technical move suggests traditional equities are currently outperforming Bitcoin on a relative basis, highlighting a shift in market leadership and investor sentiment.
📊 Why It Matters
• A potential change in the long-term relationship between stocks and crypto.
• Growing confidence in traditional equity markets.
• Traders will be watching to see whether this breakout is sustained or turns into a false signal.
The coming weeks could be crucial as investors assess whether this marks the beginning of a new trend or just a temporary rotation between asset classes.
#BTC #Stocks #Nasdaq #SP500 #Crypto #Markets #BinanceSquare
224

🚨 The #SP500 and Nasdaq breaking their 200WMA signals a historic shift—could this be the turning point for #BTC? 📈 With the surge in trending coins like Cash Cat and GRVT, is the market ready for a full bull run? What are your thoughts? #SP500NasdaqBreak200WMAInBTCFirstSince2012
🚨 The #SP500 and Nasdaq breaking their 200WMA signals a historic shift—could this be the turning point for #BTC? 📈 With the surge in trending coins like Cash Cat and GRVT, is the market ready for a full bull run? What are your thoughts? #SP500NasdaqBreak200WMAInBTCFirstSince2012
47

·
--
Bullish
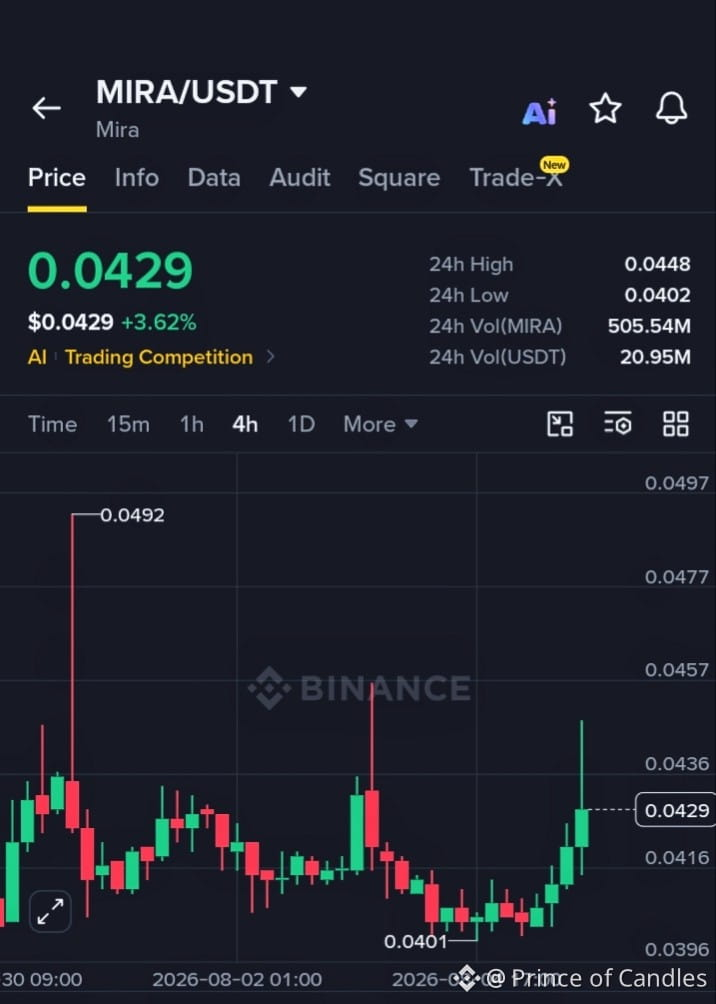
🚀 $MIRA Looks Ready for the Next Leg Up! 🟢
📍 Entry: $0.0409–$0.0412
🎯 TP: $0.0425 | $0.0438 | $0.0455
🛑 SL: $0.0398
🔥 Holding above key support with higher lows forming. A breakout above $0.0417 could trigger fresh bullish momentum.
💰 Buy & Trade $MIRA
#Mira #TradingSignals #Follow4more #ADPJulyPrivatePayrollsMissedExpectations #SP500NasdaqBreak200WMAInBTCFirstSince2012
TRADE HERE 👇
{future}(MIRAUSDT)
🚀 $MIRA Looks Ready for the Next Leg Up! 🟢
📍 Entry: $0.0409–$0.0412
🎯 TP: $0.0425 | $0.0438 | $0.0455
🛑 SL: $0.0398
🔥 Holding above key support with higher lows forming. A breakout above $0.0417 could trigger fresh bullish momentum.
💰 Buy & Trade $MIRA
#Mira #TradingSignals #Follow4more #ADPJulyPrivatePayrollsMissedExpectations #SP500NasdaqBreak200WMAInBTCFirstSince2012
TRADE HERE 👇
📍 Entry: $0.0409–$0.0412
🎯 TP: $0.0425 | $0.0438 | $0.0455
🛑 SL: $0.0398
🔥 Holding above key support with higher lows forming. A breakout above $0.0417 could trigger fresh bullish momentum.
💰 Buy & Trade $MIRA
#Mira #TradingSignals #Follow4more #ADPJulyPrivatePayrollsMissedExpectations #SP500NasdaqBreak200WMAInBTCFirstSince2012
TRADE HERE 👇
1
80

·
--
Bullish
$BTC
#SP500NasdaqBreak200WMAInBTCFirstSince2012
{spot}(BTCUSDT)
Bitcoin House Motion Update $BTC: Upward trend! ↗️The markets show clear positive signals and Bitcoin is strongly regaining its strength to confirm the optimistic outlook of traders. Staying disciplined and managing risk is the key to benefiting from this green wave.
📊 Quick trader poll:Click the create poll button at the bottom and choose
1/:Yes, continue rising toward higher targets 🚀
2/No, just a temporary rise followed by a drop 📉
$BTC
#SP500NasdaqBreak200WMAInBTCFirstSince2012
Bitcoin House Motion Update $BTC : Upward trend! ↗️The markets show clear positive signals and Bitcoin is strongly regaining its strength to confirm the optimistic outlook of traders. Staying disciplined and managing risk is the key to benefiting from this green wave.
📊 Quick trader poll:Click the create poll button at the bottom and choose
1/:Yes, continue rising toward higher targets 🚀
2/No, just a temporary rise followed by a drop 📉
#SP500NasdaqBreak200WMAInBTCFirstSince2012
Bitcoin House Motion Update $BTC : Upward trend! ↗️The markets show clear positive signals and Bitcoin is strongly regaining its strength to confirm the optimistic outlook of traders. Staying disciplined and managing risk is the key to benefiting from this green wave.
📊 Quick trader poll:Click the create poll button at the bottom and choose
1/:Yes, continue rising toward higher targets 🚀
2/No, just a temporary rise followed by a drop 📉
82

·
--
DOGE is consolidating around $0.06986 with a small 0.63% pullback while maintaining a heavy 24-hour trading volume of 15.87M USDT. Meme coin traders are keeping a close watch on this key support level to see if a quick momentum shift triggers the next unexpected explosive move upwards.
$DOGE
{spot}(DOGEUSDT)
#SP500NasdaqBreak200WMAInBTCFirstSince2012 #KoreanStocksReboundOnForeignBuying #SCCrudeDrops6.01% #USMilitarySaysHormuzStraitOpen #GoldRisesForThirdDay
DOGE is consolidating around $0.06986 with a small 0.63% pullback while maintaining a heavy 24-hour trading volume of 15.87M USDT. Meme coin traders are keeping a close watch on this key support level to see if a quick momentum shift triggers the next unexpected explosive move upwards.
$DOGE
#SP500NasdaqBreak200WMAInBTCFirstSince2012 #KoreanStocksReboundOnForeignBuying #SCCrudeDrops6.01% #USMilitarySaysHormuzStraitOpen #GoldRisesForThirdDay
$DOGE
#SP500NasdaqBreak200WMAInBTCFirstSince2012 #KoreanStocksReboundOnForeignBuying #SCCrudeDrops6.01% #USMilitarySaysHormuzStraitOpen #GoldRisesForThirdDay
62

·
--
Bullish
Rise in Shopify and decline in Advanced Micro Devices before the opening with disappointment in earnings
US stock index futures rose broadly on Wednesday, as investors drew cautious optimism from indicators suggesting that negotiations to reopen the Strait of Hormuz may gain momentum, even though disappointing reactions to earnings at Advanced Micro Devices and privately held SpaceX eased enthusiasm for technology stocks.#SouthKoreaTaxPlanOmitsCryptoTaxDelay #TaiwanPlansCryptoTravelRuleFromOctober #SpaceXFalls11%OnFirstReportSinceIPO #EliLillyRaises2026SalesOutlook #SP500NasdaqBreak200WMAInBTCFirstSince2012 $TRUMP
{future}(TRUMPUSDT)
$XAU
{future}(XAUUSDT)
Rise in Shopify and decline in Advanced Micro Devices before the opening with disappointment in earnings
US stock index futures rose broadly on Wednesday, as investors drew cautious optimism from indicators suggesting that negotiations to reopen the Strait of Hormuz may gain momentum, even though disappointing reactions to earnings at Advanced Micro Devices and privately held SpaceX eased enthusiasm for technology stocks.#SouthKoreaTaxPlanOmitsCryptoTaxDelay #TaiwanPlansCryptoTravelRuleFromOctober #SpaceXFalls11%OnFirstReportSinceIPO #EliLillyRaises2026SalesOutlook #SP500NasdaqBreak200WMAInBTCFirstSince2012 $TRUMP
$XAU
US stock index futures rose broadly on Wednesday, as investors drew cautious optimism from indicators suggesting that negotiations to reopen the Strait of Hormuz may gain momentum, even though disappointing reactions to earnings at Advanced Micro Devices and privately held SpaceX eased enthusiasm for technology stocks.#SouthKoreaTaxPlanOmitsCryptoTaxDelay #TaiwanPlansCryptoTravelRuleFromOctober #SpaceXFalls11%OnFirstReportSinceIPO #EliLillyRaises2026SalesOutlook #SP500NasdaqBreak200WMAInBTCFirstSince2012 $TRUMP
$XAU

1
123

Article
GlobalStocksHitRecordHighGlobal stock markets have climbed to fresh record highs, reflecting renewed investor optimism driven by strong corporate earnings, resilient economic data, and growing expectations that major central banks may continue easing monetary policy.
Technology and artificial intelligence companies remain key drivers of the rally, while financial, industrial, and consumer sectors have also posted solid gains. Investors are increasingly optimistic that inflation will remain under control without significantly slowing global economic growth.
Markets in the United States, Europe, and parts of Asia have all contributed to the upward momentum. Strong business performance, improving global trade sentiment, and continued investment in innovation have helped fuel confidence across equity markets.
Despite the positive outlook, analysts caution that risks remain. Geopolitical tensions, unexpected inflation spikes, and changes in central bank policies could introduce market volatility in the coming months. Investors are encouraged to maintain diversified portfolios and focus on long-term investment strategies rather than reacting to short-term market movements.
The record-breaking performance highlights the resilience of global financial markets and underscores continued confidence in the global economy. As companies adapt to evolving economic conditions and technological advancements, market participants will be closely watching upcoming earnings reports and economic indicators to determine whether the rally can continue.
#GlobalStocksHitRecordHigh #SP500NasdaqBreak200WMAInBTCFirstSince2012 #USTelecomStocksFallPreMarket $NVDAB
{spot}(LITEBUSDT)
{spot}(GOOGLBUSDT)
{spot}(AVGOBUSDT)
GlobalStocksHitRecordHigh
Global stock markets have climbed to fresh record highs, reflecting renewed investor optimism driven by strong corporate earnings, resilient economic data, and growing expectations that major central banks may continue easing monetary policy.
Technology and artificial intelligence companies remain key drivers of the rally, while financial, industrial, and consumer sectors have also posted solid gains. Investors are increasingly optimistic that inflation will remain under control without significantly slowing global economic growth.
Markets in the United States, Europe, and parts of Asia have all contributed to the upward momentum. Strong business performance, improving global trade sentiment, and continued investment in innovation have helped fuel confidence across equity markets.
Despite the positive outlook, analysts caution that risks remain. Geopolitical tensions, unexpected inflation spikes, and changes in central bank policies could introduce market volatility in the coming months. Investors are encouraged to maintain diversified portfolios and focus on long-term investment strategies rather than reacting to short-term market movements.
The record-breaking performance highlights the resilience of global financial markets and underscores continued confidence in the global economy. As companies adapt to evolving economic conditions and technological advancements, market participants will be closely watching upcoming earnings reports and economic indicators to determine whether the rally can continue.
#GlobalStocksHitRecordHigh #SP500NasdaqBreak200WMAInBTCFirstSince2012 #USTelecomStocksFallPreMarket $NVDAB
Technology and artificial intelligence companies remain key drivers of the rally, while financial, industrial, and consumer sectors have also posted solid gains. Investors are increasingly optimistic that inflation will remain under control without significantly slowing global economic growth.
Markets in the United States, Europe, and parts of Asia have all contributed to the upward momentum. Strong business performance, improving global trade sentiment, and continued investment in innovation have helped fuel confidence across equity markets.
Despite the positive outlook, analysts caution that risks remain. Geopolitical tensions, unexpected inflation spikes, and changes in central bank policies could introduce market volatility in the coming months. Investors are encouraged to maintain diversified portfolios and focus on long-term investment strategies rather than reacting to short-term market movements.
The record-breaking performance highlights the resilience of global financial markets and underscores continued confidence in the global economy. As companies adapt to evolving economic conditions and technological advancements, market participants will be closely watching upcoming earnings reports and economic indicators to determine whether the rally can continue.
#GlobalStocksHitRecordHigh #SP500NasdaqBreak200WMAInBTCFirstSince2012 #USTelecomStocksFallPreMarket $NVDAB
110
Log in to explore more content
Join global crypto users on Binance Square
⚡️ Get latest and useful information about crypto.
💬 Trusted by the world’s largest crypto exchange.
👍 Discover real insights from verified creators.
Email / Phone number
Trending Topics
1
#AIStocksWhatNext
478,551 views
3,551 Discussing
2
#BitcoinTops$87KAtEightMonthHigh
374 views
21 Discussing
3
#ZECBreaksAbove$1600AtRecordHigh
166 views
8 Discussing
4
#BitwiseNEARStakingETPAssetsTop$100M
9,057 views
50 Discussing
5
#BitcoinBreaksAboveMayHighNears$86K
22,643 views
230 Discussing
6
#DogecoinRises15%
72,704 views
1,261 Discussing
7
#$14BBitcoinOptionsExpireFriday
6,446 views
104 Discussing
8
#BNBMarketCapPassesBNYMellon
44,198 views
910 Discussing
9
#CryptoMarketCapReclaims$3Trillion
9,221 views
87 Discussing
10
#MuseOvertakesChatGPTAsTopFreeIOSApp
25,779 views
681 Discussing