
#soxlbusdt
soxlbusdt
16,900 views
87 Discussing
Hot
Latest

·
--
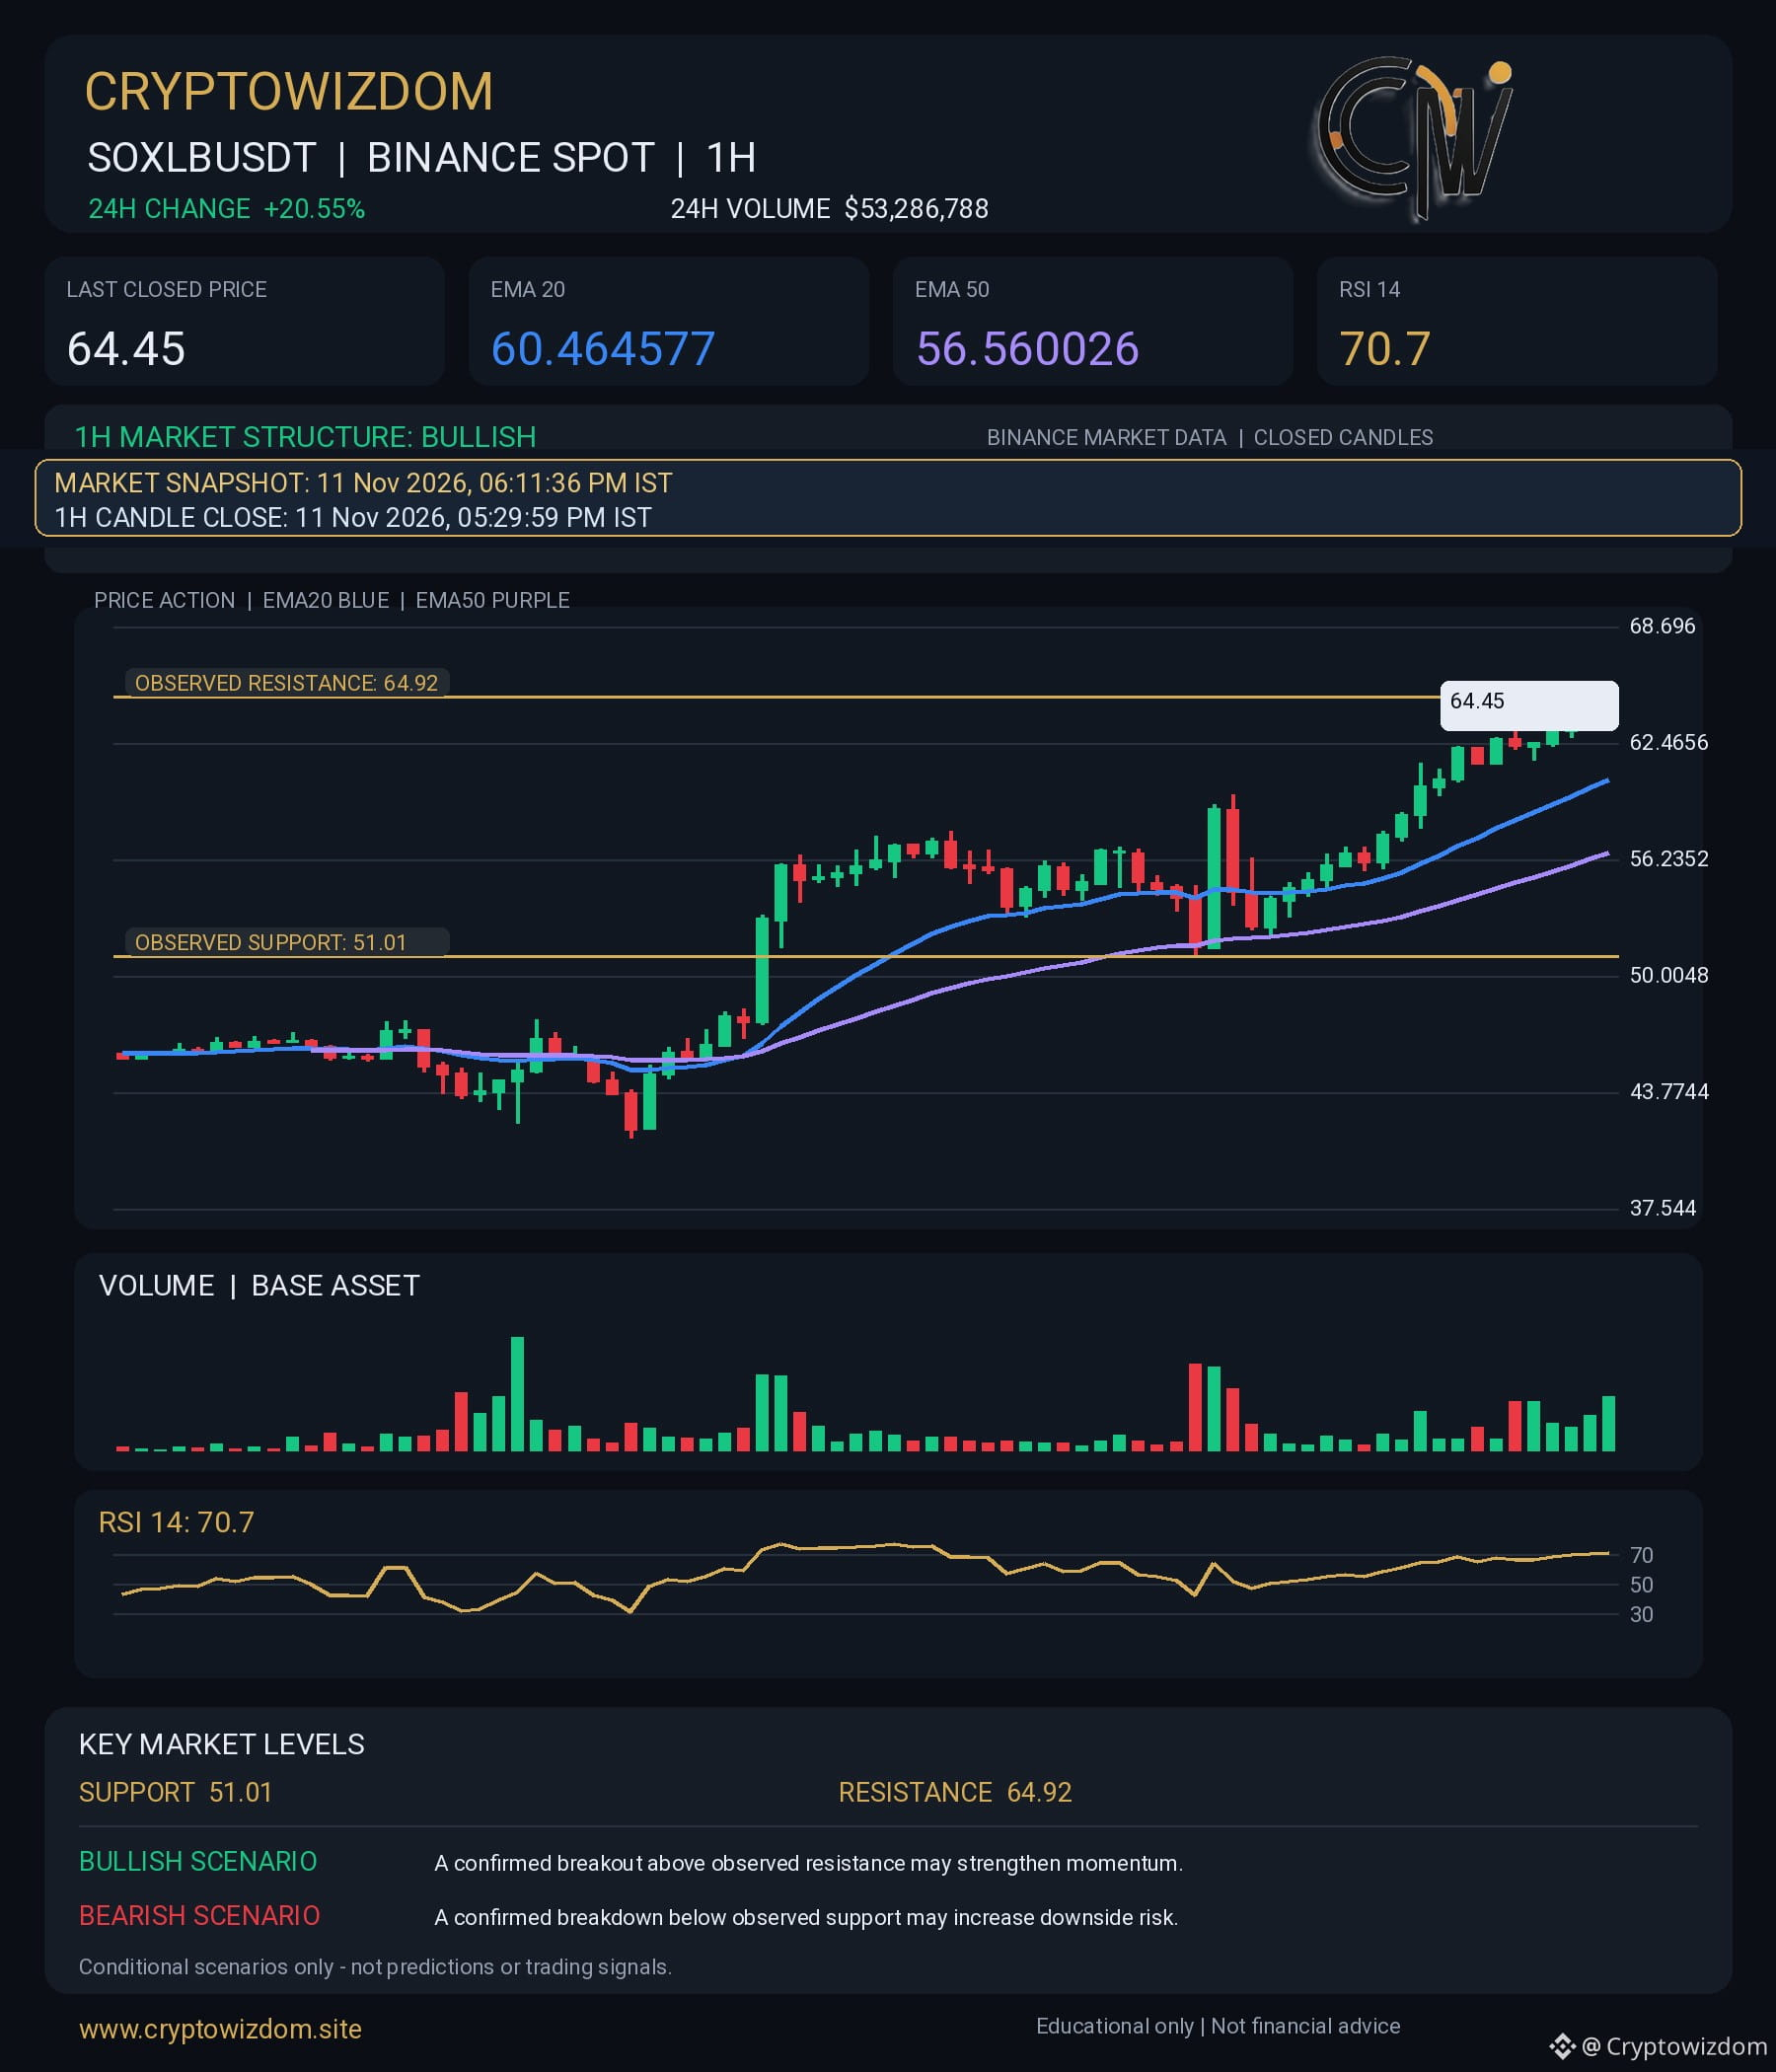
$SOXLB | BINANCE SPOT MARKET ANALYSIS
MARKET SNAPSHOT: 11 Nov 2026, 06:11:36 PM IST
DATA SOURCE: Binance public market data
24H change: +20.55%
24H quote volume: $53,286,788
1H trend: Bullish
1H candle close time: 11 Nov 2026, 05:29:59 PM IST
1H completed candle close: 64.45
EMA20: 60.464577 | EMA50: 56.560026
RSI14: 70.7
4H trend: Mixed
4H candle close time: 11 Nov 2026, 05:29:59 PM IST
4H completed candle close: 64.45
EMA20: 55.152404 | EMA50: 57.565411
RSI14: 68.1
The 1H and 4H trends are mixed. Wait for confirmation.
RSI is elevated on at least one timeframe; momentum may be extended.
Bullish scenario: A confirmed move above the observed 1H resistance (64.92) may improve momentum.
Bearish scenario: A confirmed break below the observed 1H support (51.01) may increase downside risk.
These are conditional scenarios, not predictions or trading signals.
Educational content only. Not financial advice. Manage risk carefully.
$SOXLB #SOXLBUSDT #CryptoAnalysis #BinanceSpot #CryptoWizdom
$SOXLB | BINANCE SPOT MARKET ANALYSIS
MARKET SNAPSHOT: 11 Nov 2026, 06:11:36 PM IST
DATA SOURCE: Binance public market data
24H change: +20.55%
24H quote volume: $53,286,788
1H trend: Bullish
1H candle close time: 11 Nov 2026, 05:29:59 PM IST
1H completed candle close: 64.45
EMA20: 60.464577 | EMA50: 56.560026
RSI14: 70.7
4H trend: Mixed
4H candle close time: 11 Nov 2026, 05:29:59 PM IST
4H completed candle close: 64.45
EMA20: 55.152404 | EMA50: 57.565411
RSI14: 68.1
The 1H and 4H trends are mixed. Wait for confirmation.
RSI is elevated on at least one timeframe; momentum may be extended.
Bullish scenario: A confirmed move above the observed 1H resistance (64.92) may improve momentum.
Bearish scenario: A confirmed break below the observed 1H support (51.01) may increase downside risk.
These are conditional scenarios, not predictions or trading signals.
Educational content only. Not financial advice. Manage risk carefully.
$SOXLB #SOXLBUSDT #CryptoAnalysis #BinanceSpot #CryptoWizdom
MARKET SNAPSHOT: 11 Nov 2026, 06:11:36 PM IST
DATA SOURCE: Binance public market data
24H change: +20.55%
24H quote volume: $53,286,788
1H trend: Bullish
1H candle close time: 11 Nov 2026, 05:29:59 PM IST
1H completed candle close: 64.45
EMA20: 60.464577 | EMA50: 56.560026
RSI14: 70.7
4H trend: Mixed
4H candle close time: 11 Nov 2026, 05:29:59 PM IST
4H completed candle close: 64.45
EMA20: 55.152404 | EMA50: 57.565411
RSI14: 68.1
The 1H and 4H trends are mixed. Wait for confirmation.
RSI is elevated on at least one timeframe; momentum may be extended.
Bullish scenario: A confirmed move above the observed 1H resistance (64.92) may improve momentum.
Bearish scenario: A confirmed break below the observed 1H support (51.01) may increase downside risk.
These are conditional scenarios, not predictions or trading signals.
Educational content only. Not financial advice. Manage risk carefully.
$SOXLB #SOXLBUSDT #CryptoAnalysis #BinanceSpot #CryptoWizdom
84

·
--
Bearish
Future signal
$SOXL
{future}(SOXLUSDT)
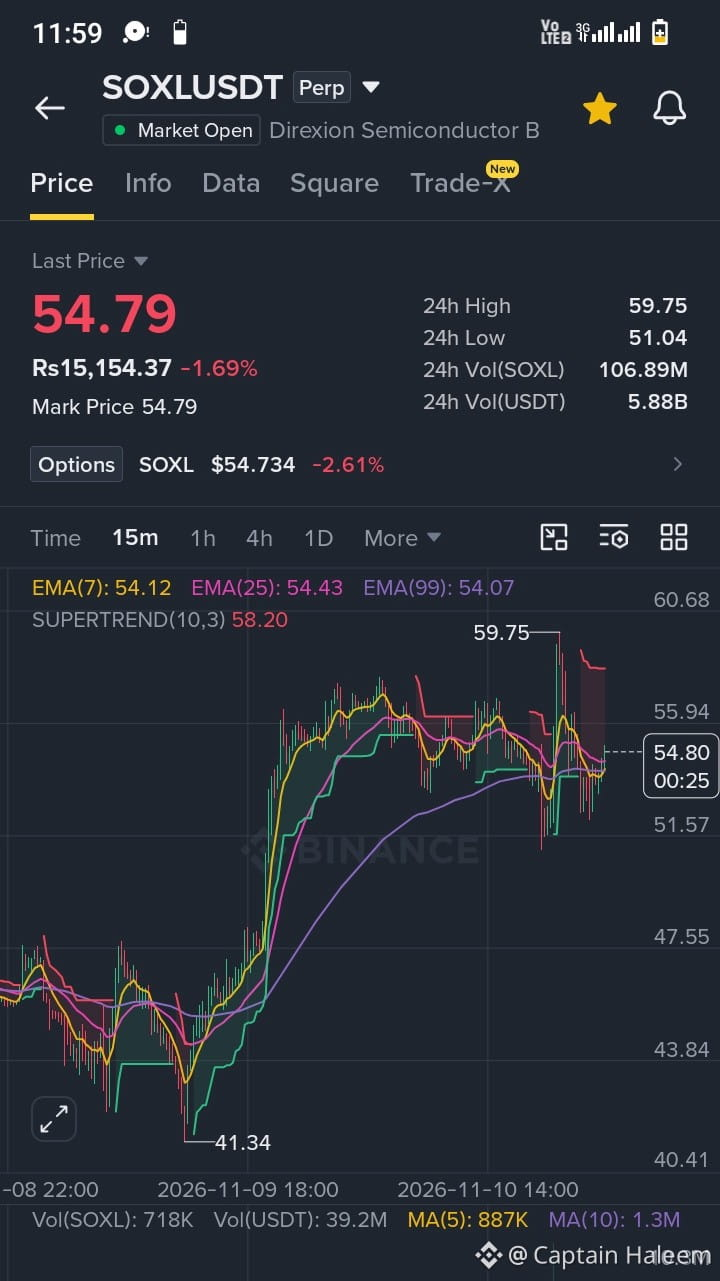
sell short 🟥
entry level current market price
leverage Full x
margin 5%
time frame 1 day
TP SL resistance and support level
keep Hold
be patience
follow me for more signals
#CaptainHaleem #WithCaptainHaleem #SOXLBUSDT #NvidiaInvestigatesAfterHuang’sAffairApology #AnthropicRejectsIPODelayValuationinQuestion
Future signal
$SOXL
sell short 🟥
entry level current market price
leverage Full x
margin 5%
time frame 1 day
TP SL resistance and support level
keep Hold
be patience
follow me for more signals
#CaptainHaleem #WithCaptainHaleem #SOXLBUSDT #NvidiaInvestigatesAfterHuang’sAffairApology #AnthropicRejectsIPODelayValuationinQuestion
$SOXL
sell short 🟥
entry level current market price
leverage Full x
margin 5%
time frame 1 day
TP SL resistance and support level
keep Hold
be patience
follow me for more signals
#CaptainHaleem #WithCaptainHaleem #SOXLBUSDT #NvidiaInvestigatesAfterHuang’sAffairApology #AnthropicRejectsIPODelayValuationinQuestion
82

·
--
Bullish
🚨 $SOXL — THE MARKET IS ABOUT TO OPEN! 🔥
⏰ The US stock market is about to open, and volatility could bring some big opportunities!
Today, I'm watching $SOXL very closely. 👀
But remember:
📊 Don't trade emotionally.
🛡️ Protect your capital.
🎯 Watch key support and resistance levels.
⚠️ Never ignore risk management.
The smartest traders don't chase every move — they wait for the right opportunity!
Are you BULLISH 🟢 or BEARISH 🔴 on SOXL today?
Drop your prediction below! 👇🔥
#SOXLBUSDT #stockmarketupdate #TradingCommunity #NASDAQ #WallStreetNews
$SOXL
{future}(SOXLUSDT)
🚨 $SOXL — THE MARKET IS ABOUT TO OPEN! 🔥
⏰ The US stock market is about to open, and volatility could bring some big opportunities!
Today, I'm watching $SOXL very closely. 👀
But remember:
📊 Don't trade emotionally.
🛡️ Protect your capital.
🎯 Watch key support and resistance levels.
⚠️ Never ignore risk management.
The smartest traders don't chase every move — they wait for the right opportunity!
Are you BULLISH 🟢 or BEARISH 🔴 on SOXL today?
Drop your prediction below! 👇🔥
#SOXLBUSDT #stockmarketupdate #TradingCommunity #NASDAQ #WallStreetNews
$SOXL
⏰ The US stock market is about to open, and volatility could bring some big opportunities!
Today, I'm watching $SOXL very closely. 👀
But remember:
📊 Don't trade emotionally.
🛡️ Protect your capital.
🎯 Watch key support and resistance levels.
⚠️ Never ignore risk management.
The smartest traders don't chase every move — they wait for the right opportunity!
Are you BULLISH 🟢 or BEARISH 🔴 on SOXL today?
Drop your prediction below! 👇🔥
#SOXLBUSDT #stockmarketupdate #TradingCommunity #NASDAQ #WallStreetNews
$SOXL

743

·
--
Bullish
🚀 TWO BIG TARGETS. ONE BIG QUESTION: HOW HIGH CAN THEY GO?
🤔 Imagine waking up one morning and seeing these two price targets hit!
🔥 SNDK→ $1,000 ⚡ $SOXL → $150
Is it possible? Let's look at the bigger picture.
💾 SNDK (SanDisk)
AI infrastructure and data-center demand are creating strong opportunities for the memory and storage industry. SanDisk recently reported strong quarterly growth, keeping investors focused on its future potential.
🎯 The dream target: $1,000
🚀 SOXL (Semiconductor Bull 3X ETF)
The semiconductor sector remains one of the most exciting areas of the technology market. If chip stocks continue gaining momentum, could SOXL make another powerful move?
🎯 The dream target: $150
But here's the real question:
Will AI demand, semiconductor growth, and market momentum be strong enough to take these two assets to those levels?
Nobody knows the exact timeline. Markets can surprise us in both directions.
👀 Which target do you think we'll see first?
💬 Comment below: 1️⃣ SNDK at $1,000 2️⃣ SOXL at $150
🔥 Let's hear your prediction!
$SNDK $SOXL
{future}(SOXLUSDT)
{future}(SNDKUSDT)
#SNDK #SOXLBUSDT #stockmarket #BinanceSquare
🚀 TWO BIG TARGETS. ONE BIG QUESTION: HOW HIGH CAN THEY GO?
🤔 Imagine waking up one morning and seeing these two price targets hit!
🔥 SNDK→ $1,000 ⚡ $SOXL → $150
Is it possible? Let's look at the bigger picture.
💾 SNDK (SanDisk)
AI infrastructure and data-center demand are creating strong opportunities for the memory and storage industry. SanDisk recently reported strong quarterly growth, keeping investors focused on its future potential.
🎯 The dream target: $1,000
🚀 SOXL (Semiconductor Bull 3X ETF)
The semiconductor sector remains one of the most exciting areas of the technology market. If chip stocks continue gaining momentum, could SOXL make another powerful move?
🎯 The dream target: $150
But here's the real question:
Will AI demand, semiconductor growth, and market momentum be strong enough to take these two assets to those levels?
Nobody knows the exact timeline. Markets can surprise us in both directions.
👀 Which target do you think we'll see first?
💬 Comment below: 1️⃣ SNDK at $1,000 2️⃣ SOXL at $150
🔥 Let's hear your prediction!
$SNDK $SOXL
#SNDK #SOXLBUSDT #stockmarket #BinanceSquare
🤔 Imagine waking up one morning and seeing these two price targets hit!
🔥 SNDK→ $1,000 ⚡ $SOXL → $150
Is it possible? Let's look at the bigger picture.
💾 SNDK (SanDisk)
AI infrastructure and data-center demand are creating strong opportunities for the memory and storage industry. SanDisk recently reported strong quarterly growth, keeping investors focused on its future potential.
🎯 The dream target: $1,000
🚀 SOXL (Semiconductor Bull 3X ETF)
The semiconductor sector remains one of the most exciting areas of the technology market. If chip stocks continue gaining momentum, could SOXL make another powerful move?
🎯 The dream target: $150
But here's the real question:
Will AI demand, semiconductor growth, and market momentum be strong enough to take these two assets to those levels?
Nobody knows the exact timeline. Markets can surprise us in both directions.
👀 Which target do you think we'll see first?
💬 Comment below: 1️⃣ SNDK at $1,000 2️⃣ SOXL at $150
🔥 Let's hear your prediction!
$SNDK $SOXL
#SNDK #SOXLBUSDT #stockmarket #BinanceSquare

1
83

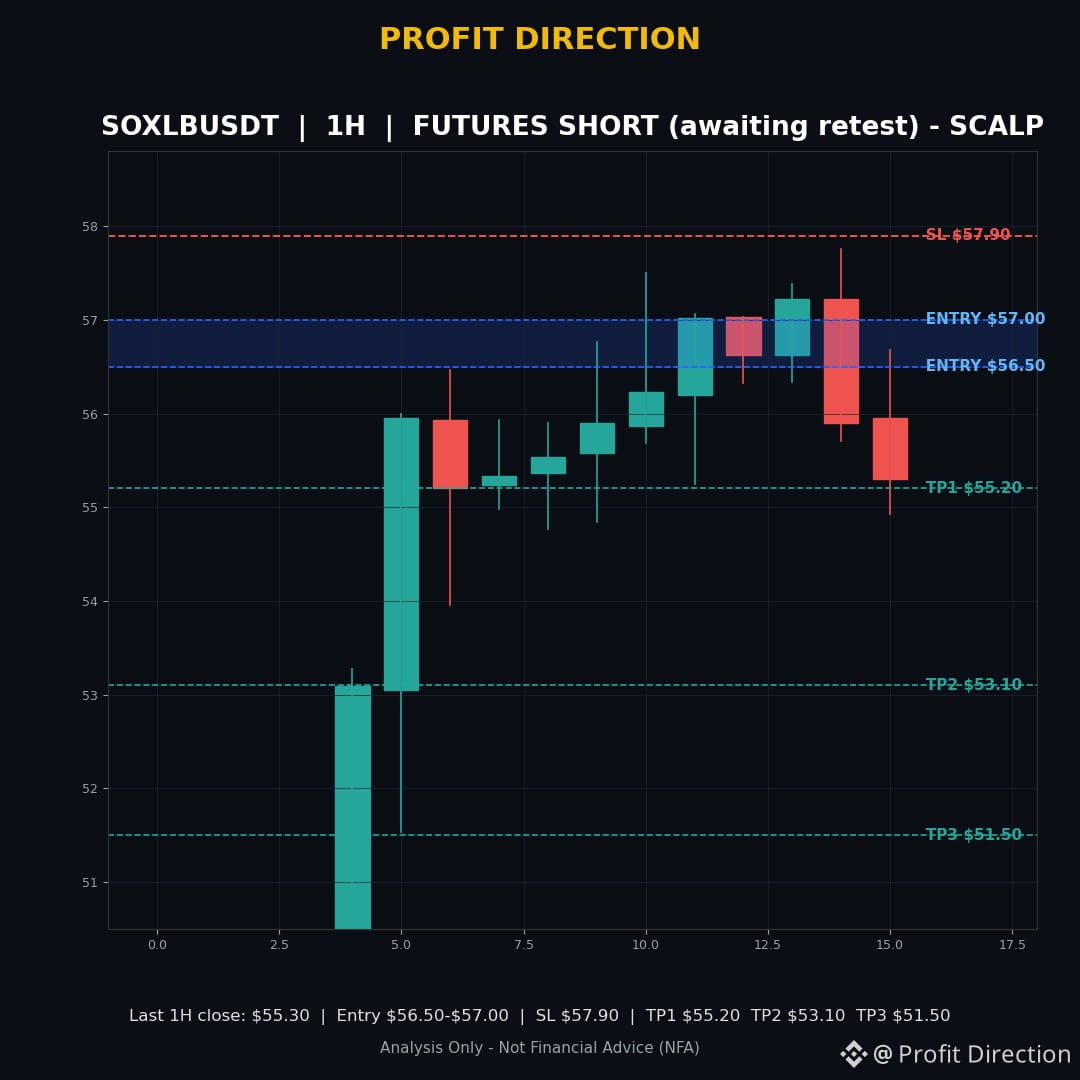
🔴 SOXLBUSDT — FUTURES SHORT (awaiting retest)
$SOXLB
Entry Zone: $56.50 – $57.00
Stop Loss: $57.90
TP1: $55.20
TP2: $53.10
TP3: $51.50
R:R: 1:1.35 (TP1) | 1:3.17 (TP2) | 1:4.57 (TP3)
TF: 1H (SCALP)
SOXLB ran up more than 25% in a day on a near-vertical spike, then hit the same $57.50 ceiling again and again — four times in a few hours — and every time sellers pushed it back down. The last 1H candle closed at $55.90 after touching $57.76, a clear rejection. I am not chasing the fall; I am waiting for a bounce back into the ceiling zone.
Why I like this one: a level tested four times and rejected four times is a real resistance, not a random wick. The spike came on huge volume and the rejection came with lower highs forming. If price comes back to $56.50–$57.00 and rejects again, the first target is $55.20, then $53.10, then $51.50. With Tuesday's CPI report ahead, I am watching this one closely — a hot print could shake the whole market, so the stop loss stays non-negotiable.
Invalidation: a 1H close above $57.80 kills this idea — that would mean buyers finally broke the ceiling. No trade until the retest zone is touched.
Analysis Only — Not Financial Advice (NFA). Trading involves risk.
Follow Profit Direction for more signals, best signals and market updates. Share your opinion in the comments.
Do you think SOXLB will retest $57.00 and reject it, or break above $57.80 first? Comment SHORT or LONG.
#SOXLB #SOXLBUSDT #CryptoTrading #BinanceFutures
🔴 SOXLBUSDT — FUTURES SHORT (awaiting retest)
$SOXLB
Entry Zone: $56.50 – $57.00
Stop Loss: $57.90
TP1: $55.20
TP2: $53.10
TP3: $51.50
R:R: 1:1.35 (TP1) | 1:3.17 (TP2) | 1:4.57 (TP3)
TF: 1H (SCALP)
SOXLB ran up more than 25% in a day on a near-vertical spike, then hit the same $57.50 ceiling again and again — four times in a few hours — and every time sellers pushed it back down. The last 1H candle closed at $55.90 after touching $57.76, a clear rejection. I am not chasing the fall; I am waiting for a bounce back into the ceiling zone.
Why I like this one: a level tested four times and rejected four times is a real resistance, not a random wick. The spike came on huge volume and the rejection came with lower highs forming. If price comes back to $56.50–$57.00 and rejects again, the first target is $55.20, then $53.10, then $51.50. With Tuesday's CPI report ahead, I am watching this one closely — a hot print could shake the whole market, so the stop loss stays non-negotiable.
Invalidation: a 1H close above $57.80 kills this idea — that would mean buyers finally broke the ceiling. No trade until the retest zone is touched.
Analysis Only — Not Financial Advice (NFA). Trading involves risk.
Follow Profit Direction for more signals, best signals and market updates. Share your opinion in the comments.
Do you think SOXLB will retest $57.00 and reject it, or break above $57.80 first? Comment SHORT or LONG.
#SOXLB #SOXLBUSDT #CryptoTrading #BinanceFutures
$SOXLB
Entry Zone: $56.50 – $57.00
Stop Loss: $57.90
TP1: $55.20
TP2: $53.10
TP3: $51.50
R:R: 1:1.35 (TP1) | 1:3.17 (TP2) | 1:4.57 (TP3)
TF: 1H (SCALP)
SOXLB ran up more than 25% in a day on a near-vertical spike, then hit the same $57.50 ceiling again and again — four times in a few hours — and every time sellers pushed it back down. The last 1H candle closed at $55.90 after touching $57.76, a clear rejection. I am not chasing the fall; I am waiting for a bounce back into the ceiling zone.
Why I like this one: a level tested four times and rejected four times is a real resistance, not a random wick. The spike came on huge volume and the rejection came with lower highs forming. If price comes back to $56.50–$57.00 and rejects again, the first target is $55.20, then $53.10, then $51.50. With Tuesday's CPI report ahead, I am watching this one closely — a hot print could shake the whole market, so the stop loss stays non-negotiable.
Invalidation: a 1H close above $57.80 kills this idea — that would mean buyers finally broke the ceiling. No trade until the retest zone is touched.
Analysis Only — Not Financial Advice (NFA). Trading involves risk.
Follow Profit Direction for more signals, best signals and market updates. Share your opinion in the comments.
Do you think SOXLB will retest $57.00 and reject it, or break above $57.80 first? Comment SHORT or LONG.
#SOXLB #SOXLBUSDT #CryptoTrading #BinanceFutures
77

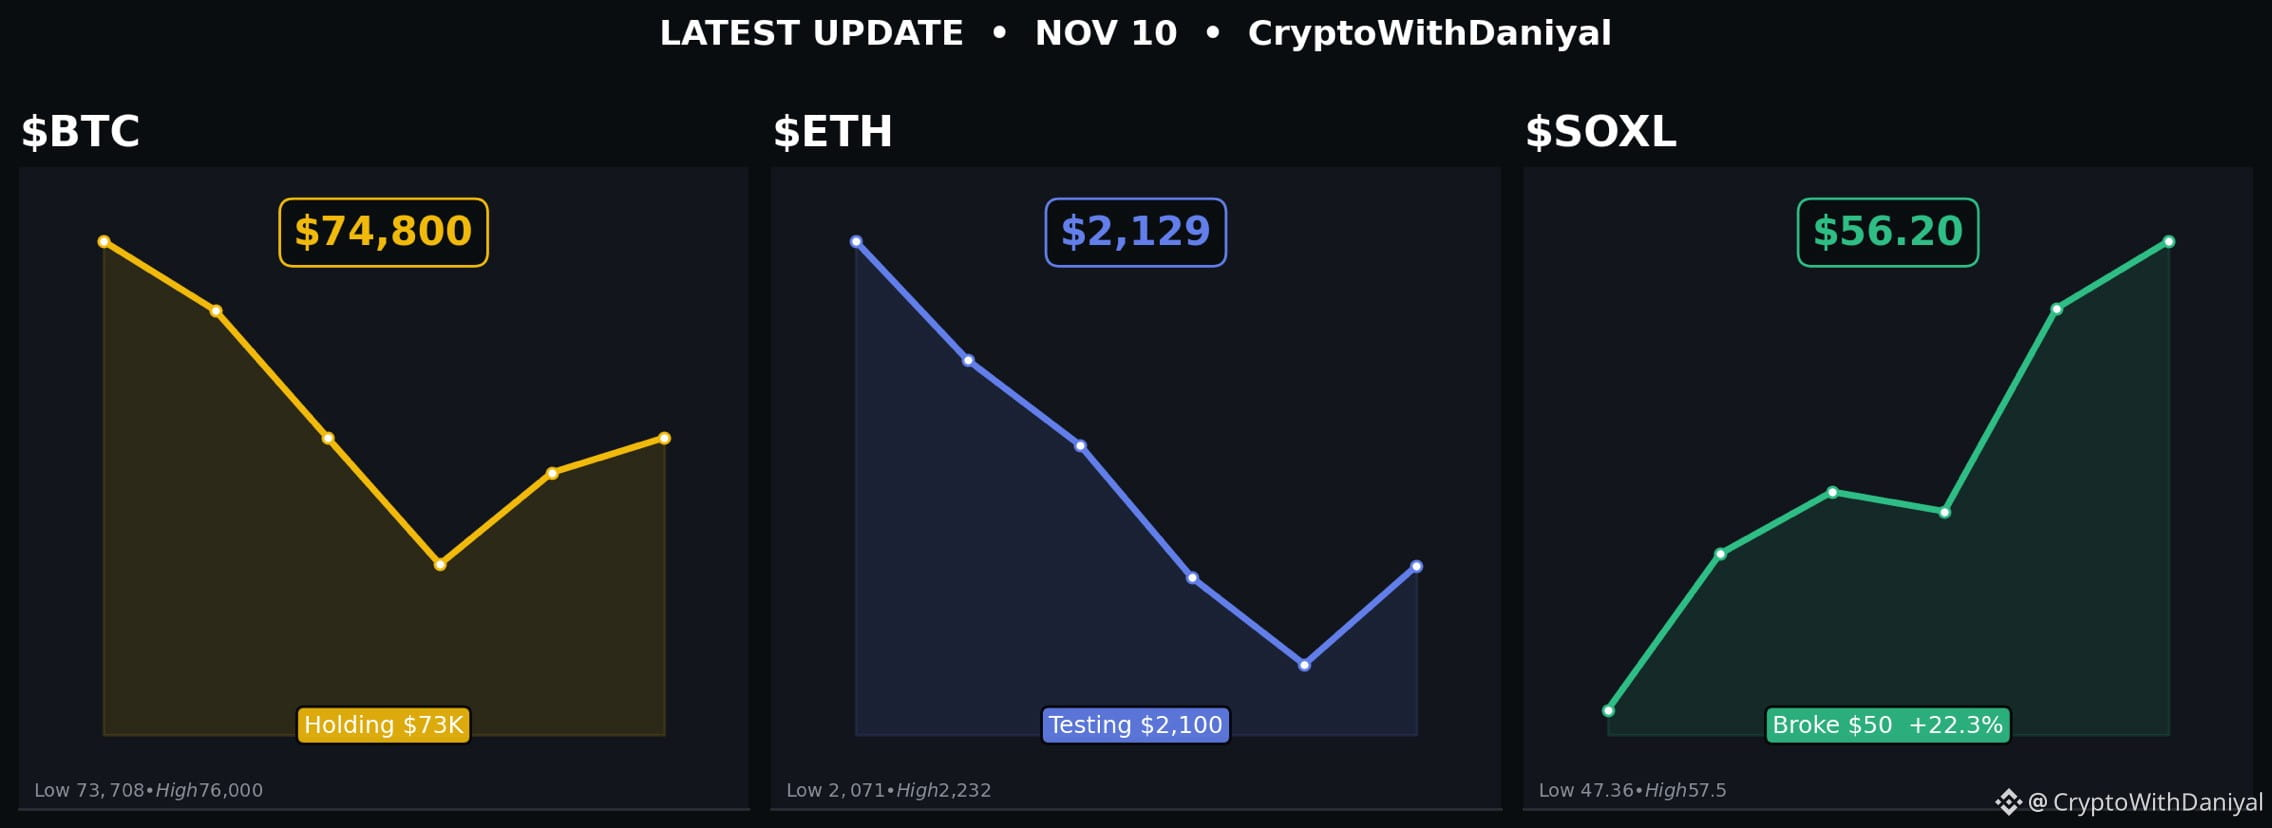
Latest Update 🔥
$BTC $74,800 - holding $73K
$ETH $2,129 - holding $2,100
$SOXL $56.20 - up 22% after breaking $50
My SOXL $50 call played out. My ETH $2,100 call is playing out now.
Market is waiting for US CPI tomorrow. No big trade before that.
Are you holding or waiting for CPI?
#BTC #ETH #SOXLBUSDT #binancepick #BinanceSquareFamily
{spot}(ETHUSDT)
{spot}(BTCUSDT)
{future}(SOXLUSDT)
Latest Update 🔥
$BTC $74,800 - holding $73K
$ETH $2,129 - holding $2,100
$SOXL $56.20 - up 22% after breaking $50
My SOXL $50 call played out. My ETH $2,100 call is playing out now.
Market is waiting for US CPI tomorrow. No big trade before that.
Are you holding or waiting for CPI?
#BTC #ETH #SOXLBUSDT #binancepick #BinanceSquareFamily
$BTC $74,800 - holding $73K
$ETH $2,129 - holding $2,100
$SOXL $56.20 - up 22% after breaking $50
My SOXL $50 call played out. My ETH $2,100 call is playing out now.
Market is waiting for US CPI tomorrow. No big trade before that.
Are you holding or waiting for CPI?
#BTC #ETH #SOXLBUSDT #binancepick #BinanceSquareFamily
Momentum Mirror:
Sure
27
26
8.3k

$SOXL What a beautiful way to start the trading session! The market opened on a positive note, bringing some exciting momentum. Let's see how the day unfolds! 🚀📈💚
#SOXL行情 #StockMarket #SOXLBUSDT #SquareBinance #Binance
{future}(SOXLUSDT)
$SOXL What a beautiful way to start the trading session! The market opened on a positive note, bringing some exciting momentum. Let's see how the day unfolds! 🚀📈💚
#SOXL行情 #StockMarket #SOXLBUSDT #SquareBinance #Binance
#SOXL行情 #StockMarket #SOXLBUSDT #SquareBinance #Binance


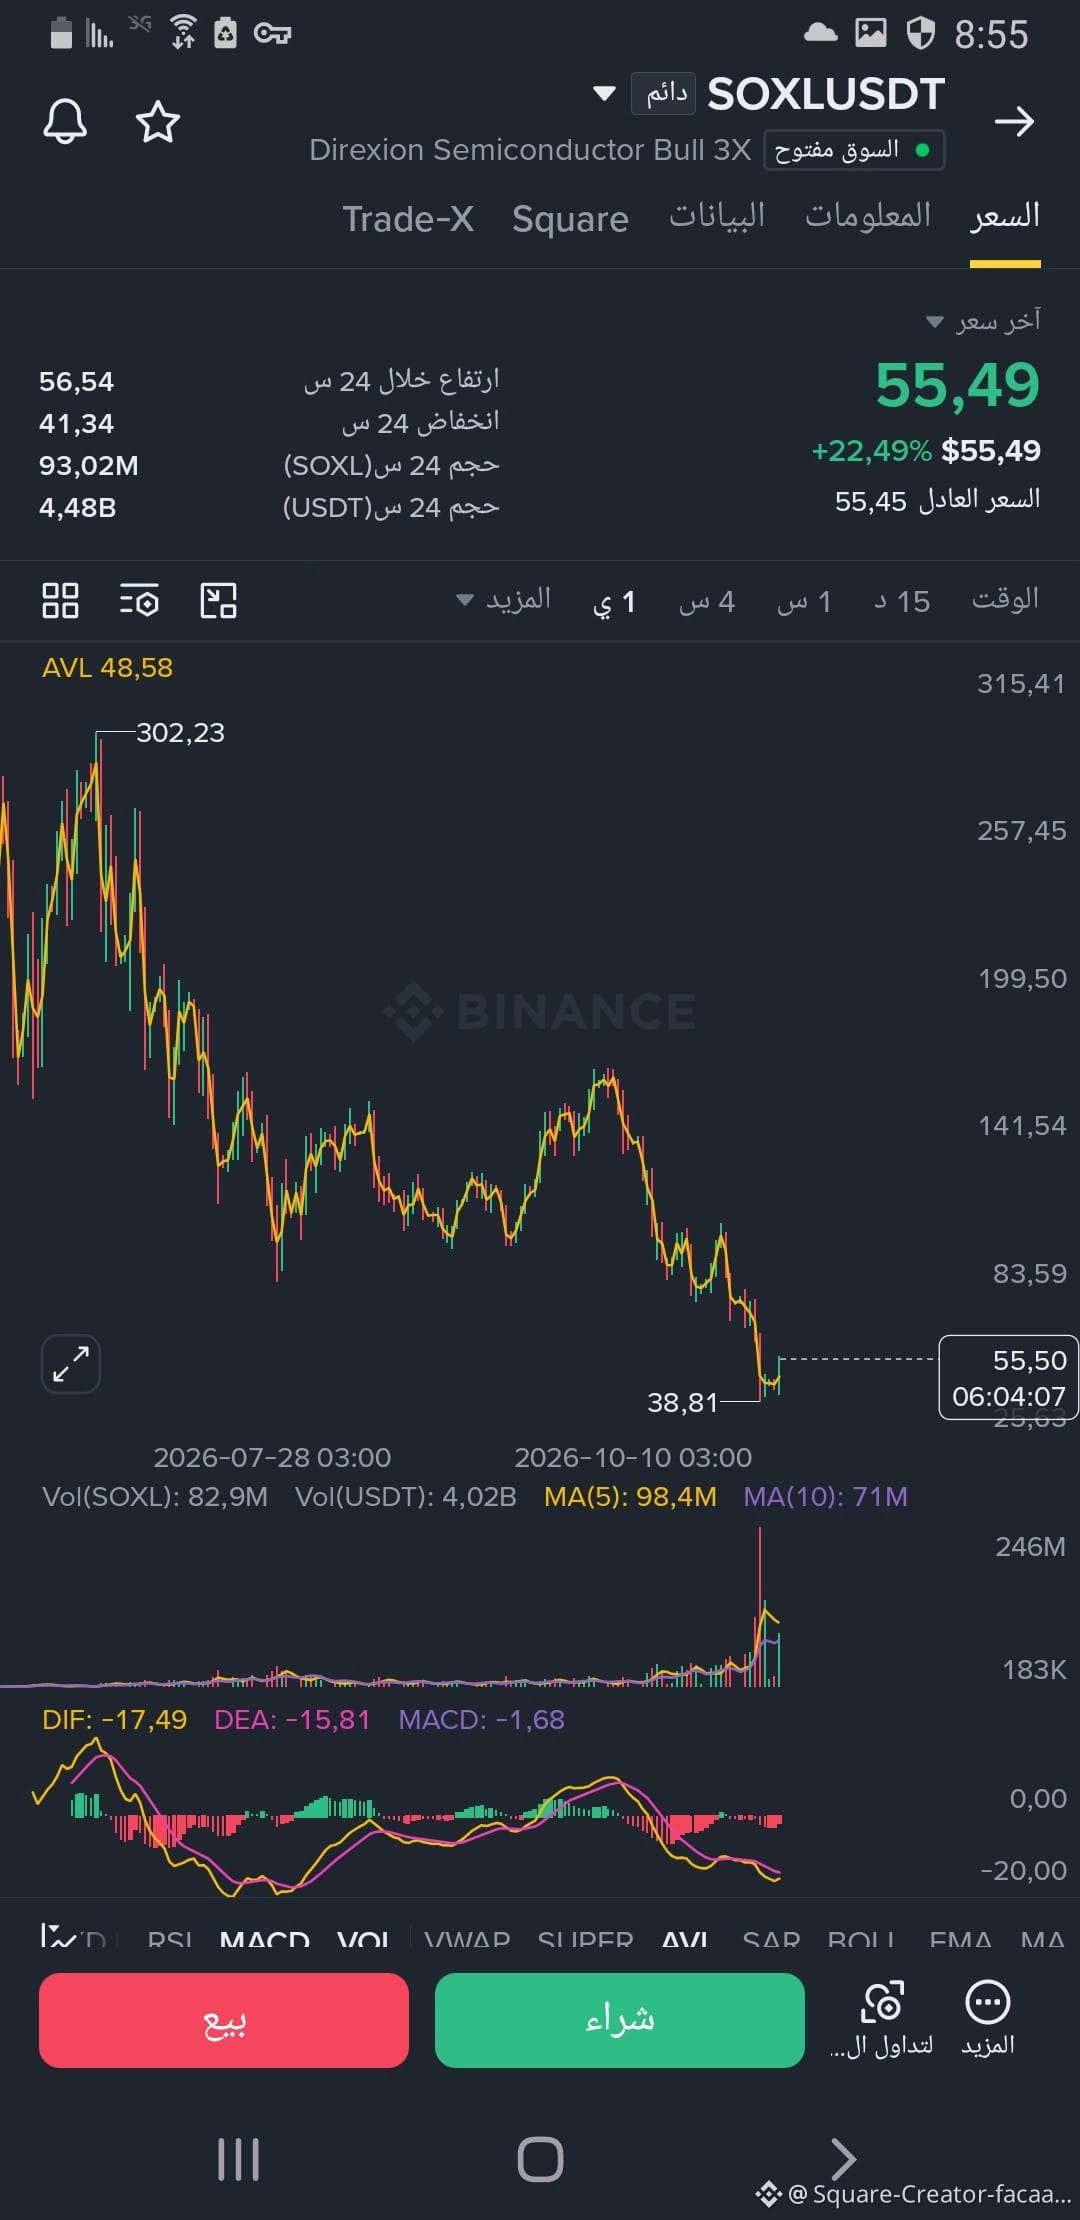
Whales' stock has started its meteoric rise again. Will it return to its previous peak? The stock price had exceeded $300 dollars
$SOXL 🚀🔥#SOXLBUSDT 🔥🚀
{future}(SOXLUSDT)
#solana 🔥
Whales' stock has started its meteoric rise again. Will it return to its previous peak? The stock price had exceeded $300 dollars
$SOXL 🚀🔥#SOXLBUSDT 🔥🚀
#solana 🔥
$SOXL 🚀🔥#SOXLBUSDT 🔥🚀
#solana 🔥
Walid Al-Jaadbi:
يحتاج الا بعض الوقت للصعود الى القمة الولة بعيد جدآ $SOXLB 🚀🔥
2
2
216

·
--
Bullish
🚀 $SOXLB Market Update | #SOXLBUSDT
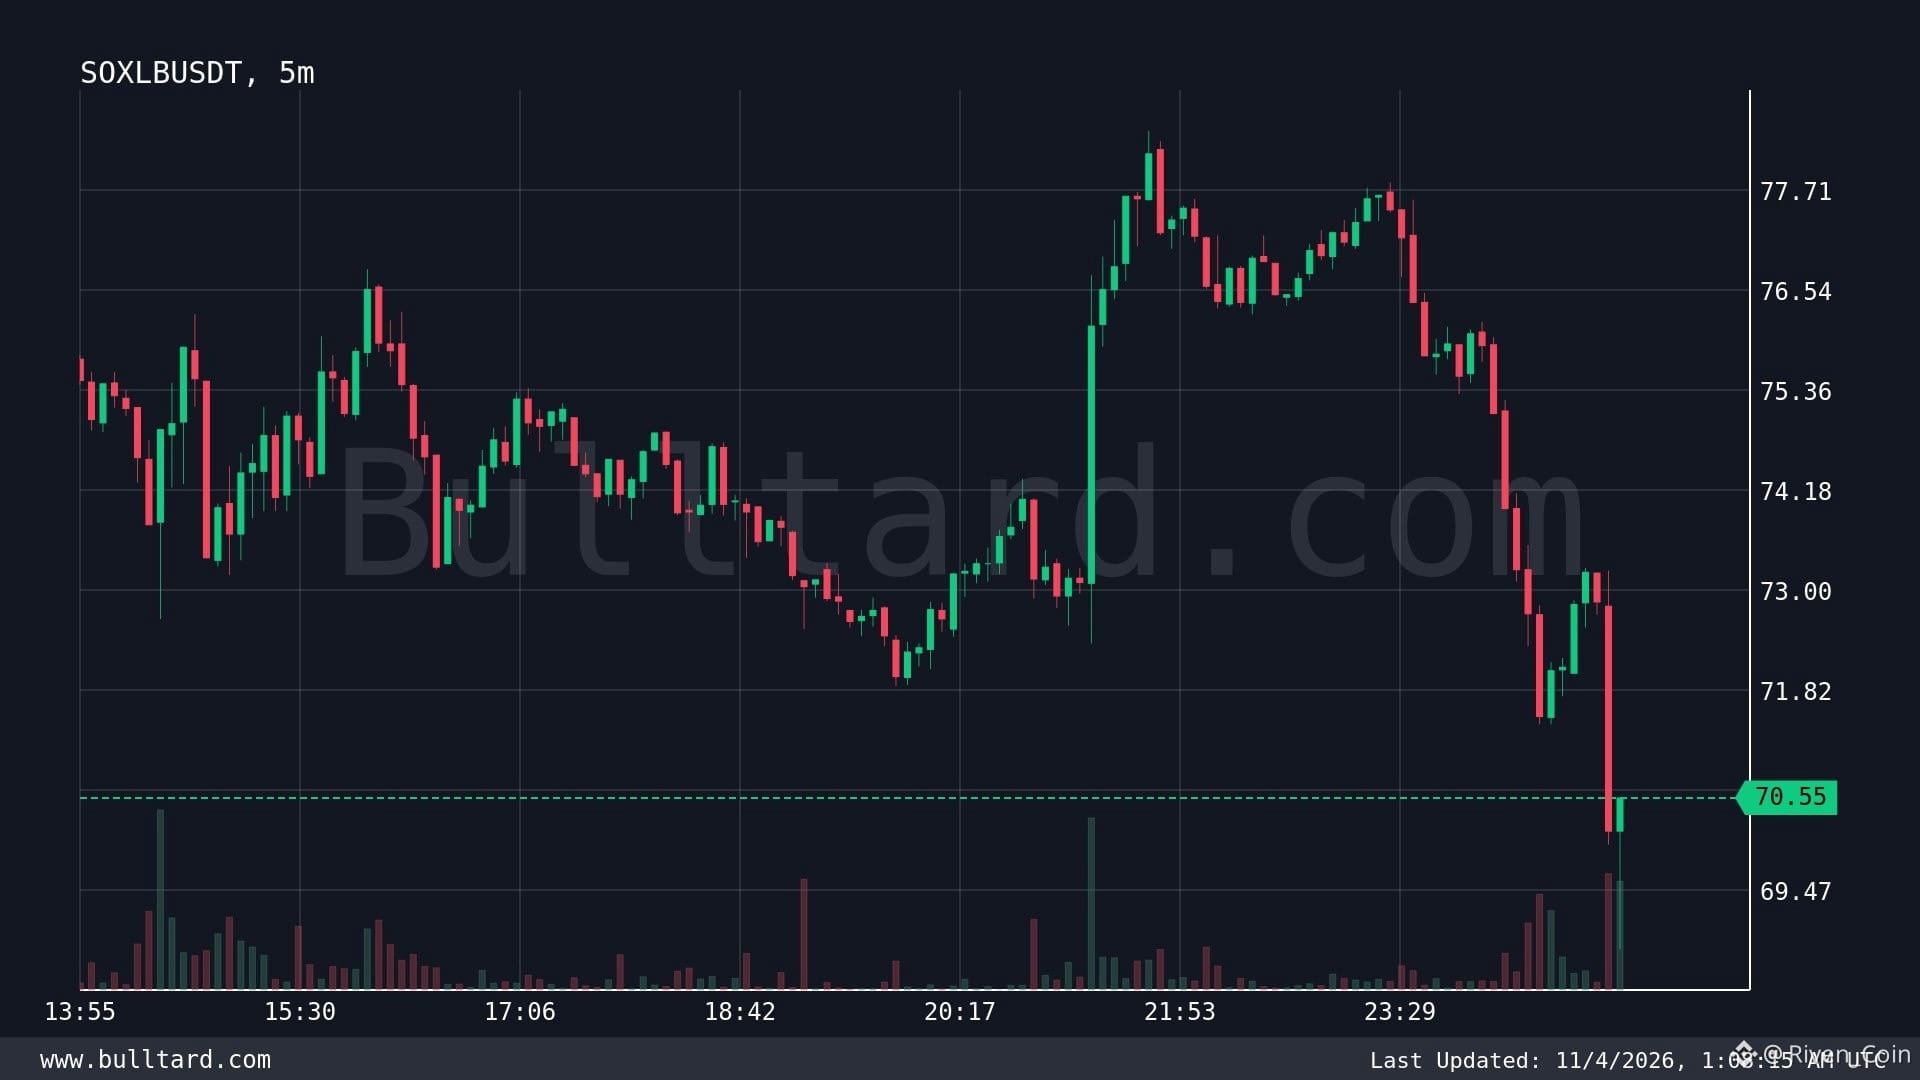
SOXLB is trading at 70.55 with a slight 0.4% decline over the last 24 hours. However short-term momentum is showing signs of strength as the price jumped 1.6% within just one minute. Trading activity reached 43.7K USDT during that minute with buyers contributing 27.3K USDT or 63% of the total volume. Meanwhile 24-hour trading volume on Binance stands at 20.1M USDT. Buyers are currently showing stronger short-term activity so SOXLB is worth keeping on the watchlist. 📈
#Rivencoin
🚀 $SOXLB Market Update | #SOXLBUSDT
SOXLB is trading at 70.55 with a slight 0.4% decline over the last 24 hours. However short-term momentum is showing signs of strength as the price jumped 1.6% within just one minute. Trading activity reached 43.7K USDT during that minute with buyers contributing 27.3K USDT or 63% of the total volume. Meanwhile 24-hour trading volume on Binance stands at 20.1M USDT. Buyers are currently showing stronger short-term activity so SOXLB is worth keeping on the watchlist. 📈
#Rivencoin
SOXLB is trading at 70.55 with a slight 0.4% decline over the last 24 hours. However short-term momentum is showing signs of strength as the price jumped 1.6% within just one minute. Trading activity reached 43.7K USDT during that minute with buyers contributing 27.3K USDT or 63% of the total volume. Meanwhile 24-hour trading volume on Binance stands at 20.1M USDT. Buyers are currently showing stronger short-term activity so SOXLB is worth keeping on the watchlist. 📈
#Rivencoin
315

·
--
🚨 $SOXL
{future}(SOXLUSDT)
: Buying opportunity or will the correction continue?
The $SOXL ETF suffered a sharp 24.75% drop, pressured by Intel's weakness, concerns about artificial intelligence spending, and pressure on the semiconductor sector.
However, on October 31, a Seeking Alpha analysis appeared with a favorable outlook for semiconductors heading into year-end.
📊 What should we watch?
- Recovery in NVIDIA and $AMDB .
- Intel's results and outlook.
- Investment in AI by big tech companies.
- Recovery in the semiconductor index.
🔥 The question is: are we seeing a correction before another upward surge, or a trend reversal?
⚠️ Remember: SOXL uses 3X daily leverage and can significantly amplify losses.
#SOXLBUSDT #NASDAQ #Semiconductores s #NVIDIA #AMD
🚨 $SOXL
: Buying opportunity or will the correction continue?
The $SOXL ETF suffered a sharp 24.75% drop, pressured by Intel's weakness, concerns about artificial intelligence spending, and pressure on the semiconductor sector.
However, on October 31, a Seeking Alpha analysis appeared with a favorable outlook for semiconductors heading into year-end.
📊 What should we watch?
- Recovery in NVIDIA and $AMDB .
- Intel's results and outlook.
- Investment in AI by big tech companies.
- Recovery in the semiconductor index.
🔥 The question is: are we seeing a correction before another upward surge, or a trend reversal?
⚠️ Remember: SOXL uses 3X daily leverage and can significantly amplify losses.
#SOXLBUSDT #NASDAQ #Semiconductores s #NVIDIA #AMD
: Buying opportunity or will the correction continue?
The $SOXL ETF suffered a sharp 24.75% drop, pressured by Intel's weakness, concerns about artificial intelligence spending, and pressure on the semiconductor sector.
However, on October 31, a Seeking Alpha analysis appeared with a favorable outlook for semiconductors heading into year-end.
📊 What should we watch?
- Recovery in NVIDIA and $AMDB .
- Intel's results and outlook.
- Investment in AI by big tech companies.
- Recovery in the semiconductor index.
🔥 The question is: are we seeing a correction before another upward surge, or a trend reversal?
⚠️ Remember: SOXL uses 3X daily leverage and can significantly amplify losses.
#SOXLBUSDT #NASDAQ #Semiconductores s #NVIDIA #AMD
2
294

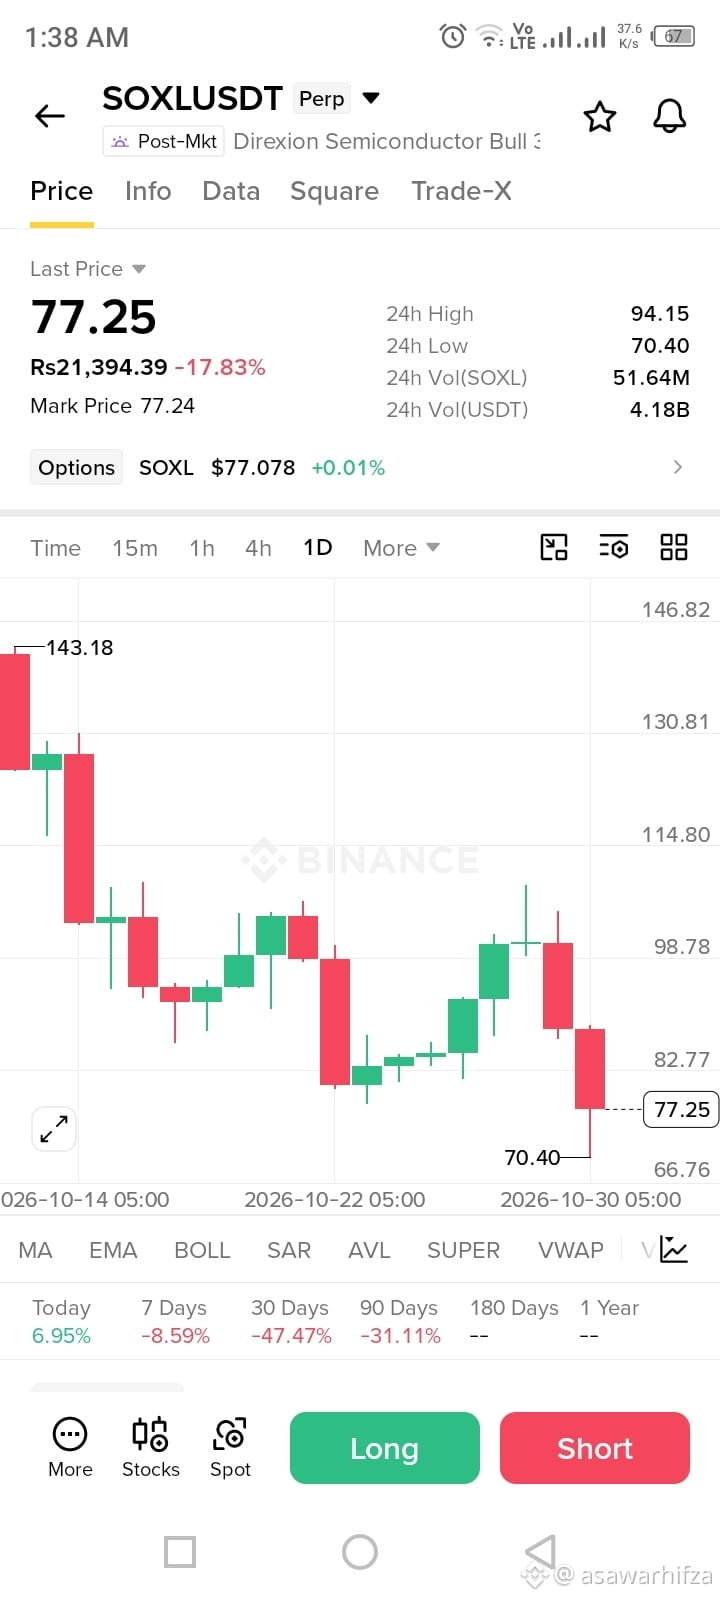
$SOXL SOXL just dropped ~47% in 30 days — a reminder that 3x leveraged products amplify losses as fast as gains, so size positions small and never trade them without a stop-loss.Not financial advice.
$SOXL
{future}(SOXLUSDT)
#SOXLBUSDT #USDT #Binance #crypto #Market_Update $SOXL
$SOXL SOXL just dropped ~47% in 30 days — a reminder that 3x leveraged products amplify losses as fast as gains, so size positions small and never trade them without a stop-loss.Not financial advice.
$SOXL
#SOXLBUSDT #USDT #Binance #crypto #Market_Update $SOXL
$SOXL
#SOXLBUSDT #USDT #Binance #crypto #Market_Update $SOXL
1
856
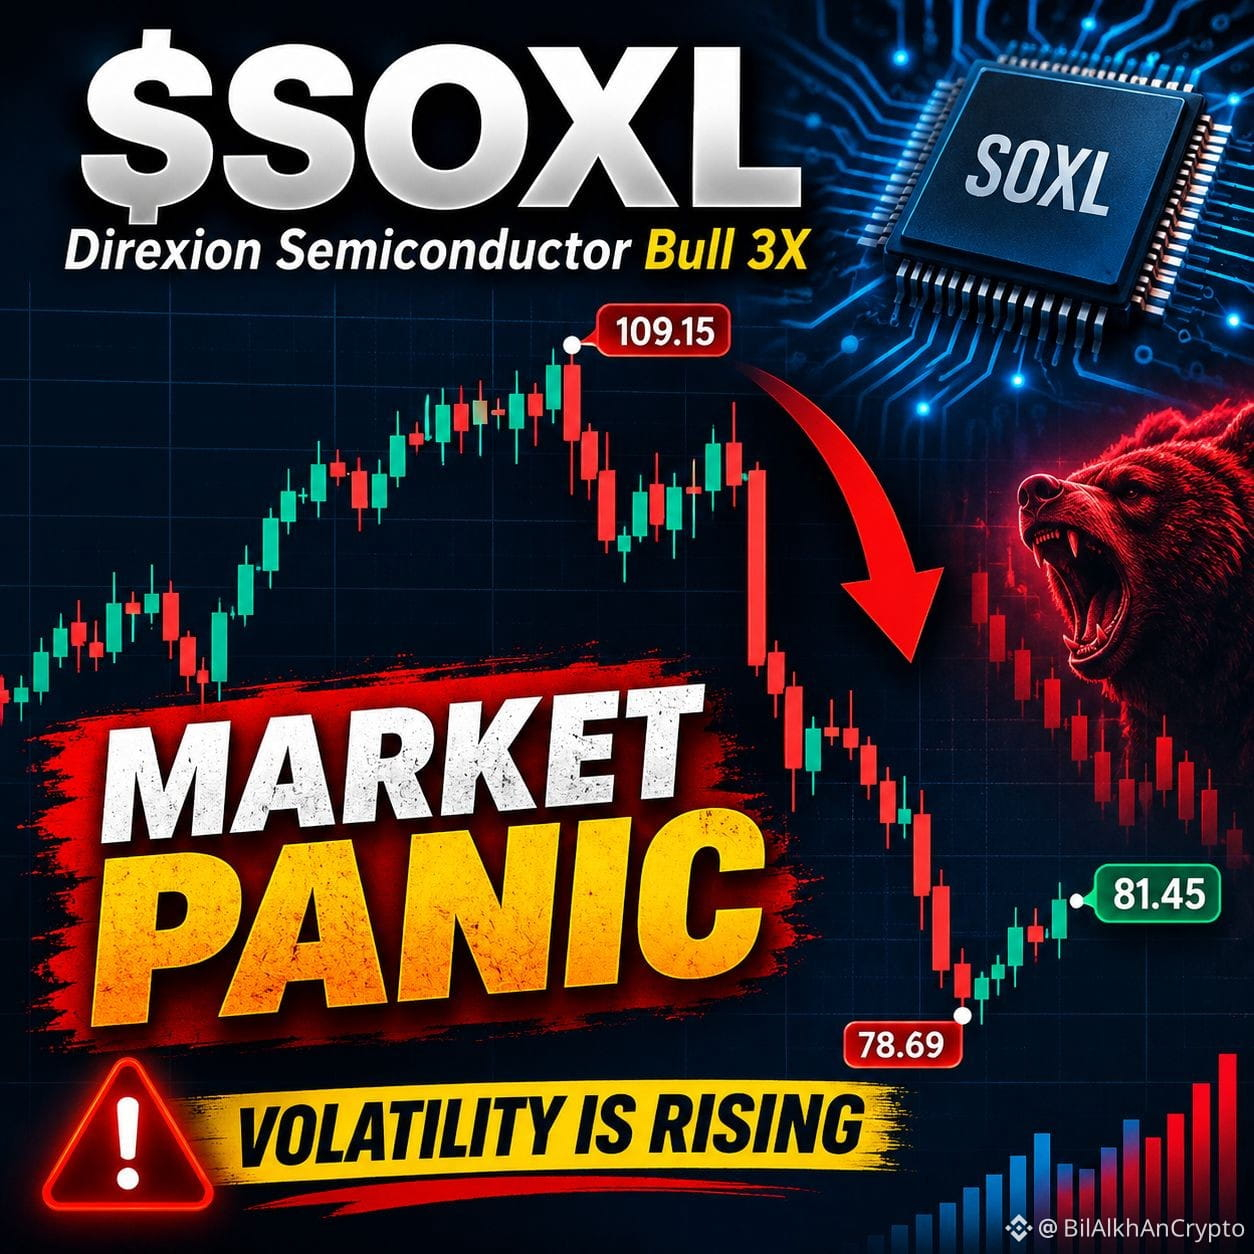
$SOXL 😰 The market is looking pretty scary right now, and you can feel the panic among traders. It's definitely a stressful time, so stay calm, manage your risk, and don't let emotions control your decisions. 🤧📉
#SOXLBUSDT #StockMarket #trading #MarketVolatility #DayTrading
{future}(SOXLUSDT)
$SOXL 😰 The market is looking pretty scary right now, and you can feel the panic among traders. It's definitely a stressful time, so stay calm, manage your risk, and don't let emotions control your decisions. 🤧📉
#SOXLBUSDT #StockMarket #trading #MarketVolatility #DayTrading
#SOXLBUSDT #StockMarket #trading #MarketVolatility #DayTrading
1
972

·
--
Bullish
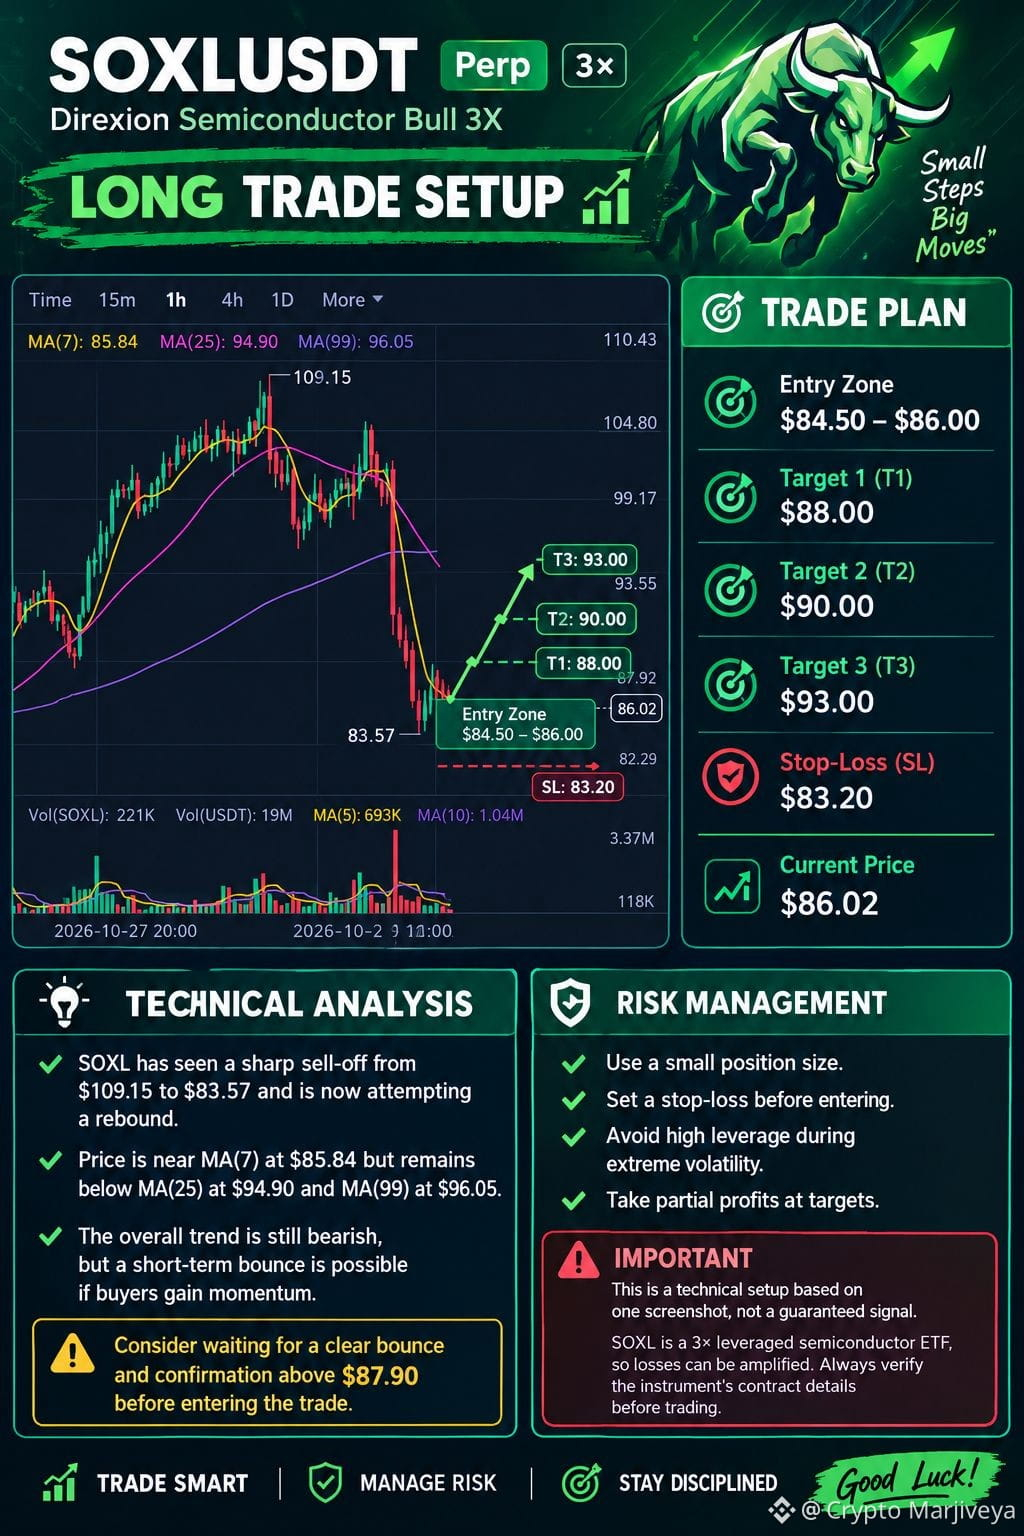
🚀 $SOXL USDT — LONG TRADE SETUP 📈
💰 Current Price: $86.02
📊 Entry Zone: $84.50–$86.00
🎯 Target 1: $88.00
🎯 Target 2: $90.00
🎯 Target 3: $93.00
🛑 Stop-Loss: $83.20
🔍 Technical Analysis:
$SOXL has experienced a sharp sell-off from $109.15 to $83.57 and is attempting a small rebound. The price is near the MA(7) at $85.84 but remains below the MA(25) at $94.90 and MA(99) at $96.05.
⚠️ Important: The overall trend remains bearish. A long trade is risky until buyers show stronger momentum. Consider waiting for a clear bounce and confirmation above $87.90 before entering.
💡 Risk Management:
✅ Use a small position size.
✅ Set a stop-loss before entering.
✅ Avoid high leverage during extreme volatility.
✅ Take partial profits at targets.
📢 Remember: This is a technical setup based on one screenshot, not a guaranteed signal. SOXL is a 3× leveraged semiconductor ETF, so losses can be amplified. Verify the instrument's contract details before trading.
#SOXLBUSDT #cryptotrading #tradingStrategy #RiskManagementMastery #BinanceWillListPredictPREDICT
{etf_us}(SOXL.ETF)
🚀 $SOXL USDT — LONG TRADE SETUP 📈
💰 Current Price: $86.02
📊 Entry Zone: $84.50–$86.00
🎯 Target 1: $88.00
🎯 Target 2: $90.00
🎯 Target 3: $93.00
🛑 Stop-Loss: $83.20
🔍 Technical Analysis:
$SOXL has experienced a sharp sell-off from $109.15 to $83.57 and is attempting a small rebound. The price is near the MA(7) at $85.84 but remains below the MA(25) at $94.90 and MA(99) at $96.05.
⚠️ Important: The overall trend remains bearish. A long trade is risky until buyers show stronger momentum. Consider waiting for a clear bounce and confirmation above $87.90 before entering.
💡 Risk Management:
✅ Use a small position size.
✅ Set a stop-loss before entering.
✅ Avoid high leverage during extreme volatility.
✅ Take partial profits at targets.
📢 Remember: This is a technical setup based on one screenshot, not a guaranteed signal. SOXL is a 3× leveraged semiconductor ETF, so losses can be amplified. Verify the instrument's contract details before trading.
#SOXLBUSDT #cryptotrading #tradingStrategy #RiskManagementMastery #BinanceWillListPredictPREDICT
💰 Current Price: $86.02
📊 Entry Zone: $84.50–$86.00
🎯 Target 1: $88.00
🎯 Target 2: $90.00
🎯 Target 3: $93.00
🛑 Stop-Loss: $83.20
🔍 Technical Analysis:
$SOXL has experienced a sharp sell-off from $109.15 to $83.57 and is attempting a small rebound. The price is near the MA(7) at $85.84 but remains below the MA(25) at $94.90 and MA(99) at $96.05.
⚠️ Important: The overall trend remains bearish. A long trade is risky until buyers show stronger momentum. Consider waiting for a clear bounce and confirmation above $87.90 before entering.
💡 Risk Management:
✅ Use a small position size.
✅ Set a stop-loss before entering.
✅ Avoid high leverage during extreme volatility.
✅ Take partial profits at targets.
📢 Remember: This is a technical setup based on one screenshot, not a guaranteed signal. SOXL is a 3× leveraged semiconductor ETF, so losses can be amplified. Verify the instrument's contract details before trading.
#SOXLBUSDT #cryptotrading #tradingStrategy #RiskManagementMastery #BinanceWillListPredictPREDICT
SOXL-2.28%
SOXLETF-14.90%
1
1.8k

·
--
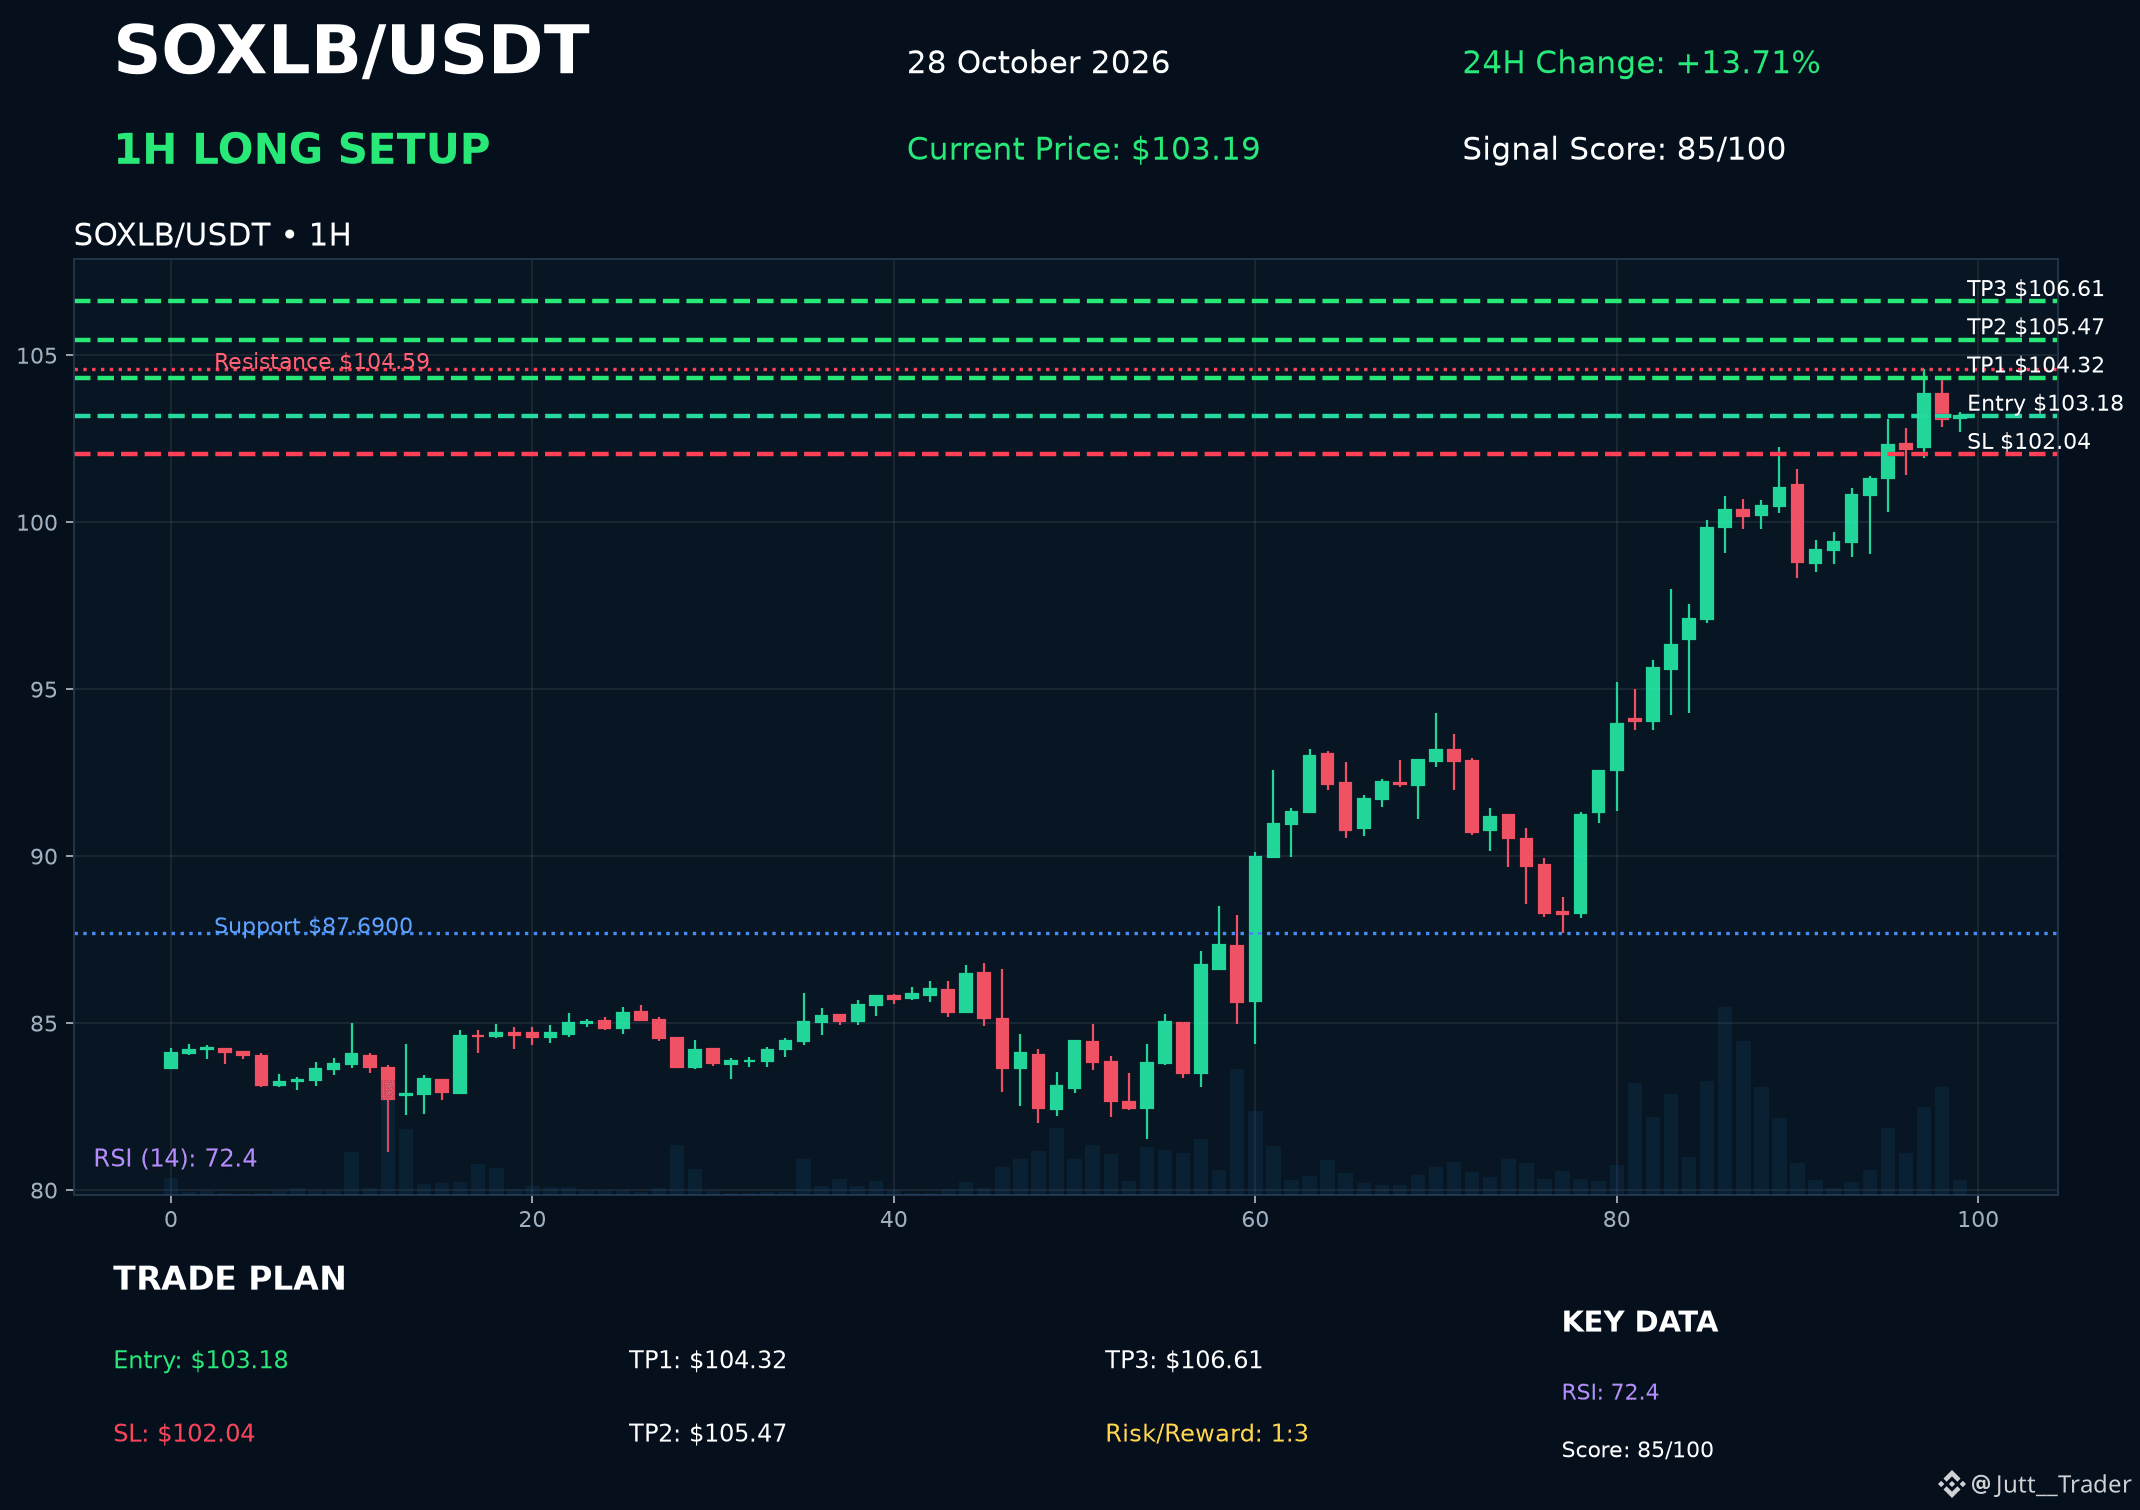
SOXLBUSDT | LONG
Signal Score: 85/100
Risk/Reward: 1:3
Market Trend:
• 4H: BULLISH
• 1H: BULLISH
• 15M: BULLISH
• 1M: NEUTRAL
• RSI: 61.21
Trade Levels:
• Entry: 103.18
• Stop Loss: 102.036
• TP1: 104.324
• TP2: 105.469
• TP3: 106.613
Risk Warning: Crypto trading involves high market risk and price volatility. Always manage your leverage carefully and trade responsibly.
#SOXLBUSDT #CryptoSignals #Binance #CryptoTrading #TradingSignals
SOXLBUSDT | LONG
Signal Score: 85/100
Risk/Reward: 1:3
Market Trend:
• 4H: BULLISH
• 1H: BULLISH
• 15M: BULLISH
• 1M: NEUTRAL
• RSI: 61.21
Trade Levels:
• Entry: 103.18
• Stop Loss: 102.036
• TP1: 104.324
• TP2: 105.469
• TP3: 106.613
Risk Warning: Crypto trading involves high market risk and price volatility. Always manage your leverage carefully and trade responsibly.
#SOXLBUSDT #CryptoSignals #Binance #CryptoTrading #TradingSignals
Signal Score: 85/100
Risk/Reward: 1:3
Market Trend:
• 4H: BULLISH
• 1H: BULLISH
• 15M: BULLISH
• 1M: NEUTRAL
• RSI: 61.21
Trade Levels:
• Entry: 103.18
• Stop Loss: 102.036
• TP1: 104.324
• TP2: 105.469
• TP3: 106.613
Risk Warning: Crypto trading involves high market risk and price volatility. Always manage your leverage carefully and trade responsibly.
#SOXLBUSDT #CryptoSignals #Binance #CryptoTrading #TradingSignals
59

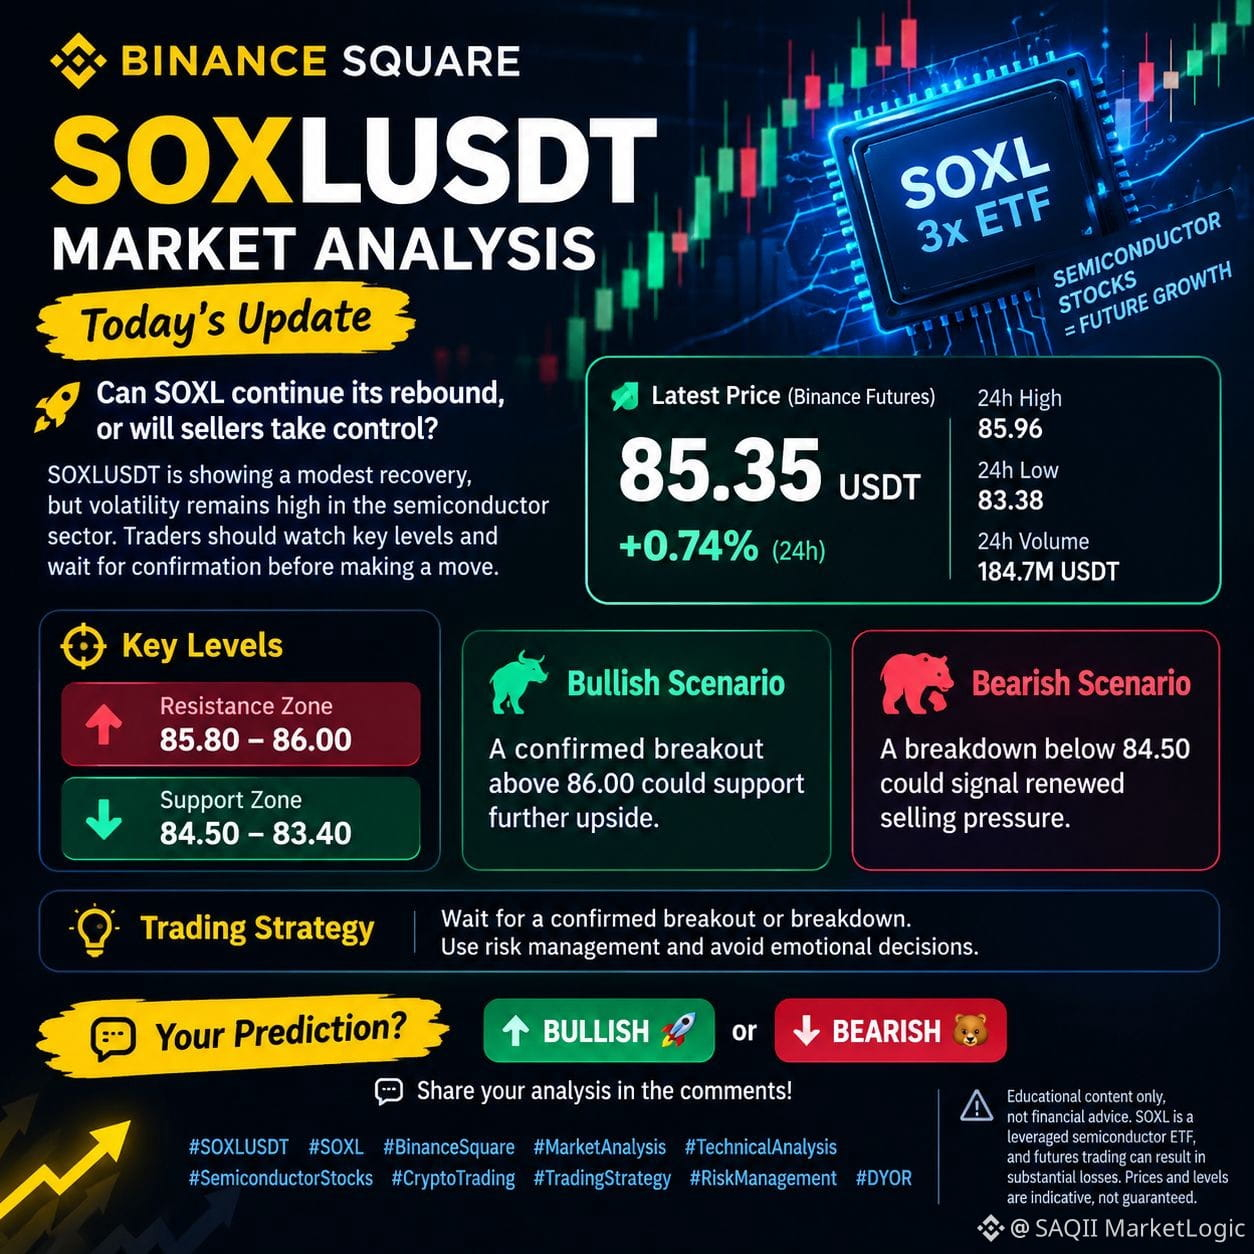
🔥 SOXLUSDT is trying to recover—but is this a real reversal or just a temporary bounce? 📊
{future}(SOXLUSDT)
Check the key levels, manage your risk, and tell us your prediction below! 👇
🚀 BULLISH or 🐻 BEARISH?
#SOXLBUSDT #MarketSentimentToday #BTC走势分析 #BinanceSquareTalks #marketanalysis.
🔥 SOXLUSDT is trying to recover—but is this a real reversal or just a temporary bounce? 📊
Check the key levels, manage your risk, and tell us your prediction below! 👇
🚀 BULLISH or 🐻 BEARISH?
#SOXLBUSDT #MarketSentimentToday #BTC走势分析 #BinanceSquareTalks #marketanalysis.
Check the key levels, manage your risk, and tell us your prediction below! 👇
🚀 BULLISH or 🐻 BEARISH?
#SOXLBUSDT #MarketSentimentToday #BTC走势分析 #BinanceSquareTalks #marketanalysis.
1
275


·
--
Verified
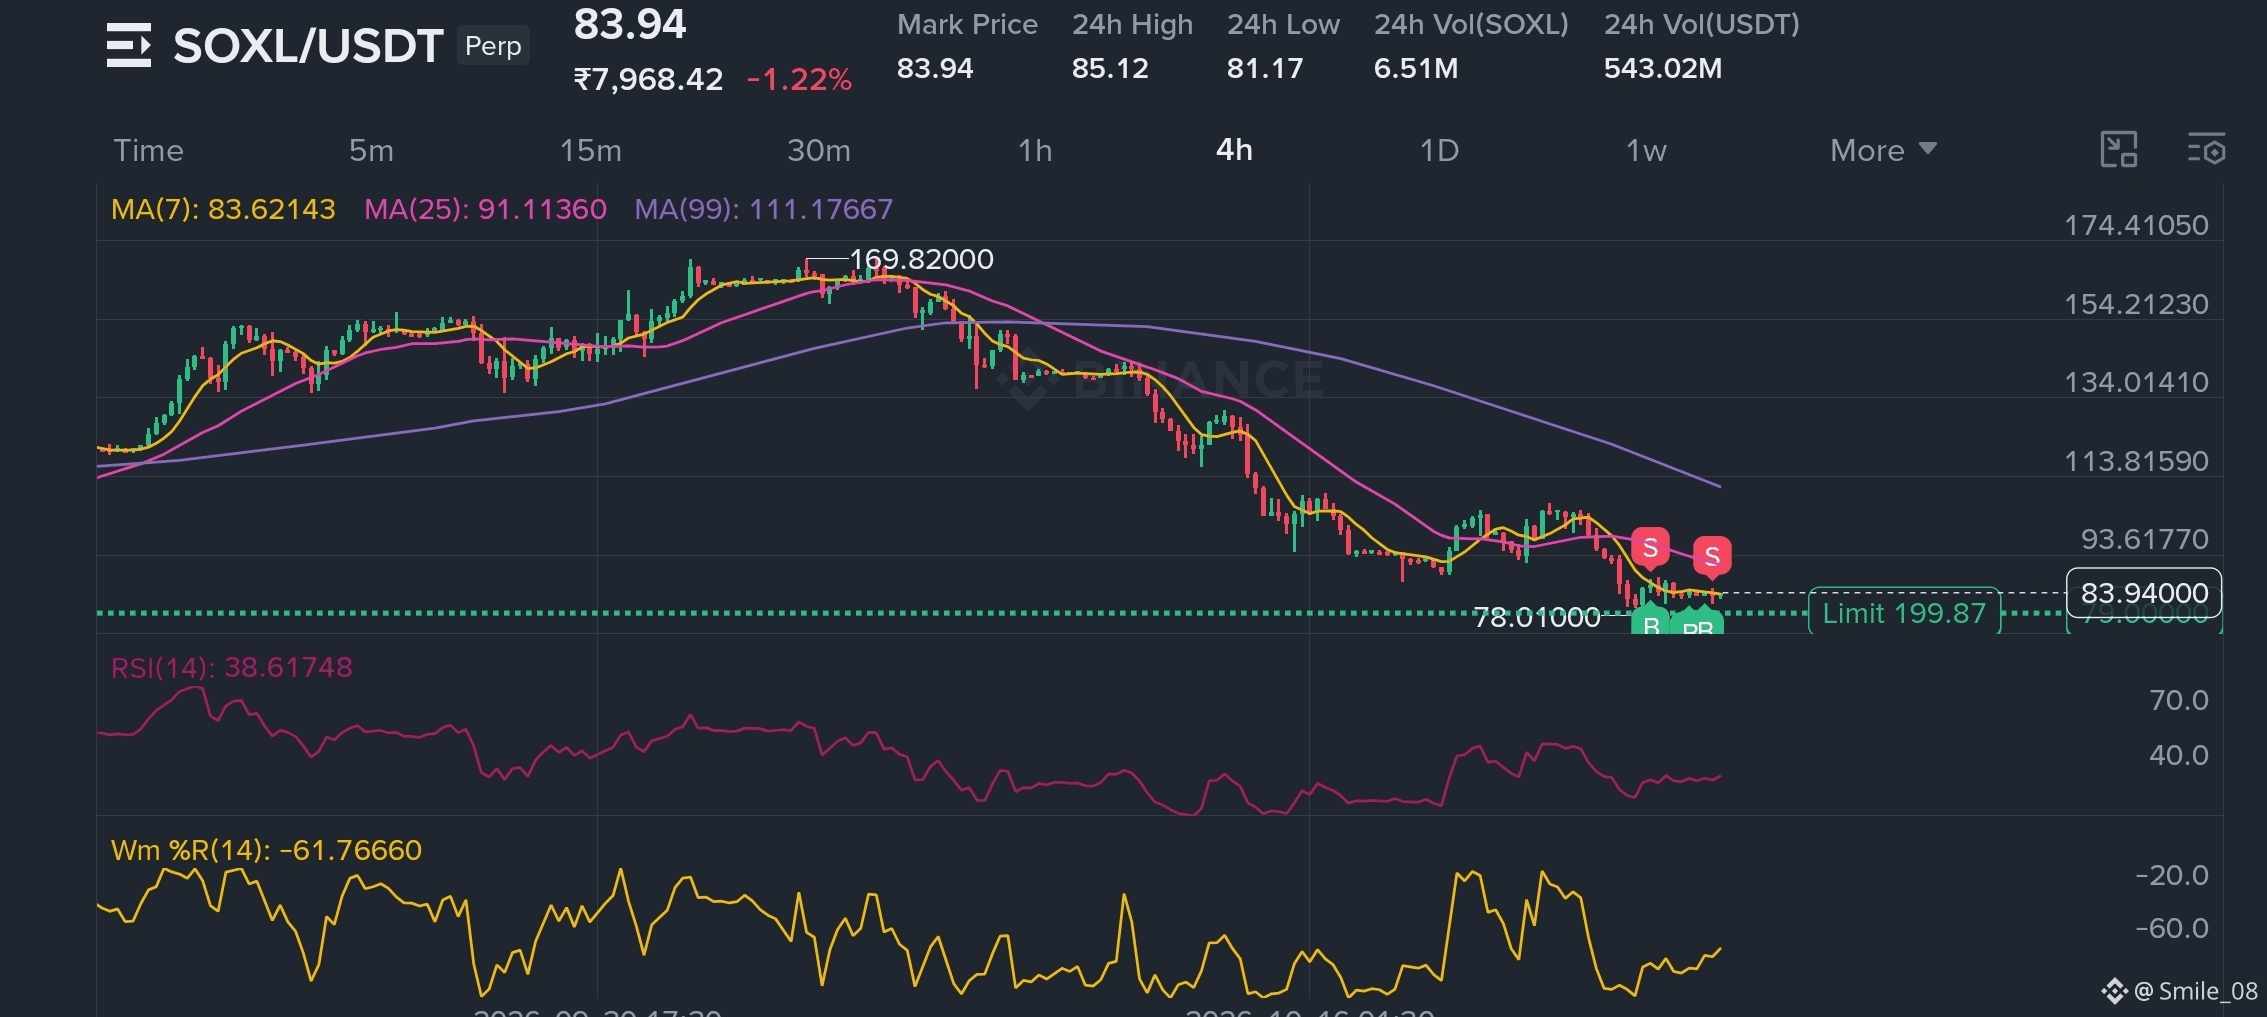
📊 $SOXL Trade Setup
(Current Price ~ $83.50)
🟢 Entry Zone: $80.00 – $84.00
🎯 TP1: $90.00
🎯 TP2: $95.00
🎯 TP3: $105.00+
🛑 SL: $76.00
3x leveraged Semiconductor Bull ETF — high volatility. Wait for support hold + momentum confirmation. Size carefully & manage risk tightly. Patience over FOMO.
#SOXLBUSDT #Semiconductors #TradingSetup
📊 $SOXL Trade Setup
(Current Price ~ $83.50)
🟢 Entry Zone: $80.00 – $84.00
🎯 TP1: $90.00
🎯 TP2: $95.00
🎯 TP3: $105.00+
🛑 SL: $76.00
3x leveraged Semiconductor Bull ETF — high volatility. Wait for support hold + momentum confirmation. Size carefully & manage risk tightly. Patience over FOMO.
#SOXLBUSDT #Semiconductors #TradingSetup
(Current Price ~ $83.50)
🟢 Entry Zone: $80.00 – $84.00
🎯 TP1: $90.00
🎯 TP2: $95.00
🎯 TP3: $105.00+
🛑 SL: $76.00
3x leveraged Semiconductor Bull ETF — high volatility. Wait for support hold + momentum confirmation. Size carefully & manage risk tightly. Patience over FOMO.
#SOXLBUSDT #Semiconductors #TradingSetup
4
1k

·
--
Bullish
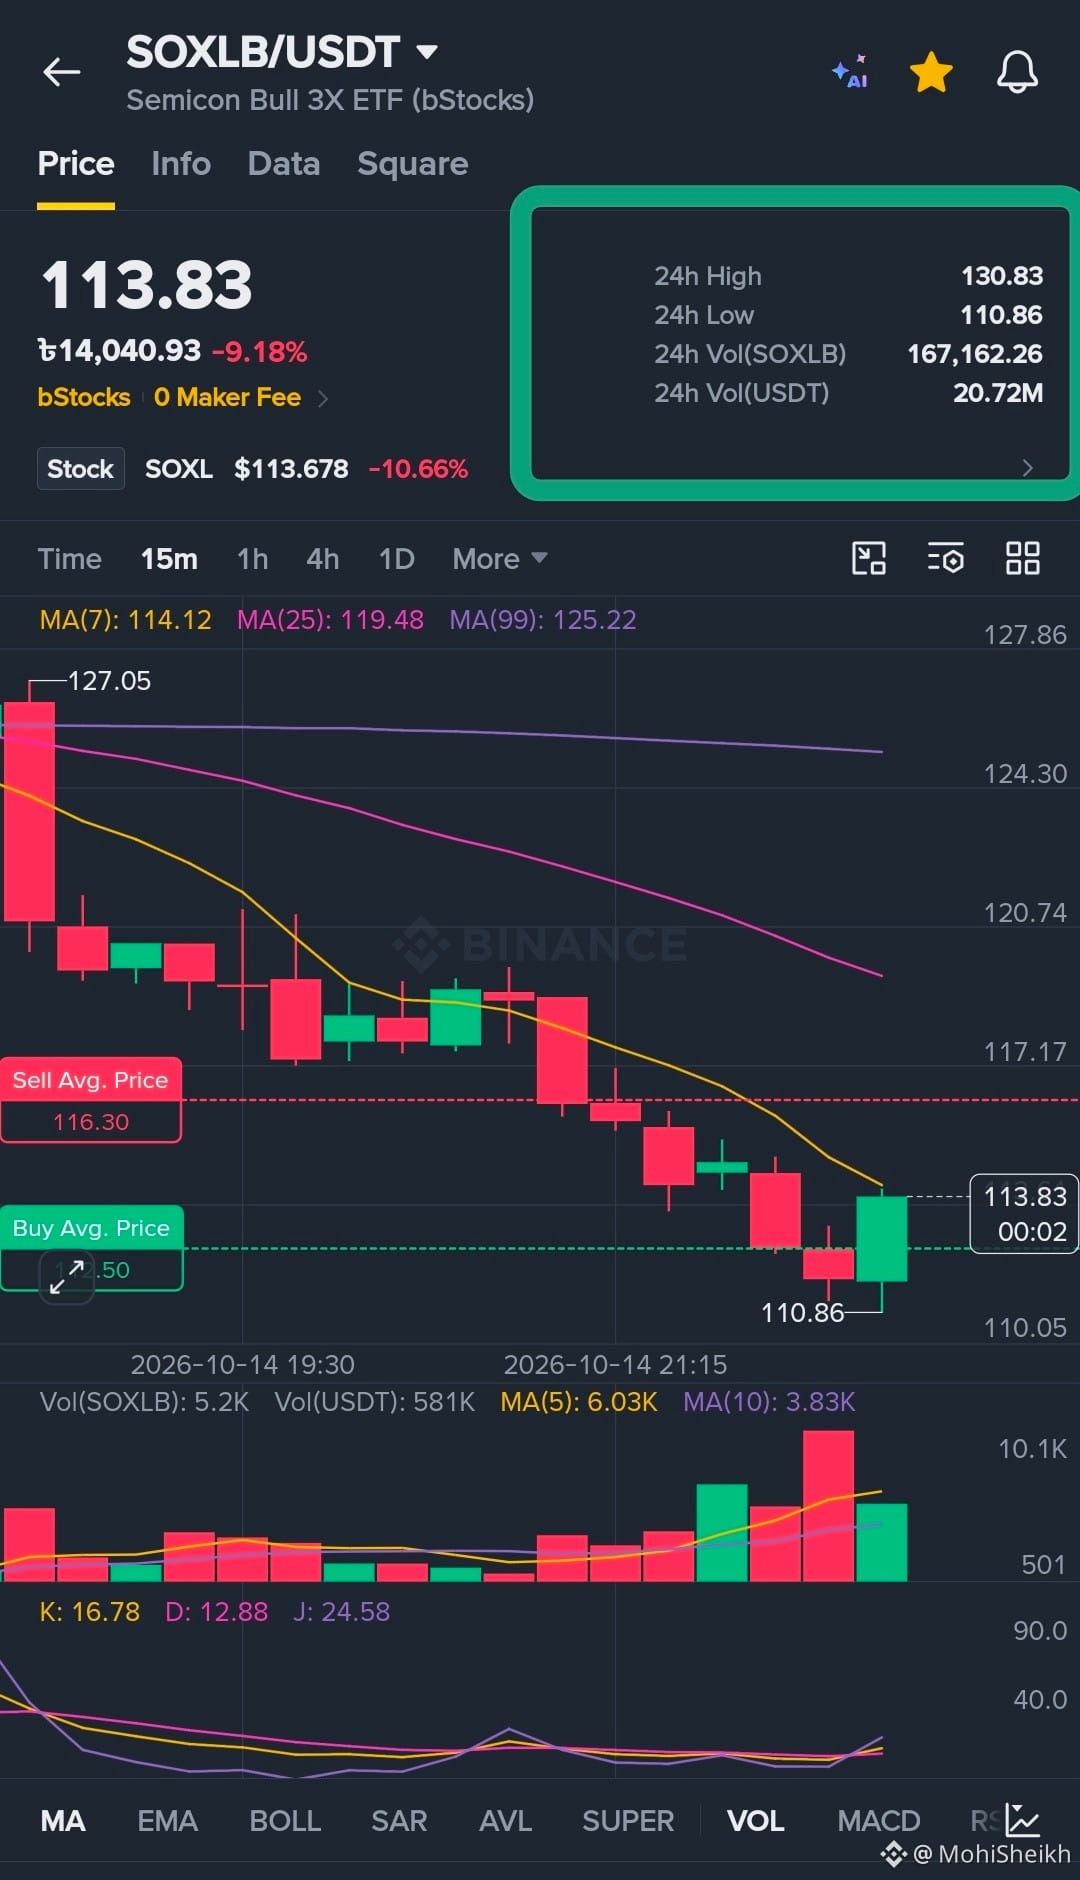
🚀 **SOXLBUSDT – Major Pullback or Next Bullish Breakout?** 🚀
🔥 **Current Price:** $113.84
📈 **24H High:** $130.83
📉 **24H Low:** $110.86
SOXLBUSDT has pulled back significantly from its recent high of $130.83 and is now trading near $113.84. The price is approaching an important support zone where buyers may attempt a recovery. 📊
If support holds and buying volume increases, a rebound could develop. However, a breakdown below support may lead to further downside.
---
📊 **Key Technical Levels – SOXLBUSDT**
🟢 **Strong Support:** $112.00 – $114.00
🟢 **Major Demand Zone:** $110.80 – $112.00
🔴 **Resistance:** $120.00 – $125.00
🚀 **Major Resistance:** $130.83
🔥 **Bullish Breakout:** Above $131.00 with strong volume
---
🎯 **Trade Setup – SOXLBUSDT**
💰 **Buy Zone:** $112.00 – $115.00
🚀 **Breakout Entry:** Above $120.00 after confirmation
🎯 **TP1:** $120.00
🎯 **TP2:** $125.00
🎯 **TP3:** $130.00 – $131.00
🌕 **Extended Target:** $138.00+ if bullish momentum continues
💵 **Potential Return on a $1,000 Investment**
*(Illustrative estimates based on a $113.84 entry, excluding fees.)*
- 🎯 **TP1 – $120.00:** Approximately **+5.41%** → $1,054
- 🎯 **TP2 – $125.00:** Approximately **+9.81%** → $1,098
- 🎯 **TP3 – $130.00:** Approximately **+14.20%** → $1,142
- 🌕 **Extended Target – $138.00:** Approximately **+21.23%** → $1,212
---
⚠️ **Risk Management**
🛑 **Stop-Loss Reference:** Below $110.50, depending on your entry and risk tolerance
✅ Consider taking partial profits near resistance levels.
📊 Watch trading volume before entering a breakout.
⚠️ If price breaks below $110.86, the bullish setup may weaken.
💡 These levels are technical scenarios, not guaranteed predictions. Always manage position size carefully.
---
📢 **Post by: @MohiSheikh**
👍 Like | 🔄 Share | 💬 Comment your target!
#SOXLBUSDT
#SOXLB #CryptoAnalysis #CryptoSignals #TechnicalAnalysis #SupportAndResistance #BreakoutWatch #RiskManagement
🚀 **SOXLBUSDT – Major Pullback or Next Bullish Breakout?** 🚀
🔥 **Current Price:** $113.84
📈 **24H High:** $130.83
📉 **24H Low:** $110.86
SOXLBUSDT has pulled back significantly from its recent high of $130.83 and is now trading near $113.84. The price is approaching an important support zone where buyers may attempt a recovery. 📊
If support holds and buying volume increases, a rebound could develop. However, a breakdown below support may lead to further downside.
---
📊 **Key Technical Levels – SOXLBUSDT**
🟢 **Strong Support:** $112.00 – $114.00
🟢 **Major Demand Zone:** $110.80 – $112.00
🔴 **Resistance:** $120.00 – $125.00
🚀 **Major Resistance:** $130.83
🔥 **Bullish Breakout:** Above $131.00 with strong volume
---
🎯 **Trade Setup – SOXLBUSDT**
💰 **Buy Zone:** $112.00 – $115.00
🚀 **Breakout Entry:** Above $120.00 after confirmation
🎯 **TP1:** $120.00
🎯 **TP2:** $125.00
🎯 **TP3:** $130.00 – $131.00
🌕 **Extended Target:** $138.00+ if bullish momentum continues
💵 **Potential Return on a $1,000 Investment**
*(Illustrative estimates based on a $113.84 entry, excluding fees.)*
- 🎯 **TP1 – $120.00:** Approximately **+5.41%** → $1,054
- 🎯 **TP2 – $125.00:** Approximately **+9.81%** → $1,098
- 🎯 **TP3 – $130.00:** Approximately **+14.20%** → $1,142
- 🌕 **Extended Target – $138.00:** Approximately **+21.23%** → $1,212
---
⚠️ **Risk Management**
🛑 **Stop-Loss Reference:** Below $110.50, depending on your entry and risk tolerance
✅ Consider taking partial profits near resistance levels.
📊 Watch trading volume before entering a breakout.
⚠️ If price breaks below $110.86, the bullish setup may weaken.
💡 These levels are technical scenarios, not guaranteed predictions. Always manage position size carefully.
---
📢 **Post by: @MohiSheikh**
👍 Like | 🔄 Share | 💬 Comment your target!
#SOXLBUSDT
#SOXLB #CryptoAnalysis #CryptoSignals #TechnicalAnalysis #SupportAndResistance #BreakoutWatch #RiskManagement
🔥 **Current Price:** $113.84
📈 **24H High:** $130.83
📉 **24H Low:** $110.86
SOXLBUSDT has pulled back significantly from its recent high of $130.83 and is now trading near $113.84. The price is approaching an important support zone where buyers may attempt a recovery. 📊
If support holds and buying volume increases, a rebound could develop. However, a breakdown below support may lead to further downside.
---
📊 **Key Technical Levels – SOXLBUSDT**
🟢 **Strong Support:** $112.00 – $114.00
🟢 **Major Demand Zone:** $110.80 – $112.00
🔴 **Resistance:** $120.00 – $125.00
🚀 **Major Resistance:** $130.83
🔥 **Bullish Breakout:** Above $131.00 with strong volume
---
🎯 **Trade Setup – SOXLBUSDT**
💰 **Buy Zone:** $112.00 – $115.00
🚀 **Breakout Entry:** Above $120.00 after confirmation
🎯 **TP1:** $120.00
🎯 **TP2:** $125.00
🎯 **TP3:** $130.00 – $131.00
🌕 **Extended Target:** $138.00+ if bullish momentum continues
💵 **Potential Return on a $1,000 Investment**
*(Illustrative estimates based on a $113.84 entry, excluding fees.)*
- 🎯 **TP1 – $120.00:** Approximately **+5.41%** → $1,054
- 🎯 **TP2 – $125.00:** Approximately **+9.81%** → $1,098
- 🎯 **TP3 – $130.00:** Approximately **+14.20%** → $1,142
- 🌕 **Extended Target – $138.00:** Approximately **+21.23%** → $1,212
---
⚠️ **Risk Management**
🛑 **Stop-Loss Reference:** Below $110.50, depending on your entry and risk tolerance
✅ Consider taking partial profits near resistance levels.
📊 Watch trading volume before entering a breakout.
⚠️ If price breaks below $110.86, the bullish setup may weaken.
💡 These levels are technical scenarios, not guaranteed predictions. Always manage position size carefully.
---
📢 **Post by: @MohiSheikh**
👍 Like | 🔄 Share | 💬 Comment your target!
#SOXLBUSDT
#SOXLB #CryptoAnalysis #CryptoSignals #TechnicalAnalysis #SupportAndResistance #BreakoutWatch #RiskManagement
160

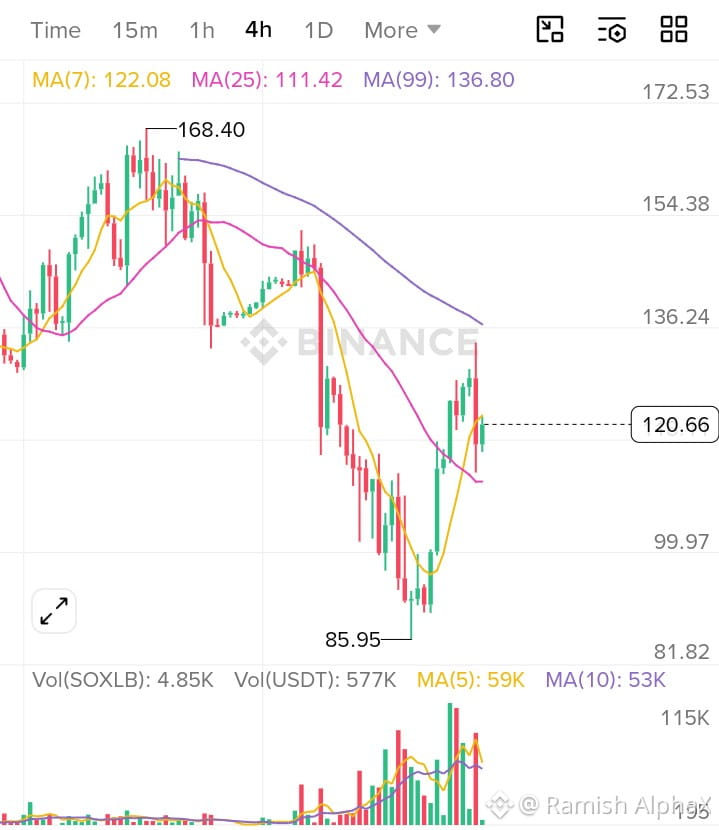
🔥 $SOXLB 4H: Dead-Cat Bounce or the Start of a Trend Reversal?
📊 Market Bias: Neutral → Bullish (Recovery Phase)
🎯 Trade Setup: LONG on Confirmation
Entry Zone: 119.50–122.50 (buy on successful retest/hold)
Stop Loss: 114.80
TP1: 128.00
TP2: 134.00
TP3: 142.00
Risk:Reward: 1:2.8+
Trade Invalidation: A 4H close below 115.00 invalidates the bullish recovery structure.
📈 Technical Analysis (4H)
Price Action: Strong rebound from 85.95, but price is now testing a key resistance zone after the recovery.
Market Structure: Short-term higher lows have formed, although the higher-timeframe trend remains below the previous swing high.
EMA/MA: MA(7) is above MA(25), showing improving short-term momentum, but price is still below the MA(99), meaning the macro trend has not fully flipped bullish.
Support: 115–118, then 110.
Resistance: 126–128, followed by 136.
SMC: Liquidity was swept below the 85.95 low, followed by a strong displacement candle—a sign buyers have stepped in.
Order Block / FVG: Demand remains around 115–118, while supply sits near 126–130.
Volume: Recovery was supported by expanding volume, but the latest pullback suggests profit-taking. Watch for volume expansion on the next breakout attempt.
#SOXLB #soxlbbullish #SOXLBUSDT #SOXLBUSDT #SOXLB测试关键支撑
{spot}(SOXLBUSDT)
🔥 $SOXLB 4H: Dead-Cat Bounce or the Start of a Trend Reversal?
📊 Market Bias: Neutral → Bullish (Recovery Phase)
🎯 Trade Setup: LONG on Confirmation
Entry Zone: 119.50–122.50 (buy on successful retest/hold)
Stop Loss: 114.80
TP1: 128.00
TP2: 134.00
TP3: 142.00
Risk:Reward: 1:2.8+
Trade Invalidation: A 4H close below 115.00 invalidates the bullish recovery structure.
📈 Technical Analysis (4H)
Price Action: Strong rebound from 85.95, but price is now testing a key resistance zone after the recovery.
Market Structure: Short-term higher lows have formed, although the higher-timeframe trend remains below the previous swing high.
EMA/MA: MA(7) is above MA(25), showing improving short-term momentum, but price is still below the MA(99), meaning the macro trend has not fully flipped bullish.
Support: 115–118, then 110.
Resistance: 126–128, followed by 136.
SMC: Liquidity was swept below the 85.95 low, followed by a strong displacement candle—a sign buyers have stepped in.
Order Block / FVG: Demand remains around 115–118, while supply sits near 126–130.
Volume: Recovery was supported by expanding volume, but the latest pullback suggests profit-taking. Watch for volume expansion on the next breakout attempt.
#SOXLB #soxlbbullish #SOXLBUSDT #SOXLBUSDT #SOXLB测试关键支撑
📊 Market Bias: Neutral → Bullish (Recovery Phase)
🎯 Trade Setup: LONG on Confirmation
Entry Zone: 119.50–122.50 (buy on successful retest/hold)
Stop Loss: 114.80
TP1: 128.00
TP2: 134.00
TP3: 142.00
Risk:Reward: 1:2.8+
Trade Invalidation: A 4H close below 115.00 invalidates the bullish recovery structure.
📈 Technical Analysis (4H)
Price Action: Strong rebound from 85.95, but price is now testing a key resistance zone after the recovery.
Market Structure: Short-term higher lows have formed, although the higher-timeframe trend remains below the previous swing high.
EMA/MA: MA(7) is above MA(25), showing improving short-term momentum, but price is still below the MA(99), meaning the macro trend has not fully flipped bullish.
Support: 115–118, then 110.
Resistance: 126–128, followed by 136.
SMC: Liquidity was swept below the 85.95 low, followed by a strong displacement candle—a sign buyers have stepped in.
Order Block / FVG: Demand remains around 115–118, while supply sits near 126–130.
Volume: Recovery was supported by expanding volume, but the latest pullback suggests profit-taking. Watch for volume expansion on the next breakout attempt.
#SOXLB #soxlbbullish #SOXLBUSDT #SOXLBUSDT #SOXLB测试关键支撑
41

·
--
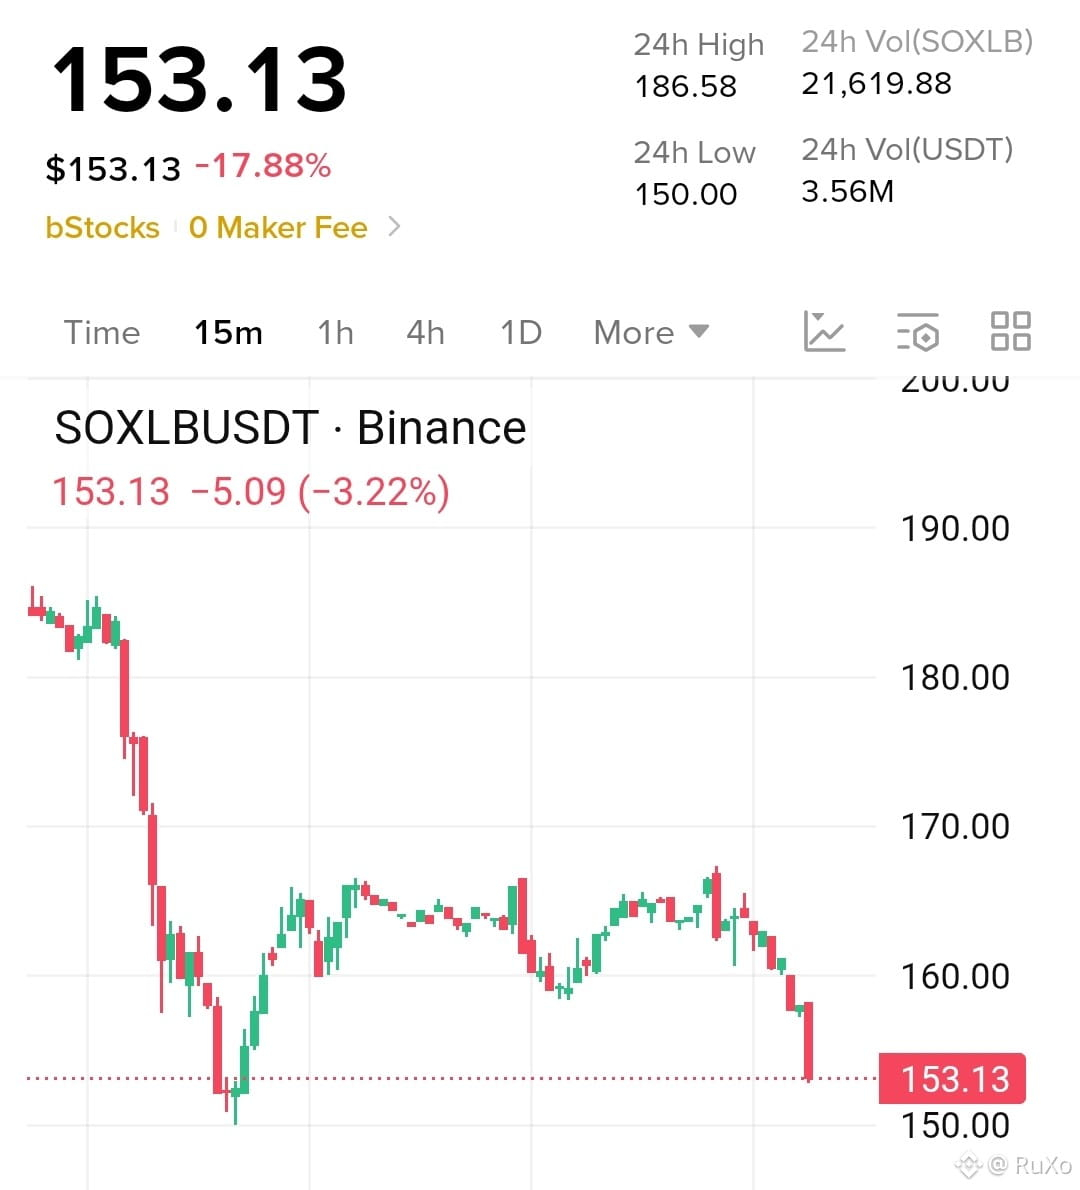
🚨 $SOXLB Under Intense Pressure! Price Plummets -17.88% as Floor Support Faces a Vital Retest! 🚀📉👇
Direxion Semiconductor Bear ($SOXLB) is navigating a steep structural correction sequence on its spot trading chart, currently trading down heavily at $153.13! Following a sharp rejection from its multi-session peak at the 24h High ($186.58), aggressive distribution has driven price action back down to hover directly above its immediate baseline structural floor cushion at the 24h Low ($150.00). Backed by an active $3.56M USDT daily trading volume pool rotating through the bStocks matrix, the bears retain immediate tactical control. Manage your trade setups instantly:
🟢 LONG ENTRY (Breakout Reversal):
✅ Trigger: Close ABOVE $162.50 🎯 Targets: $174.00 | $185.00+ 🚀 🛑 SL: $148.00
🔴 SHORT ENTRY (Downtrend Continuation):
✅ Trigger: Close BELOW $149.50 🎯 Targets: $138.00 | $125.00- 📉 🛑 SL: $159.20
💡 TRADER'S WISDOM: Take careful note of the timeframe setup—this technical analysis maps directly to the active 15-minute (15m) timeline structure! While the macro 24h performance indicates a severe contraction in the red (-17.88%), the immediate active 15M candlestick confirms intense short-term selling acceleration, printing a negative progression tick of -3.22% (-5.09). Avoid front-running market orders straight into the immediate floor boundary—let the 15M timeframe secure a clean candle close completely outside these parameters to validate sustainable limit order absorption before taking confirmations. Capital preservation is priority number one! 📊🔒
⚠️ High-velocity bStocks sector tokens face sudden deep liquidity vacuums, sudden volatility flushes, and rapid localized leverage adjustments near key floor zones. Tighten your risk limits and do your own research (DYOR)! ⚠️
{spot}(SOXLBUSDT)
➡️ CLICK THE TAGGED $SOXLB COIN LINK BELOW ⬅️
#BinanceSquare #SOXLBUSDT #DirexionSemiconductor #TechnicalAnalysis
🚨 $SOXLB Under Intense Pressure! Price Plummets -17.88% as Floor Support Faces a Vital Retest! 🚀📉👇
Direxion Semiconductor Bear ($SOXLB ) is navigating a steep structural correction sequence on its spot trading chart, currently trading down heavily at $153.13! Following a sharp rejection from its multi-session peak at the 24h High ($186.58), aggressive distribution has driven price action back down to hover directly above its immediate baseline structural floor cushion at the 24h Low ($150.00). Backed by an active $3.56M USDT daily trading volume pool rotating through the bStocks matrix, the bears retain immediate tactical control. Manage your trade setups instantly:
🟢 LONG ENTRY (Breakout Reversal):
✅ Trigger: Close ABOVE $162.50 🎯 Targets: $174.00 | $185.00+ 🚀 🛑 SL: $148.00
🔴 SHORT ENTRY (Downtrend Continuation):
✅ Trigger: Close BELOW $149.50 🎯 Targets: $138.00 | $125.00- 📉 🛑 SL: $159.20
💡 TRADER'S WISDOM: Take careful note of the timeframe setup—this technical analysis maps directly to the active 15-minute (15m) timeline structure! While the macro 24h performance indicates a severe contraction in the red (-17.88%), the immediate active 15M candlestick confirms intense short-term selling acceleration, printing a negative progression tick of -3.22% (-5.09). Avoid front-running market orders straight into the immediate floor boundary—let the 15M timeframe secure a clean candle close completely outside these parameters to validate sustainable limit order absorption before taking confirmations. Capital preservation is priority number one! 📊🔒
⚠️ High-velocity bStocks sector tokens face sudden deep liquidity vacuums, sudden volatility flushes, and rapid localized leverage adjustments near key floor zones. Tighten your risk limits and do your own research (DYOR)! ⚠️
➡️ CLICK THE TAGGED $SOXLB COIN LINK BELOW ⬅️
#BinanceSquare #SOXLBUSDT #DirexionSemiconductor #TechnicalAnalysis
Direxion Semiconductor Bear ($SOXLB ) is navigating a steep structural correction sequence on its spot trading chart, currently trading down heavily at $153.13! Following a sharp rejection from its multi-session peak at the 24h High ($186.58), aggressive distribution has driven price action back down to hover directly above its immediate baseline structural floor cushion at the 24h Low ($150.00). Backed by an active $3.56M USDT daily trading volume pool rotating through the bStocks matrix, the bears retain immediate tactical control. Manage your trade setups instantly:
🟢 LONG ENTRY (Breakout Reversal):
✅ Trigger: Close ABOVE $162.50 🎯 Targets: $174.00 | $185.00+ 🚀 🛑 SL: $148.00
🔴 SHORT ENTRY (Downtrend Continuation):
✅ Trigger: Close BELOW $149.50 🎯 Targets: $138.00 | $125.00- 📉 🛑 SL: $159.20
💡 TRADER'S WISDOM: Take careful note of the timeframe setup—this technical analysis maps directly to the active 15-minute (15m) timeline structure! While the macro 24h performance indicates a severe contraction in the red (-17.88%), the immediate active 15M candlestick confirms intense short-term selling acceleration, printing a negative progression tick of -3.22% (-5.09). Avoid front-running market orders straight into the immediate floor boundary—let the 15M timeframe secure a clean candle close completely outside these parameters to validate sustainable limit order absorption before taking confirmations. Capital preservation is priority number one! 📊🔒
⚠️ High-velocity bStocks sector tokens face sudden deep liquidity vacuums, sudden volatility flushes, and rapid localized leverage adjustments near key floor zones. Tighten your risk limits and do your own research (DYOR)! ⚠️
➡️ CLICK THE TAGGED $SOXLB COIN LINK BELOW ⬅️
#BinanceSquare #SOXLBUSDT #DirexionSemiconductor #TechnicalAnalysis
470
1
11
470

·
--
🔴 $SOXLB | Short Setup
SOXLBUSDT is currently displaying strong bearish momentum with a significant daily decline. The price action indicates a potential continuation of the downtrend, making this setup interesting for a short position at current levels.
**Trade Plan**
* **Entry:** 111.02
* **Stop Loss:** 112.13
* **TP1:** 110.02
* **TP2:** 108.92
* **TP3:** 107.37
**Why I'm interested**
* Substantial 24-hour price decrease signals persistent selling pressure.
* Current price position aligns with a potential move lower.
* Defined risk management with clear stop and take profit levels.
* Opportunity to capitalize on prevailing market sentiment.
I focus on letting price action dictate my strategy, not just hopes or fears.
👇 Trust your setup, not just your gut.
#SOXLBUSDT #soxlbusdt
🔴 $SOXLB | Short Setup
SOXLBUSDT is currently displaying strong bearish momentum with a significant daily decline. The price action indicates a potential continuation of the downtrend, making this setup interesting for a short position at current levels.
**Trade Plan**
* **Entry:** 111.02
* **Stop Loss:** 112.13
* **TP1:** 110.02
* **TP2:** 108.92
* **TP3:** 107.37
**Why I'm interested**
* Substantial 24-hour price decrease signals persistent selling pressure.
* Current price position aligns with a potential move lower.
* Defined risk management with clear stop and take profit levels.
* Opportunity to capitalize on prevailing market sentiment.
I focus on letting price action dictate my strategy, not just hopes or fears.
👇 Trust your setup, not just your gut.
#SOXLBUSDT #soxlbusdt
SOXLBUSDT is currently displaying strong bearish momentum with a significant daily decline. The price action indicates a potential continuation of the downtrend, making this setup interesting for a short position at current levels.
**Trade Plan**
* **Entry:** 111.02
* **Stop Loss:** 112.13
* **TP1:** 110.02
* **TP2:** 108.92
* **TP3:** 107.37
**Why I'm interested**
* Substantial 24-hour price decrease signals persistent selling pressure.
* Current price position aligns with a potential move lower.
* Defined risk management with clear stop and take profit levels.
* Opportunity to capitalize on prevailing market sentiment.
I focus on letting price action dictate my strategy, not just hopes or fears.
👇 Trust your setup, not just your gut.
#SOXLBUSDT #soxlbusdt
17
Log in to explore more content
Join global crypto users on Binance Square
⚡️ Get latest and useful information about crypto.
💬 Trusted by the world’s largest crypto exchange.
👍 Discover real insights from verified creators.
Email / Phone number
Trending Topics
1
#CryptoSelloffTriggersMultipleWhaleLiquidations
16,274 views
300 Discussing
2
#USSpotXRPETFsSeeLargestWeeklyOutflowIn8Months
54,307 views
664 Discussing
3
#WillFOMCMinutesReinforceRateHikeExpectations?
3,659 views
102 Discussing
4
#BitcoinActiveSupplyInProfitDropsBelow45%
117,693 views
1,041 Discussing
5
#TONStrategyReports$23.97MQ3NetLoss
13,523 views
79 Discussing
6
#KavaSaysAbnormalActivityLimitedToKavaLend
76,345 views
580 Discussing
7
#WORPTLetsTouristsConvertCryptoToThaiBaht
16,903 views
183 Discussing
8
#WhoWillSucceedJensenHuangatNvidia?
237,346 views
1,898 Discussing
9
#WhatWillDriveCryptoandStocks’NextRebound?
687,856 views
3,704 Discussing
10
#TradFiForBeginners
772,553 views
4,688 Discussing