

#mvrv
mvrv
41,121 views
203 Discussing
Hot
Latest

·
--
A CryptoQuant analyst dates the start of a new bullish cycle to August 20, when the MVRV ratio crossed its 365-day moving average at $71,255. Since then, BTC has gained 13% in 31 days and is trading today at $84,020—about 18% above the signal price. My take is simple: a signal everyone sees after a 18% rally is no longer an edge—it's an invitation to FOMO. The real question isn’t whether the cycle is underway, but whether you buy the confirmation or the pullback. And you, do you follow the indicator or wait for a dip? #BTC #MVRV
A CryptoQuant analyst dates the start of a new bullish cycle to August 20, when the MVRV ratio crossed its 365-day moving average at $71,255. Since then, BTC has gained 13% in 31 days and is trading today at $84,020—about 18% above the signal price. My take is simple: a signal everyone sees after a 18% rally is no longer an edge—it's an invitation to FOMO. The real question isn’t whether the cycle is underway, but whether you buy the confirmation or the pullback. And you, do you follow the indicator or wait for a dip? #BTC #MVRV
25

·
--
🚨 XRP and DOGE are still in the “loss zone”! Why is that actually worth watching?🔥
Group: [点击进入玖玖的粉丝群](https://app.binance.com/uni-qr/YXXQJrPb)
Recently, both XRP and DOGE have shown a clear rebound, but on-chain data sends an interesting signal: long-term holders don’t seem to have truly “gotten out of the red” yet.
According to Santiment Intelligence data, XRP’s 365-day MVRV is around -11.75%, while DOGE is even lower at -19.26%. In contrast, BTC, ETH, and LINK’s 365-day MVRV has already returned slightly to positive territory.
📉 What is MVRV?
In simple terms, it compares the current market price to the cost basis of holdings. When MVRV stays in negative territory for a long time, it means that people who bought and held over the past year are still, overall, sitting on unrealized losses.
This creates a very interesting market phenomenon: even though the price has rebounded, many longtime holders still haven’t made money.
For XRP and DOGE, this could mean both that sell pressure may be relatively limited, and that the market hasn’t entered a phase of widespread profit-taking. In other words, what’s more worth observing now is: when do “loss-making coins” start turning into “profitable coins”?
🔥 Let’s look at XRP again.
Recently, XRP has rebounded strongly from the 0.70–0.80 USD range, then broke through 0.90, 1.00, and 1.20 USD in sequence, topping out around 1.52 USD.
But after pushing into the 1.50–1.52 USD area, momentum clearly began to cool down, and the RSI also fell from above 70 back to 51.13, re-entering a neutral zone.
📌 So the next few levels are crucial:
1.52 USD: the key resistance for the short term—after a true breakout, you can then watch the area around 1.60 USD.
1.45 USD: the first support—if it holds here, the rebound structure hasn’t been broken.
1.40 USD: further support—if it breaks, you’ll want to pay attention to the 1.30–1.35 USD range.
👀 What’s even more notable is that XRP and DOGE currently show the same pattern: prices are rebounding, but long-term MVRV is still negative.
This doesn’t necessarily mean the price must rise, and it can’t simply be interpreted as a “buy the dip” signal. But if the price continues to strengthen, and MVRV gradually moves back above the zero line, the market structure could change noticeably.
Click the avatar to join the Jiujiu chat group for daily strategy 🚀
#xrp #DOGE #MVRV
🚨 XRP and DOGE are still in the “loss zone”! Why is that actually worth watching?🔥
Group: 点击进入玖玖的粉丝群
Recently, both XRP and DOGE have shown a clear rebound, but on-chain data sends an interesting signal: long-term holders don’t seem to have truly “gotten out of the red” yet.
According to Santiment Intelligence data, XRP’s 365-day MVRV is around -11.75%, while DOGE is even lower at -19.26%. In contrast, BTC, ETH, and LINK’s 365-day MVRV has already returned slightly to positive territory.
📉 What is MVRV?
In simple terms, it compares the current market price to the cost basis of holdings. When MVRV stays in negative territory for a long time, it means that people who bought and held over the past year are still, overall, sitting on unrealized losses.
This creates a very interesting market phenomenon: even though the price has rebounded, many longtime holders still haven’t made money.
For XRP and DOGE, this could mean both that sell pressure may be relatively limited, and that the market hasn’t entered a phase of widespread profit-taking. In other words, what’s more worth observing now is: when do “loss-making coins” start turning into “profitable coins”?
🔥 Let’s look at XRP again.
Recently, XRP has rebounded strongly from the 0.70–0.80 USD range, then broke through 0.90, 1.00, and 1.20 USD in sequence, topping out around 1.52 USD.
But after pushing into the 1.50–1.52 USD area, momentum clearly began to cool down, and the RSI also fell from above 70 back to 51.13, re-entering a neutral zone.
📌 So the next few levels are crucial:
1.52 USD: the key resistance for the short term—after a true breakout, you can then watch the area around 1.60 USD.
1.45 USD: the first support—if it holds here, the rebound structure hasn’t been broken.
1.40 USD: further support—if it breaks, you’ll want to pay attention to the 1.30–1.35 USD range.
👀 What’s even more notable is that XRP and DOGE currently show the same pattern: prices are rebounding, but long-term MVRV is still negative.
This doesn’t necessarily mean the price must rise, and it can’t simply be interpreted as a “buy the dip” signal. But if the price continues to strengthen, and MVRV gradually moves back above the zero line, the market structure could change noticeably.
Click the avatar to join the Jiujiu chat group for daily strategy 🚀
#xrp #DOGE #MVRV
Group: 点击进入玖玖的粉丝群
Recently, both XRP and DOGE have shown a clear rebound, but on-chain data sends an interesting signal: long-term holders don’t seem to have truly “gotten out of the red” yet.
According to Santiment Intelligence data, XRP’s 365-day MVRV is around -11.75%, while DOGE is even lower at -19.26%. In contrast, BTC, ETH, and LINK’s 365-day MVRV has already returned slightly to positive territory.
📉 What is MVRV?
In simple terms, it compares the current market price to the cost basis of holdings. When MVRV stays in negative territory for a long time, it means that people who bought and held over the past year are still, overall, sitting on unrealized losses.
This creates a very interesting market phenomenon: even though the price has rebounded, many longtime holders still haven’t made money.
For XRP and DOGE, this could mean both that sell pressure may be relatively limited, and that the market hasn’t entered a phase of widespread profit-taking. In other words, what’s more worth observing now is: when do “loss-making coins” start turning into “profitable coins”?
🔥 Let’s look at XRP again.
Recently, XRP has rebounded strongly from the 0.70–0.80 USD range, then broke through 0.90, 1.00, and 1.20 USD in sequence, topping out around 1.52 USD.
But after pushing into the 1.50–1.52 USD area, momentum clearly began to cool down, and the RSI also fell from above 70 back to 51.13, re-entering a neutral zone.
📌 So the next few levels are crucial:
1.52 USD: the key resistance for the short term—after a true breakout, you can then watch the area around 1.60 USD.
1.45 USD: the first support—if it holds here, the rebound structure hasn’t been broken.
1.40 USD: further support—if it breaks, you’ll want to pay attention to the 1.30–1.35 USD range.
👀 What’s even more notable is that XRP and DOGE currently show the same pattern: prices are rebounding, but long-term MVRV is still negative.
This doesn’t necessarily mean the price must rise, and it can’t simply be interpreted as a “buy the dip” signal. But if the price continues to strengthen, and MVRV gradually moves back above the zero line, the market structure could change noticeably.
Click the avatar to join the Jiujiu chat group for daily strategy 🚀
#xrp #DOGE #MVRV

379

·
--
The On-Chain MVRV Gap Is Telling a Story Price Charts Aren't
Most traders evaluate cycle positioning using moving averages and RSI. The deeper signal lives in MVRV — Market Value to Realized Value — and right now it's painting a picture that deserves more attention.
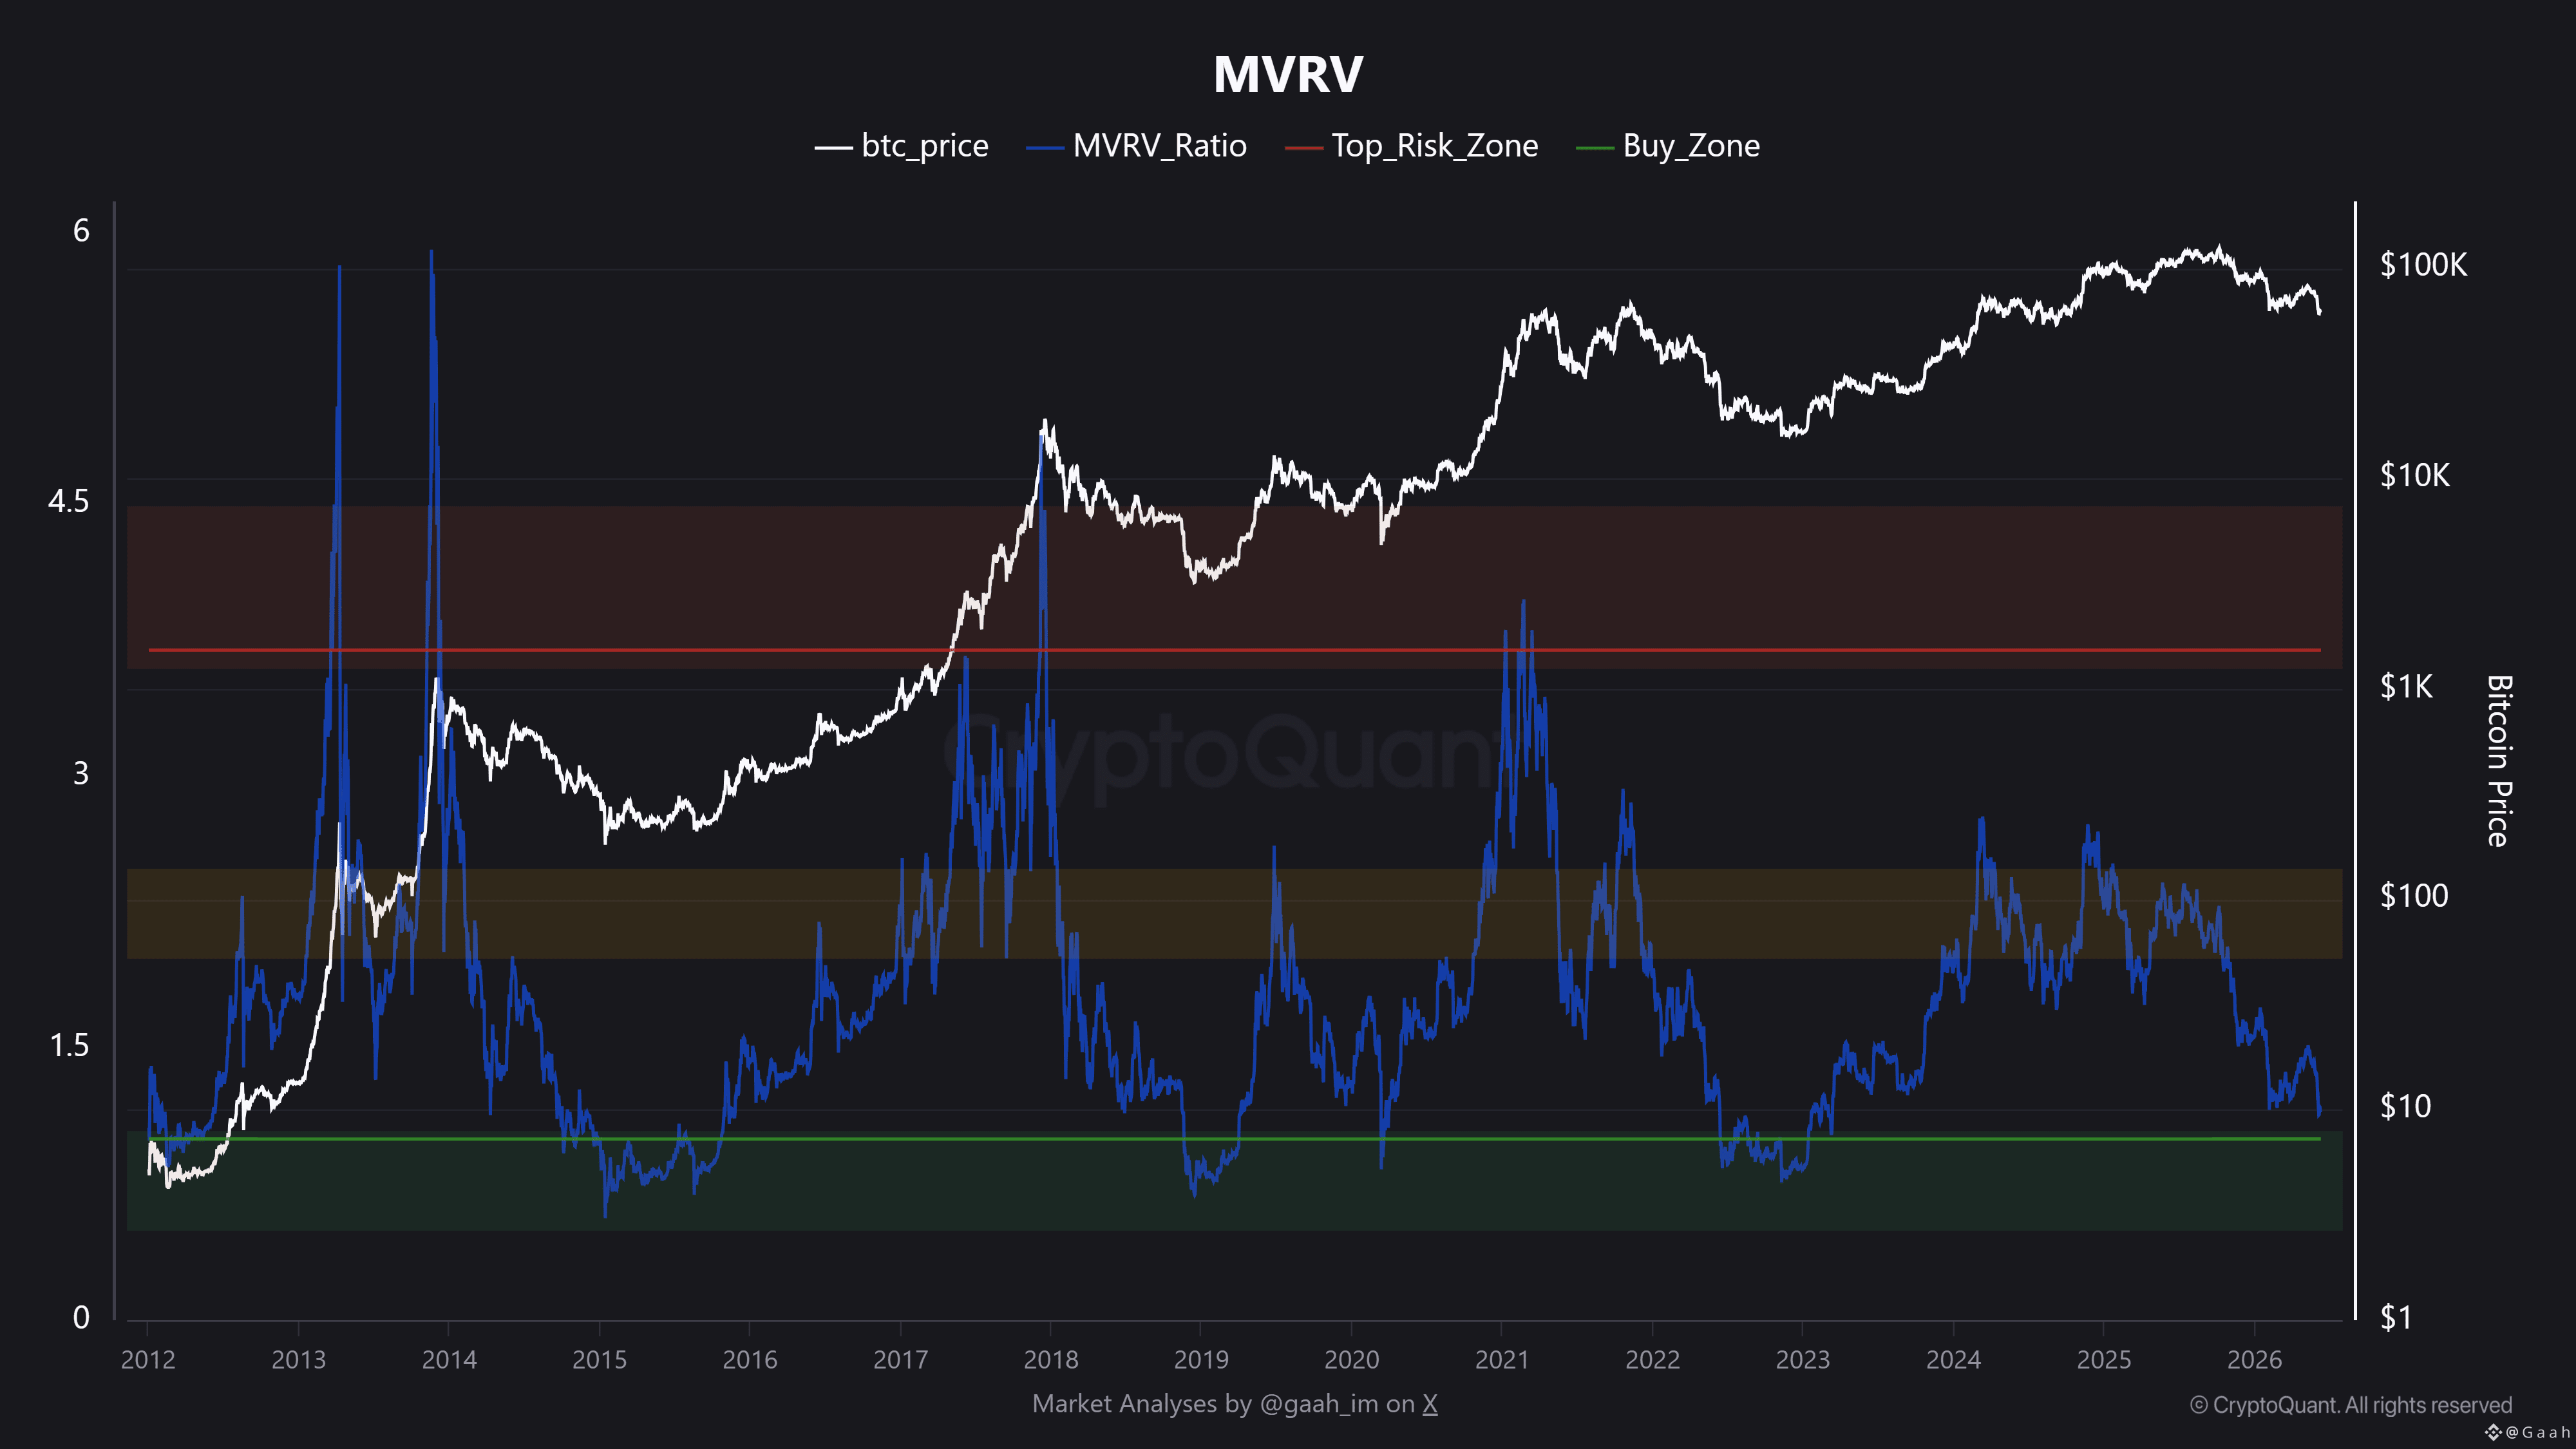
MVRV measures the gap between what the market thinks an asset is worth and what holders actually paid for it. When MVRV pushes above 3.5, historically we're in euphoria territory. Below 1.0, holders are underwater on average — often a generational accumulation zone.
Here's the nuance most people miss: MVRV works differently across assets. $BTC MVRV is a macro cycle indicator. $ETH MVRV reflects staking lock dynamics — when staked supply rises, realized value becomes stickier, compressing the ratio's range. And for $SOL, rapid lockup-vesting cycles distort realized value faster than other L1s.
The signal that matters right now isn't the absolute MVRV reading — it's the divergence between MVRV and price. When price makes new highs but MVRV doesn't follow with the same intensity, it means new buyers are entering at higher cost bases. That's healthy accumulation, not speculative froth.
On-chain data never lies. It just doesn't volunteer information — you have to know where to look.
#MVRV #OnChainAnalysis #CryptoMarkets #CyclePositioning
The On-Chain MVRV Gap Is Telling a Story Price Charts Aren't
Most traders evaluate cycle positioning using moving averages and RSI. The deeper signal lives in MVRV — Market Value to Realized Value — and right now it's painting a picture that deserves more attention.
MVRV measures the gap between what the market thinks an asset is worth and what holders actually paid for it. When MVRV pushes above 3.5, historically we're in euphoria territory. Below 1.0, holders are underwater on average — often a generational accumulation zone.
Here's the nuance most people miss: MVRV works differently across assets. $BTC MVRV is a macro cycle indicator. $ETH MVRV reflects staking lock dynamics — when staked supply rises, realized value becomes stickier, compressing the ratio's range. And for $SOL , rapid lockup-vesting cycles distort realized value faster than other L1s.
The signal that matters right now isn't the absolute MVRV reading — it's the divergence between MVRV and price. When price makes new highs but MVRV doesn't follow with the same intensity, it means new buyers are entering at higher cost bases. That's healthy accumulation, not speculative froth.
On-chain data never lies. It just doesn't volunteer information — you have to know where to look.
#MVRV #OnChainAnalysis #CryptoMarkets #CyclePositioning
Most traders evaluate cycle positioning using moving averages and RSI. The deeper signal lives in MVRV — Market Value to Realized Value — and right now it's painting a picture that deserves more attention.
MVRV measures the gap between what the market thinks an asset is worth and what holders actually paid for it. When MVRV pushes above 3.5, historically we're in euphoria territory. Below 1.0, holders are underwater on average — often a generational accumulation zone.
Here's the nuance most people miss: MVRV works differently across assets. $BTC MVRV is a macro cycle indicator. $ETH MVRV reflects staking lock dynamics — when staked supply rises, realized value becomes stickier, compressing the ratio's range. And for $SOL , rapid lockup-vesting cycles distort realized value faster than other L1s.
The signal that matters right now isn't the absolute MVRV reading — it's the divergence between MVRV and price. When price makes new highs but MVRV doesn't follow with the same intensity, it means new buyers are entering at higher cost bases. That's healthy accumulation, not speculative froth.
On-chain data never lies. It just doesn't volunteer information — you have to know where to look.
#MVRV #OnChainAnalysis #CryptoMarkets #CyclePositioning
79


·
--
MVRV Z-Score: A Walkthrough of the Most Misused On-Chain Indicator$BTC | MVRV Z-Score: A Walkthrough of the Most Misused On-Chain Indicator
The first time I watched the MVRV Z-Score on an institutional trading desk it was wrong, and the second time it was correct but in a way that wasn't useful. That tension - useful in retrospect, frustrating in real time - is the right starting point for understanding what this indicator actually does.
The standard formulation, often called the Awe & Wonder Z-Score after the analysts who popularised it on Glassnode, is straightforward:
Z = (Market Cap - Realised Cap) / standard deviation of Market Cap
Market Cap is trivially observable. Total BTC supply times current spot price. Realised Cap is the more interesting input. It values each UTXO at the price it last moved on-chain. So a coin sitting in a wallet since 2013 contributes its 2013 cost basis to Realised Cap, not today's spot value. The Z-Score normalises the gap between speculative valuation (Market Cap) and aggregate cost basis (Realised Cap) using an expanding-window standard deviation, so historical comparisons don't get skewed by recent volatility.
The thesis is straightforward. When the Z-Score is high - say above 7 historically - the market is so far above aggregate cost basis that holders are sitting on massive unrealised profit and are statistically likely to take some off the table. When it's negative, holders are underwater in aggregate and unlikely to capitulate further.
That thesis has worked at bottoms with reasonable consistency. It has worked less well at tops.
How it has performed across three completed cycles.
The 2013 December cycle top printed an MVRV Z-Score of approximately 9.3, well above the 7-zone that practitioners pointed at as the cycle-top trigger.
The 2017 December cycle top printed an MVRV Z-Score of approximately 11.5, again clearly inside the cycle-top zone.
The 2021 April top printed an MVRV Z-Score of approximately 6.3 - inside-the-zone if you used a 5-zone threshold, slightly below if you used the older 7-zone threshold.
The 2021 November echo top printed an MVRV Z-Score of approximately 2.9 - far below either threshold. The indicator essentially missed the second leg of the 2021 double-top entirely.
The bottoms have been more consistent. December 2018 printed a Z-Score of approximately -0.2, clearly in the negative zone that historically marks accumulation. November 2022 printed approximately -0.1, same zone. Both bottoms confirmed the negative-zone heuristic.
So the Z-Score is accurate at cycle bottoms with reasonable consistency, but the cycle-top threshold has drifted downward across cycles. 9.3 in 2013, 11.5 in 2017, 6.3 in 2021-04, missed in 2021-11. If you use the same fixed threshold across all four tops, you either accept false negatives (missed signals at later tops) or false positives (entries triggered before earlier tops were fully formed). Neither is acceptable for sizing capital.
Where the methodology gets fragile.
Three structural issues with MVRV Z-Score as practitioners commonly use it.
First, threshold drift across cycles. The supply has grown roughly 2x since 2013 due to halvings. The realised cap denominator scales differently from the market cap numerator in ways that compress the natural Z-Score range. So the same statistical "extreme" reads different across cycles. The 2021-11 miss is the obvious case. If we use a rolling threshold rather than a fixed one, we recover the signal but at the cost of look-ahead bias if not handled carefully.
Second, realised cap data quality. The pure-form MVRV Z-Score requires per-UTXO valuation at last-spent price, which only comes from on-chain data providers like Glassnode, CoinMetrics, or CryptoQuant. Free-tier access to that data is gated. The SMM model on satoshimacro.com currently uses a 4Y MA proxy for MVRV input - that proxy is documented honestly on the methodology page rather than dressed up as the real series. When the CoinMetrics community API was tested as a free source earlier in 2026, the endpoint blocked from Cloudflare build IPs and never returned. So the proxy stays in place. Indicator name on the panel ends with "(4Y MA proxy)" so readers can tell.
Third, position-classifier framing. The MVRV Z-Score does not forecast price. It positions you in a cycle zone. The output is "right now we are in accumulation / neutral / caution / distribution / cycle top". The next-12-month price path is not contained in that classification. People who treat it as a forecaster blow up. People who treat it as a position classifier compound.
That distinction is the single most important framing in cycle research. Forecasting price is a fool's errand at any time horizon shorter than the cycle itself. Positioning into the right cycle zone is achievable and creates durable alpha.
How SMM treats MVRV Z-Score in its multi-factor architecture.
The SatoshiMacro Model (SMM) puts MVRV Z-Score inside Tier 1 (Valuation), which carries a 25 percent weight in the composite. Tier 1 contains six signals: MVRV Z-Score, Power Law deviation, NVT ratio, Mayer Multiple, Pi Cycle ratio, and a long-window moving-average premium. The MVRV input is one of six, weighted proportionally inside the tier.
That construction matters. If MVRV misses a cycle top in isolation (as it did in 2021-11), the other five signals in the same tier can still fire in the correct direction. The tier-level output dampens the single-signal failure mode. And Tier 1 is one of six tiers in the full model (Cycle Timing 30, Valuation 25, Sentiment 20, Rotation 10, Miner 10, Macro 5). So even if all of Tier 1 falters, the other 25 percentage points of the composite can still register the cycle position correctly through cross-tier confirmation.
The 7-of-7 in-zone calibration on historical BTC inflections - 2013-12, 2017-12, 2021-04, 2021-11 for tops, 2015-01, 2018-12, 2022-11 for bottoms - is what comes out the other side of that diversified construction. No single indicator including MVRV would survive that test. The composite does.
This is the point most cycle-research consumers miss. They take one indicator, calibrate it against three tops, and treat it as decisive. When the fourth top arrives and the indicator misses (which it will, statistically, because three data points cannot characterise a tail distribution), they revise their conviction in the indicator rather than recognising that no single indicator should ever have carried that weight to begin with.
Current MVRV Z-Score reading.
As of 25 May 2026, the SMM composite reads 65.8 calibrated (Caution zone, edging toward Distribution). Tier 1 Valuation reads 45.7. The MVRV input is one of the components that pulls Tier 1 down off the cycle-top zone - we are still meaningfully off the 2025-10 ATH and the unrealised-profit math has compressed since then. That reading is consistent with a mid-drawdown post-cycle-top position. Not a pre-cycle-top setup.
The honest limitations to call out.
The SMM-side MVRV input is a 4Y MA proxy until a free-tier realised-cap source is wired in. The historical calibration accuracy was preserved despite this because the proxy series tracks the real Z-Score series with reasonable directional consistency across cycles - peaks and troughs align even when the absolute magnitude differs.
For Australian-resident readers specifically: if you intend to act on a Z-Score-flavoured cycle call, the AUD CGT framework matters. Selling more than 12 months after acquisition currently qualifies for the 50 percent CGT discount under the existing CGT framework (under review for non-super-fund holders from 1 July 2027 onward per the 2026 Federal Budget). Selling inside 12 months means no discount and full marginal-rate taxation under s6-5 ITAA 1997. The practical CGT classification depends on the investor-vs-trader test under TR 97/11. Any cycle-call execution needs to account for the holding-period asymmetry, not just the price-zone read.
What I actually do with this on real capital.
My read is that MVRV Z-Score is a corroborating signal, not a primary one. I size positions against a multi-tier confluence reading, not a single indicator. The reading I take from MVRV is whether the cycle has compressed unrealised profit enough that further downside is unlikely to be driven by holder distribution. We are not there yet for the current cycle, but we are closer than the SMM Distribution zone reading on its own would suggest.
Practically, the way I use this on real capital is to overlay the MVRV reading against the Pi Cycle position, the Mayer Multiple, the funding-rate state, and the rotation-tier read on ETH/BTC ratio. When 3 to 4 of those align directionally, I size in. When they disagree, I stay neutral. The composite read is the position; the individual indicators are diagnostic, not actionable on their own.
The single biggest mistake I see in cycle-research consumption is people who treat MVRV (or any indicator) as binary. The market does not produce binary states. It produces probability distributions over states, and your portfolio construction should respect that.
Full MVRV Z-Score chart with every historical fire date and the methodology callout: https://satoshimacro.com/tools/crypto/cycle-indicators/bitcoin-market-value-z-score/
Reading as of 25 May 2026.
#BitcoinCycleAnalysis #OnChain #MVRV #SatoshiMacro
MVRV Z-Score: A Walkthrough of the Most Misused On-Chain Indicator
$BTC | MVRV Z-Score: A Walkthrough of the Most Misused On-Chain Indicator
The first time I watched the MVRV Z-Score on an institutional trading desk it was wrong, and the second time it was correct but in a way that wasn't useful. That tension - useful in retrospect, frustrating in real time - is the right starting point for understanding what this indicator actually does.
The standard formulation, often called the Awe & Wonder Z-Score after the analysts who popularised it on Glassnode, is straightforward:
Z = (Market Cap - Realised Cap) / standard deviation of Market Cap
Market Cap is trivially observable. Total BTC supply times current spot price. Realised Cap is the more interesting input. It values each UTXO at the price it last moved on-chain. So a coin sitting in a wallet since 2013 contributes its 2013 cost basis to Realised Cap, not today's spot value. The Z-Score normalises the gap between speculative valuation (Market Cap) and aggregate cost basis (Realised Cap) using an expanding-window standard deviation, so historical comparisons don't get skewed by recent volatility.
The thesis is straightforward. When the Z-Score is high - say above 7 historically - the market is so far above aggregate cost basis that holders are sitting on massive unrealised profit and are statistically likely to take some off the table. When it's negative, holders are underwater in aggregate and unlikely to capitulate further.
That thesis has worked at bottoms with reasonable consistency. It has worked less well at tops.
How it has performed across three completed cycles.
The 2013 December cycle top printed an MVRV Z-Score of approximately 9.3, well above the 7-zone that practitioners pointed at as the cycle-top trigger.
The 2017 December cycle top printed an MVRV Z-Score of approximately 11.5, again clearly inside the cycle-top zone.
The 2021 April top printed an MVRV Z-Score of approximately 6.3 - inside-the-zone if you used a 5-zone threshold, slightly below if you used the older 7-zone threshold.
The 2021 November echo top printed an MVRV Z-Score of approximately 2.9 - far below either threshold. The indicator essentially missed the second leg of the 2021 double-top entirely.
The bottoms have been more consistent. December 2018 printed a Z-Score of approximately -0.2, clearly in the negative zone that historically marks accumulation. November 2022 printed approximately -0.1, same zone. Both bottoms confirmed the negative-zone heuristic.
So the Z-Score is accurate at cycle bottoms with reasonable consistency, but the cycle-top threshold has drifted downward across cycles. 9.3 in 2013, 11.5 in 2017, 6.3 in 2021-04, missed in 2021-11. If you use the same fixed threshold across all four tops, you either accept false negatives (missed signals at later tops) or false positives (entries triggered before earlier tops were fully formed). Neither is acceptable for sizing capital.
Where the methodology gets fragile.
Three structural issues with MVRV Z-Score as practitioners commonly use it.
First, threshold drift across cycles. The supply has grown roughly 2x since 2013 due to halvings. The realised cap denominator scales differently from the market cap numerator in ways that compress the natural Z-Score range. So the same statistical "extreme" reads different across cycles. The 2021-11 miss is the obvious case. If we use a rolling threshold rather than a fixed one, we recover the signal but at the cost of look-ahead bias if not handled carefully.
Second, realised cap data quality. The pure-form MVRV Z-Score requires per-UTXO valuation at last-spent price, which only comes from on-chain data providers like Glassnode, CoinMetrics, or CryptoQuant. Free-tier access to that data is gated. The SMM model on satoshimacro.com currently uses a 4Y MA proxy for MVRV input - that proxy is documented honestly on the methodology page rather than dressed up as the real series. When the CoinMetrics community API was tested as a free source earlier in 2026, the endpoint blocked from Cloudflare build IPs and never returned. So the proxy stays in place. Indicator name on the panel ends with "(4Y MA proxy)" so readers can tell.
Third, position-classifier framing. The MVRV Z-Score does not forecast price. It positions you in a cycle zone. The output is "right now we are in accumulation / neutral / caution / distribution / cycle top". The next-12-month price path is not contained in that classification. People who treat it as a forecaster blow up. People who treat it as a position classifier compound.
That distinction is the single most important framing in cycle research. Forecasting price is a fool's errand at any time horizon shorter than the cycle itself. Positioning into the right cycle zone is achievable and creates durable alpha.
How SMM treats MVRV Z-Score in its multi-factor architecture.
The SatoshiMacro Model (SMM) puts MVRV Z-Score inside Tier 1 (Valuation), which carries a 25 percent weight in the composite. Tier 1 contains six signals: MVRV Z-Score, Power Law deviation, NVT ratio, Mayer Multiple, Pi Cycle ratio, and a long-window moving-average premium. The MVRV input is one of six, weighted proportionally inside the tier.
That construction matters. If MVRV misses a cycle top in isolation (as it did in 2021-11), the other five signals in the same tier can still fire in the correct direction. The tier-level output dampens the single-signal failure mode. And Tier 1 is one of six tiers in the full model (Cycle Timing 30, Valuation 25, Sentiment 20, Rotation 10, Miner 10, Macro 5). So even if all of Tier 1 falters, the other 25 percentage points of the composite can still register the cycle position correctly through cross-tier confirmation.
The 7-of-7 in-zone calibration on historical BTC inflections - 2013-12, 2017-12, 2021-04, 2021-11 for tops, 2015-01, 2018-12, 2022-11 for bottoms - is what comes out the other side of that diversified construction. No single indicator including MVRV would survive that test. The composite does.
This is the point most cycle-research consumers miss. They take one indicator, calibrate it against three tops, and treat it as decisive. When the fourth top arrives and the indicator misses (which it will, statistically, because three data points cannot characterise a tail distribution), they revise their conviction in the indicator rather than recognising that no single indicator should ever have carried that weight to begin with.
Current MVRV Z-Score reading.
As of 25 May 2026, the SMM composite reads 65.8 calibrated (Caution zone, edging toward Distribution). Tier 1 Valuation reads 45.7. The MVRV input is one of the components that pulls Tier 1 down off the cycle-top zone - we are still meaningfully off the 2025-10 ATH and the unrealised-profit math has compressed since then. That reading is consistent with a mid-drawdown post-cycle-top position. Not a pre-cycle-top setup.
The honest limitations to call out.
The SMM-side MVRV input is a 4Y MA proxy until a free-tier realised-cap source is wired in. The historical calibration accuracy was preserved despite this because the proxy series tracks the real Z-Score series with reasonable directional consistency across cycles - peaks and troughs align even when the absolute magnitude differs.
For Australian-resident readers specifically: if you intend to act on a Z-Score-flavoured cycle call, the AUD CGT framework matters. Selling more than 12 months after acquisition currently qualifies for the 50 percent CGT discount under the existing CGT framework (under review for non-super-fund holders from 1 July 2027 onward per the 2026 Federal Budget). Selling inside 12 months means no discount and full marginal-rate taxation under s6-5 ITAA 1997. The practical CGT classification depends on the investor-vs-trader test under TR 97/11. Any cycle-call execution needs to account for the holding-period asymmetry, not just the price-zone read.
What I actually do with this on real capital.
My read is that MVRV Z-Score is a corroborating signal, not a primary one. I size positions against a multi-tier confluence reading, not a single indicator. The reading I take from MVRV is whether the cycle has compressed unrealised profit enough that further downside is unlikely to be driven by holder distribution. We are not there yet for the current cycle, but we are closer than the SMM Distribution zone reading on its own would suggest.
Practically, the way I use this on real capital is to overlay the MVRV reading against the Pi Cycle position, the Mayer Multiple, the funding-rate state, and the rotation-tier read on ETH/BTC ratio. When 3 to 4 of those align directionally, I size in. When they disagree, I stay neutral. The composite read is the position; the individual indicators are diagnostic, not actionable on their own.
The single biggest mistake I see in cycle-research consumption is people who treat MVRV (or any indicator) as binary. The market does not produce binary states. It produces probability distributions over states, and your portfolio construction should respect that.
Full MVRV Z-Score chart with every historical fire date and the methodology callout: https://satoshimacro.com/tools/crypto/cycle-indicators/bitcoin-market-value-z-score/
Reading as of 25 May 2026.
#BitcoinCycleAnalysis #OnChain #MVRV #SatoshiMacro
The first time I watched the MVRV Z-Score on an institutional trading desk it was wrong, and the second time it was correct but in a way that wasn't useful. That tension - useful in retrospect, frustrating in real time - is the right starting point for understanding what this indicator actually does.
The standard formulation, often called the Awe & Wonder Z-Score after the analysts who popularised it on Glassnode, is straightforward:
Z = (Market Cap - Realised Cap) / standard deviation of Market Cap
Market Cap is trivially observable. Total BTC supply times current spot price. Realised Cap is the more interesting input. It values each UTXO at the price it last moved on-chain. So a coin sitting in a wallet since 2013 contributes its 2013 cost basis to Realised Cap, not today's spot value. The Z-Score normalises the gap between speculative valuation (Market Cap) and aggregate cost basis (Realised Cap) using an expanding-window standard deviation, so historical comparisons don't get skewed by recent volatility.
The thesis is straightforward. When the Z-Score is high - say above 7 historically - the market is so far above aggregate cost basis that holders are sitting on massive unrealised profit and are statistically likely to take some off the table. When it's negative, holders are underwater in aggregate and unlikely to capitulate further.
That thesis has worked at bottoms with reasonable consistency. It has worked less well at tops.
How it has performed across three completed cycles.
The 2013 December cycle top printed an MVRV Z-Score of approximately 9.3, well above the 7-zone that practitioners pointed at as the cycle-top trigger.
The 2017 December cycle top printed an MVRV Z-Score of approximately 11.5, again clearly inside the cycle-top zone.
The 2021 April top printed an MVRV Z-Score of approximately 6.3 - inside-the-zone if you used a 5-zone threshold, slightly below if you used the older 7-zone threshold.
The 2021 November echo top printed an MVRV Z-Score of approximately 2.9 - far below either threshold. The indicator essentially missed the second leg of the 2021 double-top entirely.
The bottoms have been more consistent. December 2018 printed a Z-Score of approximately -0.2, clearly in the negative zone that historically marks accumulation. November 2022 printed approximately -0.1, same zone. Both bottoms confirmed the negative-zone heuristic.
So the Z-Score is accurate at cycle bottoms with reasonable consistency, but the cycle-top threshold has drifted downward across cycles. 9.3 in 2013, 11.5 in 2017, 6.3 in 2021-04, missed in 2021-11. If you use the same fixed threshold across all four tops, you either accept false negatives (missed signals at later tops) or false positives (entries triggered before earlier tops were fully formed). Neither is acceptable for sizing capital.
Where the methodology gets fragile.
Three structural issues with MVRV Z-Score as practitioners commonly use it.
First, threshold drift across cycles. The supply has grown roughly 2x since 2013 due to halvings. The realised cap denominator scales differently from the market cap numerator in ways that compress the natural Z-Score range. So the same statistical "extreme" reads different across cycles. The 2021-11 miss is the obvious case. If we use a rolling threshold rather than a fixed one, we recover the signal but at the cost of look-ahead bias if not handled carefully.
Second, realised cap data quality. The pure-form MVRV Z-Score requires per-UTXO valuation at last-spent price, which only comes from on-chain data providers like Glassnode, CoinMetrics, or CryptoQuant. Free-tier access to that data is gated. The SMM model on satoshimacro.com currently uses a 4Y MA proxy for MVRV input - that proxy is documented honestly on the methodology page rather than dressed up as the real series. When the CoinMetrics community API was tested as a free source earlier in 2026, the endpoint blocked from Cloudflare build IPs and never returned. So the proxy stays in place. Indicator name on the panel ends with "(4Y MA proxy)" so readers can tell.
Third, position-classifier framing. The MVRV Z-Score does not forecast price. It positions you in a cycle zone. The output is "right now we are in accumulation / neutral / caution / distribution / cycle top". The next-12-month price path is not contained in that classification. People who treat it as a forecaster blow up. People who treat it as a position classifier compound.
That distinction is the single most important framing in cycle research. Forecasting price is a fool's errand at any time horizon shorter than the cycle itself. Positioning into the right cycle zone is achievable and creates durable alpha.
How SMM treats MVRV Z-Score in its multi-factor architecture.
The SatoshiMacro Model (SMM) puts MVRV Z-Score inside Tier 1 (Valuation), which carries a 25 percent weight in the composite. Tier 1 contains six signals: MVRV Z-Score, Power Law deviation, NVT ratio, Mayer Multiple, Pi Cycle ratio, and a long-window moving-average premium. The MVRV input is one of six, weighted proportionally inside the tier.
That construction matters. If MVRV misses a cycle top in isolation (as it did in 2021-11), the other five signals in the same tier can still fire in the correct direction. The tier-level output dampens the single-signal failure mode. And Tier 1 is one of six tiers in the full model (Cycle Timing 30, Valuation 25, Sentiment 20, Rotation 10, Miner 10, Macro 5). So even if all of Tier 1 falters, the other 25 percentage points of the composite can still register the cycle position correctly through cross-tier confirmation.
The 7-of-7 in-zone calibration on historical BTC inflections - 2013-12, 2017-12, 2021-04, 2021-11 for tops, 2015-01, 2018-12, 2022-11 for bottoms - is what comes out the other side of that diversified construction. No single indicator including MVRV would survive that test. The composite does.
This is the point most cycle-research consumers miss. They take one indicator, calibrate it against three tops, and treat it as decisive. When the fourth top arrives and the indicator misses (which it will, statistically, because three data points cannot characterise a tail distribution), they revise their conviction in the indicator rather than recognising that no single indicator should ever have carried that weight to begin with.
Current MVRV Z-Score reading.
As of 25 May 2026, the SMM composite reads 65.8 calibrated (Caution zone, edging toward Distribution). Tier 1 Valuation reads 45.7. The MVRV input is one of the components that pulls Tier 1 down off the cycle-top zone - we are still meaningfully off the 2025-10 ATH and the unrealised-profit math has compressed since then. That reading is consistent with a mid-drawdown post-cycle-top position. Not a pre-cycle-top setup.
The honest limitations to call out.
The SMM-side MVRV input is a 4Y MA proxy until a free-tier realised-cap source is wired in. The historical calibration accuracy was preserved despite this because the proxy series tracks the real Z-Score series with reasonable directional consistency across cycles - peaks and troughs align even when the absolute magnitude differs.
For Australian-resident readers specifically: if you intend to act on a Z-Score-flavoured cycle call, the AUD CGT framework matters. Selling more than 12 months after acquisition currently qualifies for the 50 percent CGT discount under the existing CGT framework (under review for non-super-fund holders from 1 July 2027 onward per the 2026 Federal Budget). Selling inside 12 months means no discount and full marginal-rate taxation under s6-5 ITAA 1997. The practical CGT classification depends on the investor-vs-trader test under TR 97/11. Any cycle-call execution needs to account for the holding-period asymmetry, not just the price-zone read.
What I actually do with this on real capital.
My read is that MVRV Z-Score is a corroborating signal, not a primary one. I size positions against a multi-tier confluence reading, not a single indicator. The reading I take from MVRV is whether the cycle has compressed unrealised profit enough that further downside is unlikely to be driven by holder distribution. We are not there yet for the current cycle, but we are closer than the SMM Distribution zone reading on its own would suggest.
Practically, the way I use this on real capital is to overlay the MVRV reading against the Pi Cycle position, the Mayer Multiple, the funding-rate state, and the rotation-tier read on ETH/BTC ratio. When 3 to 4 of those align directionally, I size in. When they disagree, I stay neutral. The composite read is the position; the individual indicators are diagnostic, not actionable on their own.
The single biggest mistake I see in cycle-research consumption is people who treat MVRV (or any indicator) as binary. The market does not produce binary states. It produces probability distributions over states, and your portfolio construction should respect that.
Full MVRV Z-Score chart with every historical fire date and the methodology callout: https://satoshimacro.com/tools/crypto/cycle-indicators/bitcoin-market-value-z-score/
Reading as of 25 May 2026.
#BitcoinCycleAnalysis #OnChain #MVRV #SatoshiMacro
1
90

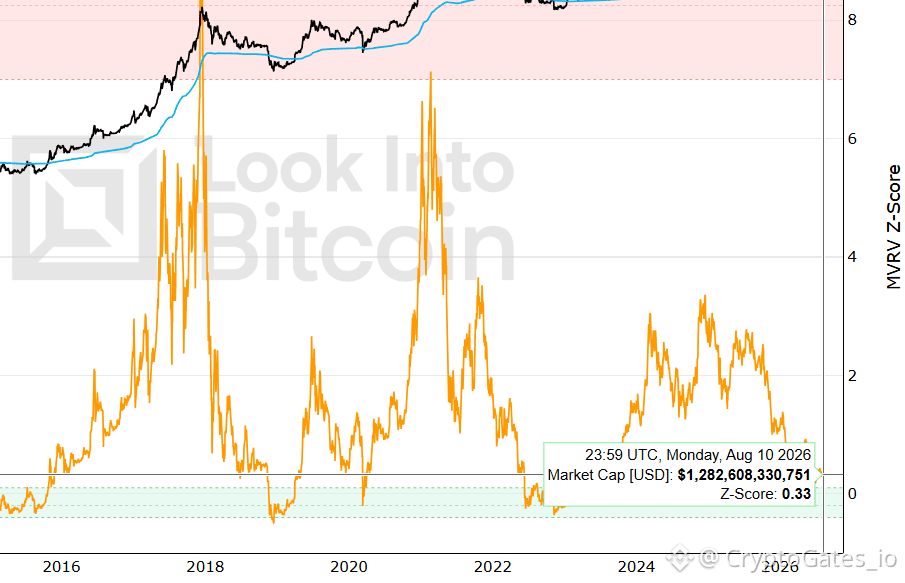
MVRV Z-Score: 0.33 📊
Market cap and realized cap are converging - aggregate unrealized profit across the network is compressed, not extreme. This zone sits below historical cycle-top readings (7+) and above deep-capitulation territory (sub-zero).
Execution-relevant takeaway: crowded euphoria isn't present here. Positioning discipline matters more in compressed zones like this than in obviously extreme ones, where the signal is louder.
Stress-test your entries against this exact regime...
#MVRV #OnChainAnalysis #TradingStrategy
MVRV Z-Score: 0.33 📊
Market cap and realized cap are converging - aggregate unrealized profit across the network is compressed, not extreme. This zone sits below historical cycle-top readings (7+) and above deep-capitulation territory (sub-zero).
Execution-relevant takeaway: crowded euphoria isn't present here. Positioning discipline matters more in compressed zones like this than in obviously extreme ones, where the signal is louder.
Stress-test your entries against this exact regime...
#MVRV #OnChainAnalysis #TradingStrategy
Market cap and realized cap are converging - aggregate unrealized profit across the network is compressed, not extreme. This zone sits below historical cycle-top readings (7+) and above deep-capitulation territory (sub-zero).
Execution-relevant takeaway: crowded euphoria isn't present here. Positioning discipline matters more in compressed zones like this than in obviously extreme ones, where the signal is louder.
Stress-test your entries against this exact regime...
#MVRV #OnChainAnalysis #TradingStrategy
106

·
--
$ETH $DOGE $SHIB
{spot}(ETHUSDT)
{spot}(SHIBUSDT)
Millions watching the market! Is ETH repeating the “golden pit”?📉 Have buy-the-dip signals appeared?
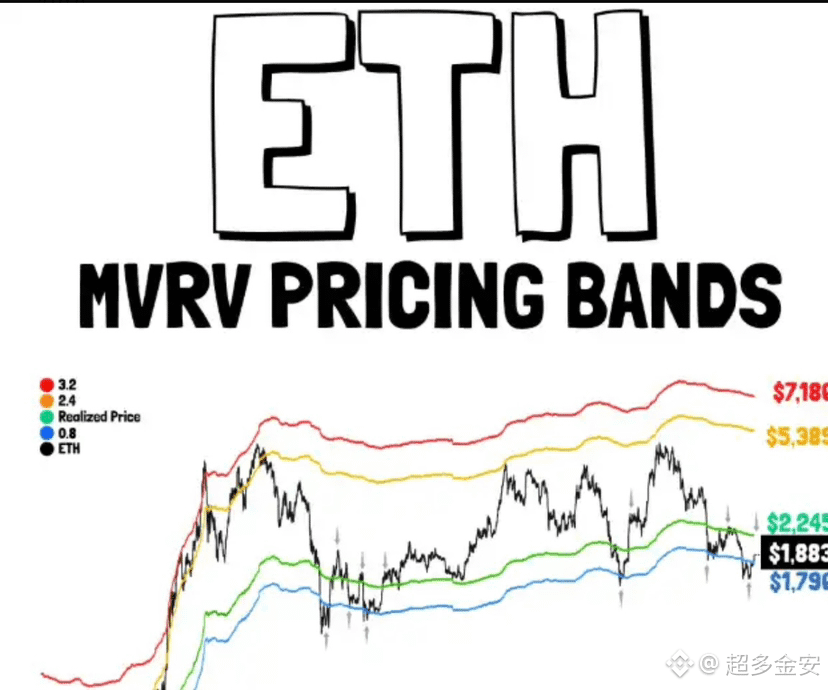
Is history always incredibly similar?🤔 On-chain analyst ali_charts has made a major observation: after ETH regains the MVRV 0.8 “lifeline,” it is now targeting a $2,300 realized price. Does this scene make you think of the past four times that “golden cross” miracle happened?💥
Looking back at the historical script, every MVRV momentum golden cross has stirred up huge waves, with subsequent gains pointing to 50%-166%!📈 Right now, the same recipe, the familiar flavor—once again unfolding. So is this the prelude to a bottom reversal, or a “bull trap” orchestrated by the main players?🪤
Don’t get carried away just yet—the “severely affected zone” ahead must not be overlooked!⛰️ At the $3,000 level, there are more than 10 million ETH stuck in “trapped positions.” This isn’t a small number. When bulls and bears go head-to-head, it’s bound to be a bloody battle.🚀 Is it building strength for a breakout, or will the market face pressure and pull back? The market will give the answer.
ETH is currently at a crossroads, and the battle between bulls and bears is heating up. Do you think ETH can break through the “iron ceiling” of $3,000 and restore its past glory?👀 Leave your thoughts in the comments—we’ll see together!🔥
#ETH #加密货币 #交易信号 #MVRV
{web3_wallet_create}(10xcf91b70017eabde82c9671e30e5502d312ea6eb2)
$ETH $DOGE $SHIB
Millions watching the market! Is ETH repeating the “golden pit”?📉 Have buy-the-dip signals appeared?
Is history always incredibly similar?🤔 On-chain analyst ali_charts has made a major observation: after ETH regains the MVRV 0.8 “lifeline,” it is now targeting a $2,300 realized price. Does this scene make you think of the past four times that “golden cross” miracle happened?💥
Looking back at the historical script, every MVRV momentum golden cross has stirred up huge waves, with subsequent gains pointing to 50%-166%!📈 Right now, the same recipe, the familiar flavor—once again unfolding. So is this the prelude to a bottom reversal, or a “bull trap” orchestrated by the main players?🪤
Don’t get carried away just yet—the “severely affected zone” ahead must not be overlooked!⛰️ At the $3,000 level, there are more than 10 million ETH stuck in “trapped positions.” This isn’t a small number. When bulls and bears go head-to-head, it’s bound to be a bloody battle.🚀 Is it building strength for a breakout, or will the market face pressure and pull back? The market will give the answer.
ETH is currently at a crossroads, and the battle between bulls and bears is heating up. Do you think ETH can break through the “iron ceiling” of $3,000 and restore its past glory?👀 Leave your thoughts in the comments—we’ll see together!🔥
#ETH #加密货币 #交易信号 #MVRV
Millions watching the market! Is ETH repeating the “golden pit”?📉 Have buy-the-dip signals appeared?
Is history always incredibly similar?🤔 On-chain analyst ali_charts has made a major observation: after ETH regains the MVRV 0.8 “lifeline,” it is now targeting a $2,300 realized price. Does this scene make you think of the past four times that “golden cross” miracle happened?💥
Looking back at the historical script, every MVRV momentum golden cross has stirred up huge waves, with subsequent gains pointing to 50%-166%!📈 Right now, the same recipe, the familiar flavor—once again unfolding. So is this the prelude to a bottom reversal, or a “bull trap” orchestrated by the main players?🪤
Don’t get carried away just yet—the “severely affected zone” ahead must not be overlooked!⛰️ At the $3,000 level, there are more than 10 million ETH stuck in “trapped positions.” This isn’t a small number. When bulls and bears go head-to-head, it’s bound to be a bloody battle.🚀 Is it building strength for a breakout, or will the market face pressure and pull back? The market will give the answer.
ETH is currently at a crossroads, and the battle between bulls and bears is heating up. Do you think ETH can break through the “iron ceiling” of $3,000 and restore its past glory?👀 Leave your thoughts in the comments—we’ll see together!🔥
#ETH #加密货币 #交易信号 #MVRV

4
869

·
--
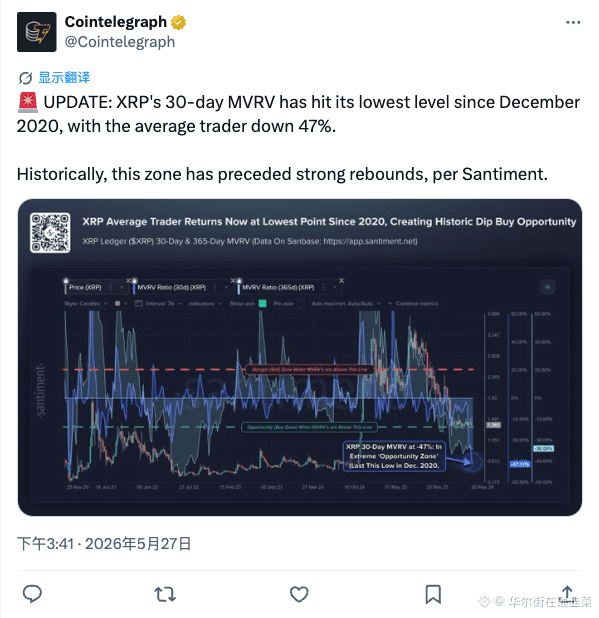
The average trader for XRP is currently at a 47% loss, with the 30-day MVRV hitting its lowest since December 2020.
Historically, this area has bounced back a few times, but whether history will repeat itself is something only the whales know.
In this deep water zone, it could either be a golden opportunity or a bottomless pit; waiting for the bottom structure to form before jumping in is a wise move. #MVRV $XRP
{future}(XRPUSDT)
The average trader for XRP is currently at a 47% loss, with the 30-day MVRV hitting its lowest since December 2020.
Historically, this area has bounced back a few times, but whether history will repeat itself is something only the whales know.
In this deep water zone, it could either be a golden opportunity or a bottomless pit; waiting for the bottom structure to form before jumping in is a wise move. #MVRV $XRP
Historically, this area has bounced back a few times, but whether history will repeat itself is something only the whales know.
In this deep water zone, it could either be a golden opportunity or a bottomless pit; waiting for the bottom structure to form before jumping in is a wise move. #MVRV $XRP
102

$BTC NEAR THE LOW END OF THE POST-HALVING VALUE CHANNEL 🔥
Entry: $59,000 🔥
The MVRV Z-Score framework shows Bitcoin trapped in a compressed $59k–$70k channel. We're currently hugging the lower band, and history suggests a weak rebound before July 23 — not a crash to $50k. Volume is low and momentum is flat, exactly how range bottoms look before they either bounce or fail.
If the pattern holds, we may see a slow grind back toward $69k–$70k, but nothing explosive yet. The real danger zone is late July through August when the four-year cycle timing flips. Are you scaling in here or waiting for a clean sweep of the range low?
Not financial advice. Always manage your risk.
#BTC #Bitcoin #MVRV #RangeBound
🔥
$BTC NEAR THE LOW END OF THE POST-HALVING VALUE CHANNEL 🔥
Entry: $59,000 🔥
The MVRV Z-Score framework shows Bitcoin trapped in a compressed $59k–$70k channel. We're currently hugging the lower band, and history suggests a weak rebound before July 23 — not a crash to $50k. Volume is low and momentum is flat, exactly how range bottoms look before they either bounce or fail.
If the pattern holds, we may see a slow grind back toward $69k–$70k, but nothing explosive yet. The real danger zone is late July through August when the four-year cycle timing flips. Are you scaling in here or waiting for a clean sweep of the range low?
Not financial advice. Always manage your risk.
#BTC #Bitcoin #MVRV #RangeBound
🔥
Entry: $59,000 🔥
The MVRV Z-Score framework shows Bitcoin trapped in a compressed $59k–$70k channel. We're currently hugging the lower band, and history suggests a weak rebound before July 23 — not a crash to $50k. Volume is low and momentum is flat, exactly how range bottoms look before they either bounce or fail.
If the pattern holds, we may see a slow grind back toward $69k–$70k, but nothing explosive yet. The real danger zone is late July through August when the four-year cycle timing flips. Are you scaling in here or waiting for a clean sweep of the range low?
Not financial advice. Always manage your risk.
#BTC #Bitcoin #MVRV #RangeBound
🔥
55
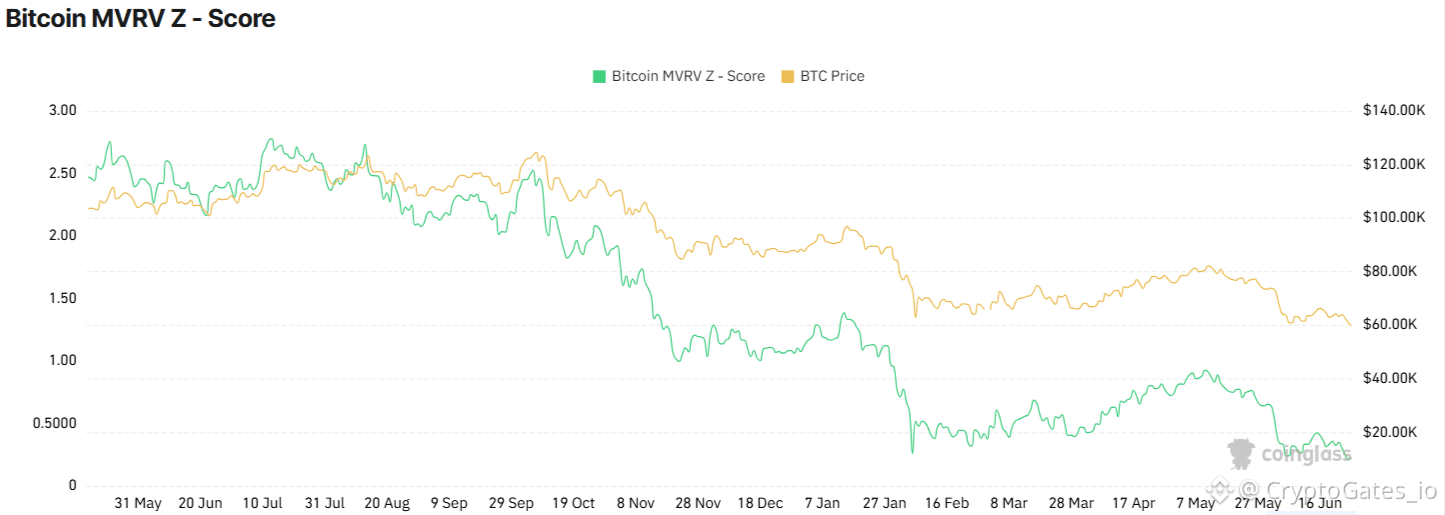
Market Intelligence - MVRV Z-Score Check
Bitcoin's MVRV Z-Score has fallen to 0.22, placing it firmly in undervaluation territory relative to its historical range.
Z-Score compression of this magnitude reflects a significant cooling of unrealized profits across the network.
Interpretation: Historically, readings this low have coincided with exhaustion phases rather than fresh markdown cycles, though the metric flags risk zones, not timing.
Lesson: Strategy discipline matters more in compressed zones like this than in trending markets.
This is exactly the kind of environment CG's Strategy Engine is designed to stress-test, so your positioning is built on data, not emotion.
#MVRV #BTC #CryptoGates
Market Intelligence - MVRV Z-Score Check
Bitcoin's MVRV Z-Score has fallen to 0.22, placing it firmly in undervaluation territory relative to its historical range.
Z-Score compression of this magnitude reflects a significant cooling of unrealized profits across the network.
Interpretation: Historically, readings this low have coincided with exhaustion phases rather than fresh markdown cycles, though the metric flags risk zones, not timing.
Lesson: Strategy discipline matters more in compressed zones like this than in trending markets.
This is exactly the kind of environment CG's Strategy Engine is designed to stress-test, so your positioning is built on data, not emotion.
#MVRV #BTC #CryptoGates
Bitcoin's MVRV Z-Score has fallen to 0.22, placing it firmly in undervaluation territory relative to its historical range.
Z-Score compression of this magnitude reflects a significant cooling of unrealized profits across the network.
Interpretation: Historically, readings this low have coincided with exhaustion phases rather than fresh markdown cycles, though the metric flags risk zones, not timing.
Lesson: Strategy discipline matters more in compressed zones like this than in trending markets.
This is exactly the kind of environment CG's Strategy Engine is designed to stress-test, so your positioning is built on data, not emotion.
#MVRV #BTC #CryptoGates
97

·
--
Bitcoin MVRV Z-Score Analysis: Current value is 3.5, sitting at the historical median level. The MVRV peaked at 7 in 2017 and hit 4.5 in 2021. From an MVRV perspective, we still have significant room before hitting this cycle's top. On-chain indicators support a continued bullish outlook. #MVRV #链上指标 #Bitcoin
Bitcoin MVRV Z-Score Analysis: Current value is 3.5, sitting at the historical median level. The MVRV peaked at 7 in 2017 and hit 4.5 in 2021. From an MVRV perspective, we still have significant room before hitting this cycle's top. On-chain indicators support a continued bullish outlook. #MVRV #链上指标 #Bitcoin
72
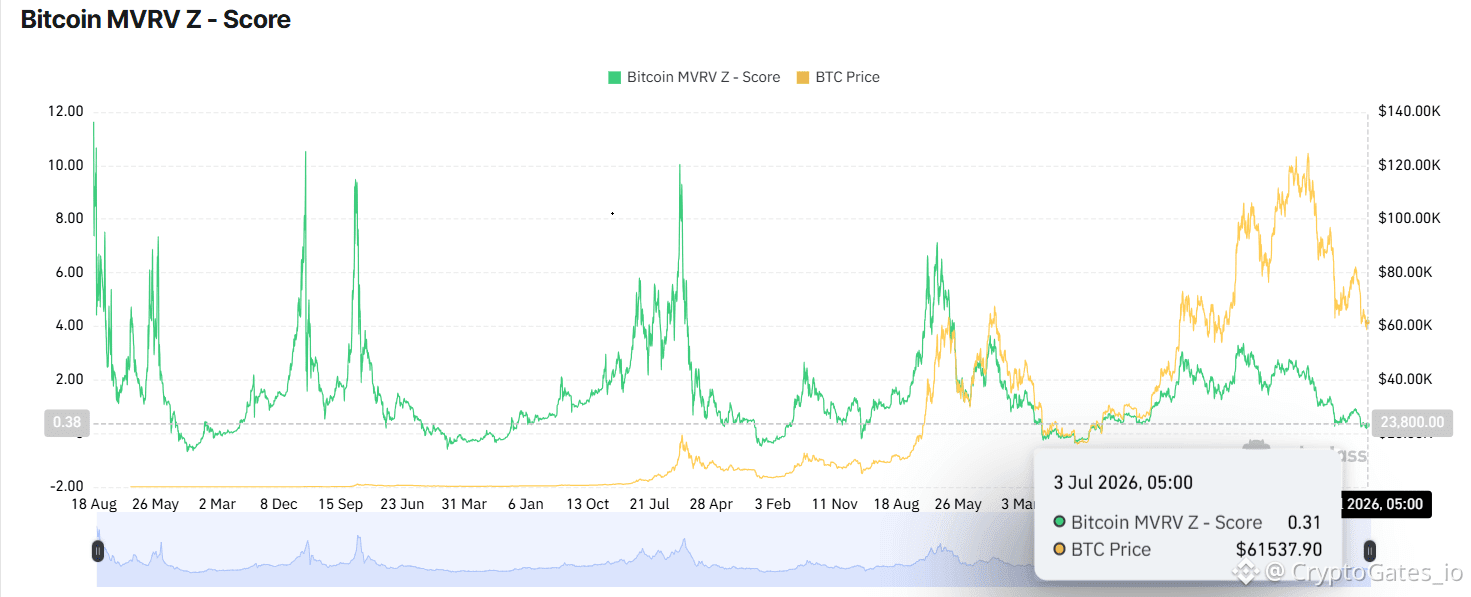
MVRV Z-Score: 0.31 📊
$BTC: ~$61,537
Market value is sitting close to realized value - the on-chain "cost basis" zone.
Historically, readings this low have coincided with reduced speculative excess rather than overheated conditions.
Key point: this isn't a buy signal. It's valuation context. What matters is how it's used - backtested against a defined strategy, not traded on vibes.
This is the type of setup where $DCA and rebalance strategies typically get modeled before execution.
#MVRV #OnChainData #TradingStrategy
MVRV Z-Score: 0.31 📊
$BTC: ~$61,537
Market value is sitting close to realized value - the on-chain "cost basis" zone.
Historically, readings this low have coincided with reduced speculative excess rather than overheated conditions.
Key point: this isn't a buy signal. It's valuation context. What matters is how it's used - backtested against a defined strategy, not traded on vibes.
This is the type of setup where $DCA and rebalance strategies typically get modeled before execution.
#MVRV #OnChainData #TradingStrategy
$BTC: ~$61,537
Market value is sitting close to realized value - the on-chain "cost basis" zone.
Historically, readings this low have coincided with reduced speculative excess rather than overheated conditions.
Key point: this isn't a buy signal. It's valuation context. What matters is how it's used - backtested against a defined strategy, not traded on vibes.
This is the type of setup where $DCA and rebalance strategies typically get modeled before execution.
#MVRV #OnChainData #TradingStrategy
109

$BTC NEARING LONG-TERM HOLDER BREAKEVEN LINE 🔥
Bitcoin long-term holder MVRV just dropped to 1.24 — that's a three-year low. The breakeven sits around $48,400 while we're trading at $59,000, meaning the average unrealized profit for LTHs has squeezed to just 24%.
Here's the key: despite the price action, these holders aren't selling. LTH holdings hit an all-time high of 16.1M BTC and spending output remains low. This isn't capitulation — it's market retracement. The real question is whether we reclaim momentum before that breakeven line becomes a magnet.
Do you see this as a healthy reset or a warning sign for lower levels?
Not financial advice. Always manage your risk.
#BTC #LongTermHolders #MVRV #Bitcoin
💎
$BTC NEARING LONG-TERM HOLDER BREAKEVEN LINE 🔥
Bitcoin long-term holder MVRV just dropped to 1.24 — that's a three-year low. The breakeven sits around $48,400 while we're trading at $59,000, meaning the average unrealized profit for LTHs has squeezed to just 24%.
Here's the key: despite the price action, these holders aren't selling. LTH holdings hit an all-time high of 16.1M BTC and spending output remains low. This isn't capitulation — it's market retracement. The real question is whether we reclaim momentum before that breakeven line becomes a magnet.
Do you see this as a healthy reset or a warning sign for lower levels?
Not financial advice. Always manage your risk.
#BTC #LongTermHolders #MVRV #Bitcoin
💎
Bitcoin long-term holder MVRV just dropped to 1.24 — that's a three-year low. The breakeven sits around $48,400 while we're trading at $59,000, meaning the average unrealized profit for LTHs has squeezed to just 24%.
Here's the key: despite the price action, these holders aren't selling. LTH holdings hit an all-time high of 16.1M BTC and spending output remains low. This isn't capitulation — it's market retracement. The real question is whether we reclaim momentum before that breakeven line becomes a magnet.
Do you see this as a healthy reset or a warning sign for lower levels?
Not financial advice. Always manage your risk.
#BTC #LongTermHolders #MVRV #Bitcoin
💎
19

#bitcoin #MVRV
📉 Bitcoin below historical norms: a prerequisite for a breakout or a warning sign?
$BTC is currently trading in the range of $64,000–$66,000, which is significantly below its average historical estimates. Indicators point to the coin being undervalued, but will we see a final “cleaning” of the market before a new rally?
We have collected the main theses from the latest CryptoQuant analysis:
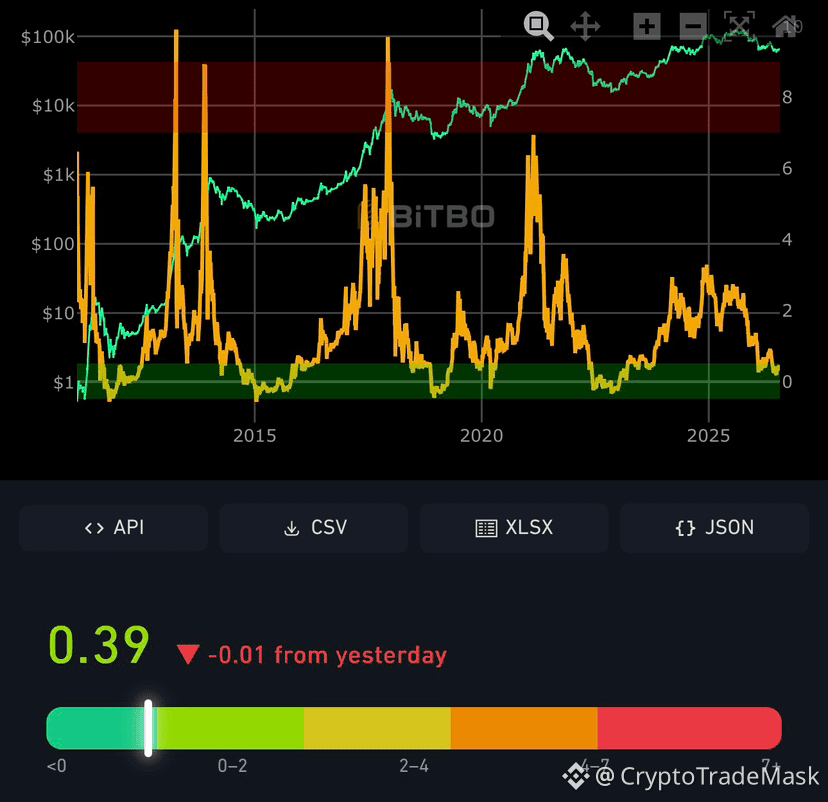
📊 What does the MVRV Z-Score indicator say?
The MVRV Z-Score metric (which compares the market and realized value of $BTC ) is currently at ~0.42 — significantly below the historical average of 1.7.
June bottom: On June 30, the indicator sank to 0.185 (the lowest figure of this cycle).
No surrender: Despite the price weakness, the indicator has not yet fallen below zero. For example, at the bottom of the 2022 bear market (when BTC was worth $16,000–$17,000), the Z-Score sat in the negative zone for several weeks. This means that we have not yet seen panic selling at the level of previous cycles.
💸 Losses turned into profits
In June and mid-July, investors recorded gigantic realized losses (about $8.5 billion in June and $3 billion in July).
However, over the past week, the trend has reversed: the PnL indicator has become positive again - investors recorded profits at the level of $239 million–$500 million.
The pressure from sellers is noticeably decreasing, but analysts warn: this relief does not yet guarantee that the cyclical bottom has finally formed.
📊 Two scenarios for the development of events:
📈 Optimistic: A return of the Z-Score to the average mark of 1.7 will confirm the restoration of a healthy asset valuation. Some analysts suggest that there may not be a "classic" panic surrender this time, and the market has already undergone its restart.
📉 Negative: A break through the June low (0.185) and entry into the negative zone will signal the risk of further decline in the BTC price before the final reversal.
{future}(BTCUSDT)
#bitcoin #MVRV
📉 Bitcoin below historical norms: a prerequisite for a breakout or a warning sign?
$BTC is currently trading in the range of $64,000–$66,000, which is significantly below its average historical estimates. Indicators point to the coin being undervalued, but will we see a final “cleaning” of the market before a new rally?
We have collected the main theses from the latest CryptoQuant analysis:
📊 What does the MVRV Z-Score indicator say?
The MVRV Z-Score metric (which compares the market and realized value of $BTC ) is currently at ~0.42 — significantly below the historical average of 1.7.
June bottom: On June 30, the indicator sank to 0.185 (the lowest figure of this cycle).
No surrender: Despite the price weakness, the indicator has not yet fallen below zero. For example, at the bottom of the 2022 bear market (when BTC was worth $16,000–$17,000), the Z-Score sat in the negative zone for several weeks. This means that we have not yet seen panic selling at the level of previous cycles.
💸 Losses turned into profits
In June and mid-July, investors recorded gigantic realized losses (about $8.5 billion in June and $3 billion in July).
However, over the past week, the trend has reversed: the PnL indicator has become positive again - investors recorded profits at the level of $239 million–$500 million.
The pressure from sellers is noticeably decreasing, but analysts warn: this relief does not yet guarantee that the cyclical bottom has finally formed.
📊 Two scenarios for the development of events:
📈 Optimistic: A return of the Z-Score to the average mark of 1.7 will confirm the restoration of a healthy asset valuation. Some analysts suggest that there may not be a "classic" panic surrender this time, and the market has already undergone its restart.
📉 Negative: A break through the June low (0.185) and entry into the negative zone will signal the risk of further decline in the BTC price before the final reversal.
📉 Bitcoin below historical norms: a prerequisite for a breakout or a warning sign?
$BTC is currently trading in the range of $64,000–$66,000, which is significantly below its average historical estimates. Indicators point to the coin being undervalued, but will we see a final “cleaning” of the market before a new rally?
We have collected the main theses from the latest CryptoQuant analysis:
📊 What does the MVRV Z-Score indicator say?
The MVRV Z-Score metric (which compares the market and realized value of $BTC ) is currently at ~0.42 — significantly below the historical average of 1.7.
June bottom: On June 30, the indicator sank to 0.185 (the lowest figure of this cycle).
No surrender: Despite the price weakness, the indicator has not yet fallen below zero. For example, at the bottom of the 2022 bear market (when BTC was worth $16,000–$17,000), the Z-Score sat in the negative zone for several weeks. This means that we have not yet seen panic selling at the level of previous cycles.
💸 Losses turned into profits
In June and mid-July, investors recorded gigantic realized losses (about $8.5 billion in June and $3 billion in July).
However, over the past week, the trend has reversed: the PnL indicator has become positive again - investors recorded profits at the level of $239 million–$500 million.
The pressure from sellers is noticeably decreasing, but analysts warn: this relief does not yet guarantee that the cyclical bottom has finally formed.
📊 Two scenarios for the development of events:
📈 Optimistic: A return of the Z-Score to the average mark of 1.7 will confirm the restoration of a healthy asset valuation. Some analysts suggest that there may not be a "classic" panic surrender this time, and the market has already undergone its restart.
📉 Negative: A break through the June low (0.185) and entry into the negative zone will signal the risk of further decline in the BTC price before the final reversal.
161

·
--
MVRV ratio (Market Value to Realized Value) measures whether BTC holders are in aggregate profit or loss.
MVRV above 3.5: historically signals market tops — most holders are in significant profit and distribution tends to accelerate.
MVRV below 1: historically signals market bottoms — the market trades below the average cost basis of all coins.
Current MVRV is in the range that has historically preceded bull continuation — not euphoria, not capitulation.
On-chain metrics don't replace price analysis. They provide context that price alone can't.
#OnChain #Bitcoin #MVRV $BTC
MVRV ratio (Market Value to Realized Value) measures whether BTC holders are in aggregate profit or loss.
MVRV above 3.5: historically signals market tops — most holders are in significant profit and distribution tends to accelerate.
MVRV below 1: historically signals market bottoms — the market trades below the average cost basis of all coins.
Current MVRV is in the range that has historically preceded bull continuation — not euphoria, not capitulation.
On-chain metrics don't replace price analysis. They provide context that price alone can't.
#OnChain #Bitcoin #MVRV $BTC
MVRV above 3.5: historically signals market tops — most holders are in significant profit and distribution tends to accelerate.
MVRV below 1: historically signals market bottoms — the market trades below the average cost basis of all coins.
Current MVRV is in the range that has historically preceded bull continuation — not euphoria, not capitulation.
On-chain metrics don't replace price analysis. They provide context that price alone can't.
#OnChain #Bitcoin #MVRV $BTC
41

·
--
$BTC LTH MVRV DROPS TO 1.24 — THREE-YEAR LOW IN SIGHT 📉
Long-term holder MVRV has fallen to 1.24, just 19% above the breakeven line at $48,400. With current price near $59,000, unrealized profits are the thinnest since 2021.
Despite this, LTH supply sits at a record 16.1M BTC and spending output remains low — no signs of panic selling. The decline is driven by spot market retracement, not holder capitulation.
Are you watching this breakeven level as the next major support zone?
Not financial advice. Always manage your risk.
#BTC #LongTermHolder #MVRV #BitcoinAnalysis
🔥
$BTC LTH MVRV DROPS TO 1.24 — THREE-YEAR LOW IN SIGHT 📉
Long-term holder MVRV has fallen to 1.24, just 19% above the breakeven line at $48,400. With current price near $59,000, unrealized profits are the thinnest since 2021.
Despite this, LTH supply sits at a record 16.1M BTC and spending output remains low — no signs of panic selling. The decline is driven by spot market retracement, not holder capitulation.
Are you watching this breakeven level as the next major support zone?
Not financial advice. Always manage your risk.
#BTC #LongTermHolder #MVRV #BitcoinAnalysis
🔥
Long-term holder MVRV has fallen to 1.24, just 19% above the breakeven line at $48,400. With current price near $59,000, unrealized profits are the thinnest since 2021.
Despite this, LTH supply sits at a record 16.1M BTC and spending output remains low — no signs of panic selling. The decline is driven by spot market retracement, not holder capitulation.
Are you watching this breakeven level as the next major support zone?
Not financial advice. Always manage your risk.
#BTC #LongTermHolder #MVRV #BitcoinAnalysis
🔥
69

·
--
MVRV drops to 1.22: On-chain data says BTC is entering a cheap zone, but August is the key window to verify the truthMVRV drops to 1.22: On-chain data says BTC is entering a “cheap zone,” but August is the key window to verify the truth
If you only look at the price, BTC is consolidating around $63,000 and there doesn’t seem to be much of a story. But if you look at on-chain valuation indicators, a rare signal is forming.
## MVRV 1.22: What does it mean?
MVRV (Market Value to Realized Value) is one of the most important on-chain valuation metrics for Bitcoin. It compares Bitcoin’s market value (current price × circulating supply) with its realized value (the sum of the prices at which each coin last moved on-chain).
MVRV drops to 1.22: On-chain data says BTC is entering a cheap zone, but August is the key window to verify the truth
MVRV drops to 1.22: On-chain data says BTC is entering a “cheap zone,” but August is the key window to verify the truth
If you only look at the price, BTC is consolidating around $63,000 and there doesn’t seem to be much of a story. But if you look at on-chain valuation indicators, a rare signal is forming.
## MVRV 1.22: What does it mean?
MVRV (Market Value to Realized Value) is one of the most important on-chain valuation metrics for Bitcoin. It compares Bitcoin’s market value (current price × circulating supply) with its realized value (the sum of the prices at which each coin last moved on-chain).
If you only look at the price, BTC is consolidating around $63,000 and there doesn’t seem to be much of a story. But if you look at on-chain valuation indicators, a rare signal is forming.
## MVRV 1.22: What does it mean?
MVRV (Market Value to Realized Value) is one of the most important on-chain valuation metrics for Bitcoin. It compares Bitcoin’s market value (current price × circulating supply) with its realized value (the sum of the prices at which each coin last moved on-chain).
159

·
--
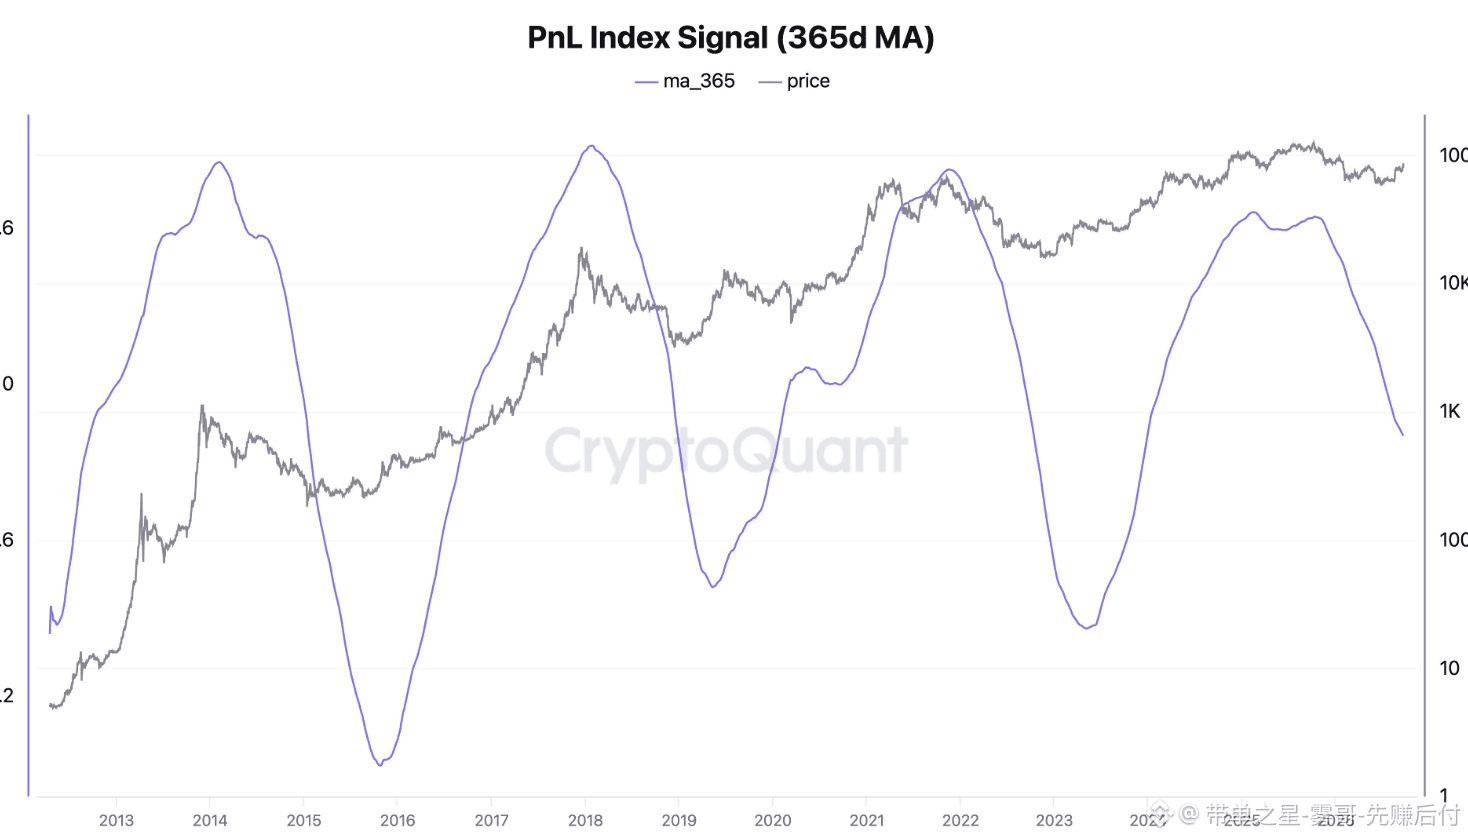
#BTC I expect that this round of the Bitcoin bull market cycle will bring a 3–5x increase, rather than the earlier pattern of 10x+ parabolic upside followed by a relatively mild bear market. In earlier periods when Bitcoin’s scale was smaller and retail investors dominated, hot money drove explosive rallies and equally explosive sell-offs—leading to an 80% collapse. Today, the market scale has expanded significantly and institutional holdings have continued to grow, curbing these two extreme scenarios. Factors that limit upside potential have also eased downside potential. The Profit and Loss Index (PnL Index), which tracks the overall profitability of holders, reflects this: the extremity of the cycle’s top and bottom has decreased, and it has occurred at higher profit levels. In this cycle, #MVRV has never fallen below 1. Even at the lows, Bitcoin’s price is above the holders’ average on-chain cost basis. Some investors have suffered losses, but overall, holders have never been underwater. Meanwhile: → An increase in realized market cap indicates new capital inflows. → Large holders have stopped selling. → Large futures traders have built a substantial long position near the bottom. Even the 365-day moving average of the PnL Index (which typically lags at turning points) is currently forming an important inflection point. None of this means Bitcoin has reached its ceiling. It means the trade-offs have changed. Giving up 10x parabolic growth also means giving up an 80% drawdown—precisely why this attracts patient, long-term investment capital rather than speculative money. This road is rugged and not always smooth, but the destination may ultimately be closer to Satoshi Nakamoto’s vision than any prior speculative era: an asset stable enough to actually be used as money. The shared vision of Satoshi and several generations of Bitcoin holders—once dubbed a “self-fulfilling prophecy”—may now be becoming real. Once Bitcoin matures enough to serve as true money, this internet-native capital could reshape the world in ways you can hardly imagine. #BTC走势分析
#BTC I expect that this round of the Bitcoin bull market cycle will bring a 3–5x increase, rather than the earlier pattern of 10x+ parabolic upside followed by a relatively mild bear market. In earlier periods when Bitcoin’s scale was smaller and retail investors dominated, hot money drove explosive rallies and equally explosive sell-offs—leading to an 80% collapse. Today, the market scale has expanded significantly and institutional holdings have continued to grow, curbing these two extreme scenarios. Factors that limit upside potential have also eased downside potential. The Profit and Loss Index (PnL Index), which tracks the overall profitability of holders, reflects this: the extremity of the cycle’s top and bottom has decreased, and it has occurred at higher profit levels. In this cycle, #MVRV has never fallen below 1. Even at the lows, Bitcoin’s price is above the holders’ average on-chain cost basis. Some investors have suffered losses, but overall, holders have never been underwater. Meanwhile: → An increase in realized market cap indicates new capital inflows. → Large holders have stopped selling. → Large futures traders have built a substantial long position near the bottom. Even the 365-day moving average of the PnL Index (which typically lags at turning points) is currently forming an important inflection point. None of this means Bitcoin has reached its ceiling. It means the trade-offs have changed. Giving up 10x parabolic growth also means giving up an 80% drawdown—precisely why this attracts patient, long-term investment capital rather than speculative money. This road is rugged and not always smooth, but the destination may ultimately be closer to Satoshi Nakamoto’s vision than any prior speculative era: an asset stable enough to actually be used as money. The shared vision of Satoshi and several generations of Bitcoin holders—once dubbed a “self-fulfilling prophecy”—may now be becoming real. Once Bitcoin matures enough to serve as true money, this internet-native capital could reshape the world in ways you can hardly imagine. #BTC走势分析
16

📈 Profit-taking operations are still limited, while buying momentum is increasing through ETF funds.
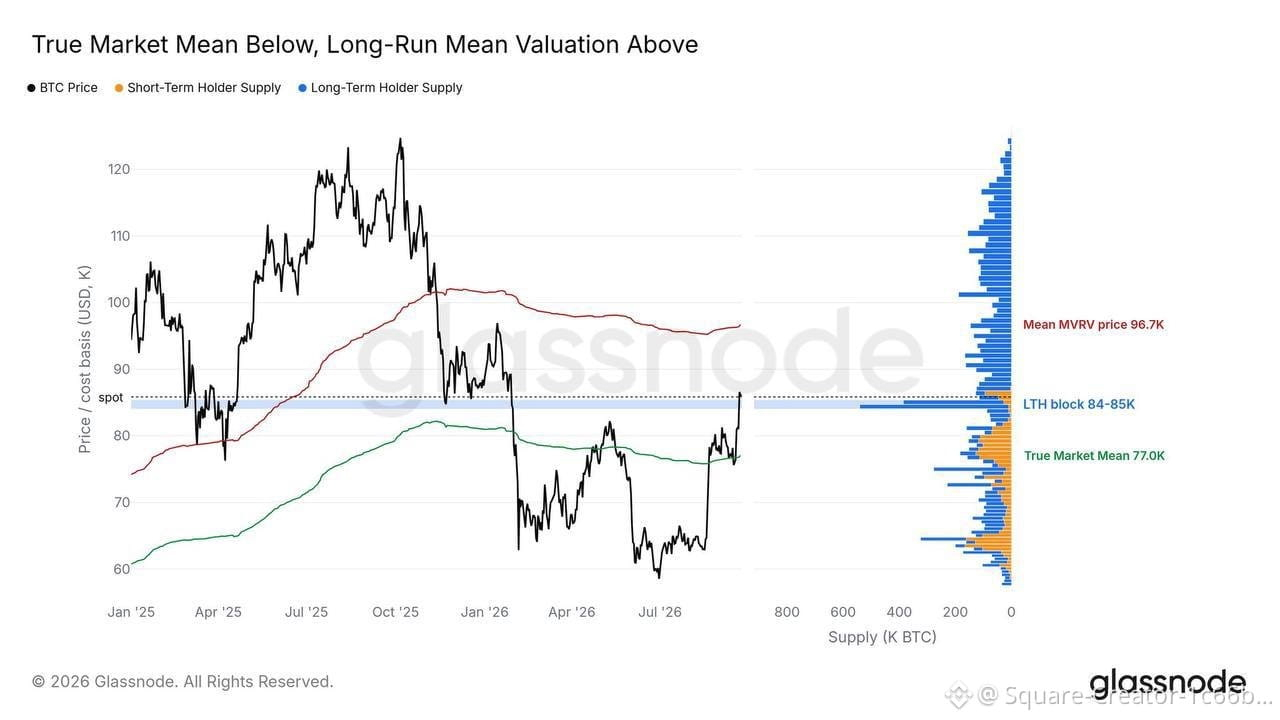
The next key resistance area lies in the average MVRV price at around $96,700.
At the same time, alternative coins are generally showing bullish performance, but traders’ use of leverage remains relatively low; this may reflect a calmer move compared to bullish waves driven by excessive borrowing.
⚠️ Market movement remains tied to ETF fund flows, liquidity, and resistance levels, in addition to news and overall economic conditions.
$BTC
{future}(BTCUSDT)
#BTC #Bitcoin #ETF #MVRV #Altcoins #Crypto #CryptoMarket #Liquidity #Bitcoin #ETF_funds #Alternative_coins #Technical_Analysis #Crypto #Digital_Currency_Trading
📈 Profit-taking operations are still limited, while buying momentum is increasing through ETF funds.
The next key resistance area lies in the average MVRV price at around $96,700.
At the same time, alternative coins are generally showing bullish performance, but traders’ use of leverage remains relatively low; this may reflect a calmer move compared to bullish waves driven by excessive borrowing.
⚠️ Market movement remains tied to ETF fund flows, liquidity, and resistance levels, in addition to news and overall economic conditions.
$BTC
#BTC #Bitcoin #ETF #MVRV #Altcoins #Crypto #CryptoMarket #Liquidity #Bitcoin #ETF_funds #Alternative_coins #Technical_Analysis #Crypto #Digital_Currency_Trading
The next key resistance area lies in the average MVRV price at around $96,700.
At the same time, alternative coins are generally showing bullish performance, but traders’ use of leverage remains relatively low; this may reflect a calmer move compared to bullish waves driven by excessive borrowing.
⚠️ Market movement remains tied to ETF fund flows, liquidity, and resistance levels, in addition to news and overall economic conditions.
$BTC
#BTC #Bitcoin #ETF #MVRV #Altcoins #Crypto #CryptoMarket #Liquidity #Bitcoin #ETF_funds #Alternative_coins #Technical_Analysis #Crypto #Digital_Currency_Trading
48

🚨 $ETH HOLDING $2,438 SUPPORT, MVRV TURNING GREEN! 💎
Entry: 2,438.85 🟢
Target: 2,919.89 🚀
Stop Loss: 1,980 ⚠️
📊 On‑chain data shows exchange‑held ETH down 38% to ~15.5 M, slicing short‑term sell pressure while MVRV flips positive above 1.05, a valuation momentum cue. 📌 The 2,438.85 level, once a stubborn resistance, now acts as a firm support anchor, and a clean break could unlock the 0.5 Fibo zone at 2,919.89. 🌊 Should ETH stay above this pivot, the upside narrative sharpens; a slip below may reopen a deep correction corridor toward 1,980. 💬 What’s your stance on defending this liquidity pocket? 👇
⚠️ Not financial advice. Always manage your risk. 🛡️
🏷️ #ETH #LongSetup #MVRV #Support #Crypto
🔥 💎
🚨 $ETH HOLDING $2,438 SUPPORT, MVRV TURNING GREEN! 💎
Entry: 2,438.85 🟢
Target: 2,919.89 🚀
Stop Loss: 1,980 ⚠️
📊 On‑chain data shows exchange‑held ETH down 38% to ~15.5 M, slicing short‑term sell pressure while MVRV flips positive above 1.05, a valuation momentum cue. 📌 The 2,438.85 level, once a stubborn resistance, now acts as a firm support anchor, and a clean break could unlock the 0.5 Fibo zone at 2,919.89. 🌊 Should ETH stay above this pivot, the upside narrative sharpens; a slip below may reopen a deep correction corridor toward 1,980. 💬 What’s your stance on defending this liquidity pocket? 👇
⚠️ Not financial advice. Always manage your risk. 🛡️
🏷️ #ETH #LongSetup #MVRV #Support #Crypto
🔥 💎
Entry: 2,438.85 🟢
Target: 2,919.89 🚀
Stop Loss: 1,980 ⚠️
📊 On‑chain data shows exchange‑held ETH down 38% to ~15.5 M, slicing short‑term sell pressure while MVRV flips positive above 1.05, a valuation momentum cue. 📌 The 2,438.85 level, once a stubborn resistance, now acts as a firm support anchor, and a clean break could unlock the 0.5 Fibo zone at 2,919.89. 🌊 Should ETH stay above this pivot, the upside narrative sharpens; a slip below may reopen a deep correction corridor toward 1,980. 💬 What’s your stance on defending this liquidity pocket? 👇
⚠️ Not financial advice. Always manage your risk. 🛡️
🏷️ #ETH #LongSetup #MVRV #Support #Crypto
🔥 💎
20
Log in to explore more content
Join global crypto users on Binance Square
⚡️ Get latest and useful information about crypto.
💬 Trusted by the world’s largest crypto exchange.
👍 Discover real insights from verified creators.
Email / Phone number
Trending Topics
1
#SOLSpotETFWeeklyInflow$188M
4 views
11 Discussing
2
#StrategyStriveAdd2305BitcoinThisWeek
19,591 views
662 Discussing
3
#TrumpRejectsIranHormuzReopening
22,771 views
572 Discussing
4
#CircleTetherFreezeBitgetHackerWallet
42,140 views
674 Discussing
5
#SECSaysTokenBuybacksNotAutoSecurities
19,504 views
343 Discussing
6
#ChinaUSAgreeOn$30BTariffCut
867 views
25 Discussing
7
#CoinMarketCapCompletesCoinglassAcquisition
37,292 views
509 Discussing
8
#CircleMints500MUSDCOnSolana
208,331 views
3,066 Discussing
9
#PolymarketBankFailureBetsDrawFDICConcern
179,066 views
2,358 Discussing
10
#BlackRockBuildsTokenizedPortfoliosForOndo
168,599 views
1,701 Discussing