
#intc
intc
241,650 views
1,965 Discussing
Hot
Latest

·
--
🚨 UNCONFIRMED RUMORS SURROUNDING $INTC AND SK HYNIX U.S. PRODUCTION TALKS! 🔍
SK Hynix has addressed circulating reports regarding negotiations with $INTC over U.S. memory chip manufacturing, clarifying that no specific arrangements have been finalized. 📊 Institutional order flow often prices in speculative narratives early, but smart money demands structural confirmation before repositioning.
While the semiconductor titan actively explores global competitiveness strategies, market liquidity remains sensitive to high-tier hardware partnerships. 💡 Tracking structural accumulation across the hardware and AI computing sector remains key as macro catalysts unfold. 💬 How are you positioning around semiconductor macro headlines this quarter? 👇
⚠️ Not financial advice. Always manage your risk. 🛡️
🏷️ #INTC #Semiconductors #Macro #MarketStructure #AI
🎯 🦈
🚨 UNCONFIRMED RUMORS SURROUNDING $INTC AND SK HYNIX U.S. PRODUCTION TALKS! 🔍
SK Hynix has addressed circulating reports regarding negotiations with $INTC over U.S. memory chip manufacturing, clarifying that no specific arrangements have been finalized. 📊 Institutional order flow often prices in speculative narratives early, but smart money demands structural confirmation before repositioning.
While the semiconductor titan actively explores global competitiveness strategies, market liquidity remains sensitive to high-tier hardware partnerships. 💡 Tracking structural accumulation across the hardware and AI computing sector remains key as macro catalysts unfold. 💬 How are you positioning around semiconductor macro headlines this quarter? 👇
⚠️ Not financial advice. Always manage your risk. 🛡️
🏷️ #INTC #Semiconductors #Macro #MarketStructure #AI
🎯 🦈
SK Hynix has addressed circulating reports regarding negotiations with $INTC over U.S. memory chip manufacturing, clarifying that no specific arrangements have been finalized. 📊 Institutional order flow often prices in speculative narratives early, but smart money demands structural confirmation before repositioning.
While the semiconductor titan actively explores global competitiveness strategies, market liquidity remains sensitive to high-tier hardware partnerships. 💡 Tracking structural accumulation across the hardware and AI computing sector remains key as macro catalysts unfold. 💬 How are you positioning around semiconductor macro headlines this quarter? 👇
⚠️ Not financial advice. Always manage your risk. 🛡️
🏷️ #INTC #Semiconductors #Macro #MarketStructure #AI
🎯 🦈
24

·
--
🚨 $INTC PRE-MARKET REJECTION SHIFTS GAINS TO 4.3% AS LIQUIDITY IS SWEPT! 📉
📌 Pre-market order flow on $INTC shows smart money capping upside expansion, narrowing early session gains down to 4.3% as overhead supply gets absorbed. 🌊 This intra-session pullback points to institutional rebalancing into supply zone inefficiencies rather than outright structural weakness.
🔍 Keep a close eye on session open for whether buyers absorb this pull-back or if liquidity hunts deeper into lower fair value gaps. 💬 Is this pre-market retracement a healthy retest before another push, or are sellers reclaiming control? 👇
⚠️ Not financial advice. Always manage your risk. 🛡️
🏷️ #INTC #Intel #MarketStructure #OrderFlow #Equities
🔍 📊
🚨 $INTC PRE-MARKET REJECTION SHIFTS GAINS TO 4.3% AS LIQUIDITY IS SWEPT! 📉
📌 Pre-market order flow on $INTC shows smart money capping upside expansion, narrowing early session gains down to 4.3% as overhead supply gets absorbed. 🌊 This intra-session pullback points to institutional rebalancing into supply zone inefficiencies rather than outright structural weakness.
🔍 Keep a close eye on session open for whether buyers absorb this pull-back or if liquidity hunts deeper into lower fair value gaps. 💬 Is this pre-market retracement a healthy retest before another push, or are sellers reclaiming control? 👇
⚠️ Not financial advice. Always manage your risk. 🛡️
🏷️ #INTC #Intel #MarketStructure #OrderFlow #Equities
🔍 📊
📌 Pre-market order flow on $INTC shows smart money capping upside expansion, narrowing early session gains down to 4.3% as overhead supply gets absorbed. 🌊 This intra-session pullback points to institutional rebalancing into supply zone inefficiencies rather than outright structural weakness.
🔍 Keep a close eye on session open for whether buyers absorb this pull-back or if liquidity hunts deeper into lower fair value gaps. 💬 Is this pre-market retracement a healthy retest before another push, or are sellers reclaiming control? 👇
⚠️ Not financial advice. Always manage your risk. 🛡️
🏷️ #INTC #Intel #MarketStructure #OrderFlow #Equities
🔍 📊
26

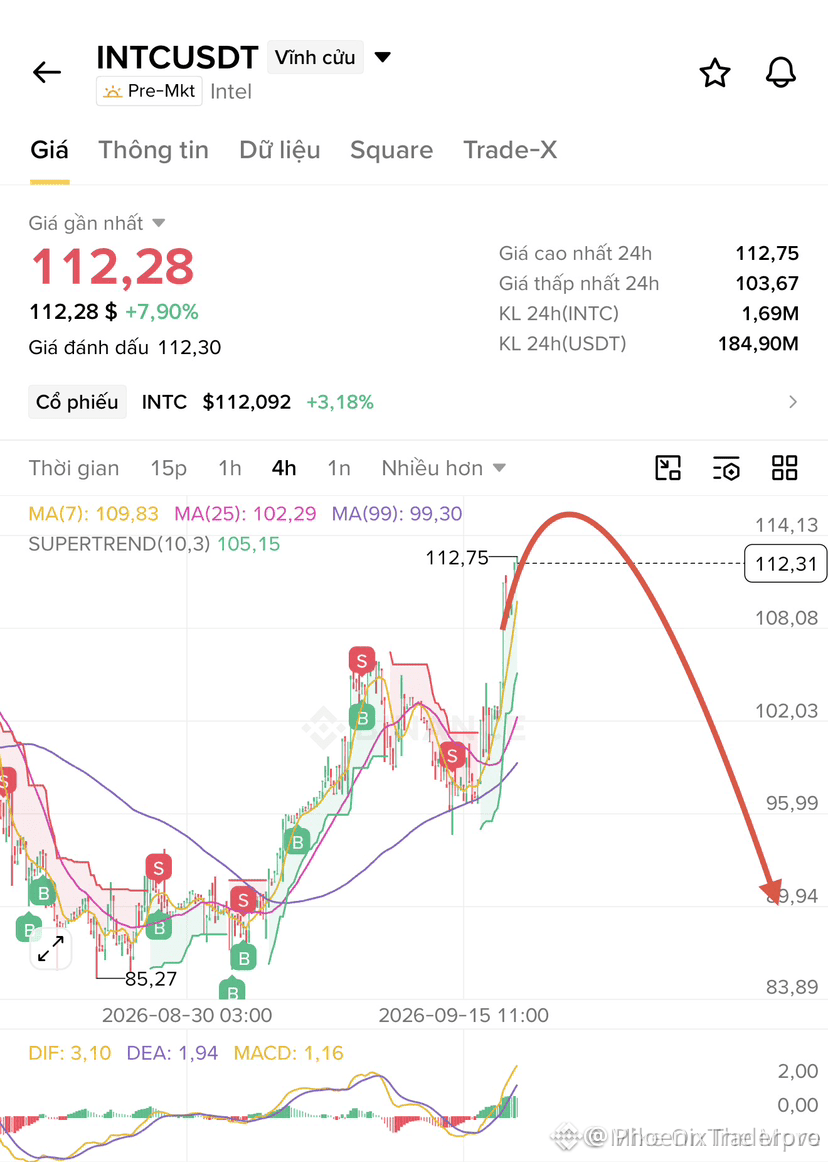
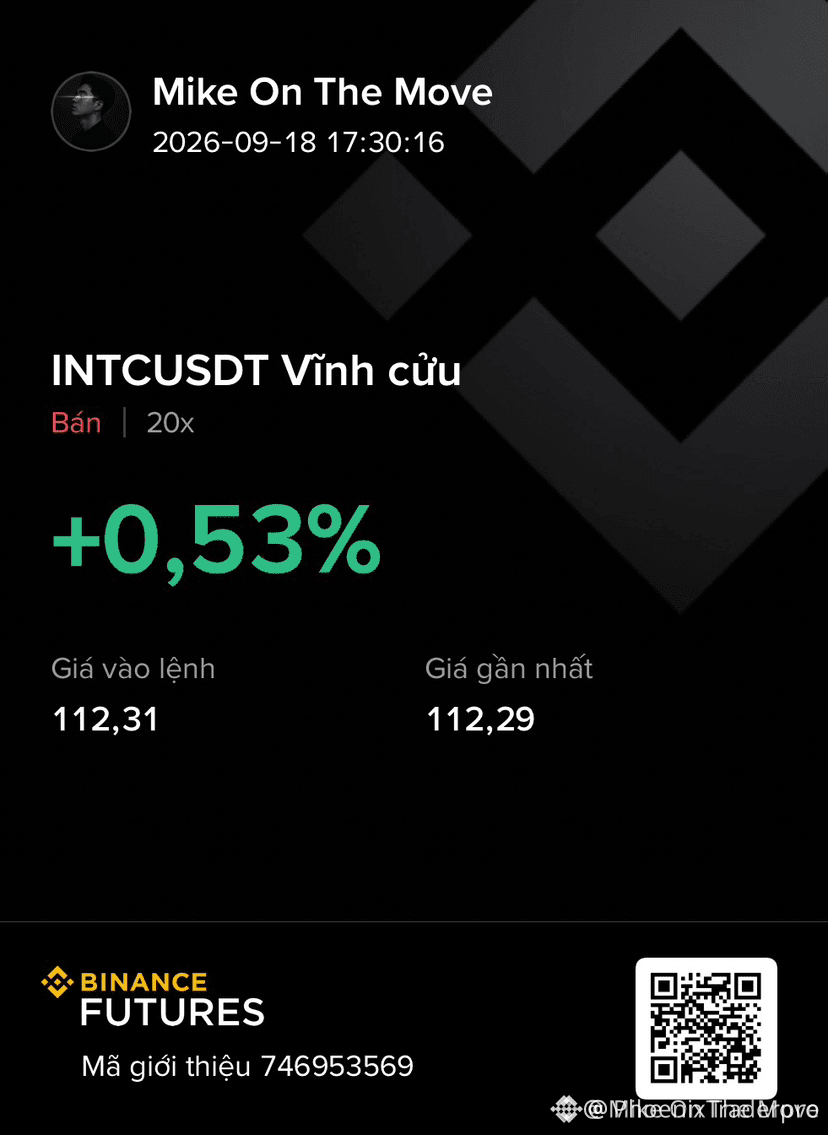
🚨 $INTC STALLING AT RESISTANCE AS SELLERS PREPARE TO UNWIND PRICES LOWER! 📉
Entry: 110.3 - 113.7 🔴
Target: 108.5 - 101.5 🎯
Stop Loss: 122.0 ⚠️
📌 Price is exhausting directly under key overhead resistance, displaying clear signs of heavy supply absorption. 📊 Momentum is shifting downward as buyers fail to sustain higher ground, opening up a clean runway for short positions to capture downside liquidity.
💡 The risk-to-reward on this setup offers strong asymmetric edge as bulls lose structural leverage. 💬 Are you positioning for the short unwinding here or waiting for lower breakdown confirmation? 👇
⚠️ Not financial advice. Always manage your risk. 🛡️
🏷️ #INTC #ShortSetup #Bearish #Trading #TechnicalAnalysis
🎯 🐻
🚨 $INTC STALLING AT RESISTANCE AS SELLERS PREPARE TO UNWIND PRICES LOWER! 📉
Entry: 110.3 - 113.7 🔴
Target: 108.5 - 101.5 🎯
Stop Loss: 122.0 ⚠️
📌 Price is exhausting directly under key overhead resistance, displaying clear signs of heavy supply absorption. 📊 Momentum is shifting downward as buyers fail to sustain higher ground, opening up a clean runway for short positions to capture downside liquidity.
💡 The risk-to-reward on this setup offers strong asymmetric edge as bulls lose structural leverage. 💬 Are you positioning for the short unwinding here or waiting for lower breakdown confirmation? 👇
⚠️ Not financial advice. Always manage your risk. 🛡️
🏷️ #INTC #ShortSetup #Bearish #Trading #TechnicalAnalysis
🎯 🐻
Entry: 110.3 - 113.7 🔴
Target: 108.5 - 101.5 🎯
Stop Loss: 122.0 ⚠️
📌 Price is exhausting directly under key overhead resistance, displaying clear signs of heavy supply absorption. 📊 Momentum is shifting downward as buyers fail to sustain higher ground, opening up a clean runway for short positions to capture downside liquidity.
💡 The risk-to-reward on this setup offers strong asymmetric edge as bulls lose structural leverage. 💬 Are you positioning for the short unwinding here or waiting for lower breakdown confirmation? 👇
⚠️ Not financial advice. Always manage your risk. 🛡️
🏷️ #INTC #ShortSetup #Bearish #Trading #TechnicalAnalysis
🎯 🐻
96
·
--
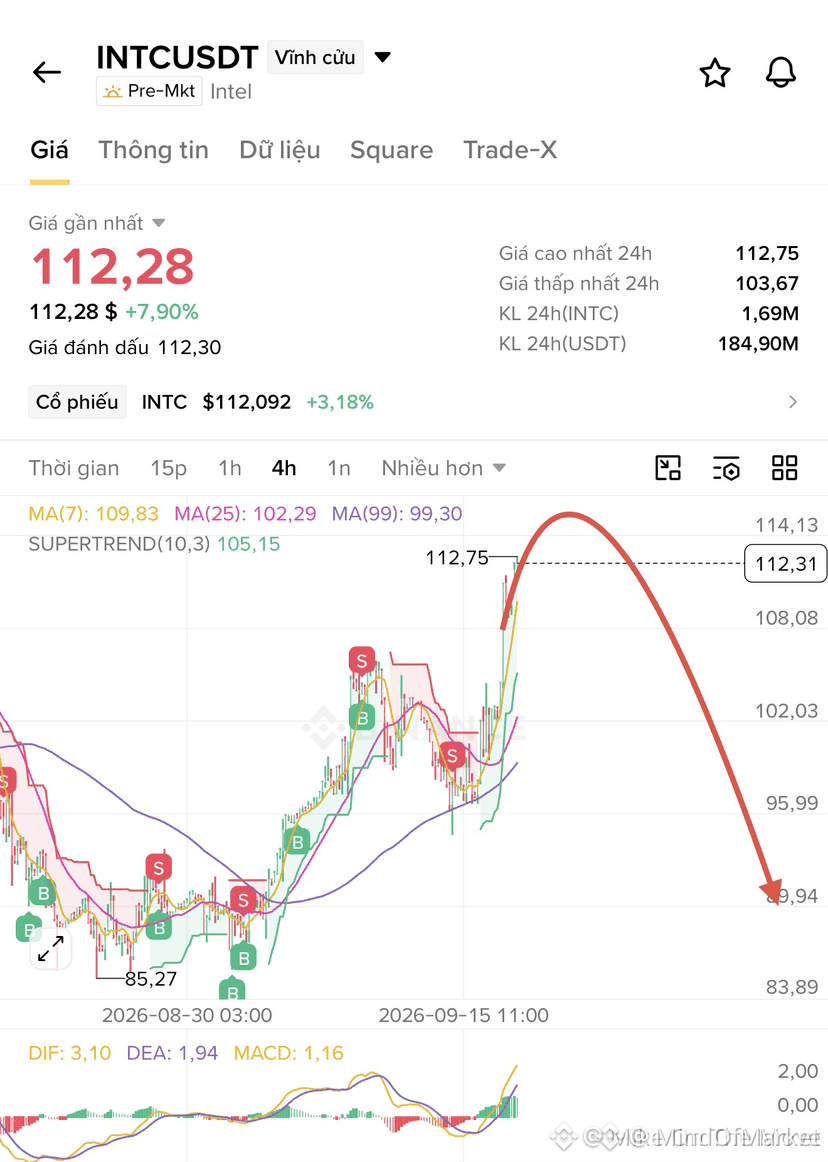
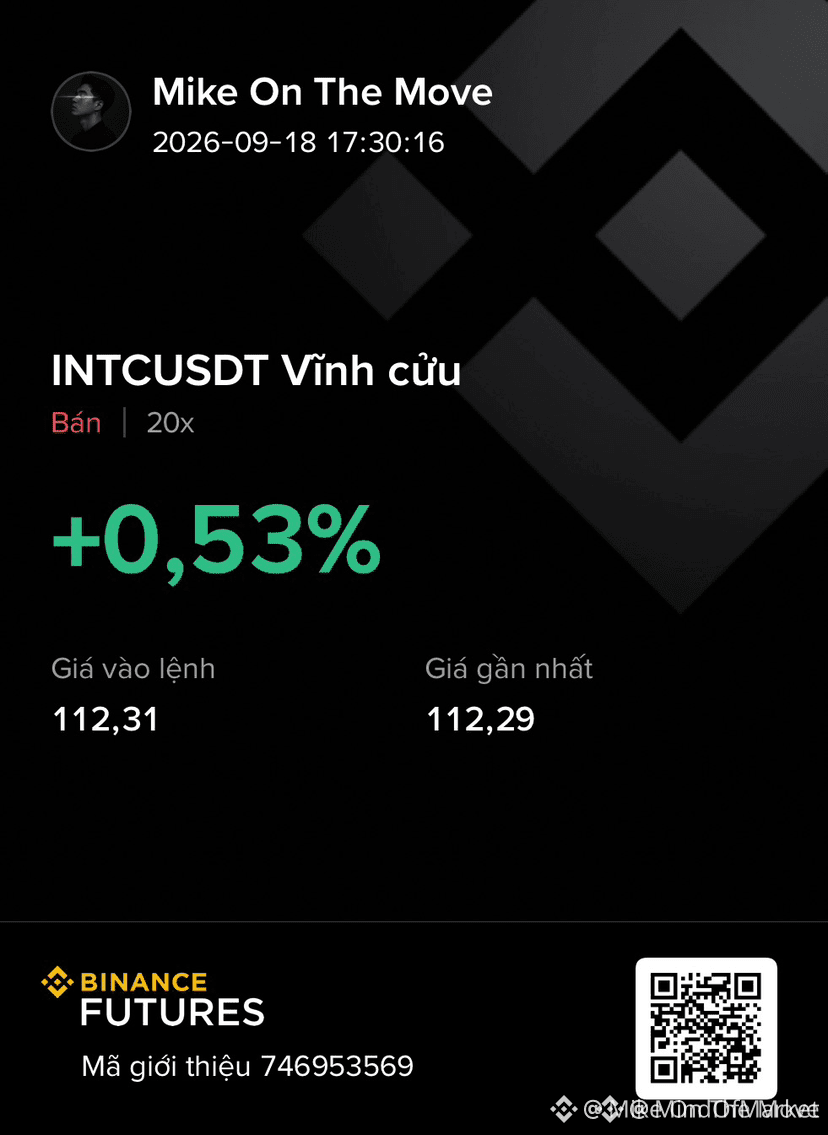
🚨 $INTC LOSING KEY STRUCTURAL RESISTANCE AS BEARISH ORDER FLOW TAKES CONTROL 📉
Entry: 110.3 - 113.7 ⚡
Target: 101.5 🎯
Stop Loss: 122.0 ⚠️
🔍 Price action into the supply zone reveals classic distribution as smart money rejects overhead resistance. 📉 The loss of buying momentum signals an institutional liquidity hunt below, opening a clear path toward lower inefficiency fills.
📌 With sell-side liquidity resting uncollected down to 101.5, this premium-array short setup offers clean risk-managed parameters for disciplined traders. 💬 Are you positioning short on this structural unwinding or waiting for lower confirmation? 👇
⚠️ Not financial advice. Always manage your risk. 🛡️
🏷️ #INTC #ShortSetup #Trading #MarketStructure
🐻 📉
🚨 $INTC LOSING KEY STRUCTURAL RESISTANCE AS BEARISH ORDER FLOW TAKES CONTROL 📉
Entry: 110.3 - 113.7 ⚡
Target: 101.5 🎯
Stop Loss: 122.0 ⚠️
🔍 Price action into the supply zone reveals classic distribution as smart money rejects overhead resistance. 📉 The loss of buying momentum signals an institutional liquidity hunt below, opening a clear path toward lower inefficiency fills.
📌 With sell-side liquidity resting uncollected down to 101.5, this premium-array short setup offers clean risk-managed parameters for disciplined traders. 💬 Are you positioning short on this structural unwinding or waiting for lower confirmation? 👇
⚠️ Not financial advice. Always manage your risk. 🛡️
🏷️ #INTC #ShortSetup #Trading #MarketStructure
🐻 📉
Entry: 110.3 - 113.7 ⚡
Target: 101.5 🎯
Stop Loss: 122.0 ⚠️
🔍 Price action into the supply zone reveals classic distribution as smart money rejects overhead resistance. 📉 The loss of buying momentum signals an institutional liquidity hunt below, opening a clear path toward lower inefficiency fills.
📌 With sell-side liquidity resting uncollected down to 101.5, this premium-array short setup offers clean risk-managed parameters for disciplined traders. 💬 Are you positioning short on this structural unwinding or waiting for lower confirmation? 👇
⚠️ Not financial advice. Always manage your risk. 🛡️
🏷️ #INTC #ShortSetup #Trading #MarketStructure
🐻 📉
80
·
--
🚨 $INTC BREAKS OUT 12% AS INSTITUTIONAL LIQUIDITY TARGETS OHIO FOUNDRY EXPANSION ⚡
Entry: 111 ⚡
Target: 165 🚀
Smart money accumulation is visible across $INTC after reports surfaced of a strategic memory manufacturing alliance with SK Hynix in Ohio. 📊 The asset reclaimed the $111 zone following consecutive momentum surges, signaling heavy institutional appetite for external foundry capacity.
While operational losses narrowed to $2.1B in Q2, analysts are repricing structural upside toward $165 as high-bandwidth memory partnerships mature. 🔍 Regulatory checks and delayed buildout timelines remain macro variables, but order flow indicates a major structural transition. 💬 Are you bidding this breakout early, or waiting for a retest of demand? 👇
⚠️ Not financial advice. Always manage your risk. 🛡️
🏷️ #INTC #Intel #Semiconductors #MarketStructure #Breakout
🎯 🦈
🚨 $INTC BREAKS OUT 12% AS INSTITUTIONAL LIQUIDITY TARGETS OHIO FOUNDRY EXPANSION ⚡
Entry: 111 ⚡
Target: 165 🚀
Smart money accumulation is visible across $INTC after reports surfaced of a strategic memory manufacturing alliance with SK Hynix in Ohio. 📊 The asset reclaimed the $111 zone following consecutive momentum surges, signaling heavy institutional appetite for external foundry capacity.
While operational losses narrowed to $2.1B in Q2, analysts are repricing structural upside toward $165 as high-bandwidth memory partnerships mature. 🔍 Regulatory checks and delayed buildout timelines remain macro variables, but order flow indicates a major structural transition. 💬 Are you bidding this breakout early, or waiting for a retest of demand? 👇
⚠️ Not financial advice. Always manage your risk. 🛡️
🏷️ #INTC #Intel #Semiconductors #MarketStructure #Breakout
🎯 🦈
Entry: 111 ⚡
Target: 165 🚀
Smart money accumulation is visible across $INTC after reports surfaced of a strategic memory manufacturing alliance with SK Hynix in Ohio. 📊 The asset reclaimed the $111 zone following consecutive momentum surges, signaling heavy institutional appetite for external foundry capacity.
While operational losses narrowed to $2.1B in Q2, analysts are repricing structural upside toward $165 as high-bandwidth memory partnerships mature. 🔍 Regulatory checks and delayed buildout timelines remain macro variables, but order flow indicates a major structural transition. 💬 Are you bidding this breakout early, or waiting for a retest of demand? 👇
⚠️ Not financial advice. Always manage your risk. 🛡️
🏷️ #INTC #Intel #Semiconductors #MarketStructure #Breakout
🎯 🦈
18
🦈 $INTC SURGES 8% AS SMART MONEY EYES OHIO AI CHIP ALLIANCE! ⚡
Entry: 111 ⚡
Target: 145 🚀
Institutional bids are aggressive as $INTC rips near 111 following reports of potential Ohio facility joint ventures with SK Hynix for next-gen AI memory. 📊 Smart money is positioning early ahead of foundry turnaround catalysts, with Wall Street targets pointing toward 145 and 165.
📌 Despite regulatory scrutiny and revised plant timelines, aggressive buyers are absorbing supply following the bounce off 97.19 support. 💡 Foundry losses are narrowing significantly, signaling that structural momentum may be shifting fast. 💬 Are you bidding this breakout toward major targets or waiting for a retest? 👇
⚠️ Not financial advice. Always manage your risk. 🛡️
🏷️ #INTC #Semiconductors #Breakout #Tech #Momentum
🔥 💎
🦈 $INTC SURGES 8% AS SMART MONEY EYES OHIO AI CHIP ALLIANCE! ⚡
Entry: 111 ⚡
Target: 145 🚀
Institutional bids are aggressive as $INTC rips near 111 following reports of potential Ohio facility joint ventures with SK Hynix for next-gen AI memory. 📊 Smart money is positioning early ahead of foundry turnaround catalysts, with Wall Street targets pointing toward 145 and 165.
📌 Despite regulatory scrutiny and revised plant timelines, aggressive buyers are absorbing supply following the bounce off 97.19 support. 💡 Foundry losses are narrowing significantly, signaling that structural momentum may be shifting fast. 💬 Are you bidding this breakout toward major targets or waiting for a retest? 👇
⚠️ Not financial advice. Always manage your risk. 🛡️
🏷️ #INTC #Semiconductors #Breakout #Tech #Momentum
🔥 💎
Entry: 111 ⚡
Target: 145 🚀
Institutional bids are aggressive as $INTC rips near 111 following reports of potential Ohio facility joint ventures with SK Hynix for next-gen AI memory. 📊 Smart money is positioning early ahead of foundry turnaround catalysts, with Wall Street targets pointing toward 145 and 165.
📌 Despite regulatory scrutiny and revised plant timelines, aggressive buyers are absorbing supply following the bounce off 97.19 support. 💡 Foundry losses are narrowing significantly, signaling that structural momentum may be shifting fast. 💬 Are you bidding this breakout toward major targets or waiting for a retest? 👇
⚠️ Not financial advice. Always manage your risk. 🛡️
🏷️ #INTC #Semiconductors #Breakout #Tech #Momentum
🔥 💎
30

·
--
Market conditions are shifting rapidly and $INTC has just triggered a technical window that aligns perfectly with my short-side criteria. I have isolated the specific levels to monitor for this move.
⚡ $INTC — SHORT SETUP
📍 Entry: 111.64 – 112.31
🎯 TP1: 110.31
🎯 TP2: 109.42
🎯 TP3: 108.09
🛑 Stop Loss: 112.98
Trade here 👇
📌 Trade management rules: see pinned post.
How are you positioning yourself for this move? Drop your thoughts below and follow for real-time updates on my trade setups.
#WriteToEarn #INTC #CryptoTrading #BinanceSquare #Crypto
Market conditions are shifting rapidly and $INTC has just triggered a technical window that aligns perfectly with my short-side criteria. I have isolated the specific levels to monitor for this move.
⚡ $INTC — SHORT SETUP
📍 Entry: 111.64 – 112.31
🎯 TP1: 110.31
🎯 TP2: 109.42
🎯 TP3: 108.09
🛑 Stop Loss: 112.98
Trade here 👇
📌 Trade management rules: see pinned post.
How are you positioning yourself for this move? Drop your thoughts below and follow for real-time updates on my trade setups.
#WriteToEarn #INTC #CryptoTrading #BinanceSquare #Crypto
⚡ $INTC — SHORT SETUP
📍 Entry: 111.64 – 112.31
🎯 TP1: 110.31
🎯 TP2: 109.42
🎯 TP3: 108.09
🛑 Stop Loss: 112.98
Trade here 👇
📌 Trade management rules: see pinned post.
How are you positioning yourself for this move? Drop your thoughts below and follow for real-time updates on my trade setups.
#WriteToEarn #INTC #CryptoTrading #BinanceSquare #Crypto
1
58


·
--
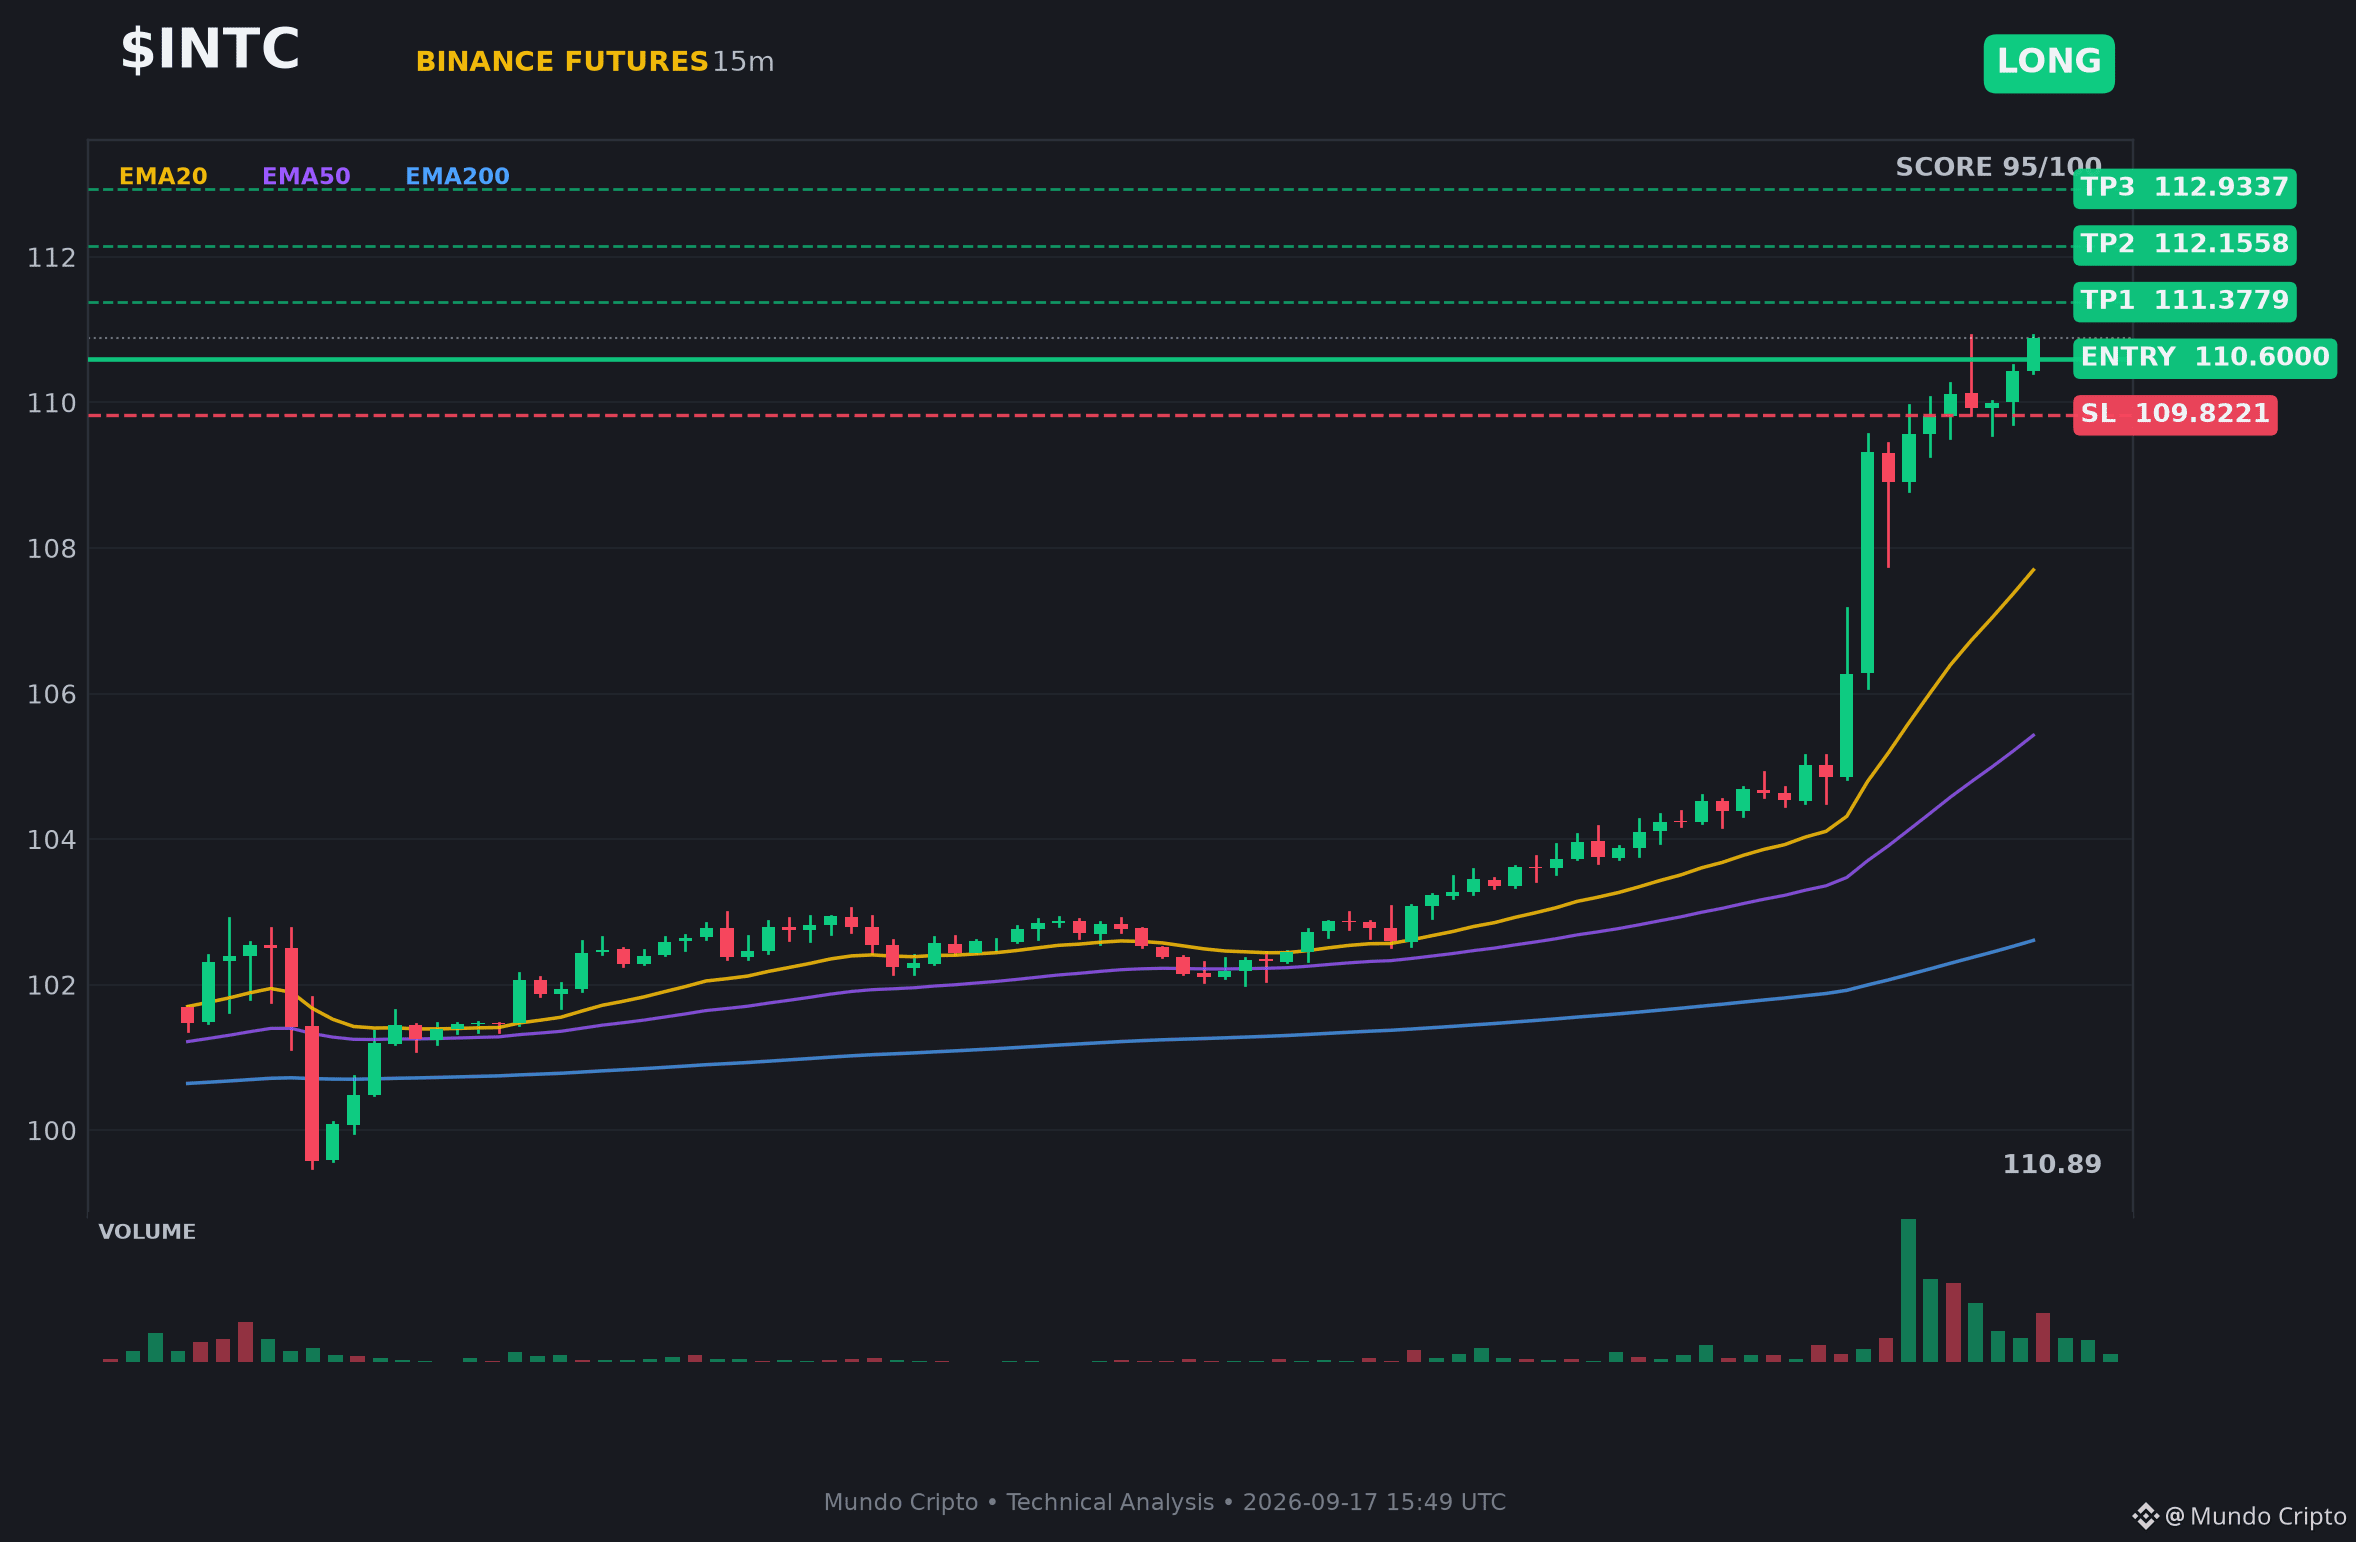
📈 $INTC | LONG SETUP
Strong demand zone confirmed. Buyers absorbing the selling pressure.
Entry: $110.32 - $110.88
TP: $111.38 - $112.16 - $112.93 - $113.71 - $114.88 - $116.82
SL: $109.82
#INTC #MundoCripto #Crypto #Trading
📈 $INTC | LONG SETUP
Strong demand zone confirmed. Buyers absorbing the selling pressure.
Entry: $110.32 - $110.88
TP: $111.38 - $112.16 - $112.93 - $113.71 - $114.88 - $116.82
SL: $109.82
#INTC #MundoCripto #Crypto #Trading
Strong demand zone confirmed. Buyers absorbing the selling pressure.
Entry: $110.32 - $110.88
TP: $111.38 - $112.16 - $112.93 - $113.71 - $114.88 - $116.82
SL: $109.82
#INTC #MundoCripto #Crypto #Trading
322
·
--
Downside targets are active for $INTC with a clear risk-defined entry.
⚡ $INTC — SHORT SETUP
📍 Entry: 104.88 – 105.5
🎯 TP1: 103.62
🎯 TP2: 102.79
🎯 TP3: 101.54
🛑 Stop Loss: 106.13
Trade here 👇
📌 Trade management rules: see pinned post.
What's your take on $INTC at these levels? Drop your thoughts below and follow for more daily trade setups!
#WriteToEarn #INTC #CryptoTrading #BinanceSquare #Crypto
Downside targets are active for $INTC with a clear risk-defined entry.
⚡ $INTC — SHORT SETUP
📍 Entry: 104.88 – 105.5
🎯 TP1: 103.62
🎯 TP2: 102.79
🎯 TP3: 101.54
🛑 Stop Loss: 106.13
Trade here 👇
📌 Trade management rules: see pinned post.
What's your take on $INTC at these levels? Drop your thoughts below and follow for more daily trade setups!
#WriteToEarn #INTC #CryptoTrading #BinanceSquare #Crypto
⚡ $INTC — SHORT SETUP
📍 Entry: 104.88 – 105.5
🎯 TP1: 103.62
🎯 TP2: 102.79
🎯 TP3: 101.54
🛑 Stop Loss: 106.13
Trade here 👇
📌 Trade management rules: see pinned post.
What's your take on $INTC at these levels? Drop your thoughts below and follow for more daily trade setups!
#WriteToEarn #INTC #CryptoTrading #BinanceSquare #Crypto
1
64

🚨 $19M WHALE LOADS HEAVY $INTC LONG WITH PRE-SET EXIT ORDERS! 🦈
Entry: 102.29 🟢
Target: 110.00 - 112.00 🎯
📊 Institutional smart money just executed a massive $19M long position on $INTC at an average entry of $102.29. Rather than holding blindly, this whale has already mapped out a methodical exit strategy across the board.
📌 A ladder of 100 reduce-only sell orders is stacked between $110 and $112, aiming for a clean 7.5% to 9.4% profit expansion. 🔍 With smart money locking in precise targets before price even moves, are you front-running this liquidity or waiting on the sidelines? 👇
⚠️ Not financial advice. Always manage your risk. 🛡️
🏷️ #INTC #WhaleAlert #LongSetup #SmartMoney #Crypto
🔥 💎
🚨 $19M WHALE LOADS HEAVY $INTC LONG WITH PRE-SET EXIT ORDERS! 🦈
Entry: 102.29 🟢
Target: 110.00 - 112.00 🎯
📊 Institutional smart money just executed a massive $19M long position on $INTC at an average entry of $102.29. Rather than holding blindly, this whale has already mapped out a methodical exit strategy across the board.
📌 A ladder of 100 reduce-only sell orders is stacked between $110 and $112, aiming for a clean 7.5% to 9.4% profit expansion. 🔍 With smart money locking in precise targets before price even moves, are you front-running this liquidity or waiting on the sidelines? 👇
⚠️ Not financial advice. Always manage your risk. 🛡️
🏷️ #INTC #WhaleAlert #LongSetup #SmartMoney #Crypto
🔥 💎
Entry: 102.29 🟢
Target: 110.00 - 112.00 🎯
📊 Institutional smart money just executed a massive $19M long position on $INTC at an average entry of $102.29. Rather than holding blindly, this whale has already mapped out a methodical exit strategy across the board.
📌 A ladder of 100 reduce-only sell orders is stacked between $110 and $112, aiming for a clean 7.5% to 9.4% profit expansion. 🔍 With smart money locking in precise targets before price even moves, are you front-running this liquidity or waiting on the sidelines? 👇
⚠️ Not financial advice. Always manage your risk. 🛡️
🏷️ #INTC #WhaleAlert #LongSetup #SmartMoney #Crypto
🔥 💎
21

🚨 INSTITUTIONAL WHALE DEPLOYS $18.9M LONG POSITION ON $INTC WITH DEDICATED TARGETS! 🦈
Entry: 102.29 ⚡
Target: 110.00 - 112.00 🚀
Smart money flow just printed a significant footprint on $INTC . A prominent institutional wallet accumulated a $18.95M long position at an average entry of $102.29, displaying clear conviction in local demand absorption. 🦈
Rather than relying on market order execution during volatile expansion, 100 reduce-only limit sell orders have already been stacked across the $110 to $112 liquidity cluster. 📊 This systematic distribution strategy aims to capture a 7.5% to 9.4% move, absorbing resting bids before momentum fades. 💡
With smart capital fully allocated into this single market structure, institutional bias leans heavily toward an upside liquidity hunt. 💬 Do you align your bids with institutional order blocks or wait for lower timeframe confirmation? 👇
⚠️ Not financial advice. Always manage your risk. 🛡️
🏷️ #INTC #SmartMoney #OrderFlow #Trading #Crypto
🦈 🏦
🚨 INSTITUTIONAL WHALE DEPLOYS $18.9M LONG POSITION ON $INTC WITH DEDICATED TARGETS! 🦈
Entry: 102.29 ⚡
Target: 110.00 - 112.00 🚀
Smart money flow just printed a significant footprint on $INTC . A prominent institutional wallet accumulated a $18.95M long position at an average entry of $102.29, displaying clear conviction in local demand absorption. 🦈
Rather than relying on market order execution during volatile expansion, 100 reduce-only limit sell orders have already been stacked across the $110 to $112 liquidity cluster. 📊 This systematic distribution strategy aims to capture a 7.5% to 9.4% move, absorbing resting bids before momentum fades. 💡
With smart capital fully allocated into this single market structure, institutional bias leans heavily toward an upside liquidity hunt. 💬 Do you align your bids with institutional order blocks or wait for lower timeframe confirmation? 👇
⚠️ Not financial advice. Always manage your risk. 🛡️
🏷️ #INTC #SmartMoney #OrderFlow #Trading #Crypto
🦈 🏦
Entry: 102.29 ⚡
Target: 110.00 - 112.00 🚀
Smart money flow just printed a significant footprint on $INTC . A prominent institutional wallet accumulated a $18.95M long position at an average entry of $102.29, displaying clear conviction in local demand absorption. 🦈
Rather than relying on market order execution during volatile expansion, 100 reduce-only limit sell orders have already been stacked across the $110 to $112 liquidity cluster. 📊 This systematic distribution strategy aims to capture a 7.5% to 9.4% move, absorbing resting bids before momentum fades. 💡
With smart capital fully allocated into this single market structure, institutional bias leans heavily toward an upside liquidity hunt. 💬 Do you align your bids with institutional order blocks or wait for lower timeframe confirmation? 👇
⚠️ Not financial advice. Always manage your risk. 🛡️
🏷️ #INTC #SmartMoney #OrderFlow #Trading #Crypto
🦈 🏦
17

·
--
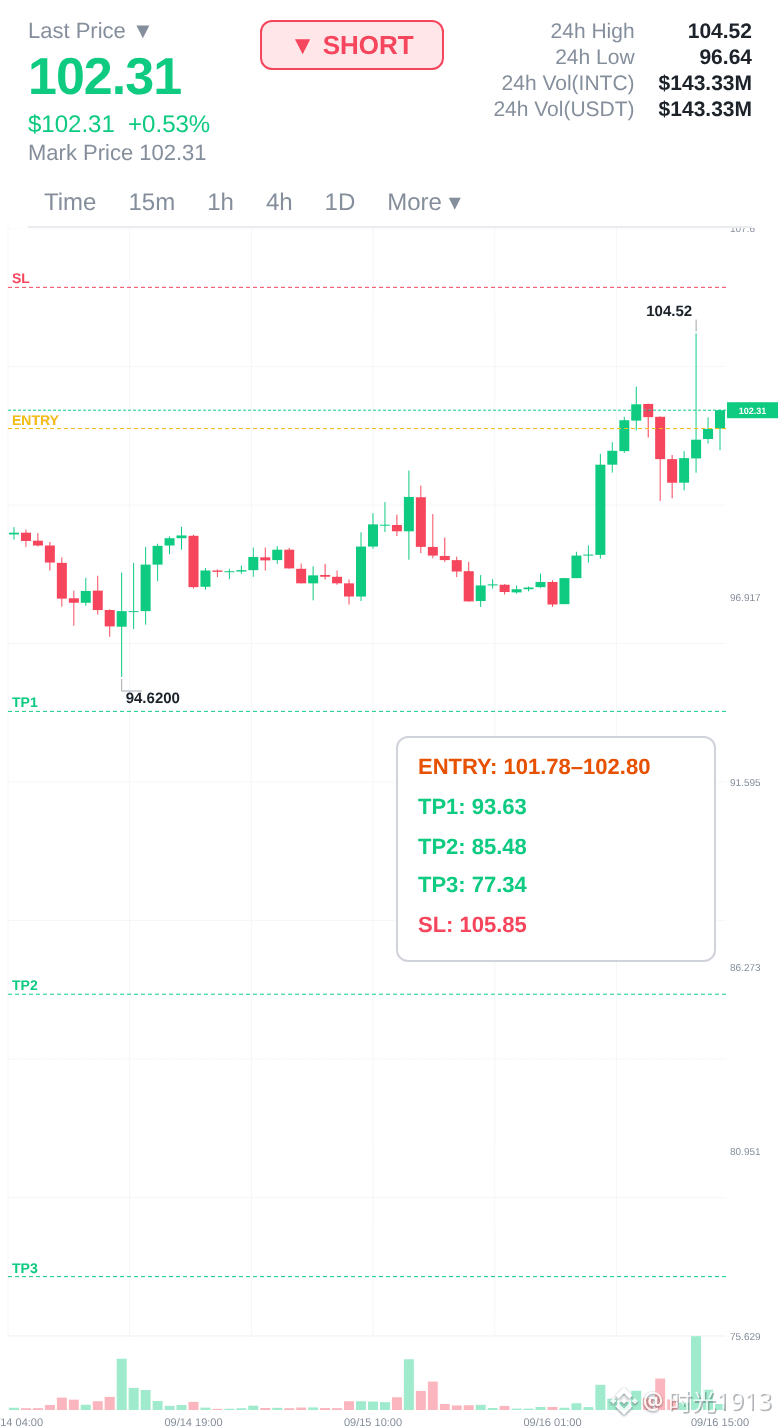
INTC is in a continuation pattern — I'm holding
I'm going to let the market do its thing here. No need to force it.
CONTINUATION — 📉 SHORT
📉 Trade Plan:
📉 Entry: 101.78 – 102.80
🛑 Stop: 105.85
🎯 TP1: 93.63
🎯 TP2: 85.48
🎯 TP3: 77.34
📊 Confidence: 78%
Risk/reward on shorts is exceptional at current levels.
The technical damage cannot be ignored.
Bounce Is Real 👉 $INTC 👈 Catch It
#INTC $SOL $BTC
INTC is in a continuation pattern — I'm holding
I'm going to let the market do its thing here. No need to force it.
CONTINUATION — 📉 SHORT
📉 Trade Plan:
📉 Entry: 101.78 – 102.80
🛑 Stop: 105.85
🎯 TP1: 93.63
🎯 TP2: 85.48
🎯 TP3: 77.34
📊 Confidence: 78%
Risk/reward on shorts is exceptional at current levels.
The technical damage cannot be ignored.
Bounce Is Real 👉 $INTC 👈 Catch It
#INTC $SOL $BTC
I'm going to let the market do its thing here. No need to force it.
CONTINUATION — 📉 SHORT
📉 Trade Plan:
📉 Entry: 101.78 – 102.80
🛑 Stop: 105.85
🎯 TP1: 93.63
🎯 TP2: 85.48
🎯 TP3: 77.34
📊 Confidence: 78%
Risk/reward on shorts is exceptional at current levels.
The technical damage cannot be ignored.
Bounce Is Real 👉 $INTC 👈 Catch It
#INTC $SOL $BTC
218

·
--
$INTC
{future}(INTCUSDT)
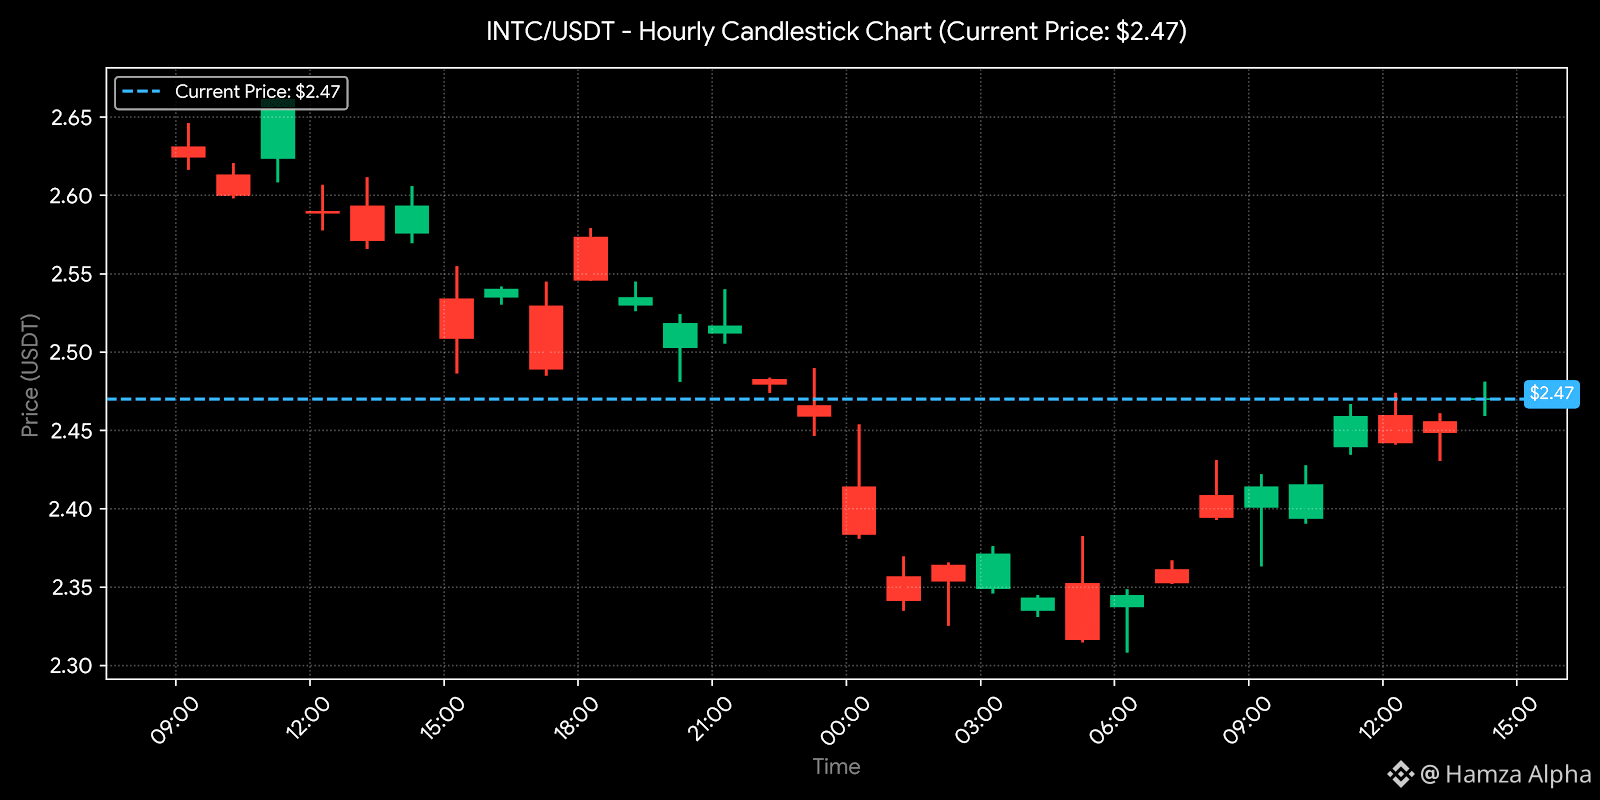
Intel (INTC/USDT) — Market Analysis 📊
INTC/USDT is being watched closely as semiconductor and AI-related market sentiment continues to influence price action. Traders should focus on momentum, volume, and key technical levels.
📈 Bullish Setup: A sustained breakout above nearby resistance with increasing volume could strengthen buying momentum.
📉 Bearish Risk: Rejection at resistance or a breakdown below support could bring additional selling pressure.
🔎 Key Signals: Monitor volume, RSI, moving averages, support/resistance, and higher-high/lower-low formations.
⚡ Trading Focus: Strong volume confirmation is important when assessing whether a breakout has genuine momentum.
#INTC #INTCUSDT #Stocks #BinanceSquare
$INTC
Intel (INTC/USDT) — Market Analysis 📊
INTC/USDT is being watched closely as semiconductor and AI-related market sentiment continues to influence price action. Traders should focus on momentum, volume, and key technical levels.
📈 Bullish Setup: A sustained breakout above nearby resistance with increasing volume could strengthen buying momentum.
📉 Bearish Risk: Rejection at resistance or a breakdown below support could bring additional selling pressure.
🔎 Key Signals: Monitor volume, RSI, moving averages, support/resistance, and higher-high/lower-low formations.
⚡ Trading Focus: Strong volume confirmation is important when assessing whether a breakout has genuine momentum.
#INTC #INTCUSDT #Stocks #BinanceSquare
Intel (INTC/USDT) — Market Analysis 📊
INTC/USDT is being watched closely as semiconductor and AI-related market sentiment continues to influence price action. Traders should focus on momentum, volume, and key technical levels.
📈 Bullish Setup: A sustained breakout above nearby resistance with increasing volume could strengthen buying momentum.
📉 Bearish Risk: Rejection at resistance or a breakdown below support could bring additional selling pressure.
🔎 Key Signals: Monitor volume, RSI, moving averages, support/resistance, and higher-high/lower-low formations.
⚡ Trading Focus: Strong volume confirmation is important when assessing whether a breakout has genuine momentum.
#INTC #INTCUSDT #Stocks #BinanceSquare
67

·
--
Bearish
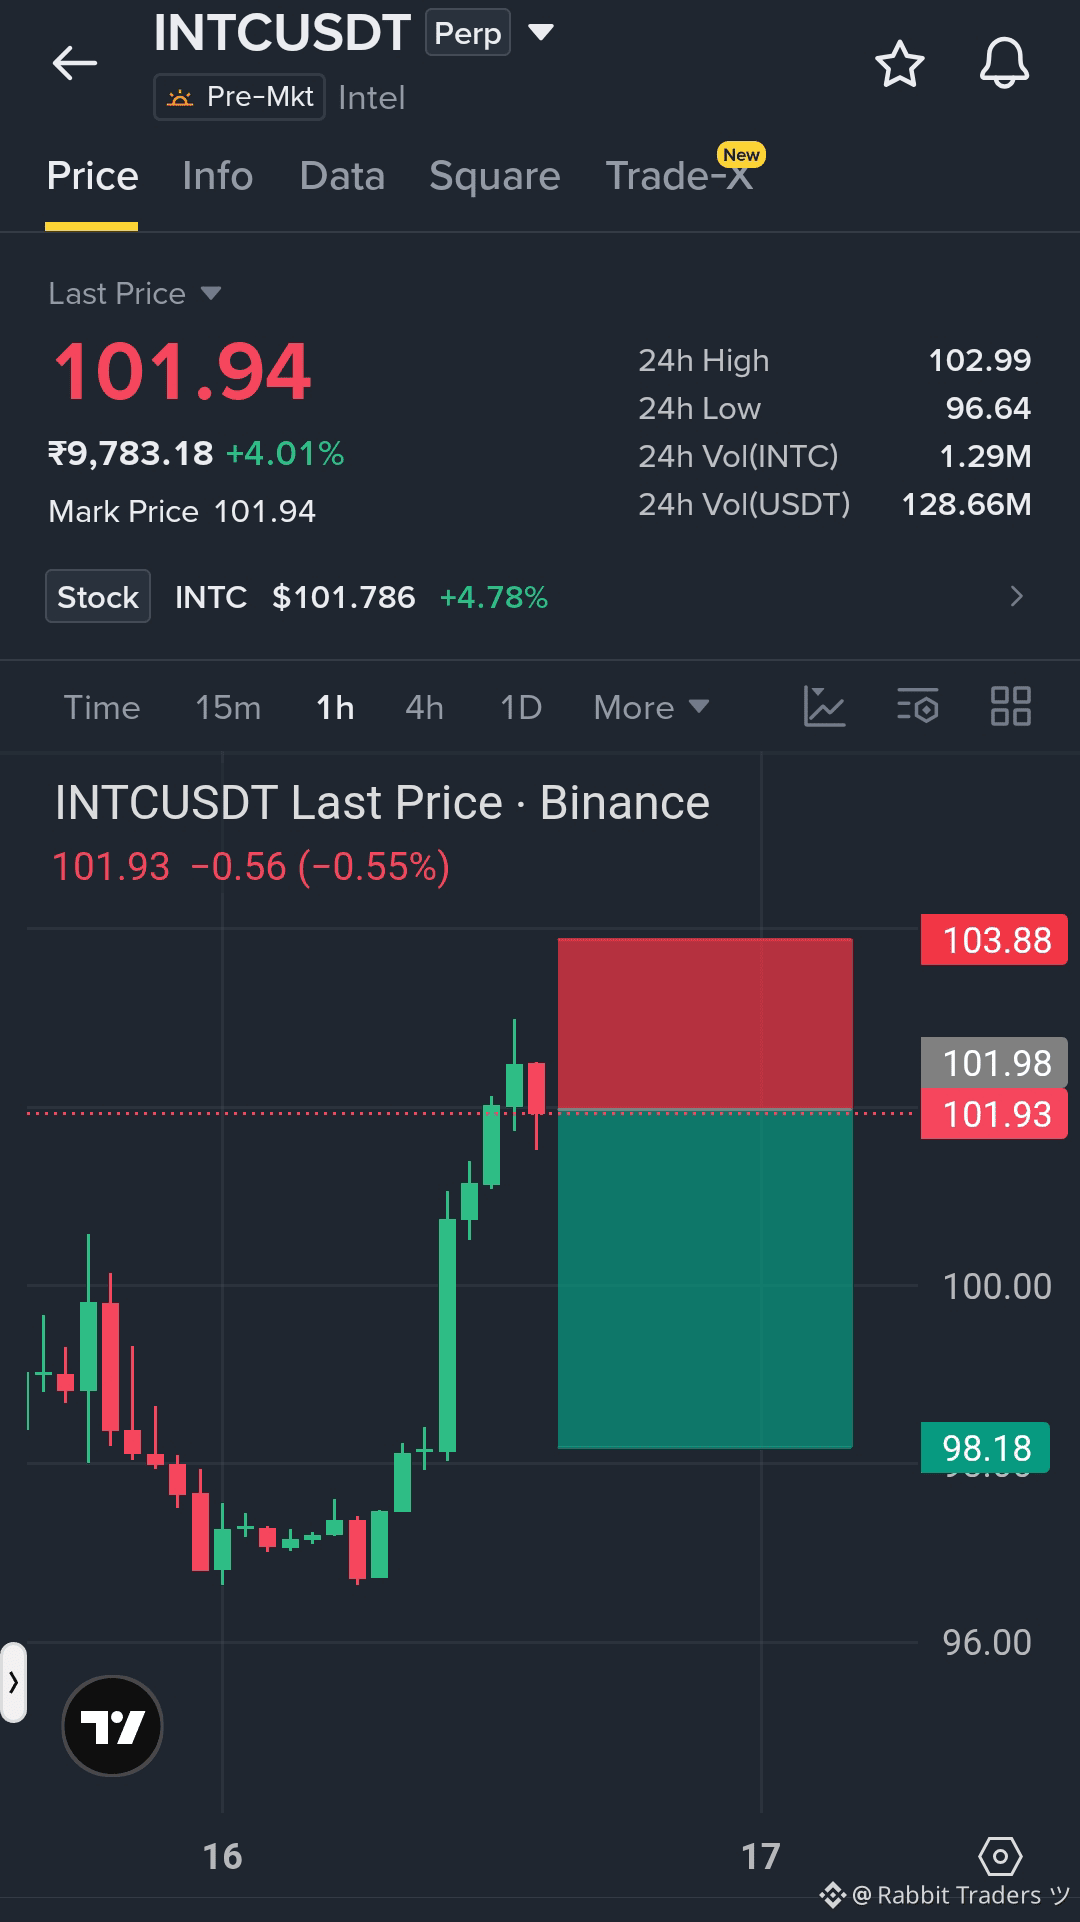
#INTC SHORT ALERT 🤯 I am doing Short here👇
Don’t let this rejection fool you..... I’m watching the downside from here. Short right nowwww 🔥
Entry: 101.98
Stop-loss: 103.88
TP1: 100.71
TP2: 99.45
TP3: 98.18
Click here to trade 👇⬇️⬇️ Short with meeee...👇⬇️ $INTC
{future}(INTCUSDT)
#INTC SHORT ALERT 🤯 I am doing Short here👇
Don’t let this rejection fool you..... I’m watching the downside from here. Short right nowwww 🔥
Entry: 101.98
Stop-loss: 103.88
TP1: 100.71
TP2: 99.45
TP3: 98.18
Click here to trade 👇⬇️⬇️ Short with meeee...👇⬇️ $INTC
Don’t let this rejection fool you..... I’m watching the downside from here. Short right nowwww 🔥
Entry: 101.98
Stop-loss: 103.88
TP1: 100.71
TP2: 99.45
TP3: 98.18
Click here to trade 👇⬇️⬇️ Short with meeee...👇⬇️ $INTC
204

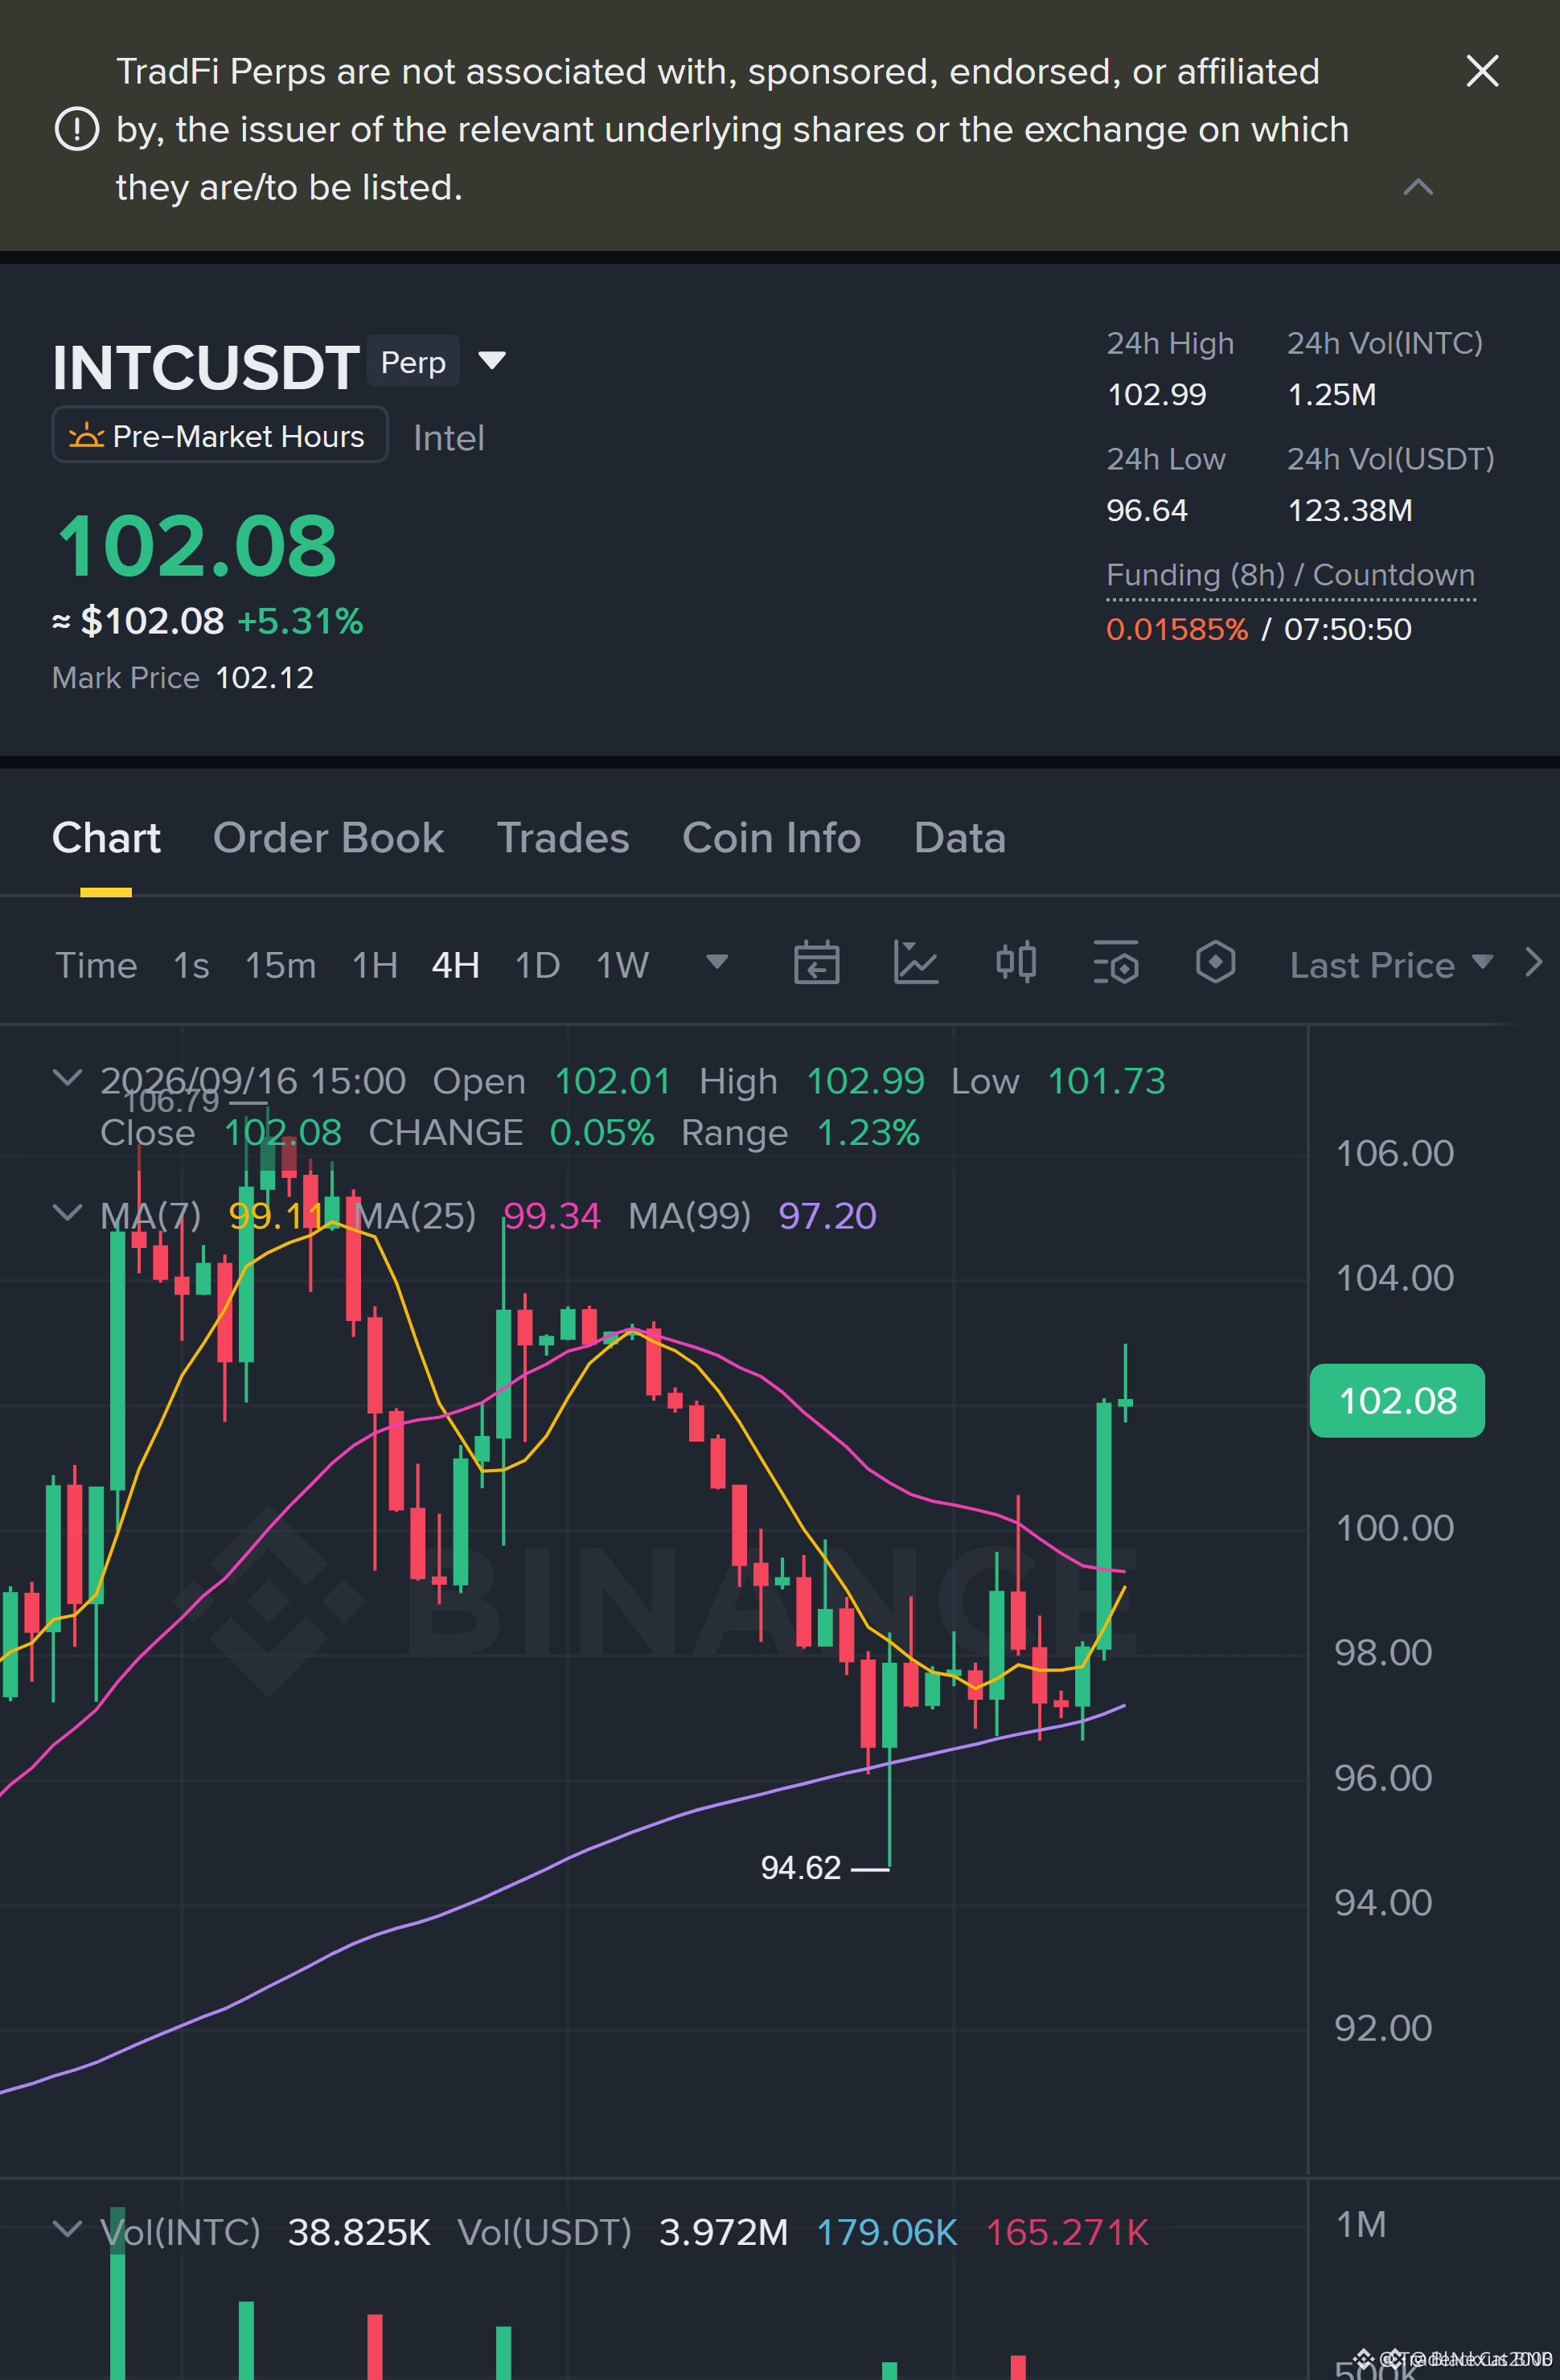
$INTC BREAKOUT RETEST WATCH: WHERE SMART MONEY MAY RELOAD 🦈⚡
Entry: 101.30–101.48 ⚡
Target: 102.29 / 102.98 / 103.67 🚀
Stop Loss: 100.38 ⚠️
📌 The 1H structure favors a retest of the 101.30–101.48 breakout shelf, but the 15M confirmation is still missing. 🦈 Smart money rarely chases; it waits for liquidity to reload at the demand zone.
Scale-out plan: 25% at 102.29, 25% at 102.98, 50% at 103.67. 💡 Risk sits below 100.38, keeping the invalidation tight and the reward ladder clean.
💬 Are you waiting for a reclaim confirmation, or will you fade a deeper sweep into 100.38 first?
⚠️ Not financial advice. Always manage your risk. 🛡️
🏷️ #INTC #LongSetup #Breakout #Watchlist #Crypto
🎯 🦈
$INTC BREAKOUT RETEST WATCH: WHERE SMART MONEY MAY RELOAD 🦈⚡
Entry: 101.30–101.48 ⚡
Target: 102.29 / 102.98 / 103.67 🚀
Stop Loss: 100.38 ⚠️
📌 The 1H structure favors a retest of the 101.30–101.48 breakout shelf, but the 15M confirmation is still missing. 🦈 Smart money rarely chases; it waits for liquidity to reload at the demand zone.
Scale-out plan: 25% at 102.29, 25% at 102.98, 50% at 103.67. 💡 Risk sits below 100.38, keeping the invalidation tight and the reward ladder clean.
💬 Are you waiting for a reclaim confirmation, or will you fade a deeper sweep into 100.38 first?
⚠️ Not financial advice. Always manage your risk. 🛡️
🏷️ #INTC #LongSetup #Breakout #Watchlist #Crypto
🎯 🦈
Entry: 101.30–101.48 ⚡
Target: 102.29 / 102.98 / 103.67 🚀
Stop Loss: 100.38 ⚠️
📌 The 1H structure favors a retest of the 101.30–101.48 breakout shelf, but the 15M confirmation is still missing. 🦈 Smart money rarely chases; it waits for liquidity to reload at the demand zone.
Scale-out plan: 25% at 102.29, 25% at 102.98, 50% at 103.67. 💡 Risk sits below 100.38, keeping the invalidation tight and the reward ladder clean.
💬 Are you waiting for a reclaim confirmation, or will you fade a deeper sweep into 100.38 first?
⚠️ Not financial advice. Always manage your risk. 🛡️
🏷️ #INTC #LongSetup #Breakout #Watchlist #Crypto
🎯 🦈
1
78

·
--
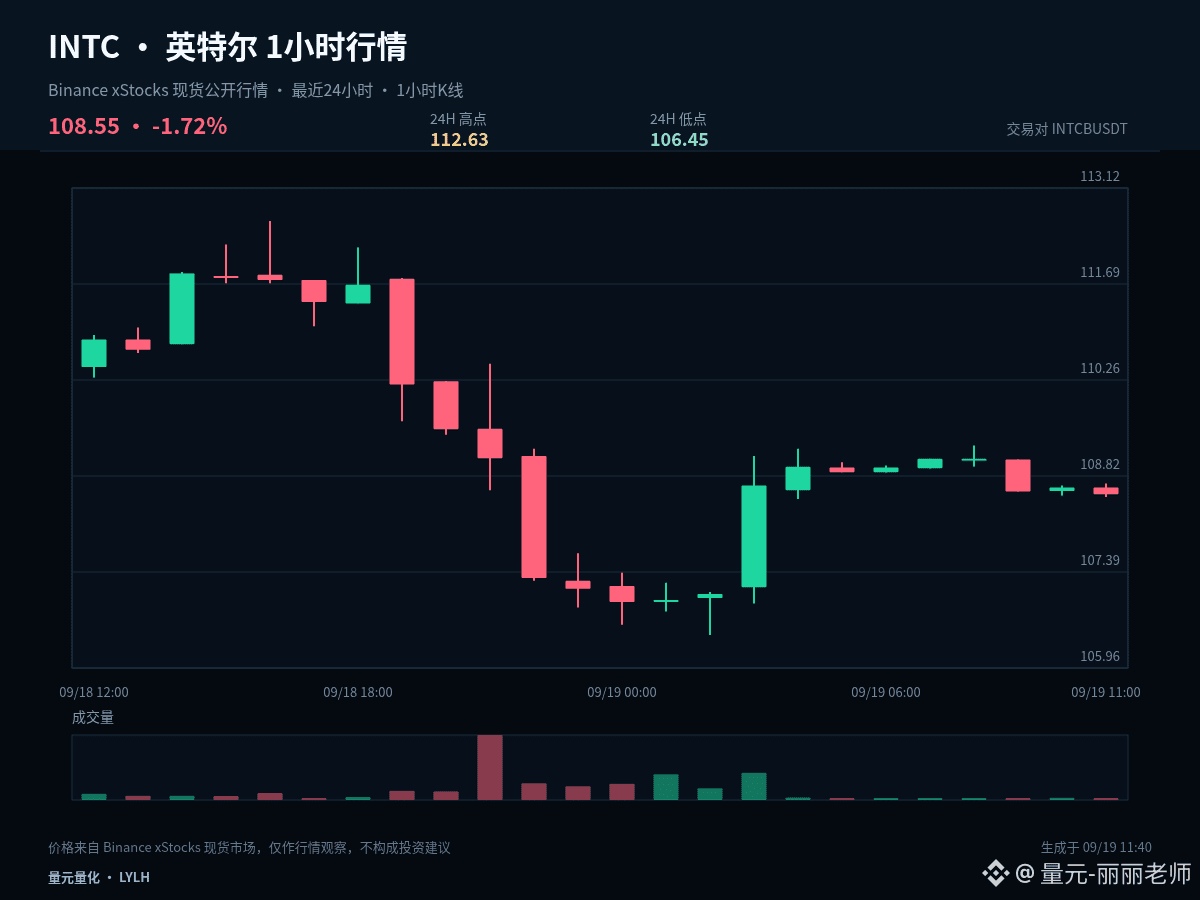
$INTCB #INTC Currently still repeatedly changing hands within the past 24-hour range, with no clear directional edge. The mid-range position is the most testing for patience; waiting for boundary signals is usually more effective.
In the current 1-hour period: -0.09%, and over the past 24 hours: -1.61%. Across these two cycles, there hasn’t been enough clearly aligned cooperation in the same direction. In range-bound market conditions, the margin for chasing breakouts and cutting too late is lower. It’s better to use the upper boundary for directional confirmation, the lower boundary for confirmation of support/holding power, and treat the midline only as a line between relative strength and weakness.
For the short term, first watch whether 106.45 can form continuous support. Then watch whether 109.54 can be reclaimed again. The first determines whether the downside slows; the second determines whether the rebound can strengthen. Without confirmation on both, it’s not advisable to judge opportunity based on drawdown alone.
For execution, set clear conditions. After a breakout above 112.63, you need confirmation—not simply chase when you see a momentary surge. After a dip to 106.45, you should see whether price can quickly recover—not catch just because it falls. When the mid-range doesn’t offer sufficient odds, waiting itself is part of the strategy.
Position management should distinguish between swing (medium-term) and short-term trades. For existing swing positions, first assess whether the structure is broken, and don’t let repeated fluctuations of a single 1-hour candlestick unduly affect you. For short-term positions, execute around support, resistance, and closing confirmation. Those currently in cash don’t need to chase prices in the middle of the range; waiting for a clearer location typically has the advantage.
A trading plan must include invalidation conditions. Even if your judgment is correct, you can realize it in stages; if your judgment is wrong, you must allow yourself to exit. Don’t use adding size to mask the fact that the original logic has changed. The market will update, and your view should adjust with price evidence.
#YahooFinanceEndsPolymarketPartnership
$INTCB #INTC Currently still repeatedly changing hands within the past 24-hour range, with no clear directional edge. The mid-range position is the most testing for patience; waiting for boundary signals is usually more effective.
In the current 1-hour period: -0.09%, and over the past 24 hours: -1.61%. Across these two cycles, there hasn’t been enough clearly aligned cooperation in the same direction. In range-bound market conditions, the margin for chasing breakouts and cutting too late is lower. It’s better to use the upper boundary for directional confirmation, the lower boundary for confirmation of support/holding power, and treat the midline only as a line between relative strength and weakness.
For the short term, first watch whether 106.45 can form continuous support. Then watch whether 109.54 can be reclaimed again. The first determines whether the downside slows; the second determines whether the rebound can strengthen. Without confirmation on both, it’s not advisable to judge opportunity based on drawdown alone.
For execution, set clear conditions. After a breakout above 112.63, you need confirmation—not simply chase when you see a momentary surge. After a dip to 106.45, you should see whether price can quickly recover—not catch just because it falls. When the mid-range doesn’t offer sufficient odds, waiting itself is part of the strategy.
Position management should distinguish between swing (medium-term) and short-term trades. For existing swing positions, first assess whether the structure is broken, and don’t let repeated fluctuations of a single 1-hour candlestick unduly affect you. For short-term positions, execute around support, resistance, and closing confirmation. Those currently in cash don’t need to chase prices in the middle of the range; waiting for a clearer location typically has the advantage.
A trading plan must include invalidation conditions. Even if your judgment is correct, you can realize it in stages; if your judgment is wrong, you must allow yourself to exit. Don’t use adding size to mask the fact that the original logic has changed. The market will update, and your view should adjust with price evidence.
#YahooFinanceEndsPolymarketPartnership
In the current 1-hour period: -0.09%, and over the past 24 hours: -1.61%. Across these two cycles, there hasn’t been enough clearly aligned cooperation in the same direction. In range-bound market conditions, the margin for chasing breakouts and cutting too late is lower. It’s better to use the upper boundary for directional confirmation, the lower boundary for confirmation of support/holding power, and treat the midline only as a line between relative strength and weakness.
For the short term, first watch whether 106.45 can form continuous support. Then watch whether 109.54 can be reclaimed again. The first determines whether the downside slows; the second determines whether the rebound can strengthen. Without confirmation on both, it’s not advisable to judge opportunity based on drawdown alone.
For execution, set clear conditions. After a breakout above 112.63, you need confirmation—not simply chase when you see a momentary surge. After a dip to 106.45, you should see whether price can quickly recover—not catch just because it falls. When the mid-range doesn’t offer sufficient odds, waiting itself is part of the strategy.
Position management should distinguish between swing (medium-term) and short-term trades. For existing swing positions, first assess whether the structure is broken, and don’t let repeated fluctuations of a single 1-hour candlestick unduly affect you. For short-term positions, execute around support, resistance, and closing confirmation. Those currently in cash don’t need to chase prices in the middle of the range; waiting for a clearer location typically has the advantage.
A trading plan must include invalidation conditions. Even if your judgment is correct, you can realize it in stages; if your judgment is wrong, you must allow yourself to exit. Don’t use adding size to mask the fact that the original logic has changed. The market will update, and your view should adjust with price evidence.
#YahooFinanceEndsPolymarketPartnership
1

·
--
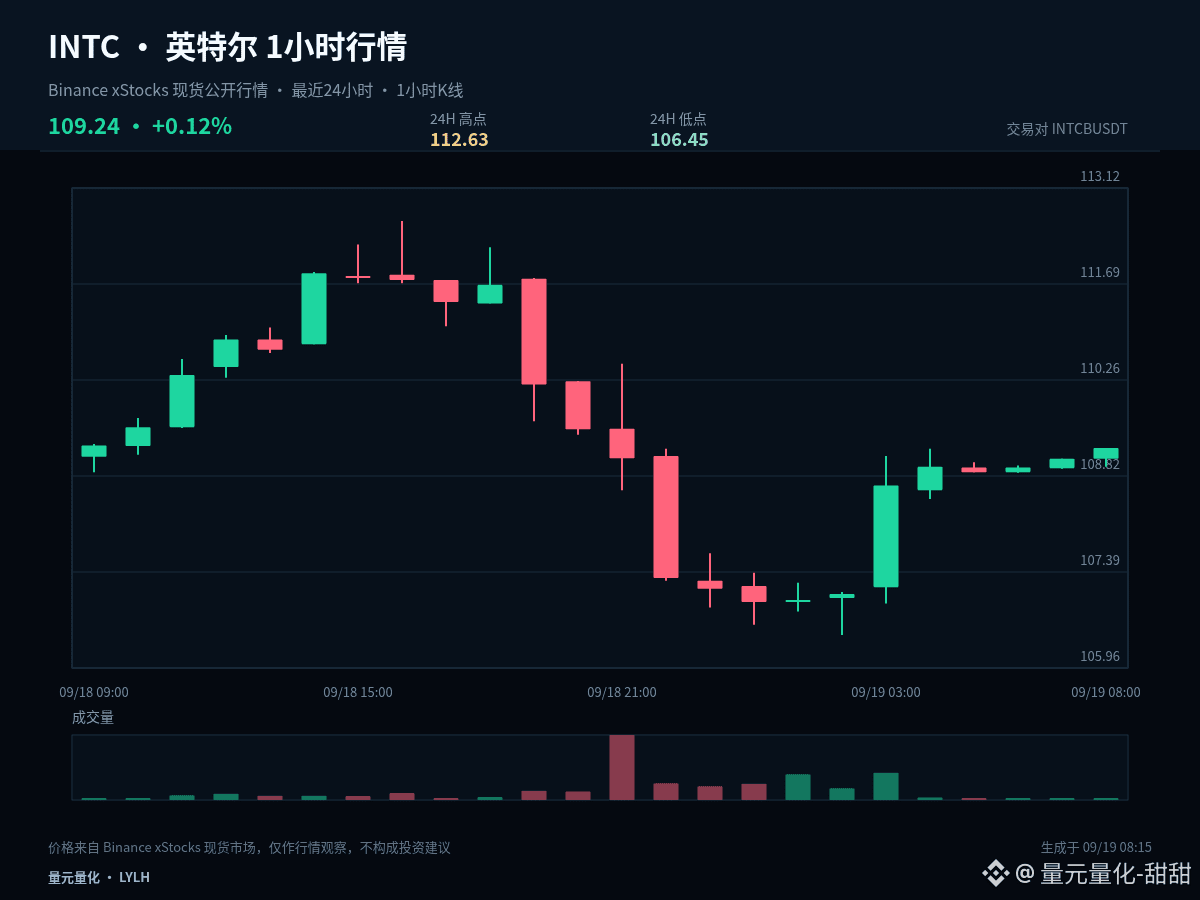
$INTCB #INTC Putting the intraday conclusion first: hold 109.54 first; only then is there room to continue testing 112.63. Current price: 109.24, +0.15% over 1 hour, -0.34% over 24 hours.
Right now, the 1-hour (+0.15%) and 24-hour (-0.34%) cycles have not formed sufficiently clear alignment in the same direction. In a range market, the tolerance for chasing and selling is relatively low. It’s better to use confirmation at the upper boundary for direction, and confirmation at the lower boundary for support/hold. The midline is only used as the line separating strength and weakness.
For key levels: 109.54 is the current structural midline, and it is the first standard for judging whether a pullback is healthy. As long as price can stabilize above it, bulls still retain initiative. Up above, first look to 112.63. If price falls back below the midline, then attention should shift to the second support/acceptance at 106.45.
For execution, set clear conditions: after a break above 112.63, you need confirmation—not just a momentary surge to chase. After probing down to 106.45, you need to see whether price can quickly reclaim it—not just catch the dip just because it drops. If the middle zone doesn’t offer enough reward/risk, waiting is itself part of the strategy.
Position management should distinguish between swing trades and short-term trades. For existing swing positions, first check whether the structure is broken; don’t be repeatedly influenced by single 1-hour candles. For short-term positions, execute around support, resistance, and confirmation at the close. If you’re currently in cash, you don’t need to chase prices in the middle of the range—waiting for a clearer level is usually more advantageous.
Simplifying the conclusion doesn’t mean simplifying risk control. In real execution, you still need to wait for price confirmation, and you must leave room to exit if your judgment turns invalid. Next, I’ll focus on tracking the gains and losses around 109.54. Do you prefer testing 112.63 first, or returning to 106.45 first? Feel free to leave your view and reasoning.
#HKMAPlansWholesaleCBDCByYearEnd
$INTCB #INTC Putting the intraday conclusion first: hold 109.54 first; only then is there room to continue testing 112.63. Current price: 109.24, +0.15% over 1 hour, -0.34% over 24 hours.
Right now, the 1-hour (+0.15%) and 24-hour (-0.34%) cycles have not formed sufficiently clear alignment in the same direction. In a range market, the tolerance for chasing and selling is relatively low. It’s better to use confirmation at the upper boundary for direction, and confirmation at the lower boundary for support/hold. The midline is only used as the line separating strength and weakness.
For key levels: 109.54 is the current structural midline, and it is the first standard for judging whether a pullback is healthy. As long as price can stabilize above it, bulls still retain initiative. Up above, first look to 112.63. If price falls back below the midline, then attention should shift to the second support/acceptance at 106.45.
For execution, set clear conditions: after a break above 112.63, you need confirmation—not just a momentary surge to chase. After probing down to 106.45, you need to see whether price can quickly reclaim it—not just catch the dip just because it drops. If the middle zone doesn’t offer enough reward/risk, waiting is itself part of the strategy.
Position management should distinguish between swing trades and short-term trades. For existing swing positions, first check whether the structure is broken; don’t be repeatedly influenced by single 1-hour candles. For short-term positions, execute around support, resistance, and confirmation at the close. If you’re currently in cash, you don’t need to chase prices in the middle of the range—waiting for a clearer level is usually more advantageous.
Simplifying the conclusion doesn’t mean simplifying risk control. In real execution, you still need to wait for price confirmation, and you must leave room to exit if your judgment turns invalid. Next, I’ll focus on tracking the gains and losses around 109.54. Do you prefer testing 112.63 first, or returning to 106.45 first? Feel free to leave your view and reasoning.
#HKMAPlansWholesaleCBDCByYearEnd
Right now, the 1-hour (+0.15%) and 24-hour (-0.34%) cycles have not formed sufficiently clear alignment in the same direction. In a range market, the tolerance for chasing and selling is relatively low. It’s better to use confirmation at the upper boundary for direction, and confirmation at the lower boundary for support/hold. The midline is only used as the line separating strength and weakness.
For key levels: 109.54 is the current structural midline, and it is the first standard for judging whether a pullback is healthy. As long as price can stabilize above it, bulls still retain initiative. Up above, first look to 112.63. If price falls back below the midline, then attention should shift to the second support/acceptance at 106.45.
For execution, set clear conditions: after a break above 112.63, you need confirmation—not just a momentary surge to chase. After probing down to 106.45, you need to see whether price can quickly reclaim it—not just catch the dip just because it drops. If the middle zone doesn’t offer enough reward/risk, waiting is itself part of the strategy.
Position management should distinguish between swing trades and short-term trades. For existing swing positions, first check whether the structure is broken; don’t be repeatedly influenced by single 1-hour candles. For short-term positions, execute around support, resistance, and confirmation at the close. If you’re currently in cash, you don’t need to chase prices in the middle of the range—waiting for a clearer level is usually more advantageous.
Simplifying the conclusion doesn’t mean simplifying risk control. In real execution, you still need to wait for price confirmation, and you must leave room to exit if your judgment turns invalid. Next, I’ll focus on tracking the gains and losses around 109.54. Do you prefer testing 112.63 first, or returning to 106.45 first? Feel free to leave your view and reasoning.
#HKMAPlansWholesaleCBDCByYearEnd
69

·
--
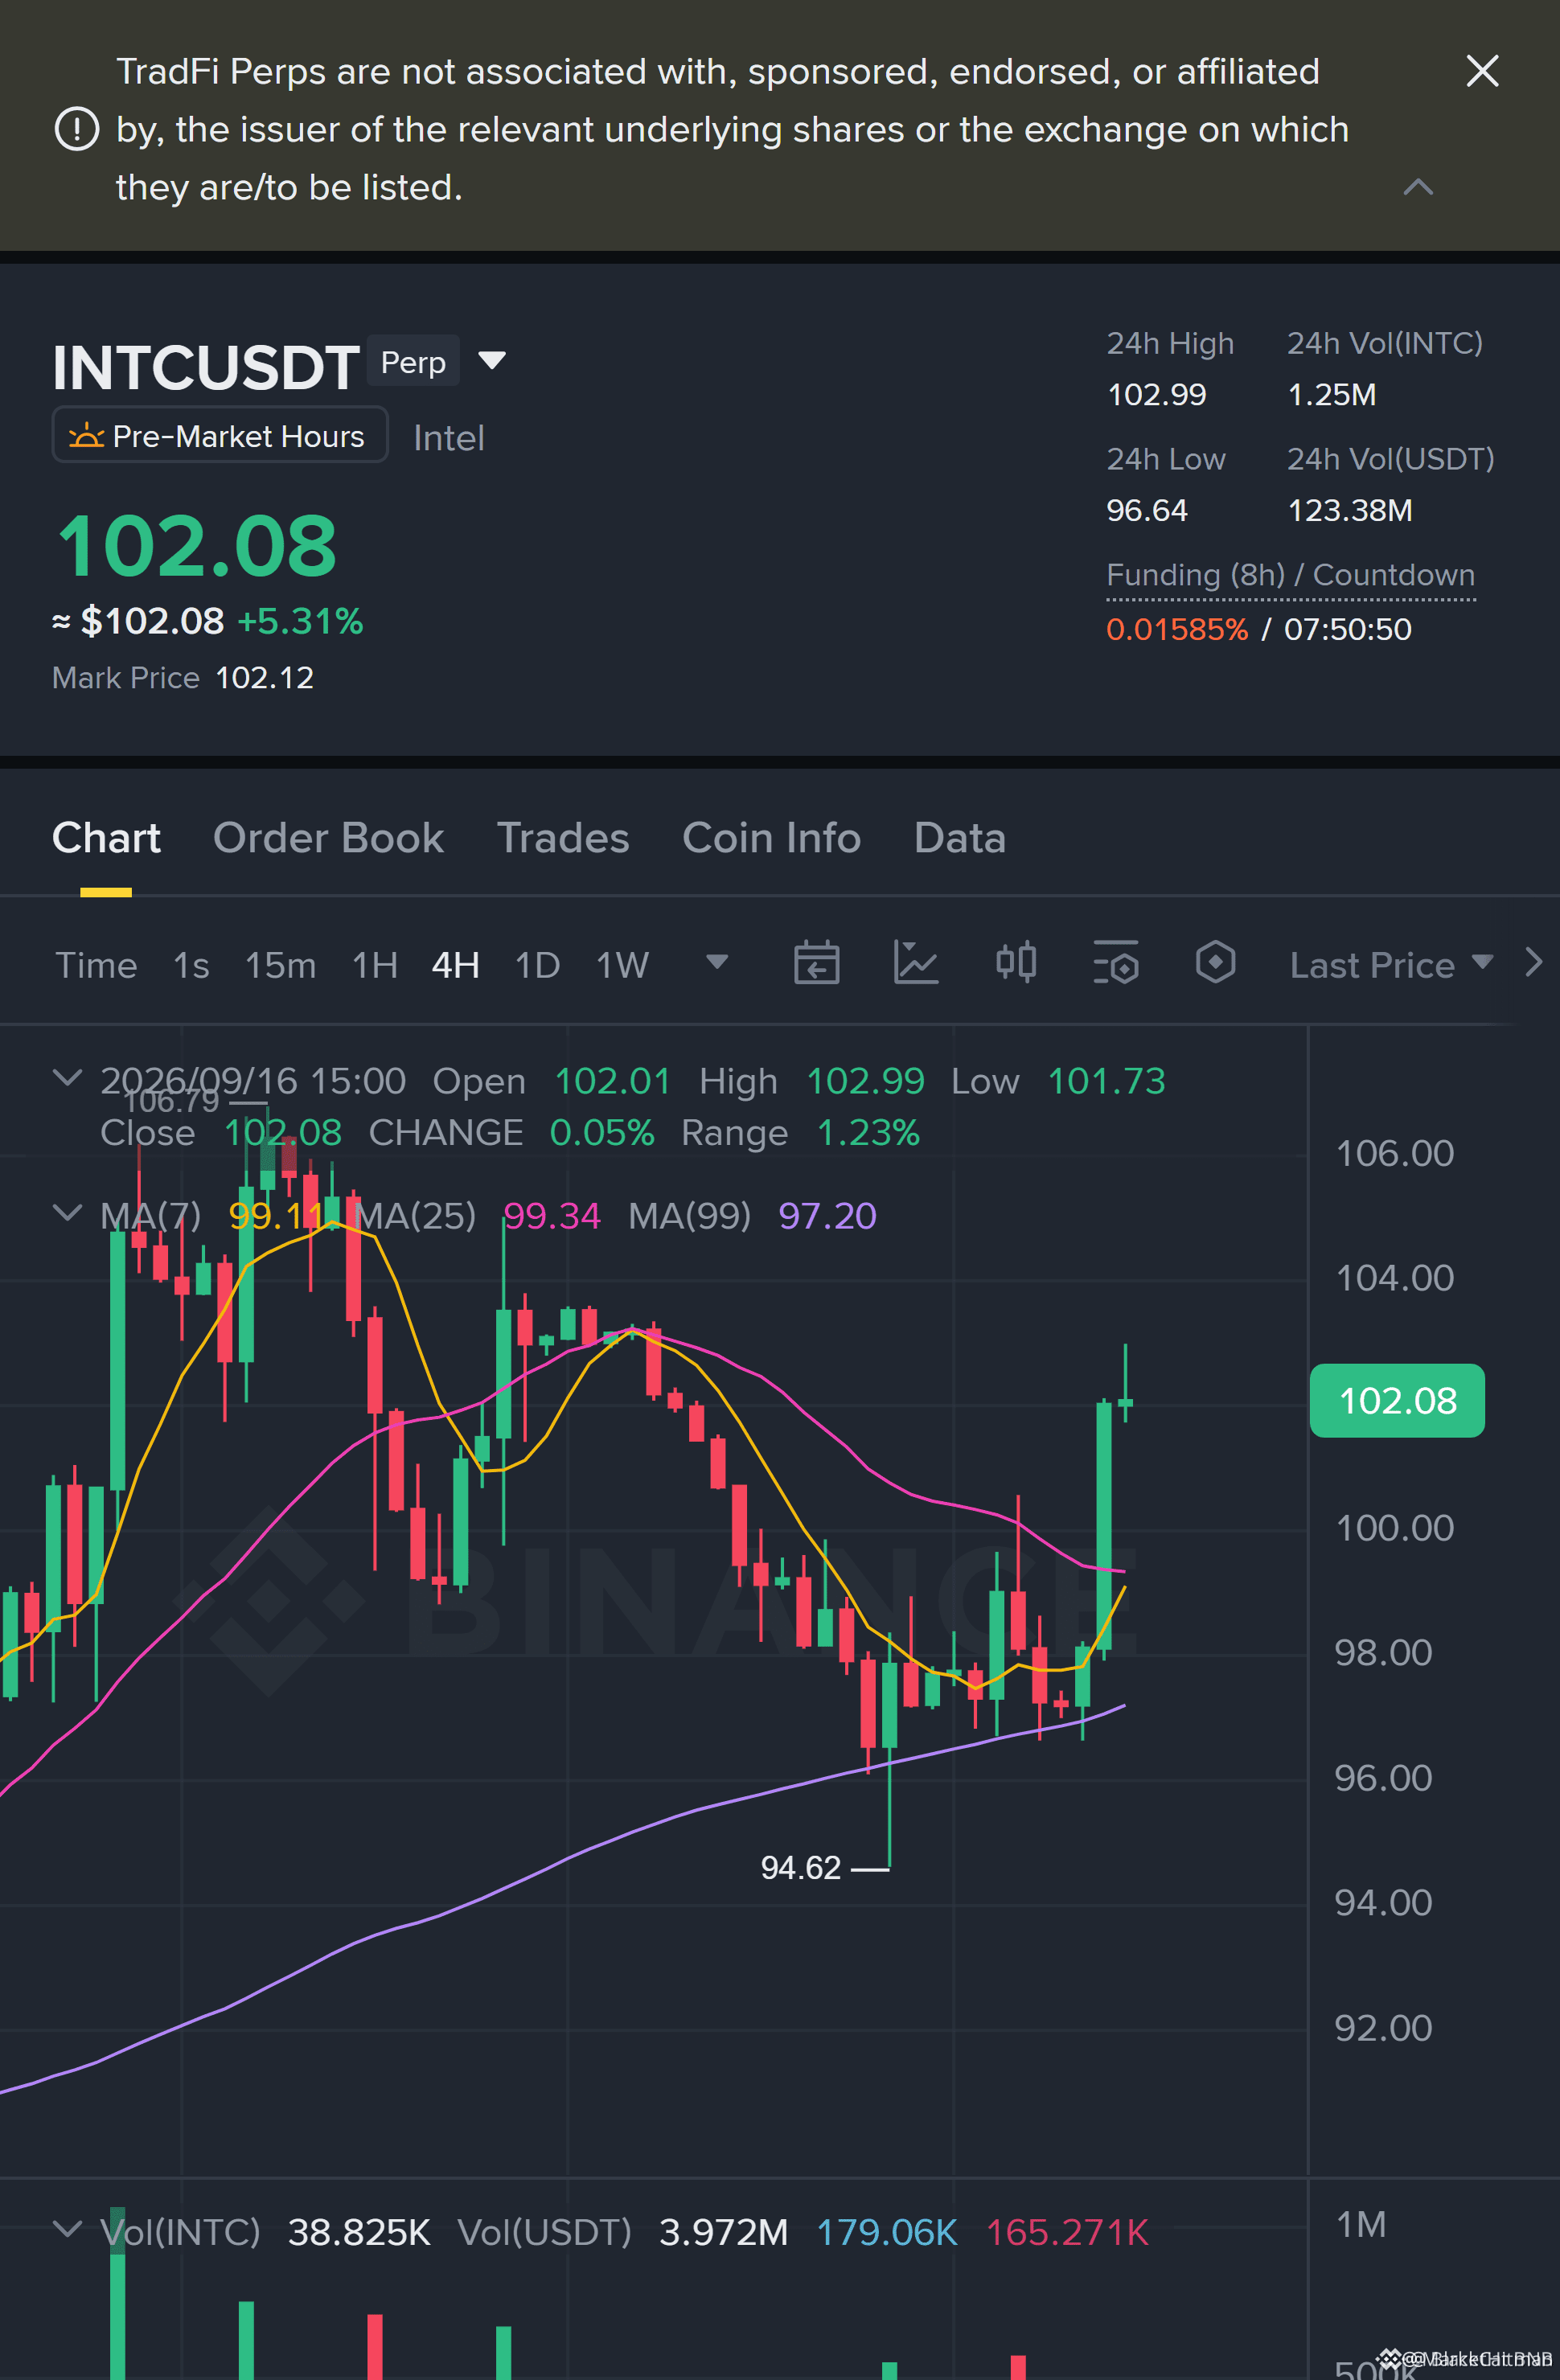
$INTC WATCHLIST: 1H BREAKOUT RETEST HIDES THE NEXT BID 📈
Entry: 101.30-101.48 ⚡
Target: 102.29 / 102.98 / 103.67 🚀
Stop Loss: 100.38 ⚠️
📌 This setup is on the watchlist, not the execution desk. The 1H breakout left a demand zone at 101.30-101.48, but price is away and 15M confirmation is incomplete.
🦈 Wait for the retest to prove buyers are defending, then scale out 25% / 25% / 50% into 102.29, 102.98, and 103.67.
💡 Clean invalidation below 100.38 keeps risk sharp while letting the move breathe. 👇 Are you bidding this retest or waiting for a stronger confirmation?
⚠️ Not financial advice. Always manage your risk. 🛡️
🏷️ #INTC #LongSetup #Breakout #Watchlist #Crypto
🎯 🦈
$INTC WATCHLIST: 1H BREAKOUT RETEST HIDES THE NEXT BID 📈
Entry: 101.30-101.48 ⚡
Target: 102.29 / 102.98 / 103.67 🚀
Stop Loss: 100.38 ⚠️
📌 This setup is on the watchlist, not the execution desk. The 1H breakout left a demand zone at 101.30-101.48, but price is away and 15M confirmation is incomplete.
🦈 Wait for the retest to prove buyers are defending, then scale out 25% / 25% / 50% into 102.29, 102.98, and 103.67.
💡 Clean invalidation below 100.38 keeps risk sharp while letting the move breathe. 👇 Are you bidding this retest or waiting for a stronger confirmation?
⚠️ Not financial advice. Always manage your risk. 🛡️
🏷️ #INTC #LongSetup #Breakout #Watchlist #Crypto
🎯 🦈
Entry: 101.30-101.48 ⚡
Target: 102.29 / 102.98 / 103.67 🚀
Stop Loss: 100.38 ⚠️
📌 This setup is on the watchlist, not the execution desk. The 1H breakout left a demand zone at 101.30-101.48, but price is away and 15M confirmation is incomplete.
🦈 Wait for the retest to prove buyers are defending, then scale out 25% / 25% / 50% into 102.29, 102.98, and 103.67.
💡 Clean invalidation below 100.38 keeps risk sharp while letting the move breathe. 👇 Are you bidding this retest or waiting for a stronger confirmation?
⚠️ Not financial advice. Always manage your risk. 🛡️
🏷️ #INTC #LongSetup #Breakout #Watchlist #Crypto
🎯 🦈
23
·
--
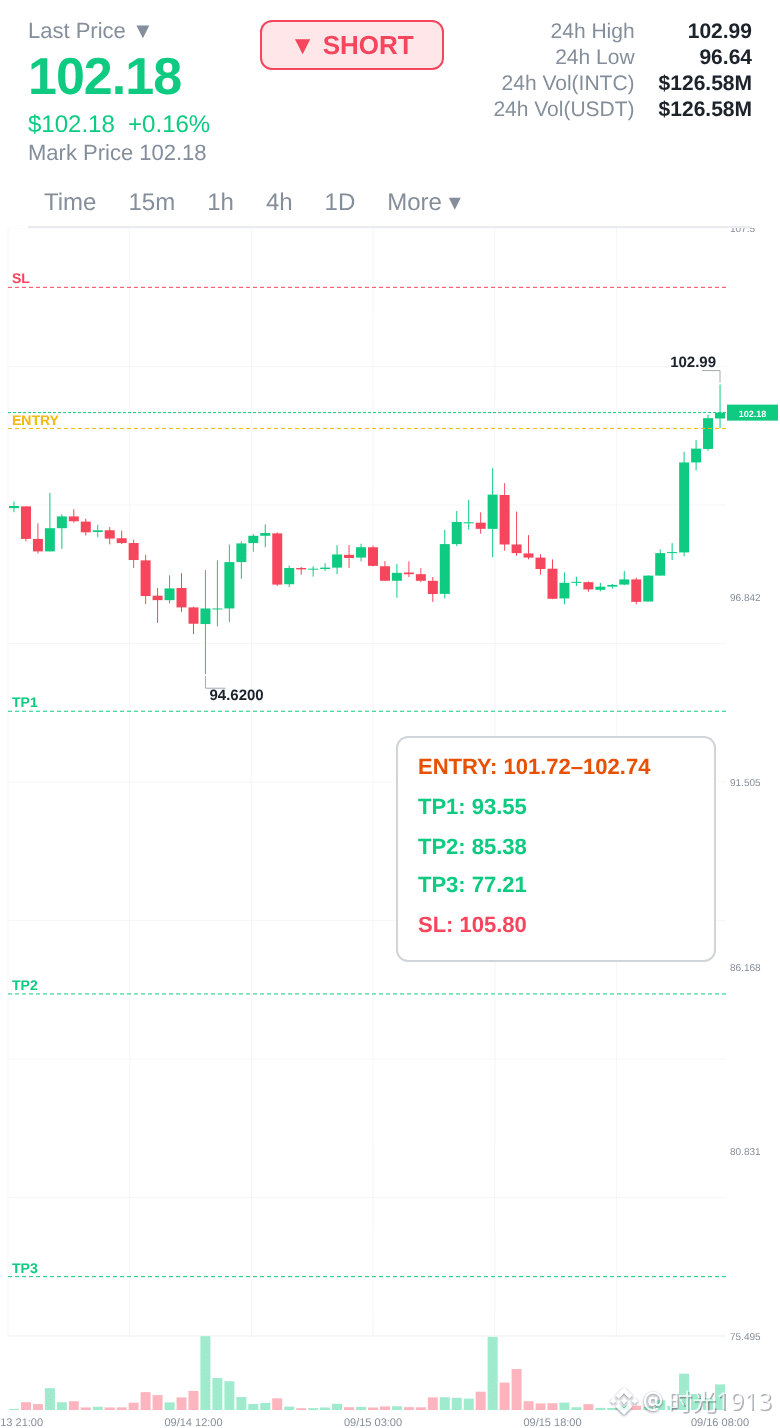
🔴 INTC is in a strong downtrend — I'm not profiting yet
Honestly the chart is telling me something here. I'm listening.
CONTINUATION | 📉 SHORT
📉 Entry: 101.72 – 102.74
🛑 Stop: 105.80
🎯 TP1: 93.55
🎯 TP2: 85.38
🎯 TP3: 77.21
📊 Confidence: 80%
Every pullback in a downtrend is an opportunity.
The decline is orderly and controlled — text
Trend Is Your Friend 👉 $INTC 👈 Now
#INTC $SOL $BTC
🔴 INTC is in a strong downtrend — I'm not profiting yet
Honestly the chart is telling me something here. I'm listening.
CONTINUATION | 📉 SHORT
📉 Entry: 101.72 – 102.74
🛑 Stop: 105.80
🎯 TP1: 93.55
🎯 TP2: 85.38
🎯 TP3: 77.21
📊 Confidence: 80%
Every pullback in a downtrend is an opportunity.
The decline is orderly and controlled — text
Trend Is Your Friend 👉 $INTC 👈 Now
#INTC $SOL $BTC
Honestly the chart is telling me something here. I'm listening.
CONTINUATION | 📉 SHORT
📉 Entry: 101.72 – 102.74
🛑 Stop: 105.80
🎯 TP1: 93.55
🎯 TP2: 85.38
🎯 TP3: 77.21
📊 Confidence: 80%
Every pullback in a downtrend is an opportunity.
The decline is orderly and controlled — text
Trend Is Your Friend 👉 $INTC 👈 Now
#INTC $SOL $BTC
1
229
·
--
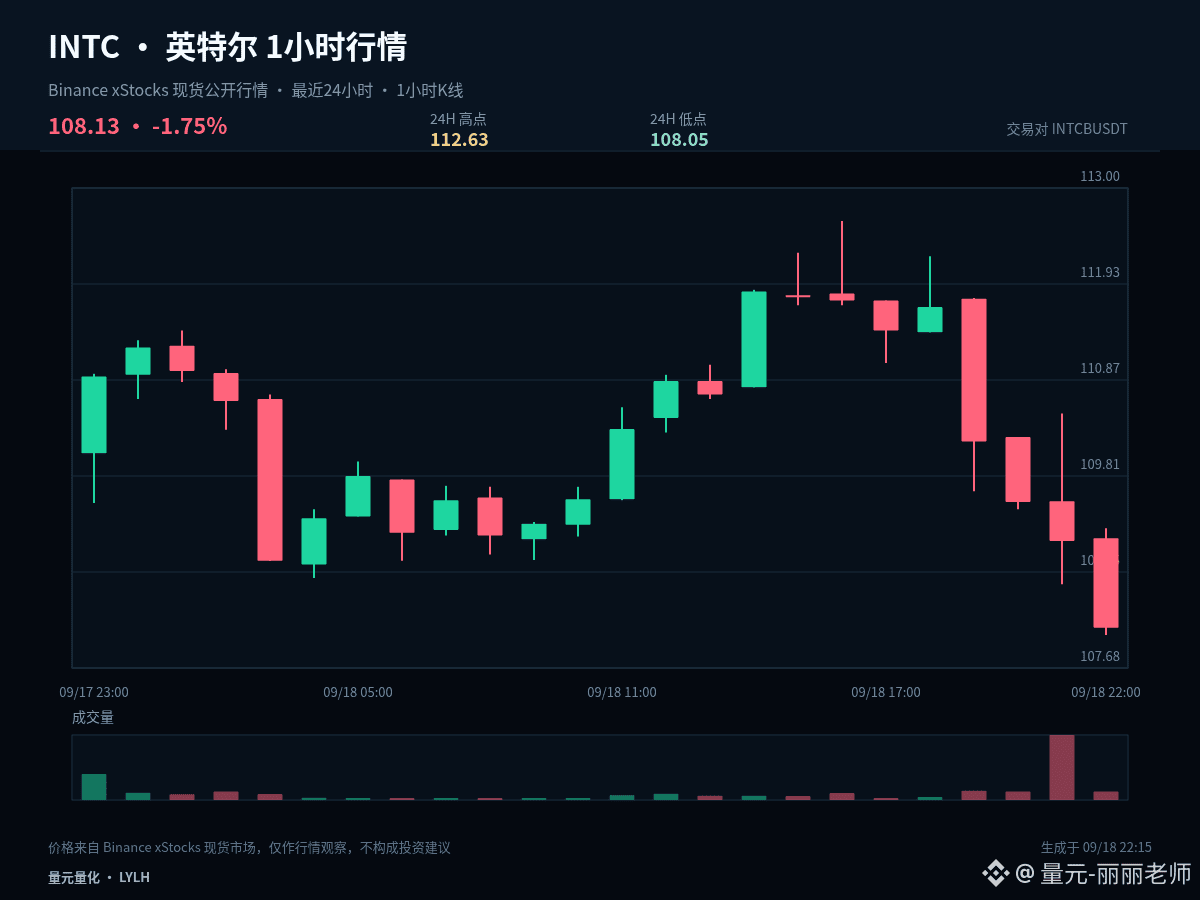
$INTCB #INTC Can this market move continue? It doesn’t depend on how much it has already risen beforehand; it depends on whether the trend can complete “impulse, consolidation, and then confirmation.” Current 1-hour change is -0.88%, and 24-hour change is -0.74%.
The current price is near the lower bound of the last 24 hours’ range: 1-hour -0.88%, 24-hour -0.74%. The key to analyzing the low isn’t trying to bottom early, but watching whether, after a break, the price can quickly reclaim. If it can be reclaimed, it indicates sell pressure is being absorbed. If it continues to linger below the lower bound, it means weakness hasn’t ended yet.
The first condition for an extension of the structure is that 110.34 is not effectively broken downward. The second condition is that the price can retest and regain 112.63. If, after the impulse, it stays for a long time below the midline, it suggests the active buying has weakened. If it further loses 108.05, then the original extension assumption needs to be cancelled.
My scenario analysis isn’t based on a single bet in one direction. A breakout above 112.63 and holding it means the upside space is reopened. A breakdown below 108.05 and failure to bounce back means the structure weakens further. If it trades between the two, then keep observing the closing performance on both sides of 110.34.
Existing positions can be handled in segments based on key levels, avoiding making all decisions at once. If you’re currently in cash, wait for breakout confirmation or for pullback stabilization. For US market instruments, also watch for volatility caused by trading-session transitions; your plan should be based on price conditions, not on emotions substituting for execution.
Risk control still comes before any conclusions: execute only when conditions are met, and reassess promptly if the price becomes invalid. The higher the volatility, the more restrained each single position should be. The above is a view based on the current 1-hour and 24-hour data; it does not constitute a promise of returns.
#ChainlinkPowersBottomlinePaymentPlatform
$INTCB #INTC Can this market move continue? It doesn’t depend on how much it has already risen beforehand; it depends on whether the trend can complete “impulse, consolidation, and then confirmation.” Current 1-hour change is -0.88%, and 24-hour change is -0.74%.
The current price is near the lower bound of the last 24 hours’ range: 1-hour -0.88%, 24-hour -0.74%. The key to analyzing the low isn’t trying to bottom early, but watching whether, after a break, the price can quickly reclaim. If it can be reclaimed, it indicates sell pressure is being absorbed. If it continues to linger below the lower bound, it means weakness hasn’t ended yet.
The first condition for an extension of the structure is that 110.34 is not effectively broken downward. The second condition is that the price can retest and regain 112.63. If, after the impulse, it stays for a long time below the midline, it suggests the active buying has weakened. If it further loses 108.05, then the original extension assumption needs to be cancelled.
My scenario analysis isn’t based on a single bet in one direction. A breakout above 112.63 and holding it means the upside space is reopened. A breakdown below 108.05 and failure to bounce back means the structure weakens further. If it trades between the two, then keep observing the closing performance on both sides of 110.34.
Existing positions can be handled in segments based on key levels, avoiding making all decisions at once. If you’re currently in cash, wait for breakout confirmation or for pullback stabilization. For US market instruments, also watch for volatility caused by trading-session transitions; your plan should be based on price conditions, not on emotions substituting for execution.
Risk control still comes before any conclusions: execute only when conditions are met, and reassess promptly if the price becomes invalid. The higher the volatility, the more restrained each single position should be. The above is a view based on the current 1-hour and 24-hour data; it does not constitute a promise of returns.
#ChainlinkPowersBottomlinePaymentPlatform
The current price is near the lower bound of the last 24 hours’ range: 1-hour -0.88%, 24-hour -0.74%. The key to analyzing the low isn’t trying to bottom early, but watching whether, after a break, the price can quickly reclaim. If it can be reclaimed, it indicates sell pressure is being absorbed. If it continues to linger below the lower bound, it means weakness hasn’t ended yet.
The first condition for an extension of the structure is that 110.34 is not effectively broken downward. The second condition is that the price can retest and regain 112.63. If, after the impulse, it stays for a long time below the midline, it suggests the active buying has weakened. If it further loses 108.05, then the original extension assumption needs to be cancelled.
My scenario analysis isn’t based on a single bet in one direction. A breakout above 112.63 and holding it means the upside space is reopened. A breakdown below 108.05 and failure to bounce back means the structure weakens further. If it trades between the two, then keep observing the closing performance on both sides of 110.34.
Existing positions can be handled in segments based on key levels, avoiding making all decisions at once. If you’re currently in cash, wait for breakout confirmation or for pullback stabilization. For US market instruments, also watch for volatility caused by trading-session transitions; your plan should be based on price conditions, not on emotions substituting for execution.
Risk control still comes before any conclusions: execute only when conditions are met, and reassess promptly if the price becomes invalid. The higher the volatility, the more restrained each single position should be. The above is a view based on the current 1-hour and 24-hour data; it does not constitute a promise of returns.
#ChainlinkPowersBottomlinePaymentPlatform
18
Log in to explore more content
Join global crypto users on Binance Square
⚡️ Get latest and useful information about crypto.
💬 Trusted by the world’s largest crypto exchange.
👍 Discover real insights from verified creators.
Email / Phone number
Trending Topics
1
#BOJRaisesRatesTo31YearHigh
543 views
59 Discussing
2
#HKCompletesFirstHKDStablecoinUseCase
18,129 views
499 Discussing
3
#VietnamPlansFirstCryptoLicensesIn2026
13,484 views
337 Discussing
4
#BTCBreaks80K
232,828 views
3,652 Discussing
5
#BitcoinMarketCapTopsTesla
29,944 views
696 Discussing
6
#SOLJumpsAbout10%
42,971 views
764 Discussing
7
#EthereumReclaims$2600
3,414 views
92 Discussing
8
#LineraShutsDownAfterFundraisingFallsShort
9,880 views
203 Discussing
9
#SECReceivesAmendedInjectiveETFFiling
22,955 views
465 Discussing
10
#SanDiskToJoinSP100OnSep21
16,771 views
289 Discussing