

#hegota
hegota
4,784 views
51 Discussing
Hot
Latest

·
--
Bearish
Vitalik says Hegota, next year's fork, is likely Ethereum's last "normal" one
everyone will screenshot that. the part that hits builders on $ETH
{spot}(ETHUSDT)
is the bill after it
same computation, very different price
shove it into one serial transaction and it costs much more
split it into pieces that can run in parallel and it costs much less
so a contract that runs like one long to-do list gets expensive
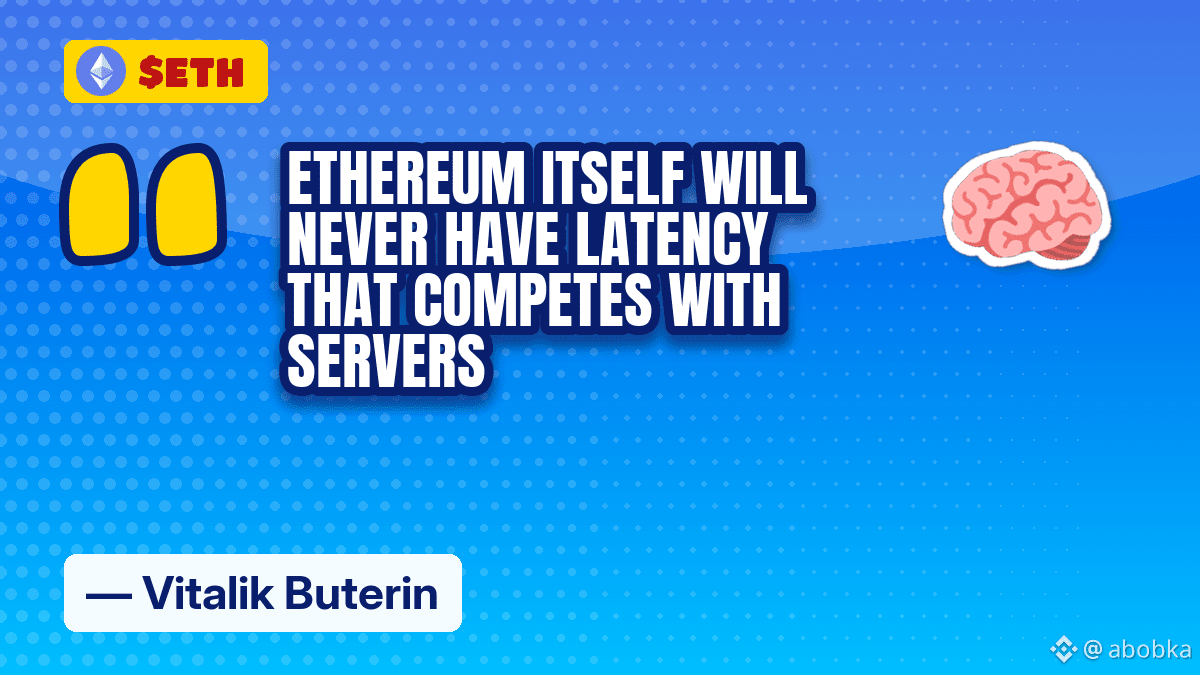
and speed, in his words: "Ethereum itself will never have latency that competes with servers"
whatever feels fast will sit around the chain
I don't hold ETH, so I'm just here for the architecture drama)
Glamsterdam, the fork before Hegota, is set for the fourth quarter of 2026 and hasn't even shipped
the day it does I'll break down what it changes right here, follow and you'll catch it
#VitalikButerin #HEGOTA #ETH
Vitalik says Hegota, next year's fork, is likely Ethereum's last "normal" one
everyone will screenshot that. the part that hits builders on $ETH
is the bill after it
same computation, very different price
shove it into one serial transaction and it costs much more
split it into pieces that can run in parallel and it costs much less
so a contract that runs like one long to-do list gets expensive
and speed, in his words: "Ethereum itself will never have latency that competes with servers"
whatever feels fast will sit around the chain
I don't hold ETH, so I'm just here for the architecture drama)
Glamsterdam, the fork before Hegota, is set for the fourth quarter of 2026 and hasn't even shipped
the day it does I'll break down what it changes right here, follow and you'll catch it
#VitalikButerin #HEGOTA #ETH
everyone will screenshot that. the part that hits builders on $ETH
is the bill after it
same computation, very different price
shove it into one serial transaction and it costs much more
split it into pieces that can run in parallel and it costs much less
so a contract that runs like one long to-do list gets expensive
and speed, in his words: "Ethereum itself will never have latency that competes with servers"
whatever feels fast will sit around the chain
I don't hold ETH, so I'm just here for the architecture drama)
Glamsterdam, the fork before Hegota, is set for the fourth quarter of 2026 and hasn't even shipped
the day it does I'll break down what it changes right here, follow and you'll catch it
#VitalikButerin #HEGOTA #ETH
2
40

·
--
Bullish
30D trade $ETH 50 USDT
⚡️ Ethereum is approaching a new step toward faster performance
A recent survey from Ethlabs, including 20 votes from the Ethereum ecosystem, showed broad support for EIP-8198 as part of the Hegotá upgrade, with endorsements from names like Lido, Ethena, Flashbots, and Ondo.
The idea? ⏱️
Reduce slot time from 12 to 10 seconds, with the possibility of building a more flexible speed system in the future.
The goal isn’t speed alone, but improving the network experience and confirmations while maintaining stability and decentralization.
A technical development worth following as Hegotá nears. ⚡️
$ETH $ONDO $ENA
#Ethereum #EIP8198 #HEGOTA
⚡️ Ethereum is approaching a new step toward faster performance
A recent survey from Ethlabs, including 20 votes from the Ethereum ecosystem, showed broad support for EIP-8198 as part of the Hegotá upgrade, with endorsements from names like Lido, Ethena, Flashbots, and Ondo.
The idea? ⏱️
Reduce slot time from 12 to 10 seconds, with the possibility of building a more flexible speed system in the future.
The goal isn’t speed alone, but improving the network experience and confirmations while maintaining stability and decentralization.
A technical development worth following as Hegotá nears. ⚡️
$ETH $ONDO $ENA
#Ethereum #EIP8198 #HEGOTA
A recent survey from Ethlabs, including 20 votes from the Ethereum ecosystem, showed broad support for EIP-8198 as part of the Hegotá upgrade, with endorsements from names like Lido, Ethena, Flashbots, and Ondo.
The idea? ⏱️
Reduce slot time from 12 to 10 seconds, with the possibility of building a more flexible speed system in the future.
The goal isn’t speed alone, but improving the network experience and confirmations while maintaining stability and decentralization.
A technical development worth following as Hegotá nears. ⚡️
$ETH $ONDO $ENA
#Ethereum #EIP8198 #HEGOTA
1
322

·
--
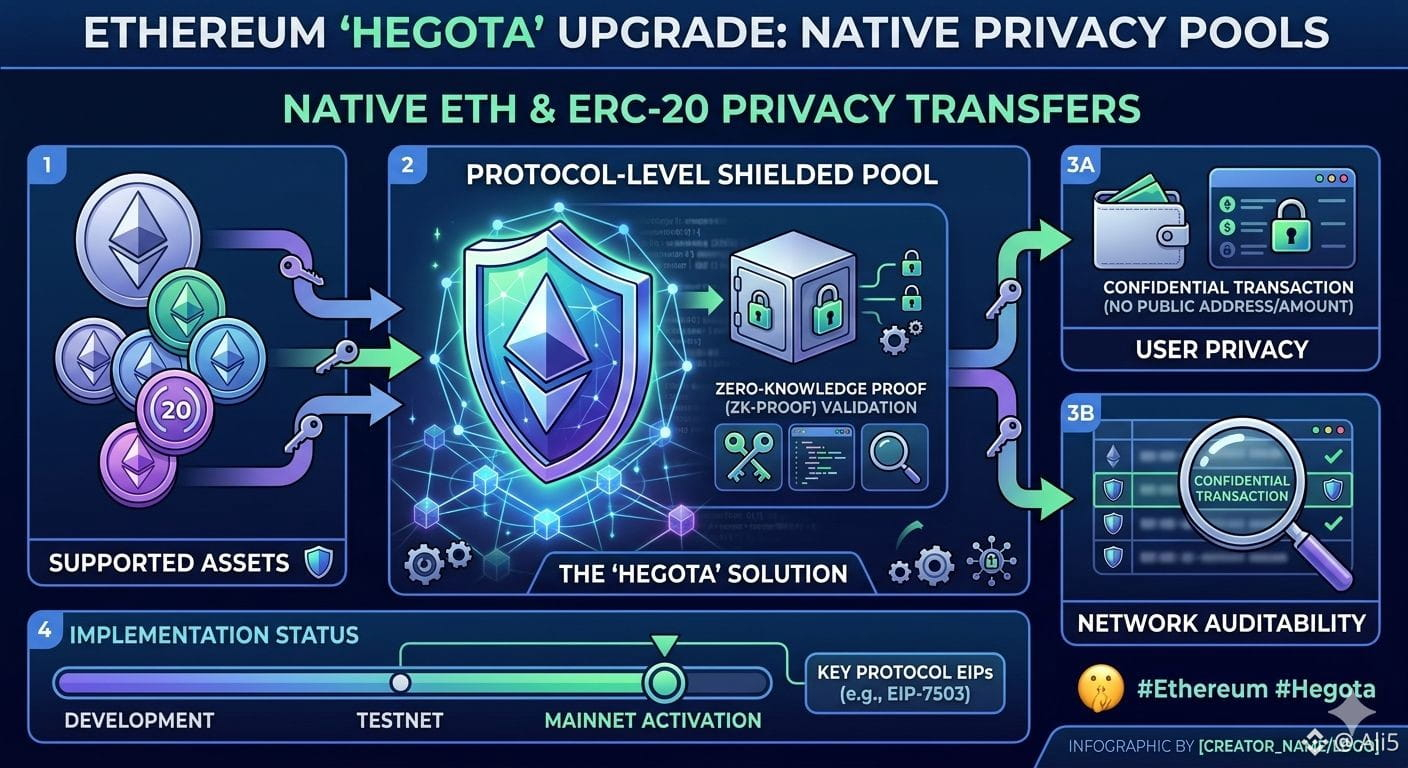
⚡️ Ethereum’s Hegota upgrade is set to introduce native privacy transfers. Fully private $ETH and ERC-20 transactions are coming straight to the protocol level! #Ethereum #Hegota
#EthereumHegotaUpgradePrivacyTransfers
⚡️ Ethereum’s Hegota upgrade is set to introduce native privacy transfers. Fully private $ETH and ERC-20 transactions are coming straight to the protocol level! #Ethereum #Hegota
#EthereumHegotaUpgradePrivacyTransfers
#EthereumHegotaUpgradePrivacyTransfers
103
Ethereum Market Deep-Dive Analysis: Clear Technical Upgrade Roadmap, On-Chain Selling Pressure Gradually Being Absorbed
1. Price Trend Analysis
As of early September 29 Beijing time, Ethereum’s spot price is $2,691. In the past 24 hours, it has been consolidating in a tight range of $2,667 to $2,694. From the hourly K-line charts, the most recent five candles show mild fluctuations and a sideways pattern. Price has remained near the 7-day moving average, suggesting the market is waiting for a new catalyst to break the current equilibrium.
From the funding perspective, Ethereum spot ETFs recorded an estimated net inflow of about $690 million last week. Meanwhile, enterprise-level wallets increased holdings by more than 17,000 ETH during the same period, indicating institutional investors still remain optimistic about Ethereum’s long-term prospects. However, on-chain data shows there has been sustained net capital outflow recently, which is related to the Bitget hacker incident—where the attacker sold ETH via decentralized protocols. This has created some short-term downward pressure on price.
According to the Bollinger Bands indicator, the upper band is around $2,709, the middle band around $2,673, and the lower band around $2,637. The current price is trading between the middle and upper bands, placing it in a relatively bullish zone overall. However, resistance at the upper band is fairly evident; in the short term, price needs to break above $2,710 to open up room for further upside.
2. Interpretation of Technical Indicators
From the composite signal indicators perspective, among 15 factors, 5 are issuing long signals (33.3%), 9 are issuing short signals (60%), and 1 remains neutral. Although the short-term factors are skewed bearish, the composite indicator value is still positive, and the overall signal direction is bullish. The historical win rate is 78.57%, suggesting that the long-term technical outlook still favors the bulls.
Moving average system: The 7-day moving average is around $2,684, and the 25-day moving average around $2,670. The short-term moving averages are positioned above the long-term moving averages, maintaining a bullish alignment. The 99-day moving average is around $2,686, roughly matching the current price. Whether price can hold or lose this level will determine the short-term direction.
The MACD indicator shows encouraging signals: the fast line is about 2.63, the slow line about 0.64, and the histogram around 1.99. MACD has been running above the zero axis, and both the fast and slow lines are diverging upward—an典型 signal that bullish momentum is strengthening. Although the histogram has narrowed slightly compared with the prior value, the overall trend remains positive.
For the RSI indicator: the 6-period RSI is about 54.20, the 12-period RSI about 53.33, and the 24-period RSI about 51.37. All three lines are above 50, indicating a mild bullish market condition. Notably, RSI previously rebounded strongly from the oversold zone (around 21) to near 56, which suggests bottom-fishing capital has strong willingness to enter.
In the KDJ indicator, the K value is about 45.37, D about 49.94, and J about 36.23. The three lines are converging downward, implying some short-term adjustment pressure. Meanwhile, the ATR indicator has fallen from 20.72 to 18.72, meaning volatility has been continuously tightening—this often precedes a directional breakout.
3. Market Sentiment Analysis
Ethereum’s current market sentiment is relatively complex. On the positive side, Vitalik Buterin recently stated clearly that the Hegotá upgrade in 2027 will be Ethereum’s last regular hard fork; after that, the development focus will shift toward recursive STARK proofs and quantum-safe cryptography. This statement provides a clear long-term vision for Ethereum’s technical roadmap, positioning Ethereum as a computing platform for the encrypted world—integrating blockchain, zero-knowledge proofs, and decentralized off-chain components. This grand narrative offers strong confidence support for long-term holders.
On the risk side, the on-chain selling pressure triggered by Bitget’s $387.5 million hacker incident is still being worked through. The attacker swapped the stolen ETH through decentralized protocols such as THORChain into BTC, bringing persistent sell pressure to the Ethereum network. Yet despite this pressure, Ethereum’s price has stayed above $2,600, indicating the market’s ability to absorb supply remains relatively sufficient.
In addition, tokenized stocks’ trading volume on the Base chain has surpassed $1 billion. Seven tokenized U.S. stocks have been listed on Aave V4 as collateral, and Ethereum’s DeFi infrastructure continues to expand. The upgrade of Chainlink CCIP 2.0 provides enterprise-level customizable capabilities for cross-chain security, further strengthening Ethereum’s core position in decentralized finance.
On the macro level, rising U.S. Treasury yields and heightened geopolitical tension put pressure on the overall crypto market. However, Ethereum has shown stronger resilience relative to Bitcoin; with continued institutional inflows supporting it, the ETH/BTC ratio has the potential to stabilize and rebound.
Overall, Ethereum is in a short-term sideways consolidation phase. The bullish MACD signals and mildly bullish RSI condition provide a technical foundation for a future breakout. Investors are advised to watch the Bollinger Band lower support at $2,637 and the upper resistance at $2,710, and to patiently wait for the direction to be chosen.
Hot Token Quick View:
NMR (Numeraire): Current price $13.64, 24h increase +29.78%
MARSCOIN: Current price $0.1571, 24h increase +26.59%
HBAR (Hedera): Current price $0.1208, 24h increase +25.31%
#Ethereum #DeFi #Hegota
Ethereum Market Deep-Dive Analysis: Clear Technical Upgrade Roadmap, On-Chain Selling Pressure Gradually Being Absorbed
1. Price Trend Analysis
As of early September 29 Beijing time, Ethereum’s spot price is $2,691. In the past 24 hours, it has been consolidating in a tight range of $2,667 to $2,694. From the hourly K-line charts, the most recent five candles show mild fluctuations and a sideways pattern. Price has remained near the 7-day moving average, suggesting the market is waiting for a new catalyst to break the current equilibrium.
From the funding perspective, Ethereum spot ETFs recorded an estimated net inflow of about $690 million last week. Meanwhile, enterprise-level wallets increased holdings by more than 17,000 ETH during the same period, indicating institutional investors still remain optimistic about Ethereum’s long-term prospects. However, on-chain data shows there has been sustained net capital outflow recently, which is related to the Bitget hacker incident—where the attacker sold ETH via decentralized protocols. This has created some short-term downward pressure on price.
According to the Bollinger Bands indicator, the upper band is around $2,709, the middle band around $2,673, and the lower band around $2,637. The current price is trading between the middle and upper bands, placing it in a relatively bullish zone overall. However, resistance at the upper band is fairly evident; in the short term, price needs to break above $2,710 to open up room for further upside.
2. Interpretation of Technical Indicators
From the composite signal indicators perspective, among 15 factors, 5 are issuing long signals (33.3%), 9 are issuing short signals (60%), and 1 remains neutral. Although the short-term factors are skewed bearish, the composite indicator value is still positive, and the overall signal direction is bullish. The historical win rate is 78.57%, suggesting that the long-term technical outlook still favors the bulls.
Moving average system: The 7-day moving average is around $2,684, and the 25-day moving average around $2,670. The short-term moving averages are positioned above the long-term moving averages, maintaining a bullish alignment. The 99-day moving average is around $2,686, roughly matching the current price. Whether price can hold or lose this level will determine the short-term direction.
The MACD indicator shows encouraging signals: the fast line is about 2.63, the slow line about 0.64, and the histogram around 1.99. MACD has been running above the zero axis, and both the fast and slow lines are diverging upward—an典型 signal that bullish momentum is strengthening. Although the histogram has narrowed slightly compared with the prior value, the overall trend remains positive.
For the RSI indicator: the 6-period RSI is about 54.20, the 12-period RSI about 53.33, and the 24-period RSI about 51.37. All three lines are above 50, indicating a mild bullish market condition. Notably, RSI previously rebounded strongly from the oversold zone (around 21) to near 56, which suggests bottom-fishing capital has strong willingness to enter.
In the KDJ indicator, the K value is about 45.37, D about 49.94, and J about 36.23. The three lines are converging downward, implying some short-term adjustment pressure. Meanwhile, the ATR indicator has fallen from 20.72 to 18.72, meaning volatility has been continuously tightening—this often precedes a directional breakout.
3. Market Sentiment Analysis
Ethereum’s current market sentiment is relatively complex. On the positive side, Vitalik Buterin recently stated clearly that the Hegotá upgrade in 2027 will be Ethereum’s last regular hard fork; after that, the development focus will shift toward recursive STARK proofs and quantum-safe cryptography. This statement provides a clear long-term vision for Ethereum’s technical roadmap, positioning Ethereum as a computing platform for the encrypted world—integrating blockchain, zero-knowledge proofs, and decentralized off-chain components. This grand narrative offers strong confidence support for long-term holders.
On the risk side, the on-chain selling pressure triggered by Bitget’s $387.5 million hacker incident is still being worked through. The attacker swapped the stolen ETH through decentralized protocols such as THORChain into BTC, bringing persistent sell pressure to the Ethereum network. Yet despite this pressure, Ethereum’s price has stayed above $2,600, indicating the market’s ability to absorb supply remains relatively sufficient.
In addition, tokenized stocks’ trading volume on the Base chain has surpassed $1 billion. Seven tokenized U.S. stocks have been listed on Aave V4 as collateral, and Ethereum’s DeFi infrastructure continues to expand. The upgrade of Chainlink CCIP 2.0 provides enterprise-level customizable capabilities for cross-chain security, further strengthening Ethereum’s core position in decentralized finance.
On the macro level, rising U.S. Treasury yields and heightened geopolitical tension put pressure on the overall crypto market. However, Ethereum has shown stronger resilience relative to Bitcoin; with continued institutional inflows supporting it, the ETH/BTC ratio has the potential to stabilize and rebound.
Overall, Ethereum is in a short-term sideways consolidation phase. The bullish MACD signals and mildly bullish RSI condition provide a technical foundation for a future breakout. Investors are advised to watch the Bollinger Band lower support at $2,637 and the upper resistance at $2,710, and to patiently wait for the direction to be chosen.
Hot Token Quick View:
NMR (Numeraire): Current price $13.64, 24h increase +29.78%
MARSCOIN: Current price $0.1571, 24h increase +26.59%
HBAR (Hedera): Current price $0.1208, 24h increase +25.31%
#Ethereum #DeFi #Hegota
1. Price Trend Analysis
As of early September 29 Beijing time, Ethereum’s spot price is $2,691. In the past 24 hours, it has been consolidating in a tight range of $2,667 to $2,694. From the hourly K-line charts, the most recent five candles show mild fluctuations and a sideways pattern. Price has remained near the 7-day moving average, suggesting the market is waiting for a new catalyst to break the current equilibrium.
From the funding perspective, Ethereum spot ETFs recorded an estimated net inflow of about $690 million last week. Meanwhile, enterprise-level wallets increased holdings by more than 17,000 ETH during the same period, indicating institutional investors still remain optimistic about Ethereum’s long-term prospects. However, on-chain data shows there has been sustained net capital outflow recently, which is related to the Bitget hacker incident—where the attacker sold ETH via decentralized protocols. This has created some short-term downward pressure on price.
According to the Bollinger Bands indicator, the upper band is around $2,709, the middle band around $2,673, and the lower band around $2,637. The current price is trading between the middle and upper bands, placing it in a relatively bullish zone overall. However, resistance at the upper band is fairly evident; in the short term, price needs to break above $2,710 to open up room for further upside.
2. Interpretation of Technical Indicators
From the composite signal indicators perspective, among 15 factors, 5 are issuing long signals (33.3%), 9 are issuing short signals (60%), and 1 remains neutral. Although the short-term factors are skewed bearish, the composite indicator value is still positive, and the overall signal direction is bullish. The historical win rate is 78.57%, suggesting that the long-term technical outlook still favors the bulls.
Moving average system: The 7-day moving average is around $2,684, and the 25-day moving average around $2,670. The short-term moving averages are positioned above the long-term moving averages, maintaining a bullish alignment. The 99-day moving average is around $2,686, roughly matching the current price. Whether price can hold or lose this level will determine the short-term direction.
The MACD indicator shows encouraging signals: the fast line is about 2.63, the slow line about 0.64, and the histogram around 1.99. MACD has been running above the zero axis, and both the fast and slow lines are diverging upward—an典型 signal that bullish momentum is strengthening. Although the histogram has narrowed slightly compared with the prior value, the overall trend remains positive.
For the RSI indicator: the 6-period RSI is about 54.20, the 12-period RSI about 53.33, and the 24-period RSI about 51.37. All three lines are above 50, indicating a mild bullish market condition. Notably, RSI previously rebounded strongly from the oversold zone (around 21) to near 56, which suggests bottom-fishing capital has strong willingness to enter.
In the KDJ indicator, the K value is about 45.37, D about 49.94, and J about 36.23. The three lines are converging downward, implying some short-term adjustment pressure. Meanwhile, the ATR indicator has fallen from 20.72 to 18.72, meaning volatility has been continuously tightening—this often precedes a directional breakout.
3. Market Sentiment Analysis
Ethereum’s current market sentiment is relatively complex. On the positive side, Vitalik Buterin recently stated clearly that the Hegotá upgrade in 2027 will be Ethereum’s last regular hard fork; after that, the development focus will shift toward recursive STARK proofs and quantum-safe cryptography. This statement provides a clear long-term vision for Ethereum’s technical roadmap, positioning Ethereum as a computing platform for the encrypted world—integrating blockchain, zero-knowledge proofs, and decentralized off-chain components. This grand narrative offers strong confidence support for long-term holders.
On the risk side, the on-chain selling pressure triggered by Bitget’s $387.5 million hacker incident is still being worked through. The attacker swapped the stolen ETH through decentralized protocols such as THORChain into BTC, bringing persistent sell pressure to the Ethereum network. Yet despite this pressure, Ethereum’s price has stayed above $2,600, indicating the market’s ability to absorb supply remains relatively sufficient.
In addition, tokenized stocks’ trading volume on the Base chain has surpassed $1 billion. Seven tokenized U.S. stocks have been listed on Aave V4 as collateral, and Ethereum’s DeFi infrastructure continues to expand. The upgrade of Chainlink CCIP 2.0 provides enterprise-level customizable capabilities for cross-chain security, further strengthening Ethereum’s core position in decentralized finance.
On the macro level, rising U.S. Treasury yields and heightened geopolitical tension put pressure on the overall crypto market. However, Ethereum has shown stronger resilience relative to Bitcoin; with continued institutional inflows supporting it, the ETH/BTC ratio has the potential to stabilize and rebound.
Overall, Ethereum is in a short-term sideways consolidation phase. The bullish MACD signals and mildly bullish RSI condition provide a technical foundation for a future breakout. Investors are advised to watch the Bollinger Band lower support at $2,637 and the upper resistance at $2,710, and to patiently wait for the direction to be chosen.
Hot Token Quick View:
NMR (Numeraire): Current price $13.64, 24h increase +29.78%
MARSCOIN: Current price $0.1571, 24h increase +26.59%
HBAR (Hedera): Current price $0.1208, 24h increase +25.31%
#Ethereum #DeFi #Hegota
94

·
--
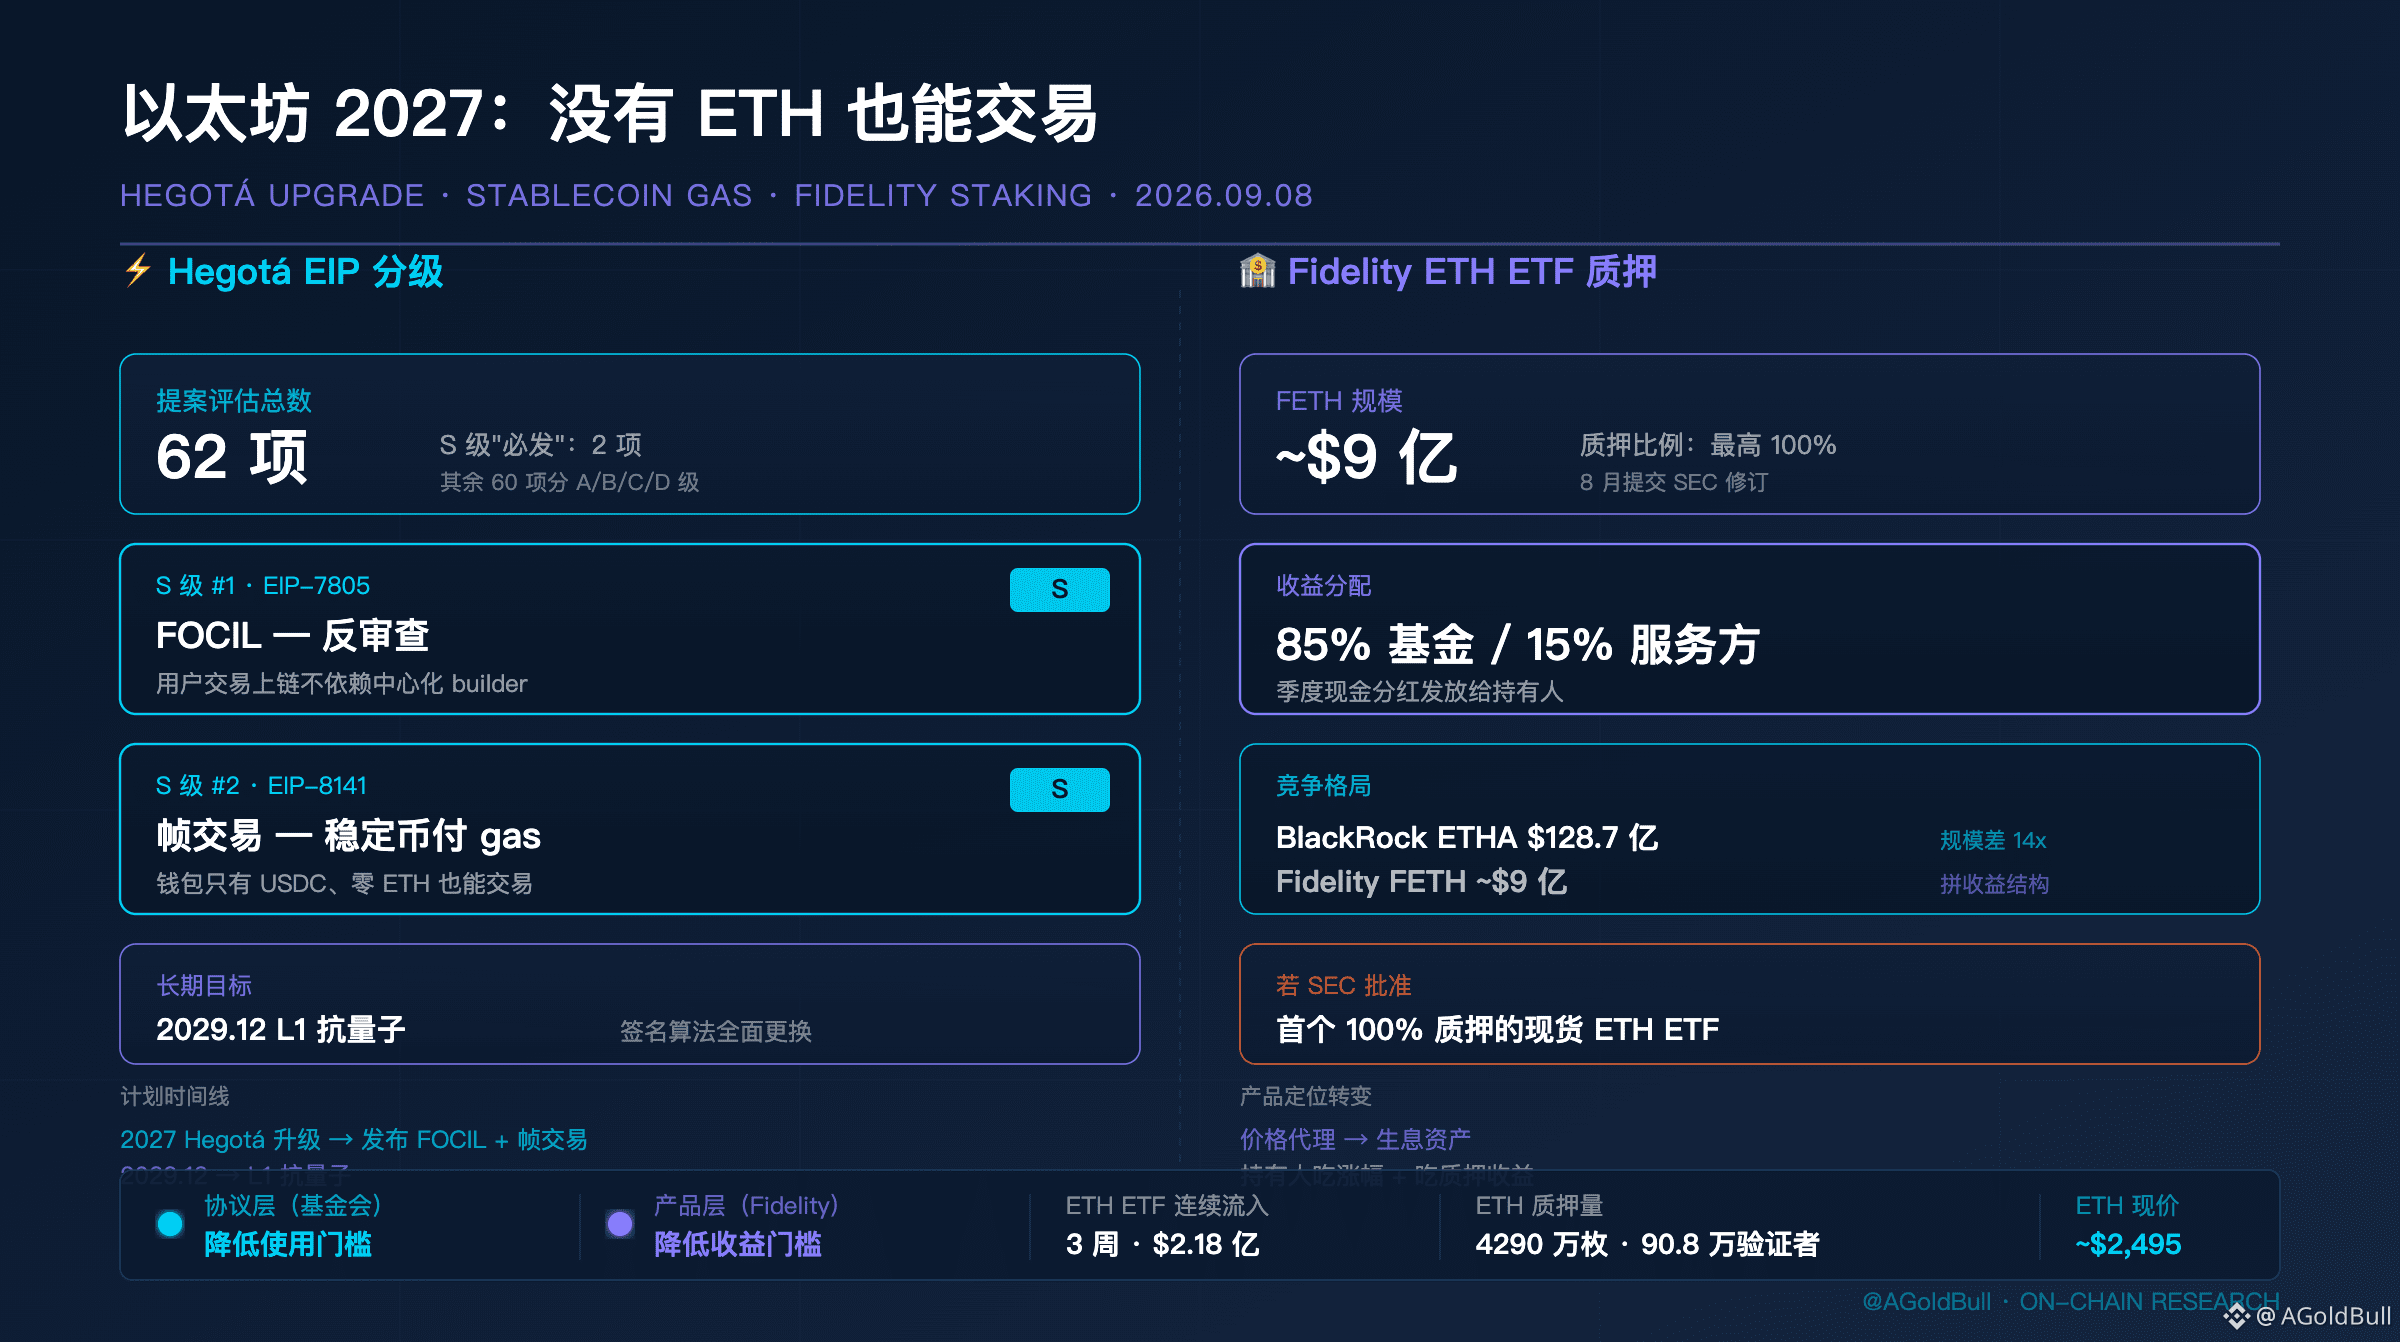
The Ethereum Foundation has just issued a grading table for 62 proposals.
Only two received S grade—"must do".
One is about censorship resistance.
One is about changing gas.
---
S grade #1: FOCIL (EIP-7805).
A censorship-resistance proposal.
Give every user an on-chain transaction route that does not depend on centralized builders.
On today’s Ethereum, whether transactions can be included on-chain depends largely on whether builders are willing to package them.
That’s what FOCIL aims to change.
---
S grade #2: Frame Transactions (EIP-8141).
This one is closer to ordinary people.
It lets you pay gas fees with stablecoins.
No need to hold ETH.
---
How is that done?
Your app or a third-party wallet front-loads the ETH gas fee for you, then charges you stablecoins.
Even if your wallet only has USDC and zero ETH, you can still transact on Ethereum.
Planned for the 2027 Hegotá upgrade.
---
Over the past decade, the first step for using Ethereum was buying ETH.
Going forward, the first step might just be holding USDC.
---
But there’s a problem.
If paying for gas doesn’t necessarily require ETH, does the ETH value-capture mechanism get weakened?
Some say it won’t—gas is still settled in ETH in the end, it’s just that users don’t pay directly.
The application layer absorbs the "visibility" of ETH, but the underlying consumption is still ETH.
---
The Ethereum Foundation also set a longer-term goal.
By December 2029, achieve L1 post-quantum readiness.
If quantum computing matures, today’s signature algorithms could be cracked.
Ethereum needs to replace its foundations before then.
From FOCIL to frame transactions to post-quantum security.
From censorship resistance to user experience, down to underlying safety.
---
On the same day, Fidelity was also moving.
Not upgrading code—upgrading products.
Fidelity filed a revised submission with the SEC, seeking to add staking to its spot Ethereum ETF (FETH).
Staking ratio: up to 100%.
Revenue allocation: 85% to the fund, 15% to the service provider.
Distribution method: quarterly cash dividends.
---
If the SEC approves it, this would be the first spot ETH ETF allowed to stake 100%.
Holders wouldn’t just benefit from ETH price appreciation.
They’d also earn staking rewards.
ETH ETFs would shift from "price proxies" to "yield-bearing assets".
---
BlackRock’s ETHA has already pulled in $12.8 billion.
Fidelity’s FETH is close to $900 million.
What the two firms are competing for isn’t just scale—it’s the revenue structure.
Who can help holders earn more wins.
---
The Ethereum Foundation is changing the protocol layer—so users can use Ethereum without needing ETH.
Fidelity is changing the product layer—so ETF holders can earn staking rewards even without staking.
---
The protocol layer is changing.
The product layer is changing.
ETH is still ETH.
But the people and scenarios it reaches are becoming more diverse.
$ETH #Ethereum #Hegota #EIP8141 #Fidelity
Not investment advice
The Ethereum Foundation has just issued a grading table for 62 proposals.
Only two received S grade—"must do".
One is about censorship resistance.
One is about changing gas.
---
S grade #1: FOCIL (EIP-7805).
A censorship-resistance proposal.
Give every user an on-chain transaction route that does not depend on centralized builders.
On today’s Ethereum, whether transactions can be included on-chain depends largely on whether builders are willing to package them.
That’s what FOCIL aims to change.
---
S grade #2: Frame Transactions (EIP-8141).
This one is closer to ordinary people.
It lets you pay gas fees with stablecoins.
No need to hold ETH.
---
How is that done?
Your app or a third-party wallet front-loads the ETH gas fee for you, then charges you stablecoins.
Even if your wallet only has USDC and zero ETH, you can still transact on Ethereum.
Planned for the 2027 Hegotá upgrade.
---
Over the past decade, the first step for using Ethereum was buying ETH.
Going forward, the first step might just be holding USDC.
---
But there’s a problem.
If paying for gas doesn’t necessarily require ETH, does the ETH value-capture mechanism get weakened?
Some say it won’t—gas is still settled in ETH in the end, it’s just that users don’t pay directly.
The application layer absorbs the "visibility" of ETH, but the underlying consumption is still ETH.
---
The Ethereum Foundation also set a longer-term goal.
By December 2029, achieve L1 post-quantum readiness.
If quantum computing matures, today’s signature algorithms could be cracked.
Ethereum needs to replace its foundations before then.
From FOCIL to frame transactions to post-quantum security.
From censorship resistance to user experience, down to underlying safety.
---
On the same day, Fidelity was also moving.
Not upgrading code—upgrading products.
Fidelity filed a revised submission with the SEC, seeking to add staking to its spot Ethereum ETF (FETH).
Staking ratio: up to 100%.
Revenue allocation: 85% to the fund, 15% to the service provider.
Distribution method: quarterly cash dividends.
---
If the SEC approves it, this would be the first spot ETH ETF allowed to stake 100%.
Holders wouldn’t just benefit from ETH price appreciation.
They’d also earn staking rewards.
ETH ETFs would shift from "price proxies" to "yield-bearing assets".
---
BlackRock’s ETHA has already pulled in $12.8 billion.
Fidelity’s FETH is close to $900 million.
What the two firms are competing for isn’t just scale—it’s the revenue structure.
Who can help holders earn more wins.
---
The Ethereum Foundation is changing the protocol layer—so users can use Ethereum without needing ETH.
Fidelity is changing the product layer—so ETF holders can earn staking rewards even without staking.
---
The protocol layer is changing.
The product layer is changing.
ETH is still ETH.
But the people and scenarios it reaches are becoming more diverse.
$ETH #Ethereum #Hegota #EIP8141 #Fidelity
Not investment advice
Only two received S grade—"must do".
One is about censorship resistance.
One is about changing gas.
---
S grade #1: FOCIL (EIP-7805).
A censorship-resistance proposal.
Give every user an on-chain transaction route that does not depend on centralized builders.
On today’s Ethereum, whether transactions can be included on-chain depends largely on whether builders are willing to package them.
That’s what FOCIL aims to change.
---
S grade #2: Frame Transactions (EIP-8141).
This one is closer to ordinary people.
It lets you pay gas fees with stablecoins.
No need to hold ETH.
---
How is that done?
Your app or a third-party wallet front-loads the ETH gas fee for you, then charges you stablecoins.
Even if your wallet only has USDC and zero ETH, you can still transact on Ethereum.
Planned for the 2027 Hegotá upgrade.
---
Over the past decade, the first step for using Ethereum was buying ETH.
Going forward, the first step might just be holding USDC.
---
But there’s a problem.
If paying for gas doesn’t necessarily require ETH, does the ETH value-capture mechanism get weakened?
Some say it won’t—gas is still settled in ETH in the end, it’s just that users don’t pay directly.
The application layer absorbs the "visibility" of ETH, but the underlying consumption is still ETH.
---
The Ethereum Foundation also set a longer-term goal.
By December 2029, achieve L1 post-quantum readiness.
If quantum computing matures, today’s signature algorithms could be cracked.
Ethereum needs to replace its foundations before then.
From FOCIL to frame transactions to post-quantum security.
From censorship resistance to user experience, down to underlying safety.
---
On the same day, Fidelity was also moving.
Not upgrading code—upgrading products.
Fidelity filed a revised submission with the SEC, seeking to add staking to its spot Ethereum ETF (FETH).
Staking ratio: up to 100%.
Revenue allocation: 85% to the fund, 15% to the service provider.
Distribution method: quarterly cash dividends.
---
If the SEC approves it, this would be the first spot ETH ETF allowed to stake 100%.
Holders wouldn’t just benefit from ETH price appreciation.
They’d also earn staking rewards.
ETH ETFs would shift from "price proxies" to "yield-bearing assets".
---
BlackRock’s ETHA has already pulled in $12.8 billion.
Fidelity’s FETH is close to $900 million.
What the two firms are competing for isn’t just scale—it’s the revenue structure.
Who can help holders earn more wins.
---
The Ethereum Foundation is changing the protocol layer—so users can use Ethereum without needing ETH.
Fidelity is changing the product layer—so ETF holders can earn staking rewards even without staking.
---
The protocol layer is changing.
The product layer is changing.
ETH is still ETH.
But the people and scenarios it reaches are becoming more diverse.
$ETH #Ethereum #Hegota #EIP8141 #Fidelity
Not investment advice
117

·
--
The end of the familiar Ethereum era is near.
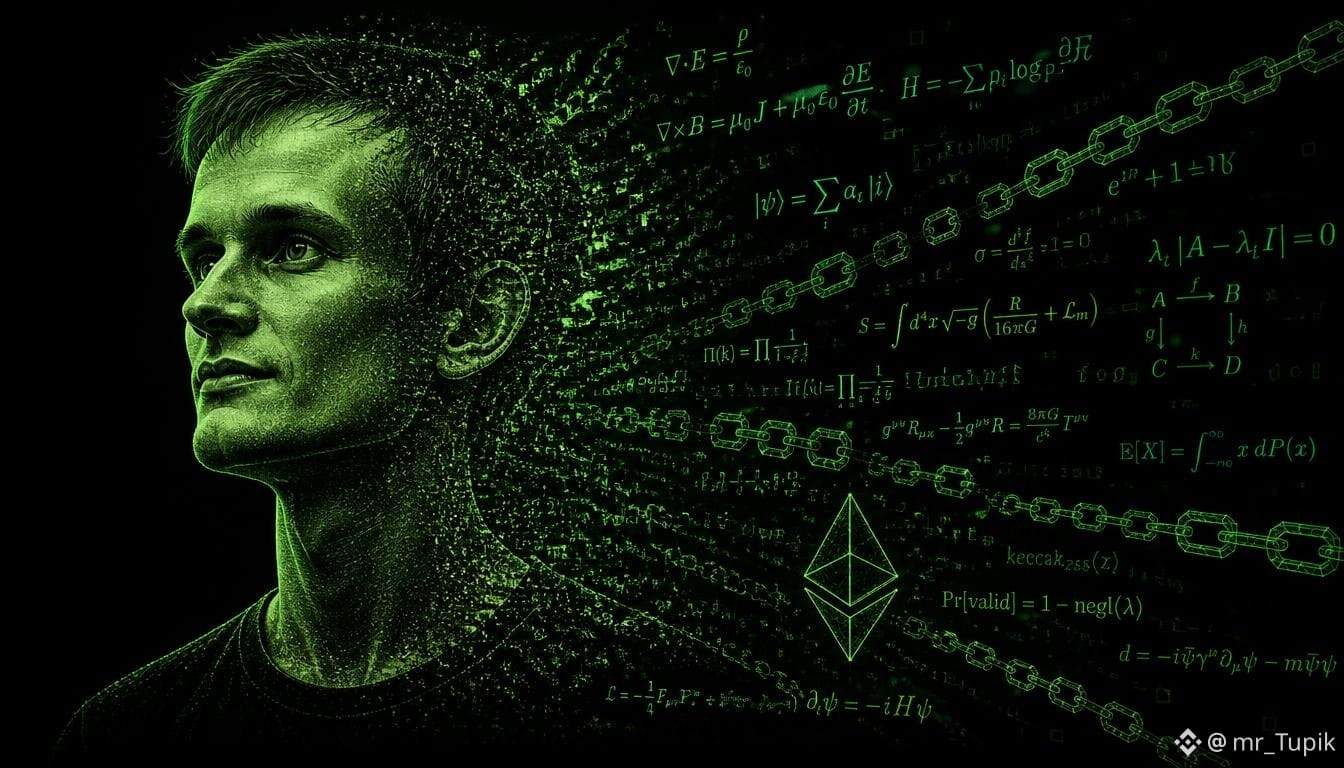
Vitalik Buterin announced that the hard fork Hegota planned for 2027 will be the last “normal” network upgrade. After that, the old blockchain will finally transform into the most complex decentralized cryptographic mechanism, where faceless proofs and hidden computations will rule instead of routine transactions. Developers will have to pay for code structure, and the familiar transparency will dissolve into advanced encryption. The network will mutate, forever leaving behind the classic technologies of 2015. A new era of complete uncertainty is dawning.
#Ethereum #VitalikButerin #HEGOTA #cryptofuture #BlockchainMutation
The end of the familiar Ethereum era is near.
Vitalik Buterin announced that the hard fork Hegota planned for 2027 will be the last “normal” network upgrade. After that, the old blockchain will finally transform into the most complex decentralized cryptographic mechanism, where faceless proofs and hidden computations will rule instead of routine transactions. Developers will have to pay for code structure, and the familiar transparency will dissolve into advanced encryption. The network will mutate, forever leaving behind the classic technologies of 2015. A new era of complete uncertainty is dawning.
#Ethereum #VitalikButerin #HEGOTA #cryptofuture #BlockchainMutation
Vitalik Buterin announced that the hard fork Hegota planned for 2027 will be the last “normal” network upgrade. After that, the old blockchain will finally transform into the most complex decentralized cryptographic mechanism, where faceless proofs and hidden computations will rule instead of routine transactions. Developers will have to pay for code structure, and the familiar transparency will dissolve into advanced encryption. The network will mutate, forever leaving behind the classic technologies of 2015. A new era of complete uncertainty is dawning.
#Ethereum #VitalikButerin #HEGOTA #cryptofuture #BlockchainMutation
1
393

·
--
🧑 ETHEREUM INSTITUTIONAL BACKS PLAN TO CUT BLOCK TIMES FROM 12 TO 10 SECONDS
Ethereum Institutional has backed Ethlabs’ push to make Ethereum faster, supporting EIP-8198, also known as “Quick Slots.”
The proposal would initially reduce Ethereum’s block time from 12 seconds to 10 seconds, shortening transaction confirmation times and making onchain markets more responsive. Ethlabs also wants the protocol to support further block-time reductions through a configurable parameter rather than requiring another major upgrade.
EIP-8198 was proposed for inclusion in Ethereum’s upcoming Hegotá upgrade, but it remains under consideration and still requires implementation and testing.
The push comes as Ethereum faces growing competition from faster networks and more institutional activity moving onchain.
Could shorter block times improve Ethereum’s competitiveness without compromising decentralization? 👀
#Ethereum #ETH #HEGOTA #blockchain
#ThuyBNB
$ETH $BTC $BNB
🧑 ETHEREUM INSTITUTIONAL BACKS PLAN TO CUT BLOCK TIMES FROM 12 TO 10 SECONDS
Ethereum Institutional has backed Ethlabs’ push to make Ethereum faster, supporting EIP-8198, also known as “Quick Slots.”
The proposal would initially reduce Ethereum’s block time from 12 seconds to 10 seconds, shortening transaction confirmation times and making onchain markets more responsive. Ethlabs also wants the protocol to support further block-time reductions through a configurable parameter rather than requiring another major upgrade.
EIP-8198 was proposed for inclusion in Ethereum’s upcoming Hegotá upgrade, but it remains under consideration and still requires implementation and testing.
The push comes as Ethereum faces growing competition from faster networks and more institutional activity moving onchain.
Could shorter block times improve Ethereum’s competitiveness without compromising decentralization? 👀
#Ethereum #ETH #HEGOTA #blockchain
#ThuyBNB
$ETH $BTC $BNB
Ethereum Institutional has backed Ethlabs’ push to make Ethereum faster, supporting EIP-8198, also known as “Quick Slots.”
The proposal would initially reduce Ethereum’s block time from 12 seconds to 10 seconds, shortening transaction confirmation times and making onchain markets more responsive. Ethlabs also wants the protocol to support further block-time reductions through a configurable parameter rather than requiring another major upgrade.
EIP-8198 was proposed for inclusion in Ethereum’s upcoming Hegotá upgrade, but it remains under consideration and still requires implementation and testing.
The push comes as Ethereum faces growing competition from faster networks and more institutional activity moving onchain.
Could shorter block times improve Ethereum’s competitiveness without compromising decentralization? 👀
#Ethereum #ETH #HEGOTA #blockchain
#ThuyBNB
$ETH $BTC $BNB
63

·
--
🚨$ETH Next Big Upgrade?
Ethereum developers have scheduled EIP-8141 “Frame Transactions” for the upcoming Hegotá upgrade, currently expected in 2027.
So, what changes?
🔹 Pay gas with stablecoins/ERC-20s — potentially without holding ETH
🔹 Batch multiple actions — like approve + swap in one atomic transaction
🔹 Flexible wallet security — security rules could be changed without changing your wallet address
🔹 Native account abstraction — transaction validation, gas payment, and execution become programmable.
This could make Ethereum simpler, more flexible, and more user-friendly.
⚠️ Important: EIP-8141 is still a draft, so the design can change before Hegotá reaches mainnet.
👀 Could Frame Transactions be a major step toward mainstream Ethereum adoption?
#Ethereum #ETH #EIP8141 #Hegota #FrameTransactions
🚨$ETH Next Big Upgrade?
Ethereum developers have scheduled EIP-8141 “Frame Transactions” for the upcoming Hegotá upgrade, currently expected in 2027.
So, what changes?
🔹 Pay gas with stablecoins/ERC-20s — potentially without holding ETH
🔹 Batch multiple actions — like approve + swap in one atomic transaction
🔹 Flexible wallet security — security rules could be changed without changing your wallet address
🔹 Native account abstraction — transaction validation, gas payment, and execution become programmable.
This could make Ethereum simpler, more flexible, and more user-friendly.
⚠️ Important: EIP-8141 is still a draft, so the design can change before Hegotá reaches mainnet.
👀 Could Frame Transactions be a major step toward mainstream Ethereum adoption?
#Ethereum #ETH #EIP8141 #Hegota #FrameTransactions
Ethereum developers have scheduled EIP-8141 “Frame Transactions” for the upcoming Hegotá upgrade, currently expected in 2027.
So, what changes?
🔹 Pay gas with stablecoins/ERC-20s — potentially without holding ETH
🔹 Batch multiple actions — like approve + swap in one atomic transaction
🔹 Flexible wallet security — security rules could be changed without changing your wallet address
🔹 Native account abstraction — transaction validation, gas payment, and execution become programmable.
This could make Ethereum simpler, more flexible, and more user-friendly.
⚠️ Important: EIP-8141 is still a draft, so the design can change before Hegotá reaches mainnet.
👀 Could Frame Transactions be a major step toward mainstream Ethereum adoption?
#Ethereum #ETH #EIP8141 #Hegota #FrameTransactions

37
·
--
Bullish
⚡️ Ethereum is approaching a new generation of wallets and transactions
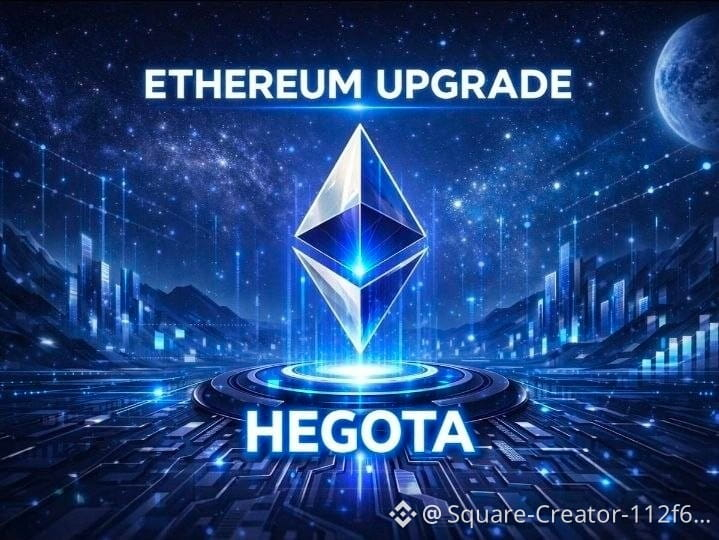
Ethereum developers have scheduled EIP-8141 (Frame Transactions) as part of the planned Hegotá upgrade in 2027.
🔹 Applications can pay gas fees on behalf of users
🔹 More flexible transaction execution and the ability to bundle multiple steps into a single transaction
🔹 Support for upgradable authentication mechanisms, paving the way for protection against quantum computing threats
🔹 Wallets may become more similar to traditional apps in terms of ease of use
And most importantly, Ethereum is not only working to improve the user experience, but also building cryptographic flexibility that helps the network prepare for the post–traditional encryption era.
📌 EIP-8141 could be one of the most important steps toward making Ethereum easier, safer, and more ready for the future.
#Ethereum #EIP8141 #HEGOTA
#Crypto #Web3
⚡️ Ethereum is approaching a new generation of wallets and transactions
Ethereum developers have scheduled EIP-8141 (Frame Transactions) as part of the planned Hegotá upgrade in 2027.
🔹 Applications can pay gas fees on behalf of users
🔹 More flexible transaction execution and the ability to bundle multiple steps into a single transaction
🔹 Support for upgradable authentication mechanisms, paving the way for protection against quantum computing threats
🔹 Wallets may become more similar to traditional apps in terms of ease of use
And most importantly, Ethereum is not only working to improve the user experience, but also building cryptographic flexibility that helps the network prepare for the post–traditional encryption era.
📌 EIP-8141 could be one of the most important steps toward making Ethereum easier, safer, and more ready for the future.
#Ethereum #EIP8141 #HEGOTA
#Crypto #Web3
Ethereum developers have scheduled EIP-8141 (Frame Transactions) as part of the planned Hegotá upgrade in 2027.
🔹 Applications can pay gas fees on behalf of users
🔹 More flexible transaction execution and the ability to bundle multiple steps into a single transaction
🔹 Support for upgradable authentication mechanisms, paving the way for protection against quantum computing threats
🔹 Wallets may become more similar to traditional apps in terms of ease of use
And most importantly, Ethereum is not only working to improve the user experience, but also building cryptographic flexibility that helps the network prepare for the post–traditional encryption era.
📌 EIP-8141 could be one of the most important steps toward making Ethereum easier, safer, and more ready for the future.
#Ethereum #EIP8141 #HEGOTA
#Crypto #Web3
3
141

·
--
Big privacy move incoming!
EIP-8182 proposed for Hegota upgrade (H2 2026) — Native shielded transfers for ETH & ERC-20 tokens using ZK proofs.
No more fragmented privacy tools. One protocol-level privacy pool on Ethereum mainnet 👀
Ethereum getting serious about on-chain privacy!
Who’s bullish on this? 🔒
#Ethereum #Hegota #Privacy #EIP8182 #EthereumHegotaUpgradePrivacyTransfers
$ETH
{future}(ETHUSDT)
$DRIFT
{future}(DRIFTUSDT)
$PHA
{future}(PHAUSDT)
Big privacy move incoming!
EIP-8182 proposed for Hegota upgrade (H2 2026) — Native shielded transfers for ETH & ERC-20 tokens using ZK proofs.
No more fragmented privacy tools. One protocol-level privacy pool on Ethereum mainnet 👀
Ethereum getting serious about on-chain privacy!
Who’s bullish on this? 🔒
#Ethereum #Hegota #Privacy #EIP8182 #EthereumHegotaUpgradePrivacyTransfers
$ETH
$DRIFT
$PHA
EIP-8182 proposed for Hegota upgrade (H2 2026) — Native shielded transfers for ETH & ERC-20 tokens using ZK proofs.
No more fragmented privacy tools. One protocol-level privacy pool on Ethereum mainnet 👀
Ethereum getting serious about on-chain privacy!
Who’s bullish on this? 🔒
#Ethereum #Hegota #Privacy #EIP8182 #EthereumHegotaUpgradePrivacyTransfers
$ETH
$DRIFT
$PHA
1
170

·
--
#EthereumHegotaUpgradePrivacyTransfers
Ethereum’s Hegota Upgrade: The Dawn of Native L1 Privacy 🛡️
Ethereum is moving beyond simple scalability. The Hegota hard fork, scheduled for the second half of 2026, is officially shifting the spotlight to native L1 privacy.
While previous privacy tools were fragmented and complex, Hegota aims to integrate privacy directly into the protocol stack.
The Hegota Privacy Stack 🧱
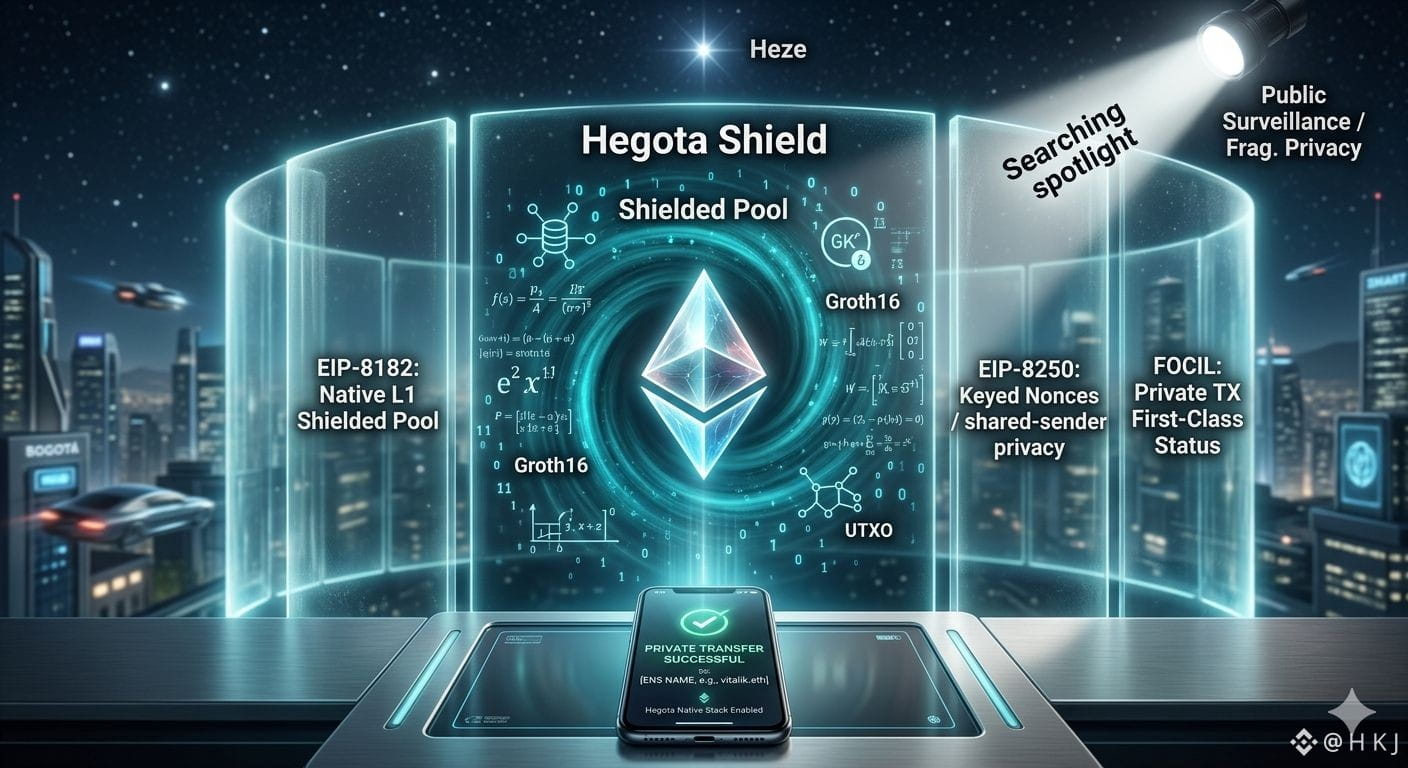
Protocol-Level Shielded Pools (EIP-8182): A proposal to introduce native private transfers for $ETH and ERC-20 tokens. It uses a UTXO architecture and Groth16 zero-knowledge proofs, eliminating the need for admin keys or proxy contracts.
Keyed Nonces (EIP-8250): Designed to support shared-sender privacy models, allowing multiple users to withdraw from a shared sender simultaneously without replay conflicts.
FOCIL + Account Abstraction: This combination ensures that private transactions are treated as "first-class citizens," preventing validators from selectively censoring or delaying them.
Kohaku: Work on the access layer to close side-channel leaks, ensuring that private application-layer data stays truly private.
Why It Matters 🚀
Unified Anonymity: Instead of many small, fragmented privacy pools, EIP-8182 creates one massive, shared anonymity set for all wallets and applications.
Seamless UX: Users can send private transfers directly to existing Ethereum addresses or ENS names without needing special privacy-only addresses.
True "Moneyness": Native privacy restores fungibility to ETH, allowing for private DeFi, untraceable payments, and regulatory-friendly private stablecoins.
The Bottom Line: Hegota is turning Ethereum from a public ledger into a secure, private financial powerhouse.
#ETH #Hegota #Ethereum #Privacy #ZKProofs #Web3
#EthereumHegotaUpgradePrivacyTransfers
Ethereum’s Hegota Upgrade: The Dawn of Native L1 Privacy 🛡️
Ethereum is moving beyond simple scalability. The Hegota hard fork, scheduled for the second half of 2026, is officially shifting the spotlight to native L1 privacy.
While previous privacy tools were fragmented and complex, Hegota aims to integrate privacy directly into the protocol stack.
The Hegota Privacy Stack 🧱
Protocol-Level Shielded Pools (EIP-8182): A proposal to introduce native private transfers for $ETH and ERC-20 tokens. It uses a UTXO architecture and Groth16 zero-knowledge proofs, eliminating the need for admin keys or proxy contracts.
Keyed Nonces (EIP-8250): Designed to support shared-sender privacy models, allowing multiple users to withdraw from a shared sender simultaneously without replay conflicts.
FOCIL + Account Abstraction: This combination ensures that private transactions are treated as "first-class citizens," preventing validators from selectively censoring or delaying them.
Kohaku: Work on the access layer to close side-channel leaks, ensuring that private application-layer data stays truly private.
Why It Matters 🚀
Unified Anonymity: Instead of many small, fragmented privacy pools, EIP-8182 creates one massive, shared anonymity set for all wallets and applications.
Seamless UX: Users can send private transfers directly to existing Ethereum addresses or ENS names without needing special privacy-only addresses.
True "Moneyness": Native privacy restores fungibility to ETH, allowing for private DeFi, untraceable payments, and regulatory-friendly private stablecoins.
The Bottom Line: Hegota is turning Ethereum from a public ledger into a secure, private financial powerhouse.
#ETH #Hegota #Ethereum #Privacy #ZKProofs #Web3
Ethereum’s Hegota Upgrade: The Dawn of Native L1 Privacy 🛡️
Ethereum is moving beyond simple scalability. The Hegota hard fork, scheduled for the second half of 2026, is officially shifting the spotlight to native L1 privacy.
While previous privacy tools were fragmented and complex, Hegota aims to integrate privacy directly into the protocol stack.
The Hegota Privacy Stack 🧱
Protocol-Level Shielded Pools (EIP-8182): A proposal to introduce native private transfers for $ETH and ERC-20 tokens. It uses a UTXO architecture and Groth16 zero-knowledge proofs, eliminating the need for admin keys or proxy contracts.
Keyed Nonces (EIP-8250): Designed to support shared-sender privacy models, allowing multiple users to withdraw from a shared sender simultaneously without replay conflicts.
FOCIL + Account Abstraction: This combination ensures that private transactions are treated as "first-class citizens," preventing validators from selectively censoring or delaying them.
Kohaku: Work on the access layer to close side-channel leaks, ensuring that private application-layer data stays truly private.
Why It Matters 🚀
Unified Anonymity: Instead of many small, fragmented privacy pools, EIP-8182 creates one massive, shared anonymity set for all wallets and applications.
Seamless UX: Users can send private transfers directly to existing Ethereum addresses or ENS names without needing special privacy-only addresses.
True "Moneyness": Native privacy restores fungibility to ETH, allowing for private DeFi, untraceable payments, and regulatory-friendly private stablecoins.
The Bottom Line: Hegota is turning Ethereum from a public ledger into a secure, private financial powerhouse.
#ETH #Hegota #Ethereum #Privacy #ZKProofs #Web3
42


Vitalik Buterin says Ethereum smart sccounts could launch within a year
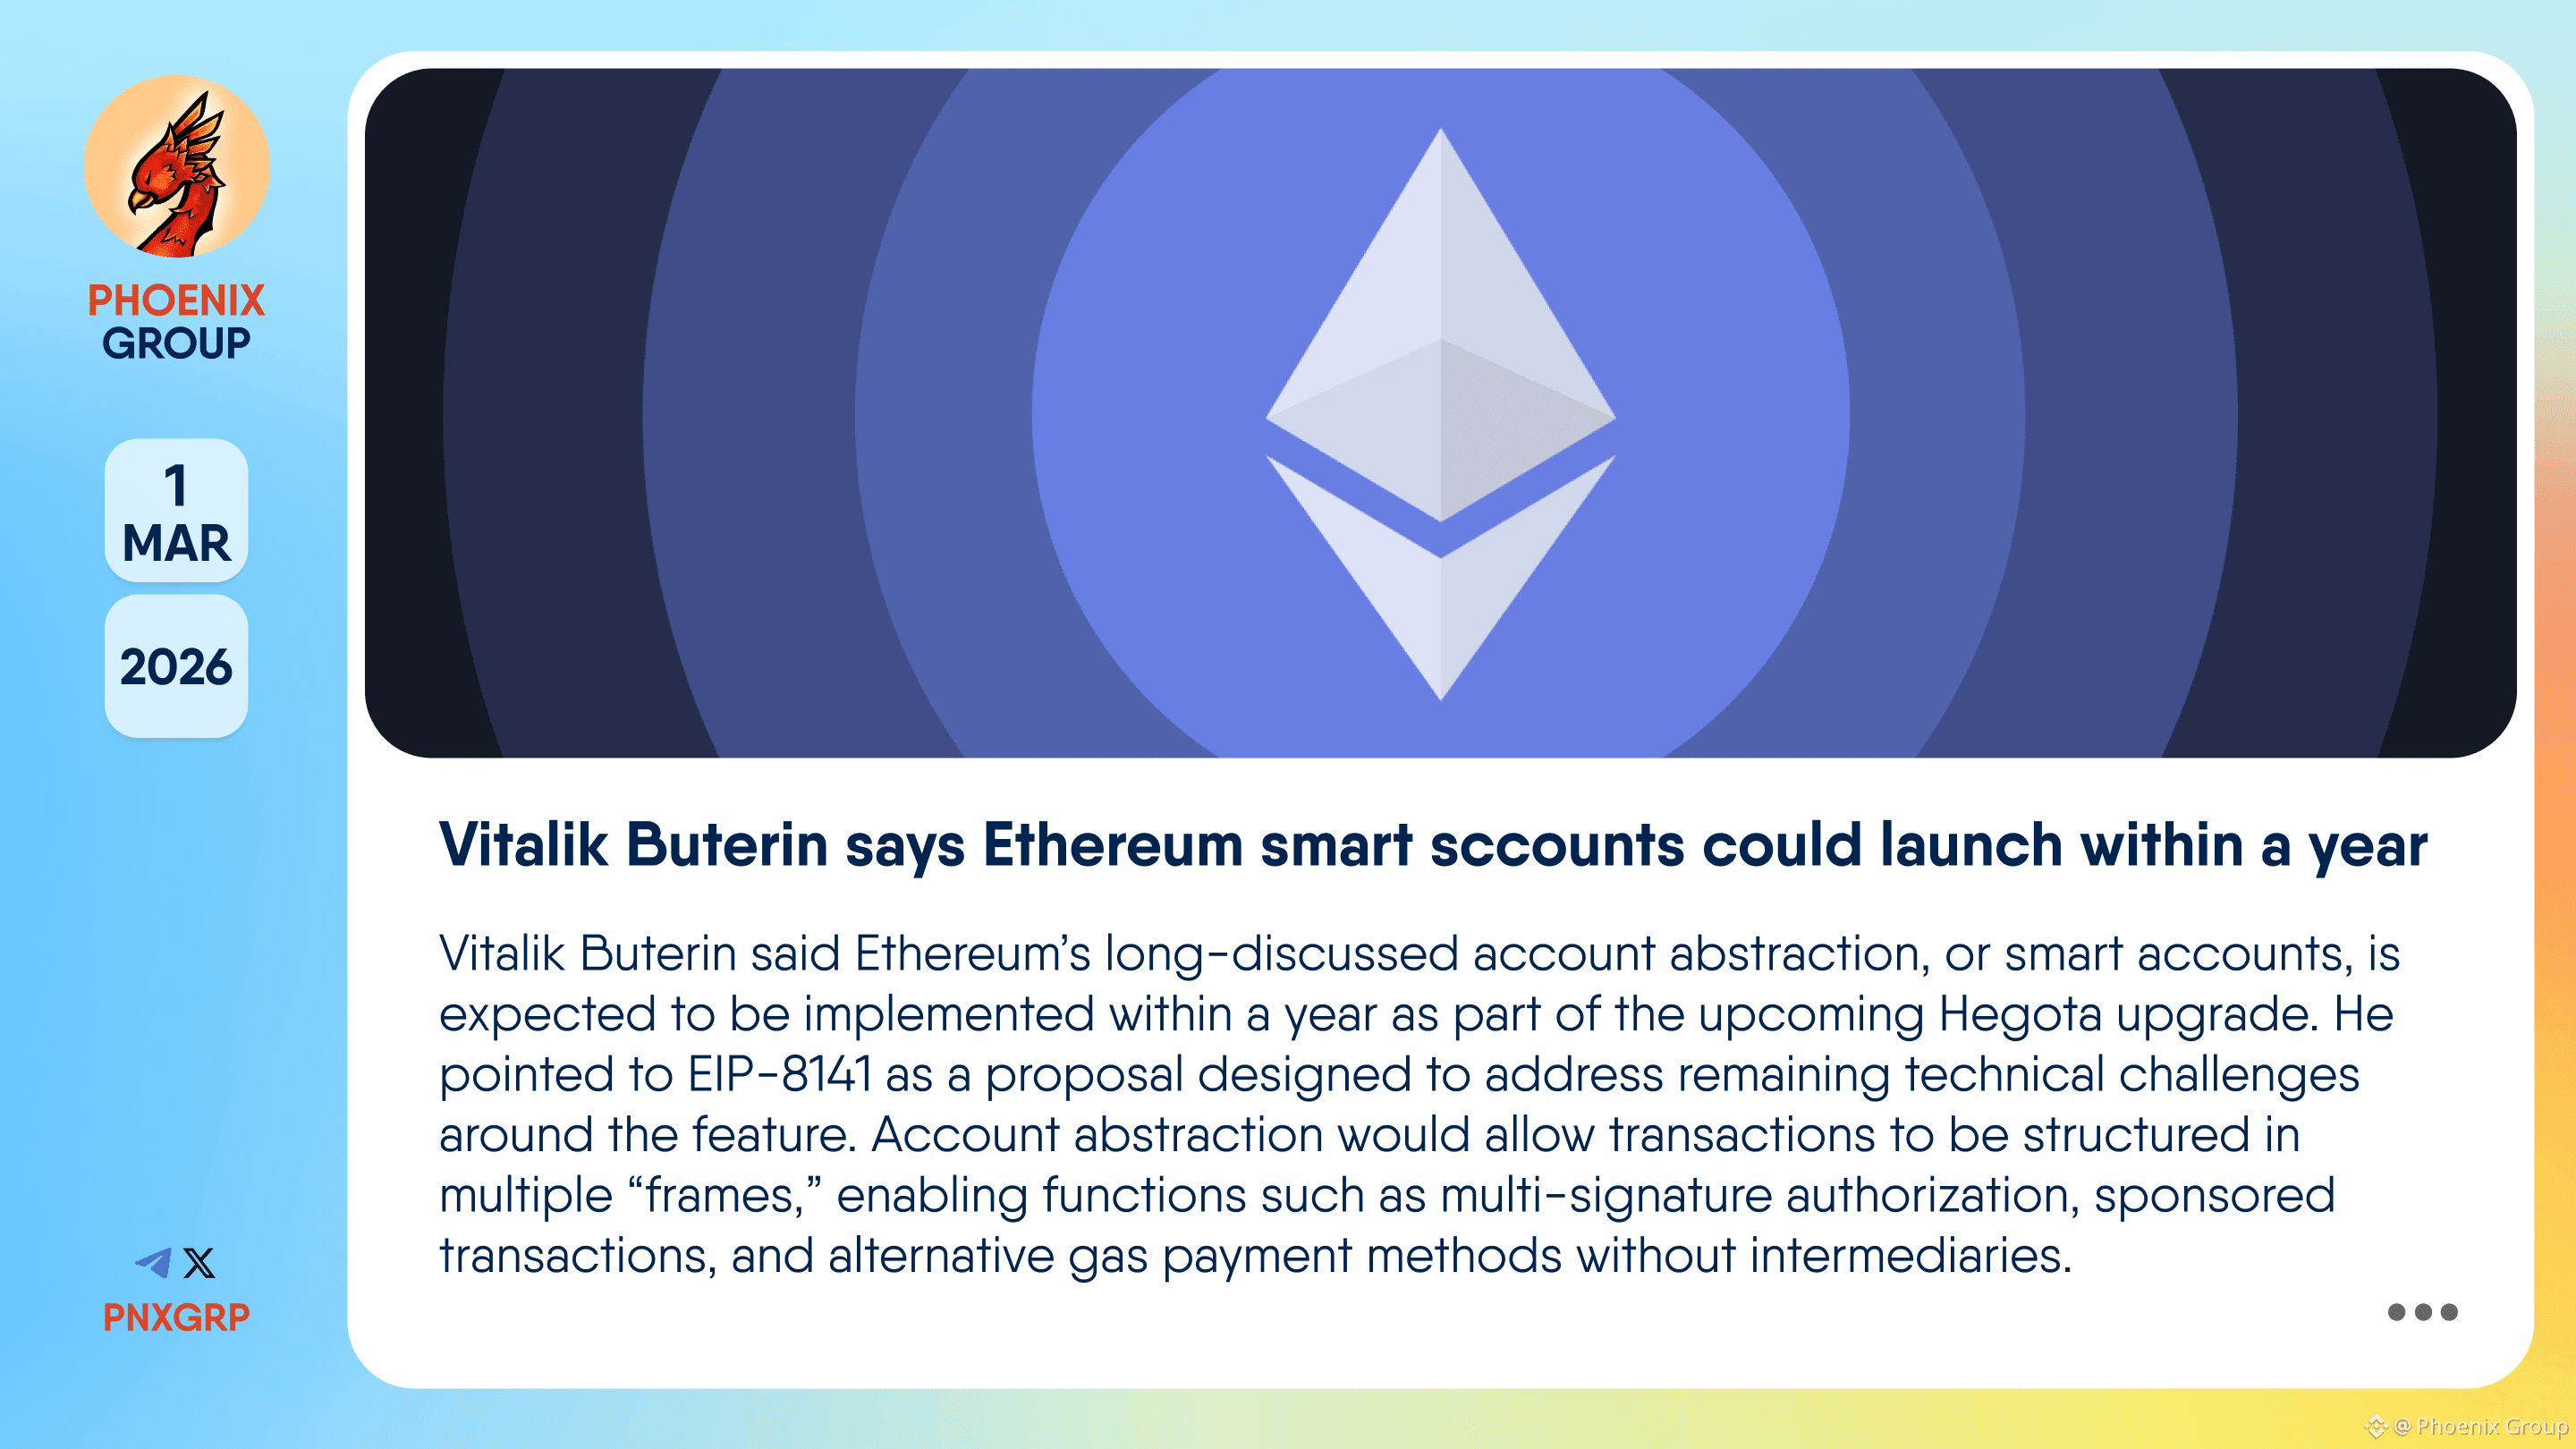
Vitalik Buterin said #Ethereum ’s long-discussed account abstraction, or smart accounts, is expected to be implemented within a year as part of the upcoming #Hegota upgrade. He pointed to EIP-8141 as a proposal designed to address remaining technical challenges around the feature.
Account abstraction would allow transactions to be structured in multiple “frames,” enabling functions such as multi-signature authorization, sponsored transactions, and alternative gas payment methods without intermediaries.
Vitalik Buterin says Ethereum smart sccounts could launch within a year
Vitalik Buterin said #Ethereum ’s long-discussed account abstraction, or smart accounts, is expected to be implemented within a year as part of the upcoming #Hegota upgrade. He pointed to EIP-8141 as a proposal designed to address remaining technical challenges around the feature.
Account abstraction would allow transactions to be structured in multiple “frames,” enabling functions such as multi-signature authorization, sponsored transactions, and alternative gas payment methods without intermediaries.
Vitalik Buterin said #Ethereum ’s long-discussed account abstraction, or smart accounts, is expected to be implemented within a year as part of the upcoming #Hegota upgrade. He pointed to EIP-8141 as a proposal designed to address remaining technical challenges around the feature.
Account abstraction would allow transactions to be structured in multiple “frames,” enabling functions such as multi-signature authorization, sponsored transactions, and alternative gas payment methods without intermediaries.
3
661

🚨 ETH'S HEGOTÁ UPGRADE: 66 PROPOSALS BECOME THE PRIVACY BATTLEFIELD — WHICH SIDE WINS? 💥
Ethereum just narrowed 66 upgrade proposals down to the finalists, and the Hegotá fork is shaping up as a war over privacy and censorship resistance that could rewire how the network settles value. 🦈 On one side, stronger resilience means tighter blockspace demand — bulls read this as a structural demand unlock for $ETH that institutions can't ignore. 📊 On the other, implementation delays open a window for short-term volatility to shake out weak hands before the real move lands. 🔻
This isn't just another dev upgrade — it's existential positioning for Ethereum's role as the uncensorable settlement layer. 💡 Whatever this vote decides, liquidity reacts fast, and the market will front-run it early. 💬 Will Hegotá cement ETH's flight to quality, or is the skeptic timeline risk the hidden trap here? 👇
⚠️ Not financial advice. Always manage your risk. 🛡️
🏷️ #ETH #Ethereum #Hegota #PrivacyUpgrade #CryptoMarket
🔥 🦈
🚨 ETH'S HEGOTÁ UPGRADE: 66 PROPOSALS BECOME THE PRIVACY BATTLEFIELD — WHICH SIDE WINS? 💥
Ethereum just narrowed 66 upgrade proposals down to the finalists, and the Hegotá fork is shaping up as a war over privacy and censorship resistance that could rewire how the network settles value. 🦈 On one side, stronger resilience means tighter blockspace demand — bulls read this as a structural demand unlock for $ETH that institutions can't ignore. 📊 On the other, implementation delays open a window for short-term volatility to shake out weak hands before the real move lands. 🔻
This isn't just another dev upgrade — it's existential positioning for Ethereum's role as the uncensorable settlement layer. 💡 Whatever this vote decides, liquidity reacts fast, and the market will front-run it early. 💬 Will Hegotá cement ETH's flight to quality, or is the skeptic timeline risk the hidden trap here? 👇
⚠️ Not financial advice. Always manage your risk. 🛡️
🏷️ #ETH #Ethereum #Hegota #PrivacyUpgrade #CryptoMarket
🔥 🦈
Ethereum just narrowed 66 upgrade proposals down to the finalists, and the Hegotá fork is shaping up as a war over privacy and censorship resistance that could rewire how the network settles value. 🦈 On one side, stronger resilience means tighter blockspace demand — bulls read this as a structural demand unlock for $ETH that institutions can't ignore. 📊 On the other, implementation delays open a window for short-term volatility to shake out weak hands before the real move lands. 🔻
This isn't just another dev upgrade — it's existential positioning for Ethereum's role as the uncensorable settlement layer. 💡 Whatever this vote decides, liquidity reacts fast, and the market will front-run it early. 💬 Will Hegotá cement ETH's flight to quality, or is the skeptic timeline risk the hidden trap here? 👇
⚠️ Not financial advice. Always manage your risk. 🛡️
🏷️ #ETH #Ethereum #Hegota #PrivacyUpgrade #CryptoMarket
🔥 🦈
41

·
--
Bullish
100+ $ETH developers just met and finalized the roadmap that could 3x ETH from here.
Most people haven't read a single word about it.
$ETH Glamsterdam upgrade here's what's actually changing:
🔥 Gas fees: -78.6%
🔥 Speed: 10,000 TPS (10x current)
🔥 Gas limit: 60M → 200M
🔥 Block building: trustless and on-chain for the first time
🔥 Parallel execution: multiple transactions simultaneously
While retail watches meme coins smart money is HERE:
✅ All 10 ETH spot ETFs turned net positive simultaneously in April first time ever
✅ 6.45M ETH accumulated in 15 weeks by smart wallets
✅ Ethereum Foundation staked $93M of their own ETH
✅ Citi target: $3,175. Standard Chartered: $7,500.
The trade:
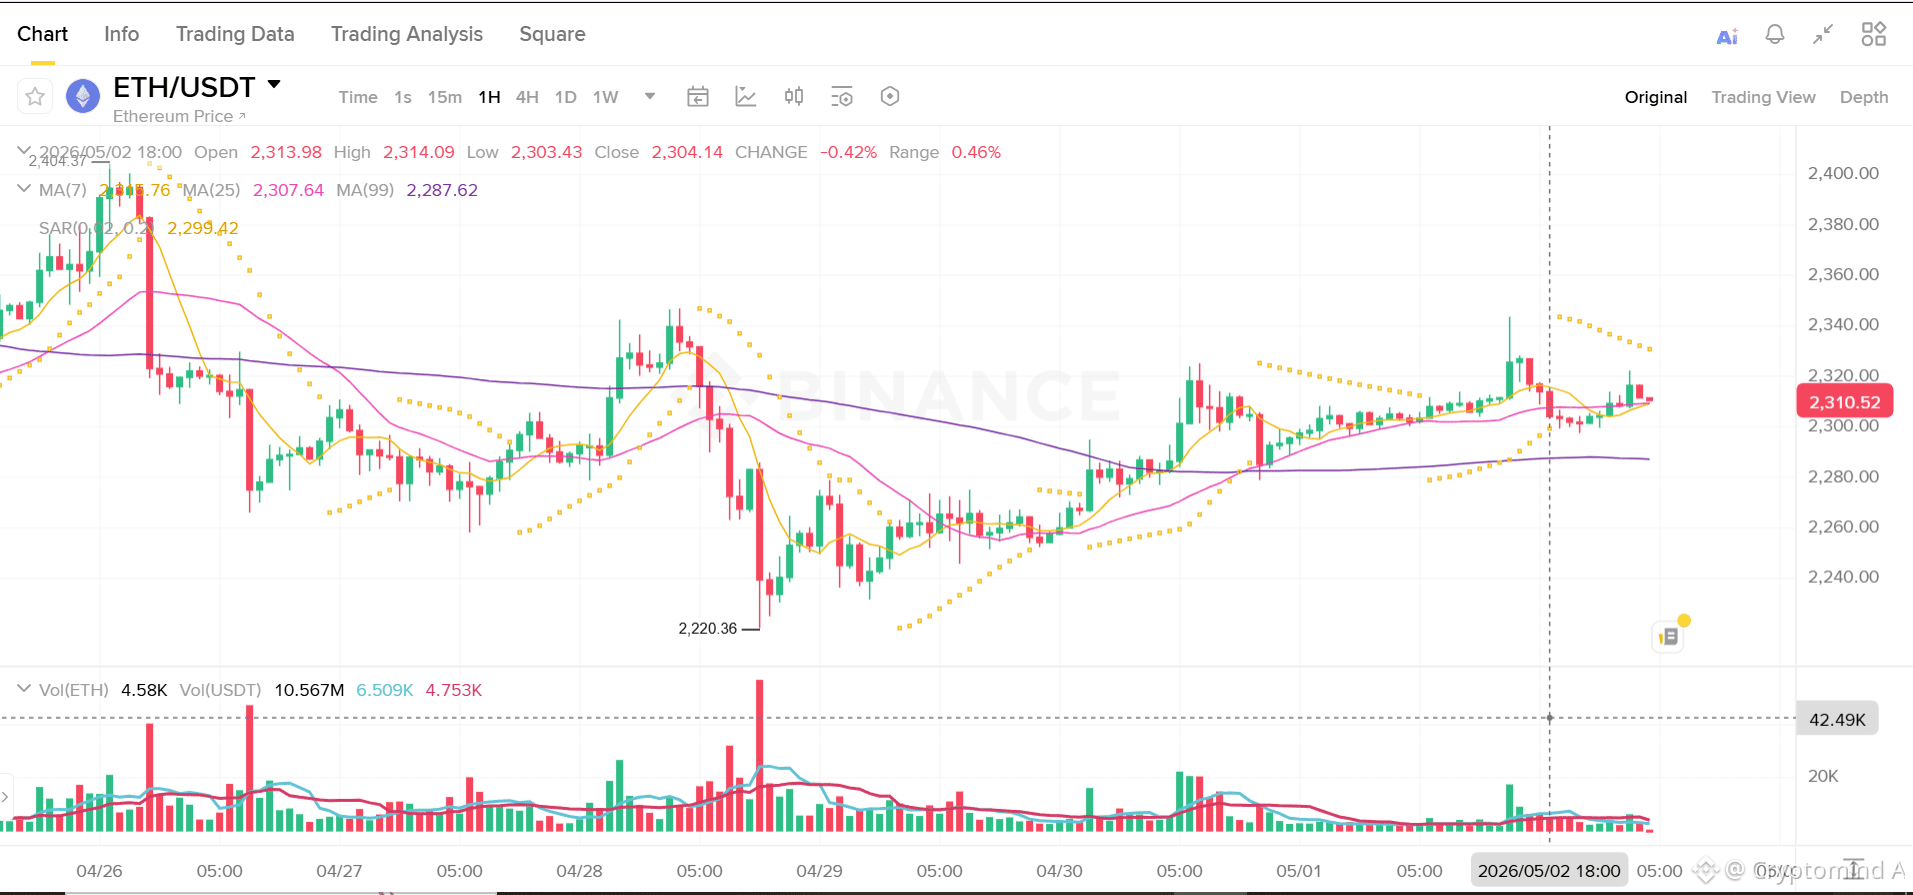
🟢 Accumulate: $2,100–$2,300
🎯 Target: $3,000–$3,175 pre-launch
⚠️ Trim at launch — "sell the news" historically hits 10–15%
🛑 Stop: Below $2,000
After Glamsterdam? Hegotá comes in H2 2026. This is a full year of catalysts.
The meme coins get the headlines. ETH gets the institutional money. You decide which one you want to hold. 🎯
#ETH #Glamsterdam #HEGOTA
{spot}(ETHUSDT)
100+ $ETH developers just met and finalized the roadmap that could 3x ETH from here.
Most people haven't read a single word about it.
$ETH Glamsterdam upgrade here's what's actually changing:
🔥 Gas fees: -78.6%
🔥 Speed: 10,000 TPS (10x current)
🔥 Gas limit: 60M → 200M
🔥 Block building: trustless and on-chain for the first time
🔥 Parallel execution: multiple transactions simultaneously
While retail watches meme coins smart money is HERE:
✅ All 10 ETH spot ETFs turned net positive simultaneously in April first time ever
✅ 6.45M ETH accumulated in 15 weeks by smart wallets
✅ Ethereum Foundation staked $93M of their own ETH
✅ Citi target: $3,175. Standard Chartered: $7,500.
The trade:
🟢 Accumulate: $2,100–$2,300
🎯 Target: $3,000–$3,175 pre-launch
⚠️ Trim at launch — "sell the news" historically hits 10–15%
🛑 Stop: Below $2,000
After Glamsterdam? Hegotá comes in H2 2026. This is a full year of catalysts.
The meme coins get the headlines. ETH gets the institutional money. You decide which one you want to hold. 🎯
#ETH #Glamsterdam #HEGOTA
Most people haven't read a single word about it.
$ETH Glamsterdam upgrade here's what's actually changing:
🔥 Gas fees: -78.6%
🔥 Speed: 10,000 TPS (10x current)
🔥 Gas limit: 60M → 200M
🔥 Block building: trustless and on-chain for the first time
🔥 Parallel execution: multiple transactions simultaneously
While retail watches meme coins smart money is HERE:
✅ All 10 ETH spot ETFs turned net positive simultaneously in April first time ever
✅ 6.45M ETH accumulated in 15 weeks by smart wallets
✅ Ethereum Foundation staked $93M of their own ETH
✅ Citi target: $3,175. Standard Chartered: $7,500.
The trade:
🟢 Accumulate: $2,100–$2,300
🎯 Target: $3,000–$3,175 pre-launch
⚠️ Trim at launch — "sell the news" historically hits 10–15%
🛑 Stop: Below $2,000
After Glamsterdam? Hegotá comes in H2 2026. This is a full year of catalysts.
The meme coins get the headlines. ETH gets the institutional money. You decide which one you want to hold. 🎯
#ETH #Glamsterdam #HEGOTA
52

#EthereumHegotaUpgradePrivacyTransfers
Ethereum's upcoming Hegota upgrade is set to introduce native privacy for token transfers. 🛡️
Using zero-knowledge proofs (ZKPs), the upgrade allows users to send ETH and ERC-20 tokens without revealing sender, receiver, or amount on-chain. No more reliance on third-party mixers like Tornado Cash.
💡 Key benefits:
· Enhanced user privacy by default
· Regulatory-compliant design (optional privacy)
· Potential for wider institutional adoption
This could be a game-changer for on-chain privacy. Will other L1s follow suit? 👇
#EthereumEFT #Hegota #Privacy #CryptoUpgrade
#EthereumHegotaUpgradePrivacyTransfers
Ethereum's upcoming Hegota upgrade is set to introduce native privacy for token transfers. 🛡️
Using zero-knowledge proofs (ZKPs), the upgrade allows users to send ETH and ERC-20 tokens without revealing sender, receiver, or amount on-chain. No more reliance on third-party mixers like Tornado Cash.
💡 Key benefits:
· Enhanced user privacy by default
· Regulatory-compliant design (optional privacy)
· Potential for wider institutional adoption
This could be a game-changer for on-chain privacy. Will other L1s follow suit? 👇
#EthereumEFT #Hegota #Privacy #CryptoUpgrade
Ethereum's upcoming Hegota upgrade is set to introduce native privacy for token transfers. 🛡️
Using zero-knowledge proofs (ZKPs), the upgrade allows users to send ETH and ERC-20 tokens without revealing sender, receiver, or amount on-chain. No more reliance on third-party mixers like Tornado Cash.
💡 Key benefits:
· Enhanced user privacy by default
· Regulatory-compliant design (optional privacy)
· Potential for wider institutional adoption
This could be a game-changer for on-chain privacy. Will other L1s follow suit? 👇
#EthereumEFT #Hegota #Privacy #CryptoUpgrade
1
108
Log in to explore more content
Join global crypto users on Binance Square
⚡️ Get latest and useful information about crypto.
💬 Trusted by the world’s largest crypto exchange.
👍 Discover real insights from verified creators.
Email / Phone number
Trending Topics
1
#MetaMaskExitsLidoValidatorsAfterSecurityIncident
8,542 views
303 Discussing
2
#MicronBeatsEarningsLiftsGuidance
10,460 views
287 Discussing
3
#CFTCSubmitsTwoEventContractRulesToWhiteHouse
9,542 views
277 Discussing
4
#BitcoinClears$85200
27,050 views
292 Discussing
5
#AltcoinSeasonIndexHoldsAbove60For5Days
135,127 views
1,748 Discussing
6
#USADPAdds90000JobsInSeptember
60,899 views
1,008 Discussing
7
#USCorePCEEasesTo3%InAugust
42,348 views
695 Discussing
8
#KospiPostsWorstQuarterSince2020
24,386 views
589 Discussing
9
#SECToClarifyOnChainFundraisingRules
61,516 views
785 Discussing
10
#UKFCAOpensCryptoFirmAuthorization
57,354 views
652 Discussing