

#glw
glw
63,977 views
534 Discussing
Hot
Latest

·
--
$GLW over the past 24 hours, it’s down 5.042%. Current price is 152.18, and the funding rate is zero.
Price is falling, but long and short costs are balanced. This combination suggests that spot selling pressure is dominant.
A funding rate of 0 means neither longs nor shorts pay—market sentiment is neutral. Yet the price still dropped by 5%, which implies the pressure is coming from position holders cutting exposure or liquidity tightening. Open interest is 64920.54; if we roughly estimate total value by price, it’s on the order of tens of millions of dollars. Trading volume is 21.31 million, showing active participation, but without a unified unit for the pricing metric, you can’t directly compare figures.
Single-signal verdict: a neutral funding rate cannot explain the magnitude of the drop. You must pay attention to the spot-side dynamics.
Strong counter-evidence: if macro liquidity improves or sector rotation brings in fresh buying, the price could rebound quickly. What data would overturn this view? Price holding above 155 along with the funding rate turning positive would indicate longs are re-entering.
Second-order effects: traders holding floating losses face pressure and may be forced to stop out. Liquidity providers may stand by until the trend becomes clear. The cost is borne by those who chased higher; arbitrage capital temporarily withdraws.
I choose to stay on the sidelines. Aggressive traders can probe with a light position around 150, with a stop-loss set at 148. Conservative traders should wait until the price holds above 155 before considering entries. Those who want to avoid risk can exit the position. Invalidation condition: the price rebounds and holds above 155.
Trading tag: #TradFi #链上美股 #GLW
Where do you think this set of conclusions is most likely to be wrong?
$GLW over the past 24 hours, it’s down 5.042%. Current price is 152.18, and the funding rate is zero.
Price is falling, but long and short costs are balanced. This combination suggests that spot selling pressure is dominant.
A funding rate of 0 means neither longs nor shorts pay—market sentiment is neutral. Yet the price still dropped by 5%, which implies the pressure is coming from position holders cutting exposure or liquidity tightening. Open interest is 64920.54; if we roughly estimate total value by price, it’s on the order of tens of millions of dollars. Trading volume is 21.31 million, showing active participation, but without a unified unit for the pricing metric, you can’t directly compare figures.
Single-signal verdict: a neutral funding rate cannot explain the magnitude of the drop. You must pay attention to the spot-side dynamics.
Strong counter-evidence: if macro liquidity improves or sector rotation brings in fresh buying, the price could rebound quickly. What data would overturn this view? Price holding above 155 along with the funding rate turning positive would indicate longs are re-entering.
Second-order effects: traders holding floating losses face pressure and may be forced to stop out. Liquidity providers may stand by until the trend becomes clear. The cost is borne by those who chased higher; arbitrage capital temporarily withdraws.
I choose to stay on the sidelines. Aggressive traders can probe with a light position around 150, with a stop-loss set at 148. Conservative traders should wait until the price holds above 155 before considering entries. Those who want to avoid risk can exit the position. Invalidation condition: the price rebounds and holds above 155.
Trading tag: #TradFi #链上美股 #GLW
Where do you think this set of conclusions is most likely to be wrong?
Price is falling, but long and short costs are balanced. This combination suggests that spot selling pressure is dominant.
A funding rate of 0 means neither longs nor shorts pay—market sentiment is neutral. Yet the price still dropped by 5%, which implies the pressure is coming from position holders cutting exposure or liquidity tightening. Open interest is 64920.54; if we roughly estimate total value by price, it’s on the order of tens of millions of dollars. Trading volume is 21.31 million, showing active participation, but without a unified unit for the pricing metric, you can’t directly compare figures.
Single-signal verdict: a neutral funding rate cannot explain the magnitude of the drop. You must pay attention to the spot-side dynamics.
Strong counter-evidence: if macro liquidity improves or sector rotation brings in fresh buying, the price could rebound quickly. What data would overturn this view? Price holding above 155 along with the funding rate turning positive would indicate longs are re-entering.
Second-order effects: traders holding floating losses face pressure and may be forced to stop out. Liquidity providers may stand by until the trend becomes clear. The cost is borne by those who chased higher; arbitrage capital temporarily withdraws.
I choose to stay on the sidelines. Aggressive traders can probe with a light position around 150, with a stop-loss set at 148. Conservative traders should wait until the price holds above 155 before considering entries. Those who want to avoid risk can exit the position. Invalidation condition: the price rebounds and holds above 155.
Trading tag: #TradFi #链上美股 #GLW
Where do you think this set of conclusions is most likely to be wrong?
16

·
--
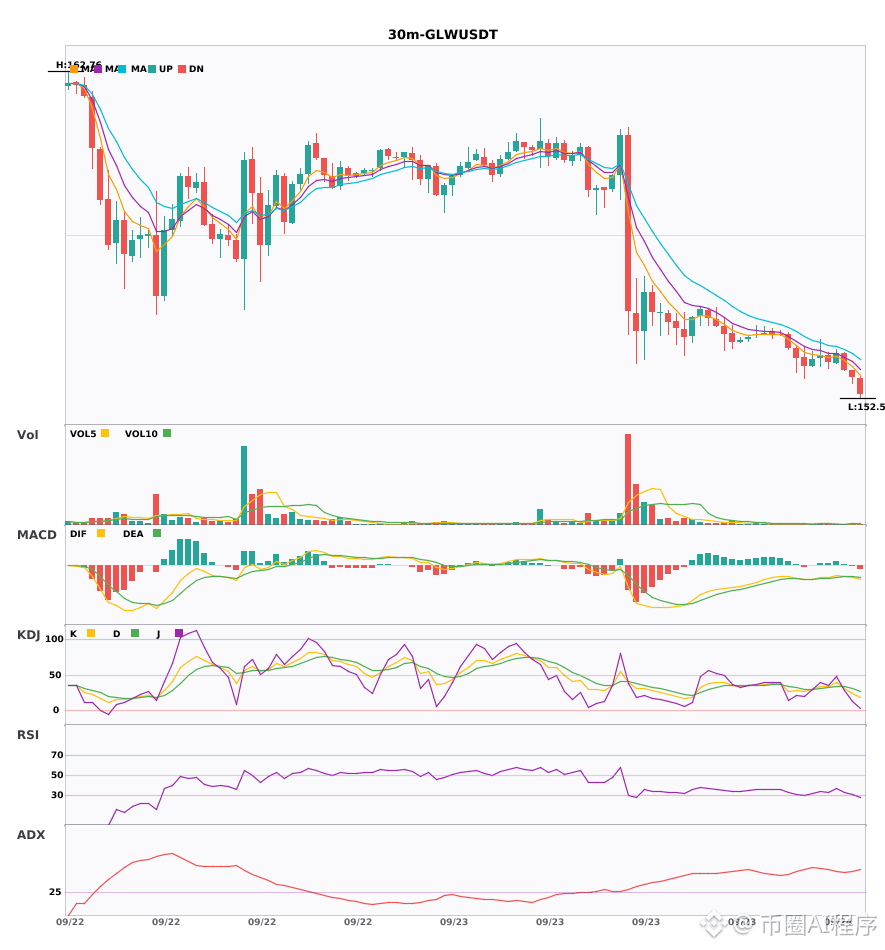
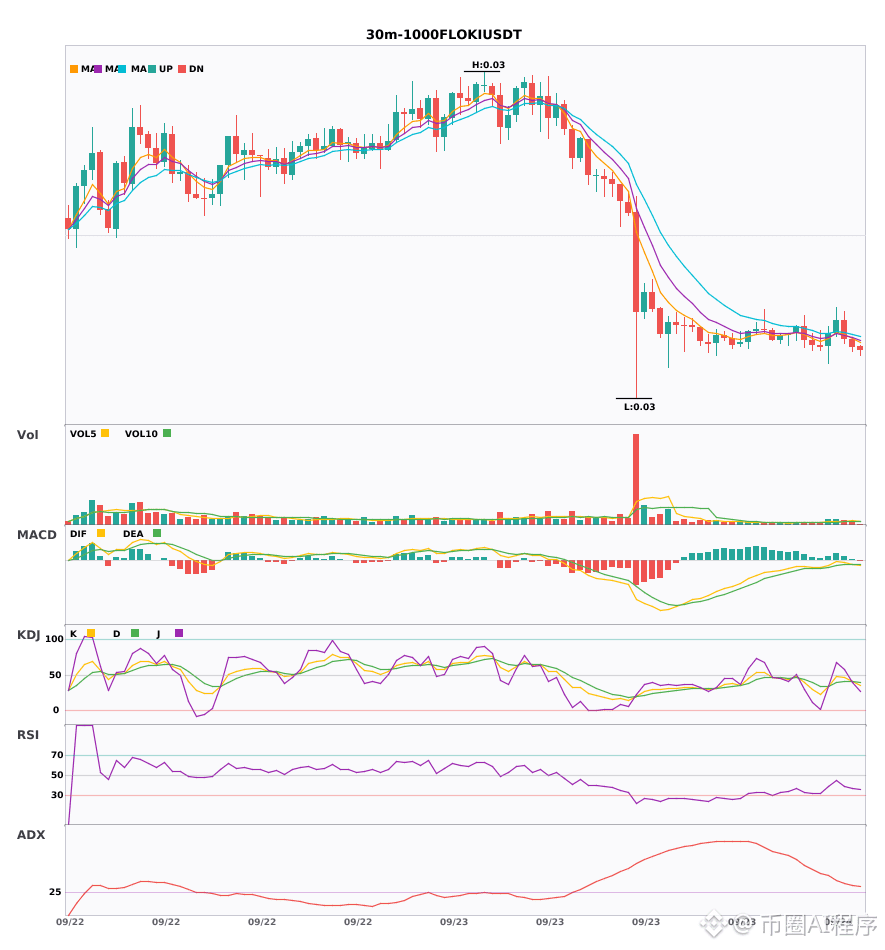
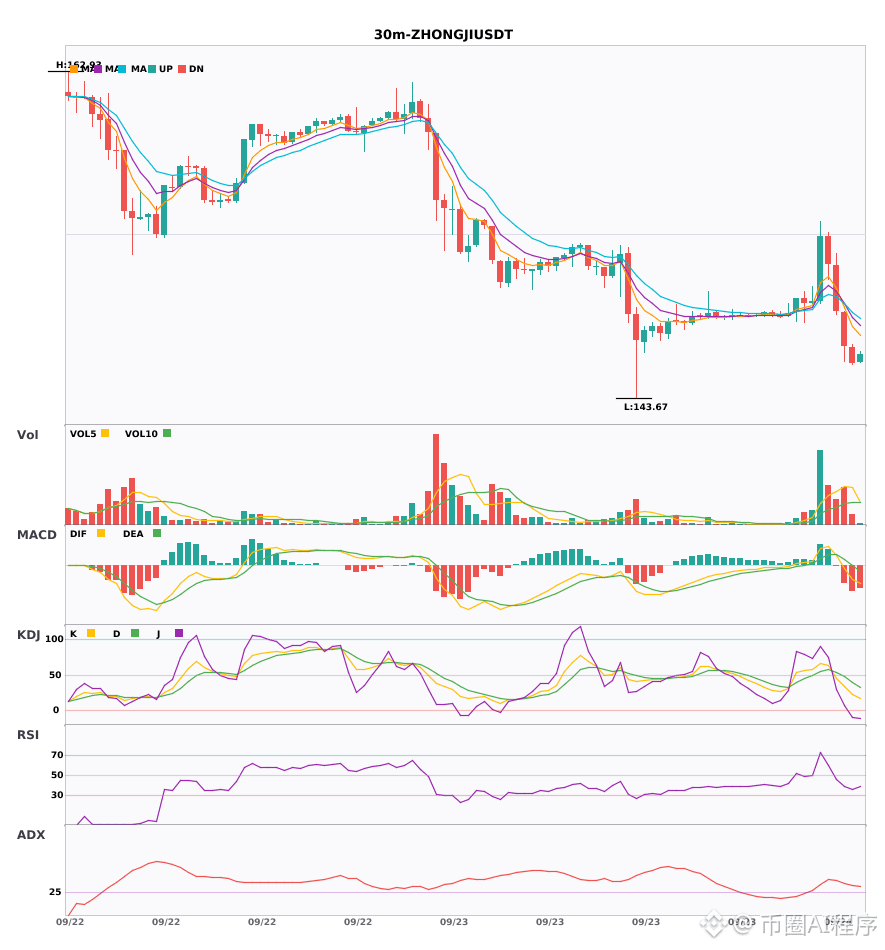
$GLW / $1000FLOKI / $ZHONGJI 30 minutes short + 4 hours short in the same direction, multi-cycle resonance turns to short 🔥
════════════════════
🟢 $GLW 30-minute short signal
⚠️ Technical analysis: 4-hour short resonance confirmation | Entry on 30 minutes: MACD below zero with a dead cross, short accelerates | EMA5 < EMA8 < EMA13 bearish alignment | KDJ weakly trending downward, bears in control (K is 24.5, D is 30.5) | Volume normal (1.3x)
════════════════════
🟢 $1000FLOKI 30-minute short signal
⚠️ Technical analysis: 4-hour short resonance confirmation | Entry on 30 minutes: EMA5 crosses below EMA8, short-term turns bearish | KDJ dead cross, short-term bearish outlook (K is 40.8, D is 41.3) | Volume expands (1.6x)
════════════════════
🟢 $ZHONGJI 30 30-minute short signal
⚠️ Technical analysis: 4-hour short resonance confirmation | Entry on 30 minutes: MACDDIF breaks below the zero line, trend turns bearish | EMA5 crosses below EMA8, short-term turns bearish | KDJ weakly trending, bears in control (K is 34.1, D is 47.3) | Volume expands (1.7x)
════════════════════
🔔 Watch for the first-hand market movement alerts 🔔
#多周期共振 #GLW #1000FLOKI #ZHONGJI
📌 When trading, pay attention to whether the candlestick patterns match
$GLW / $1000FLOKI / $ZHONGJI 30 minutes short + 4 hours short in the same direction, multi-cycle resonance turns to short 🔥
════════════════════
🟢 $GLW 30-minute short signal
⚠️ Technical analysis: 4-hour short resonance confirmation | Entry on 30 minutes: MACD below zero with a dead cross, short accelerates | EMA5 < EMA8 < EMA13 bearish alignment | KDJ weakly trending downward, bears in control (K is 24.5, D is 30.5) | Volume normal (1.3x)
════════════════════
🟢 $1000FLOKI 30-minute short signal
⚠️ Technical analysis: 4-hour short resonance confirmation | Entry on 30 minutes: EMA5 crosses below EMA8, short-term turns bearish | KDJ dead cross, short-term bearish outlook (K is 40.8, D is 41.3) | Volume expands (1.6x)
════════════════════
🟢 $ZHONGJI 30 30-minute short signal
⚠️ Technical analysis: 4-hour short resonance confirmation | Entry on 30 minutes: MACDDIF breaks below the zero line, trend turns bearish | EMA5 crosses below EMA8, short-term turns bearish | KDJ weakly trending, bears in control (K is 34.1, D is 47.3) | Volume expands (1.7x)
════════════════════
🔔 Watch for the first-hand market movement alerts 🔔
#多周期共振 #GLW #1000FLOKI #ZHONGJI
📌 When trading, pay attention to whether the candlestick patterns match
════════════════════
🟢 $GLW 30-minute short signal
⚠️ Technical analysis: 4-hour short resonance confirmation | Entry on 30 minutes: MACD below zero with a dead cross, short accelerates | EMA5 < EMA8 < EMA13 bearish alignment | KDJ weakly trending downward, bears in control (K is 24.5, D is 30.5) | Volume normal (1.3x)
════════════════════
🟢 $1000FLOKI 30-minute short signal
⚠️ Technical analysis: 4-hour short resonance confirmation | Entry on 30 minutes: EMA5 crosses below EMA8, short-term turns bearish | KDJ dead cross, short-term bearish outlook (K is 40.8, D is 41.3) | Volume expands (1.6x)
════════════════════
🟢 $ZHONGJI 30 30-minute short signal
⚠️ Technical analysis: 4-hour short resonance confirmation | Entry on 30 minutes: MACDDIF breaks below the zero line, trend turns bearish | EMA5 crosses below EMA8, short-term turns bearish | KDJ weakly trending, bears in control (K is 34.1, D is 47.3) | Volume expands (1.7x)
════════════════════
🔔 Watch for the first-hand market movement alerts 🔔
#多周期共振 #GLW #1000FLOKI #ZHONGJI
📌 When trading, pay attention to whether the candlestick patterns match
133

·
--
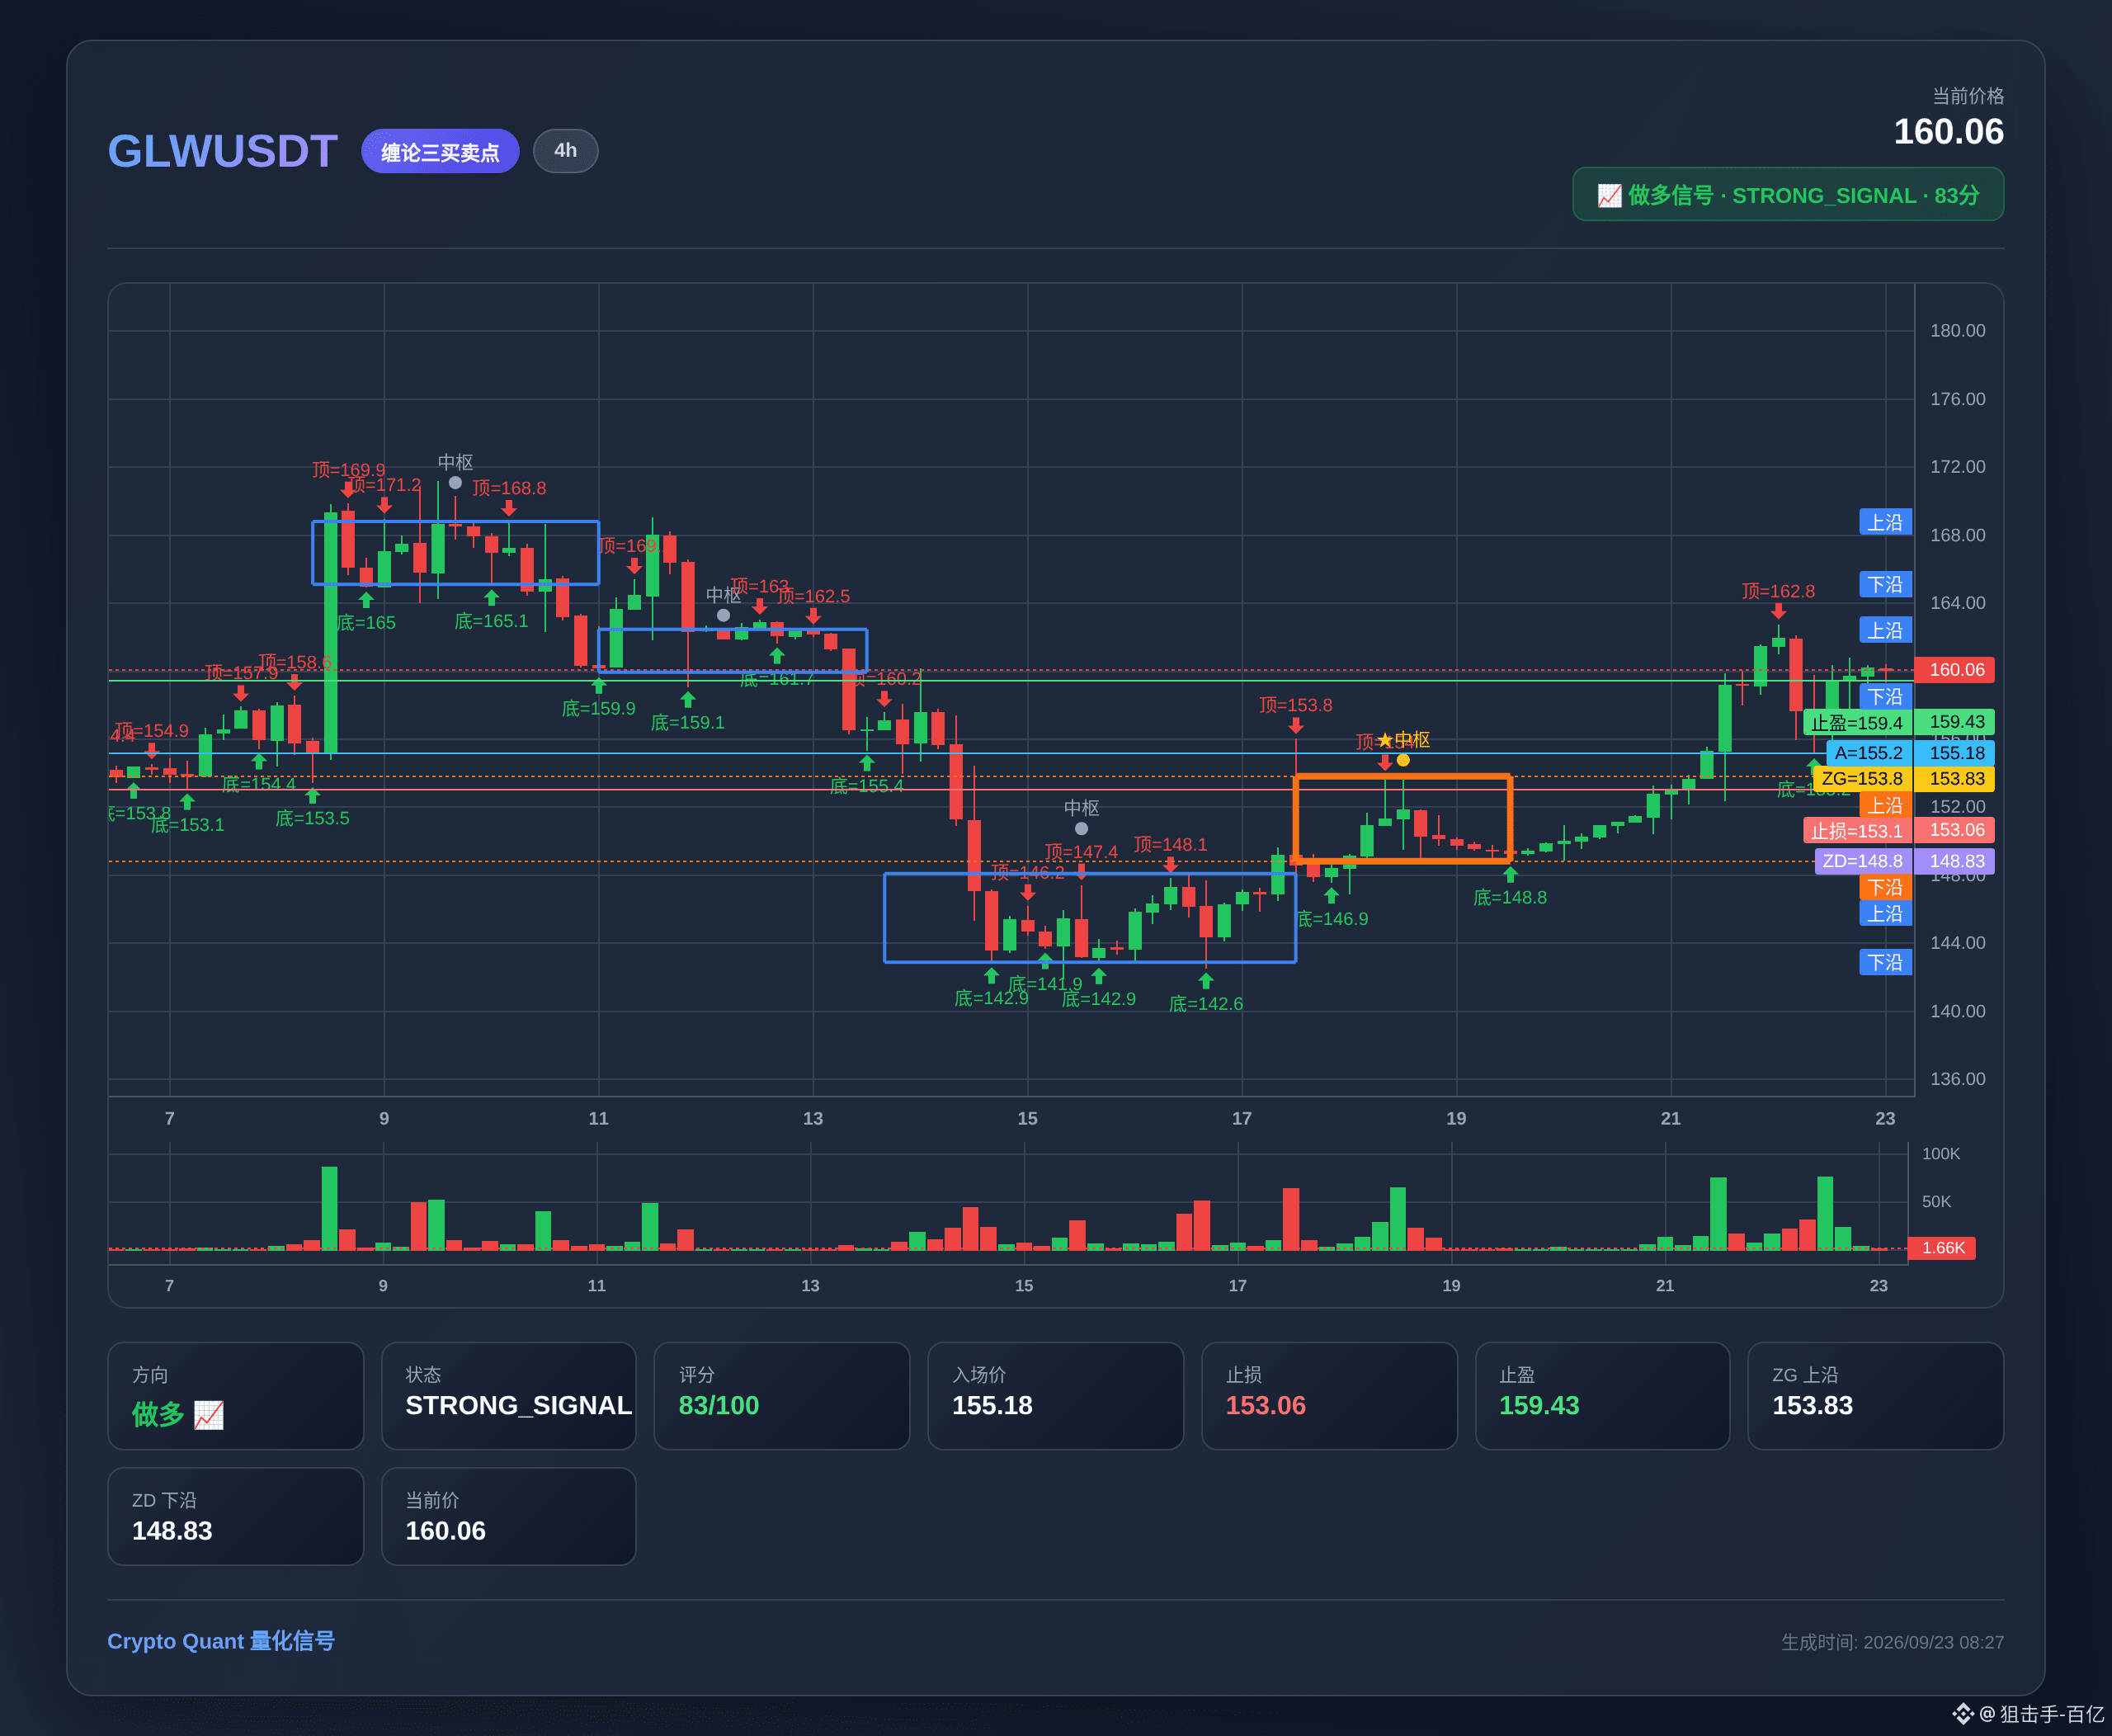
📈 Chan Lun Strategy Share
━━━━━━━━━━━━━━━━
💰 Coin: GLW
⏱️ Timeframe: 4h
🟢 Pattern: Three Buys (Go Long)
🏆 Rating: ⭐ Strong Signal (83/100)
━━━━━━━━━━━━━━━━
💎 Current Price: 159.9500
🎯 Entry: 155.1800
🛑 Stop Loss: 153.0570
💰 Take Profit: 159.4260
⚖️ Risk/Reward: 2.0 : 1
━━━━━━━━━━━━━━━━
📝 Analysis: After breaking upward and then pulling back, the price finds support above the upper boundary of the central pivot zone at 153.8263, forming a Three Buys signal. MACD is above the zero line, indicating strong bullish momentum.
━━━━━━━━━━━━━━━━
📅 2026.09.23 08:27 | For reference only and does not constitute investment advice
#GLW #缠论 #三买三卖 #中枢理论 #Futures Trading
📈 Chan Lun Strategy Share
━━━━━━━━━━━━━━━━
💰 Coin: GLW
⏱️ Timeframe: 4h
🟢 Pattern: Three Buys (Go Long)
🏆 Rating: ⭐ Strong Signal (83/100)
━━━━━━━━━━━━━━━━
💎 Current Price: 159.9500
🎯 Entry: 155.1800
🛑 Stop Loss: 153.0570
💰 Take Profit: 159.4260
⚖️ Risk/Reward: 2.0 : 1
━━━━━━━━━━━━━━━━
📝 Analysis: After breaking upward and then pulling back, the price finds support above the upper boundary of the central pivot zone at 153.8263, forming a Three Buys signal. MACD is above the zero line, indicating strong bullish momentum.
━━━━━━━━━━━━━━━━
📅 2026.09.23 08:27 | For reference only and does not constitute investment advice
#GLW #缠论 #三买三卖 #中枢理论 #Futures Trading
━━━━━━━━━━━━━━━━
💰 Coin: GLW
⏱️ Timeframe: 4h
🟢 Pattern: Three Buys (Go Long)
🏆 Rating: ⭐ Strong Signal (83/100)
━━━━━━━━━━━━━━━━
💎 Current Price: 159.9500
🎯 Entry: 155.1800
🛑 Stop Loss: 153.0570
💰 Take Profit: 159.4260
⚖️ Risk/Reward: 2.0 : 1
━━━━━━━━━━━━━━━━
📝 Analysis: After breaking upward and then pulling back, the price finds support above the upper boundary of the central pivot zone at 153.8263, forming a Three Buys signal. MACD is above the zero line, indicating strong bullish momentum.
━━━━━━━━━━━━━━━━
📅 2026.09.23 08:27 | For reference only and does not constitute investment advice
#GLW #缠论 #三买三卖 #中枢理论 #Futures Trading
53

·
--
5-minute trend scan, 3 clear opportunities. All are upside breakout structures; all are US stock token (U.S.-listed) assets. Pay attention to volatility.
$GLW : Go long. After a breakout above the previous high with increased volume, backtest it and hold as long as it keeps above; the close should stand above the pressure zone. 5-minute consolidation, 15-minute consolidation, 1-hour upward trend. Entry score: 80, structure score: 0. No known high-cycle resistance.
Current price: 159.5. Entry: 158.80-159.60. Stop loss: 157.90. Target: 162.0. Risk-reward ratio: 2.2:1.
Conclusion: Buy. Breakout + pullback confirmation; 1-hour upward trend as a base; volume up 1.29x.
$ARM : Go long. Breakout above the previous high with volume up 3.08x. Pull back to and hold the breakout start; then a second push with increased volume. 5-minute consolidation, 15-minute consolidation, 1-hour strong upward trend. Entry score: 80, structure score: 0. No known high-cycle resistance.
Current price: 323.2. Entry: 322.00-323.40. Stop loss: 321.00. Target: 327.0. Risk-reward ratio: 2.5:1.
Conclusion: Buy. Among the three, it has the largest volume multiple; backtest confirmation; 1-hour strong trend support.
$DELL : Go long. Breakout upward with volume up 2.75x. After the breakout, two consecutive candles hold the breakout level. 5-minute consolidation, 15-minute consolidation, 1-hour consolidation. Entry score: 75, structure score: 0. No known high-cycle resistance.
Current price: 576.0. Entry: 574.50-576.00. Stop loss: 573.30. Target: 580.0. Risk-reward ratio: 2.4:1.
Conclusion: Buy. Volume breakout confirmation; 1-hour consolidation slightly above the upper range—upside breakout space is pending to open; cut losses on breakdown.
All three are US stock tokens (U.S.-listed). They tend to fluctuate greatly following the US stock market open; if the backtest fails, admit defeat and exit—don’t hold positions through adverse moves. Recommended position sizing: no more than 10% per coin.
#GLW #ARM #DELL #突破 # Go long
5-minute trend scan, 3 clear opportunities. All are upside breakout structures; all are US stock token (U.S.-listed) assets. Pay attention to volatility.
$GLW : Go long. After a breakout above the previous high with increased volume, backtest it and hold as long as it keeps above; the close should stand above the pressure zone. 5-minute consolidation, 15-minute consolidation, 1-hour upward trend. Entry score: 80, structure score: 0. No known high-cycle resistance.
Current price: 159.5. Entry: 158.80-159.60. Stop loss: 157.90. Target: 162.0. Risk-reward ratio: 2.2:1.
Conclusion: Buy. Breakout + pullback confirmation; 1-hour upward trend as a base; volume up 1.29x.
$ARM : Go long. Breakout above the previous high with volume up 3.08x. Pull back to and hold the breakout start; then a second push with increased volume. 5-minute consolidation, 15-minute consolidation, 1-hour strong upward trend. Entry score: 80, structure score: 0. No known high-cycle resistance.
Current price: 323.2. Entry: 322.00-323.40. Stop loss: 321.00. Target: 327.0. Risk-reward ratio: 2.5:1.
Conclusion: Buy. Among the three, it has the largest volume multiple; backtest confirmation; 1-hour strong trend support.
$DELL : Go long. Breakout upward with volume up 2.75x. After the breakout, two consecutive candles hold the breakout level. 5-minute consolidation, 15-minute consolidation, 1-hour consolidation. Entry score: 75, structure score: 0. No known high-cycle resistance.
Current price: 576.0. Entry: 574.50-576.00. Stop loss: 573.30. Target: 580.0. Risk-reward ratio: 2.4:1.
Conclusion: Buy. Volume breakout confirmation; 1-hour consolidation slightly above the upper range—upside breakout space is pending to open; cut losses on breakdown.
All three are US stock tokens (U.S.-listed). They tend to fluctuate greatly following the US stock market open; if the backtest fails, admit defeat and exit—don’t hold positions through adverse moves. Recommended position sizing: no more than 10% per coin.
#GLW #ARM #DELL #突破 # Go long
$GLW : Go long. After a breakout above the previous high with increased volume, backtest it and hold as long as it keeps above; the close should stand above the pressure zone. 5-minute consolidation, 15-minute consolidation, 1-hour upward trend. Entry score: 80, structure score: 0. No known high-cycle resistance.
Current price: 159.5. Entry: 158.80-159.60. Stop loss: 157.90. Target: 162.0. Risk-reward ratio: 2.2:1.
Conclusion: Buy. Breakout + pullback confirmation; 1-hour upward trend as a base; volume up 1.29x.
$ARM : Go long. Breakout above the previous high with volume up 3.08x. Pull back to and hold the breakout start; then a second push with increased volume. 5-minute consolidation, 15-minute consolidation, 1-hour strong upward trend. Entry score: 80, structure score: 0. No known high-cycle resistance.
Current price: 323.2. Entry: 322.00-323.40. Stop loss: 321.00. Target: 327.0. Risk-reward ratio: 2.5:1.
Conclusion: Buy. Among the three, it has the largest volume multiple; backtest confirmation; 1-hour strong trend support.
$DELL : Go long. Breakout upward with volume up 2.75x. After the breakout, two consecutive candles hold the breakout level. 5-minute consolidation, 15-minute consolidation, 1-hour consolidation. Entry score: 75, structure score: 0. No known high-cycle resistance.
Current price: 576.0. Entry: 574.50-576.00. Stop loss: 573.30. Target: 580.0. Risk-reward ratio: 2.4:1.
Conclusion: Buy. Volume breakout confirmation; 1-hour consolidation slightly above the upper range—upside breakout space is pending to open; cut losses on breakdown.
All three are US stock tokens (U.S.-listed). They tend to fluctuate greatly following the US stock market open; if the backtest fails, admit defeat and exit—don’t hold positions through adverse moves. Recommended position sizing: no more than 10% per coin.
#GLW #ARM #DELL #突破 # Go long
24
·
--
$GLW 24 hours up 6.145%, funding rate 0.0004. With the price moving upward, the long-side pays a fee structure at the same time—typical of crowded longs accumulating costs.
Within a window of political uncertainty, this kind of positive funding rate at elevated levels is prone to reversal. The current price is 162.37. If macro sentiment turns, chase-buying capital will be the first to be hit.
The longs are holding positions and paying, but open interest at 65994 has not clearly withdrawn. My view is a false breakout. The invalidation condition is when the funding rate turns negative or the price holds above 165. Try a small short position; if it breaks below the previous high at 155, consider adding.
Trading tag: #TradFi #链上美股 #GLW
Where do you think this set of assumptions is most likely to be wrong?
$GLW 24 hours up 6.145%, funding rate 0.0004. With the price moving upward, the long-side pays a fee structure at the same time—typical of crowded longs accumulating costs.
Within a window of political uncertainty, this kind of positive funding rate at elevated levels is prone to reversal. The current price is 162.37. If macro sentiment turns, chase-buying capital will be the first to be hit.
The longs are holding positions and paying, but open interest at 65994 has not clearly withdrawn. My view is a false breakout. The invalidation condition is when the funding rate turns negative or the price holds above 165. Try a small short position; if it breaks below the previous high at 155, consider adding.
Trading tag: #TradFi #链上美股 #GLW
Where do you think this set of assumptions is most likely to be wrong?
Within a window of political uncertainty, this kind of positive funding rate at elevated levels is prone to reversal. The current price is 162.37. If macro sentiment turns, chase-buying capital will be the first to be hit.
The longs are holding positions and paying, but open interest at 65994 has not clearly withdrawn. My view is a false breakout. The invalidation condition is when the funding rate turns negative or the price holds above 165. Try a small short position; if it breaks below the previous high at 155, consider adding.
Trading tag: #TradFi #链上美股 #GLW
Where do you think this set of assumptions is most likely to be wrong?
140
·
--
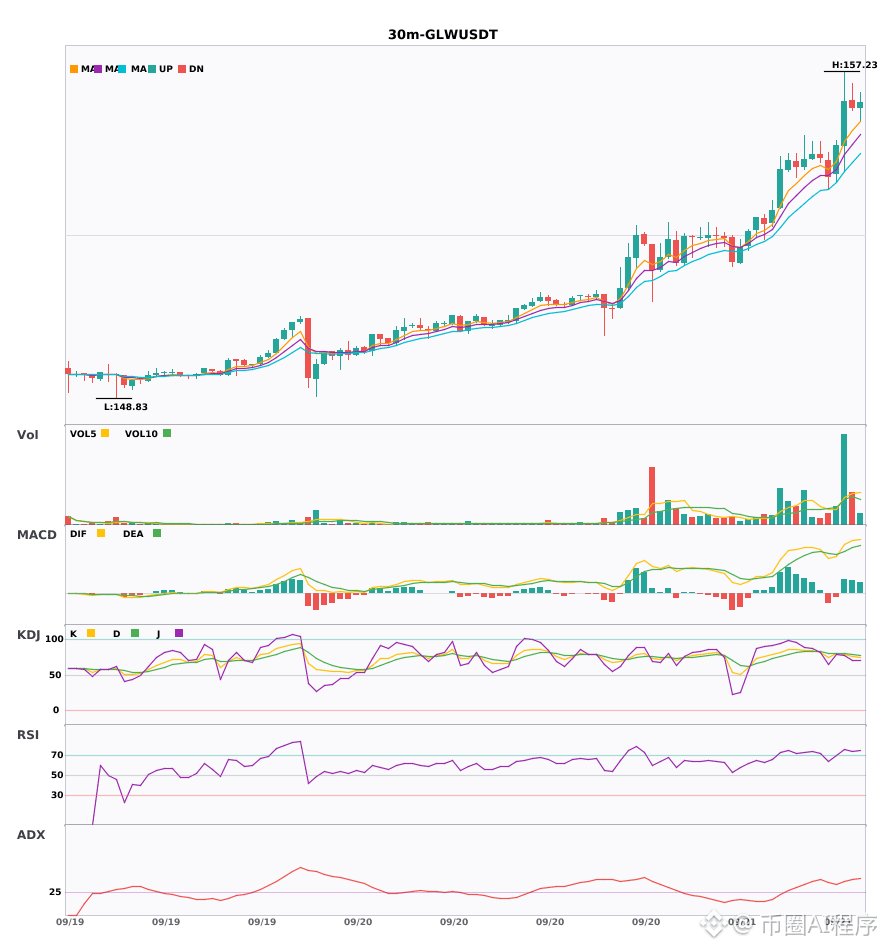
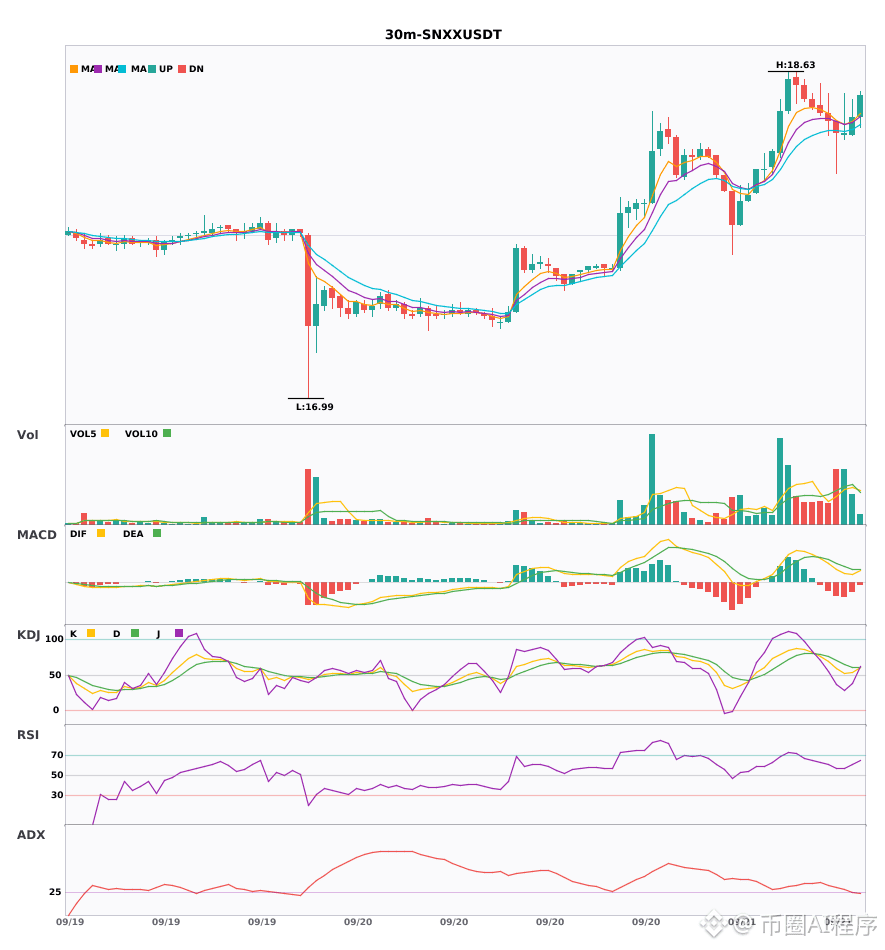
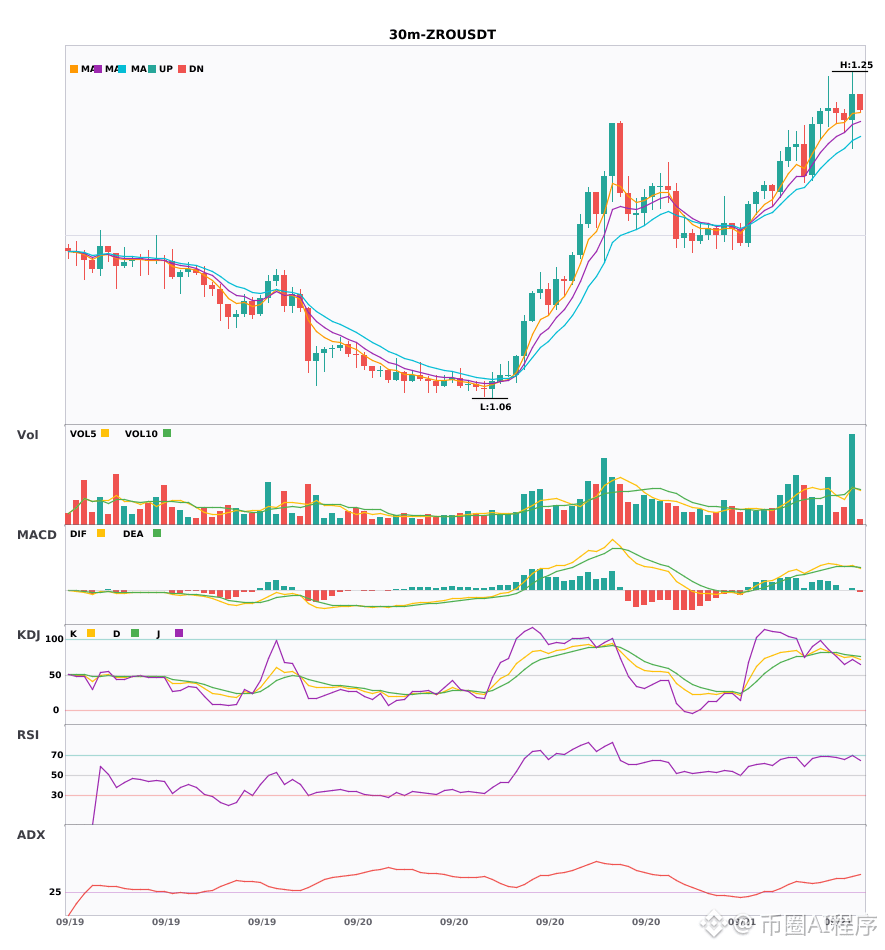
Multi-Period Resonance: 3-currency 30-minute bullish + 4-hour bullish trend confirmation🔥
════════════════════
🔴 $GLW 30-minute bullish signal
⚠️ Technicals: 4-hour bullish resonance confirmed | 30-minute entry: MACD crosses above zero with a golden cross; bullish momentum releases | EMA5 > EMA8 > EMA13 with a bullish alignment | KDJ runs strongly; bulls dominate (K=79.1, D=79.7) | Trading volume spikes (3.5x)
════════════════════
🔴 $SNXX 30-minute bullish signal
⚠️ Technicals: 4-hour bullish resonance confirmed | 30-minute entry: EMA5 crosses above EMA8, turning short-term bullish | KDJ runs strongly; bulls dominate (K=53.2, D=60.5) | Volume is normal (1.4x)
════════════════════
🔴 $ZRO 30-minute bullish signal
⚠️ Technicals: 4-hour bullish resonance confirmed | 30-minute entry: MACD golden cross above zero; bullish momentum releases | EMA5 > EMA8 > EMA13 with a bullish alignment | KDJ runs strongly; bulls dominate (K=75.8, D=77.6) | Trading volume expands (2.4x)
📢 Market update: Binance will support the Stargate Finance (STG) token merge to LayerZero (ZRO)
════════════════════
🔔 Watch for first-hand market moves and anomalies 🔔
#多周期共振 #GLW #SNXX #ZRO
📌 When trading, pay attention to whether the candlestick patterns match
Multi-Period Resonance: 3-currency 30-minute bullish + 4-hour bullish trend confirmation🔥
════════════════════
🔴 $GLW 30-minute bullish signal
⚠️ Technicals: 4-hour bullish resonance confirmed | 30-minute entry: MACD crosses above zero with a golden cross; bullish momentum releases | EMA5 > EMA8 > EMA13 with a bullish alignment | KDJ runs strongly; bulls dominate (K=79.1, D=79.7) | Trading volume spikes (3.5x)
════════════════════
🔴 $SNXX 30-minute bullish signal
⚠️ Technicals: 4-hour bullish resonance confirmed | 30-minute entry: EMA5 crosses above EMA8, turning short-term bullish | KDJ runs strongly; bulls dominate (K=53.2, D=60.5) | Volume is normal (1.4x)
════════════════════
🔴 $ZRO 30-minute bullish signal
⚠️ Technicals: 4-hour bullish resonance confirmed | 30-minute entry: MACD golden cross above zero; bullish momentum releases | EMA5 > EMA8 > EMA13 with a bullish alignment | KDJ runs strongly; bulls dominate (K=75.8, D=77.6) | Trading volume expands (2.4x)
📢 Market update: Binance will support the Stargate Finance (STG) token merge to LayerZero (ZRO)
════════════════════
🔔 Watch for first-hand market moves and anomalies 🔔
#多周期共振 #GLW #SNXX #ZRO
📌 When trading, pay attention to whether the candlestick patterns match
════════════════════
🔴 $GLW 30-minute bullish signal
⚠️ Technicals: 4-hour bullish resonance confirmed | 30-minute entry: MACD crosses above zero with a golden cross; bullish momentum releases | EMA5 > EMA8 > EMA13 with a bullish alignment | KDJ runs strongly; bulls dominate (K=79.1, D=79.7) | Trading volume spikes (3.5x)
════════════════════
🔴 $SNXX 30-minute bullish signal
⚠️ Technicals: 4-hour bullish resonance confirmed | 30-minute entry: EMA5 crosses above EMA8, turning short-term bullish | KDJ runs strongly; bulls dominate (K=53.2, D=60.5) | Volume is normal (1.4x)
════════════════════
🔴 $ZRO 30-minute bullish signal
⚠️ Technicals: 4-hour bullish resonance confirmed | 30-minute entry: MACD golden cross above zero; bullish momentum releases | EMA5 > EMA8 > EMA13 with a bullish alignment | KDJ runs strongly; bulls dominate (K=75.8, D=77.6) | Trading volume expands (2.4x)
📢 Market update: Binance will support the Stargate Finance (STG) token merge to LayerZero (ZRO)
════════════════════
🔔 Watch for first-hand market moves and anomalies 🔔
#多周期共振 #GLW #SNXX #ZRO
📌 When trading, pay attention to whether the candlestick patterns match
7

·
--
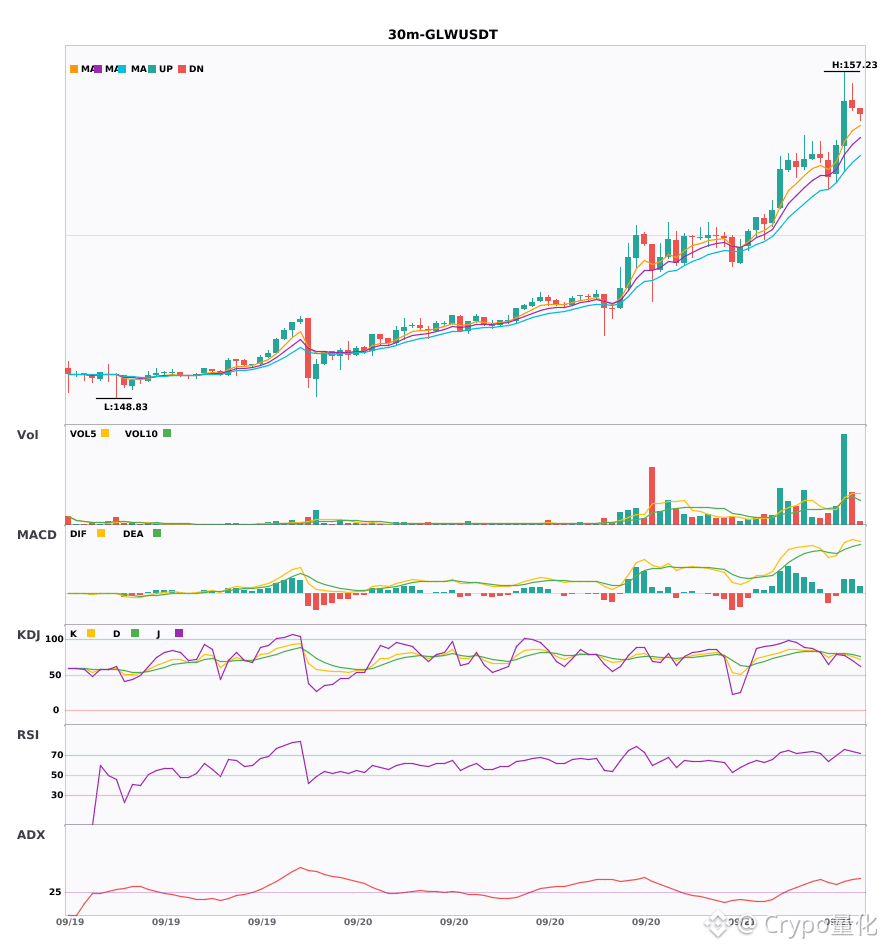
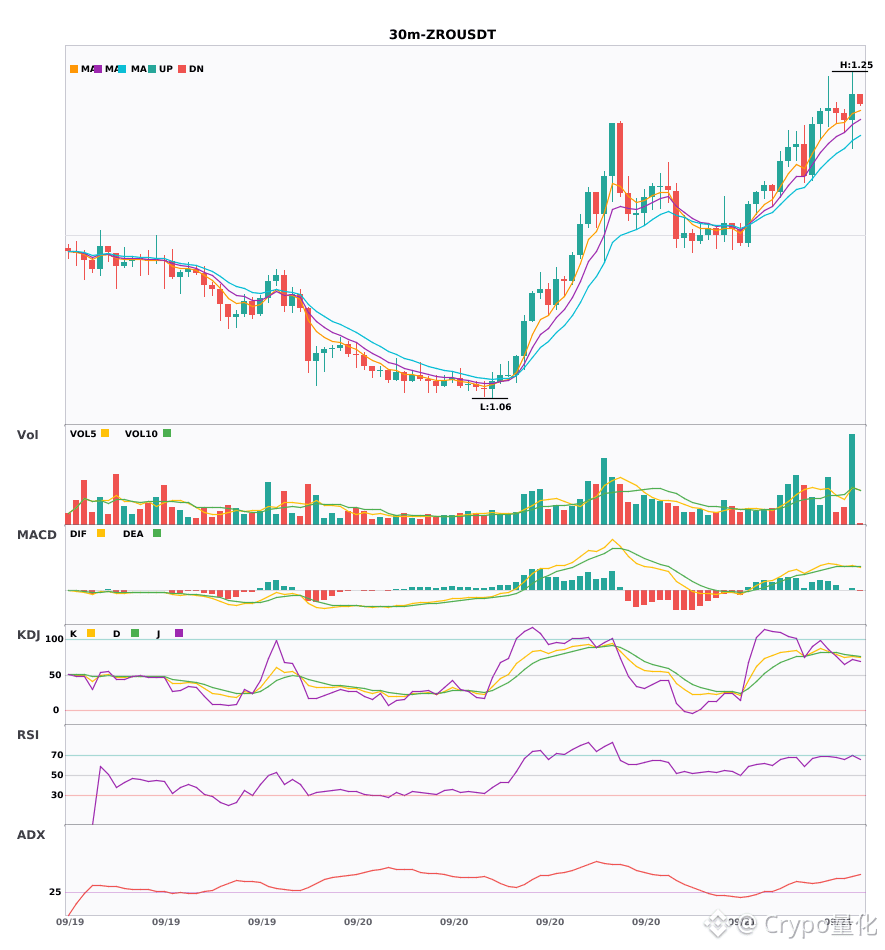
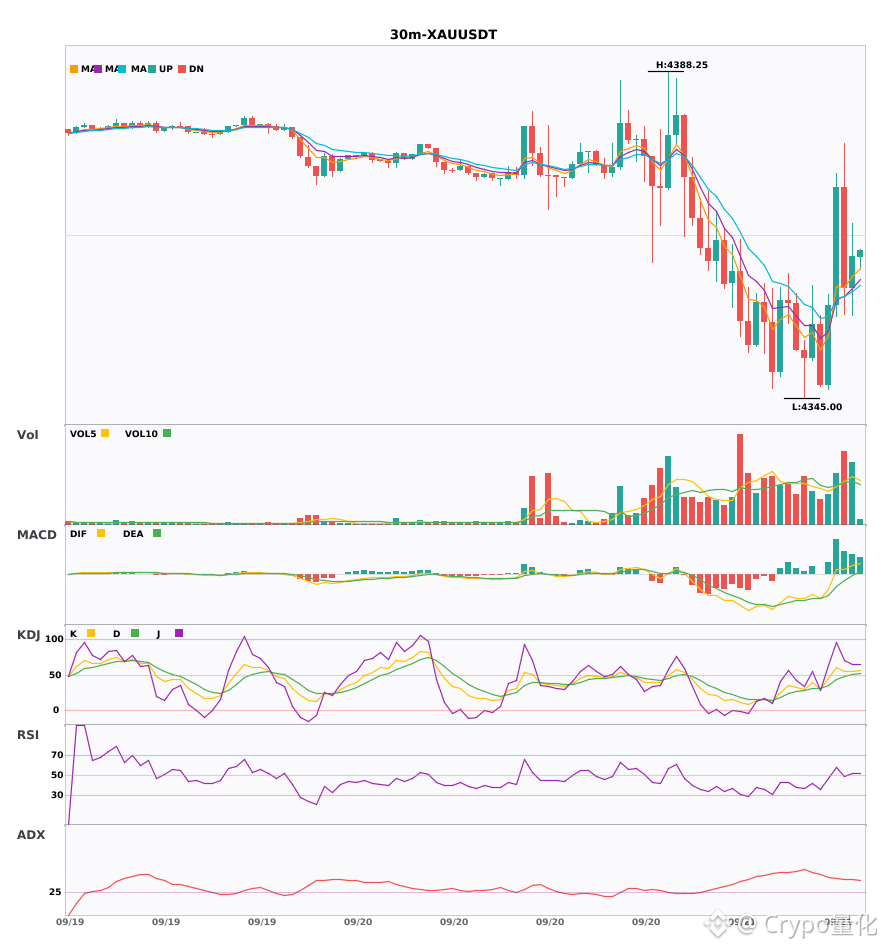
$GLW / $ZRO / $XAU 30-minute timeframe: too bullish overall. Short-term resonance opportunities are here🔥
════════════════════
🔴 $GLW 30-minute Bullish Signal
⚠️ Technicals: ADX(39) indicates a clear trending market | MACD forms an upside “golden cross” above zero; bullish momentum is released | EMA5 > EMA8 > EMA13, bullish alignment | KDJ is strongly trending upward; bulls hold the upper hand (K=79.1, D=79.7) | Volume surge (3.5x)
════════════════════
🔴 $ZRO 30-minute Bullish Signal
⚠️ Technicals: ADX(45) indicates a clear trending market | MACD forms an upside “golden cross” above zero; bullish momentum is released | EMA5 > EMA8 > EMA13, bullish alignment | KDJ is strongly trending upward; bulls hold the upper hand (K=75.8, D=77.6) | Volume expands (2.4x)
📢 Market Update: Binance Will Support the Stargate Finance (STG) Token Merge to LayerZero (ZRO)
════════════════════
🔴 $XAU 30-minute Bullish Signal
⚠️ Technicals: ADX(41) indicates a clear trending market | MACD is running bullish; the trend is stronger overall, but momentum is weakening | EMA5 > EMA8 > EMA13, bullish alignment | KDJ is strongly trending upward; bulls hold the upper hand (K=55.3, D=50.3) | Volume expands (1.7x)
════════════════════
🔔 Watch for first-hand market movements and anomalies 🔔
#技术分析 #GLW #ZRO #XAU
📌 When trading, make sure the candlestick pattern matches
$GLW / $ZRO / $XAU 30-minute timeframe: too bullish overall. Short-term resonance opportunities are here🔥
════════════════════
🔴 $GLW 30-minute Bullish Signal
⚠️ Technicals: ADX(39) indicates a clear trending market | MACD forms an upside “golden cross” above zero; bullish momentum is released | EMA5 > EMA8 > EMA13, bullish alignment | KDJ is strongly trending upward; bulls hold the upper hand (K=79.1, D=79.7) | Volume surge (3.5x)
════════════════════
🔴 $ZRO 30-minute Bullish Signal
⚠️ Technicals: ADX(45) indicates a clear trending market | MACD forms an upside “golden cross” above zero; bullish momentum is released | EMA5 > EMA8 > EMA13, bullish alignment | KDJ is strongly trending upward; bulls hold the upper hand (K=75.8, D=77.6) | Volume expands (2.4x)
📢 Market Update: Binance Will Support the Stargate Finance (STG) Token Merge to LayerZero (ZRO)
════════════════════
🔴 $XAU 30-minute Bullish Signal
⚠️ Technicals: ADX(41) indicates a clear trending market | MACD is running bullish; the trend is stronger overall, but momentum is weakening | EMA5 > EMA8 > EMA13, bullish alignment | KDJ is strongly trending upward; bulls hold the upper hand (K=55.3, D=50.3) | Volume expands (1.7x)
════════════════════
🔔 Watch for first-hand market movements and anomalies 🔔
#技术分析 #GLW #ZRO #XAU
📌 When trading, make sure the candlestick pattern matches
════════════════════
🔴 $GLW 30-minute Bullish Signal
⚠️ Technicals: ADX(39) indicates a clear trending market | MACD forms an upside “golden cross” above zero; bullish momentum is released | EMA5 > EMA8 > EMA13, bullish alignment | KDJ is strongly trending upward; bulls hold the upper hand (K=79.1, D=79.7) | Volume surge (3.5x)
════════════════════
🔴 $ZRO 30-minute Bullish Signal
⚠️ Technicals: ADX(45) indicates a clear trending market | MACD forms an upside “golden cross” above zero; bullish momentum is released | EMA5 > EMA8 > EMA13, bullish alignment | KDJ is strongly trending upward; bulls hold the upper hand (K=75.8, D=77.6) | Volume expands (2.4x)
📢 Market Update: Binance Will Support the Stargate Finance (STG) Token Merge to LayerZero (ZRO)
════════════════════
🔴 $XAU 30-minute Bullish Signal
⚠️ Technicals: ADX(41) indicates a clear trending market | MACD is running bullish; the trend is stronger overall, but momentum is weakening | EMA5 > EMA8 > EMA13, bullish alignment | KDJ is strongly trending upward; bulls hold the upper hand (K=55.3, D=50.3) | Volume expands (1.7x)
════════════════════
🔔 Watch for first-hand market movements and anomalies 🔔
#技术分析 #GLW #ZRO #XAU
📌 When trading, make sure the candlestick pattern matches
147
·
--
$GLW rose slightly by 0.97% over the past 24 hours to 150.92, with the funding rate unchanged at zero. The price volatility is extremely low, but OI still has 59,600 contracts in play. This creates a micro observation: prices are flat, positions haven’t been withdrawn, and both longs and shorts are grinding in a narrow range. There’s currently no pressure from one-sided funding rate squeezes; it’s a quiet phase in the market. If it breaks below the recent low at 145, the existing long positions will start to passively exit. I’ll first test with a small order of $300 around 150, with a stop-loss set at 145.
Trading tag: #TradFi #链上美股 #GLW
Where do you think this assessment is most likely to be wrong?
$GLW rose slightly by 0.97% over the past 24 hours to 150.92, with the funding rate unchanged at zero. The price volatility is extremely low, but OI still has 59,600 contracts in play. This creates a micro observation: prices are flat, positions haven’t been withdrawn, and both longs and shorts are grinding in a narrow range. There’s currently no pressure from one-sided funding rate squeezes; it’s a quiet phase in the market. If it breaks below the recent low at 145, the existing long positions will start to passively exit. I’ll first test with a small order of $300 around 150, with a stop-loss set at 145.
Trading tag: #TradFi #链上美股 #GLW
Where do you think this assessment is most likely to be wrong?
Trading tag: #TradFi #链上美股 #GLW
Where do you think this assessment is most likely to be wrong?
77
·
--
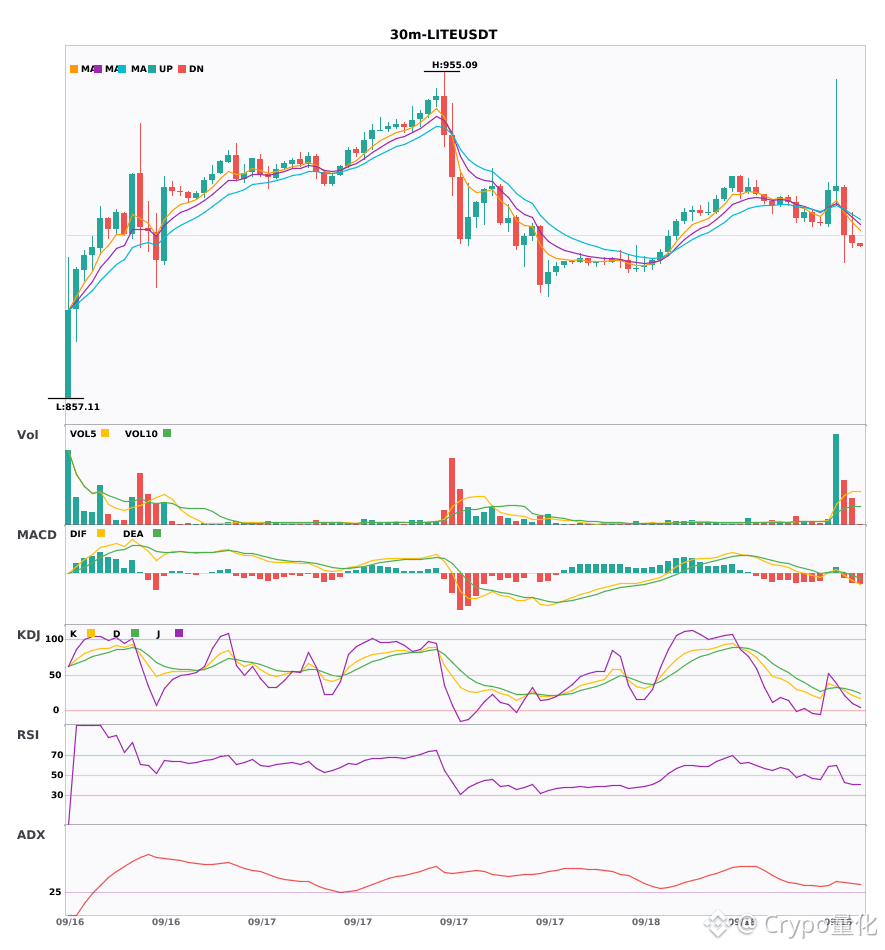
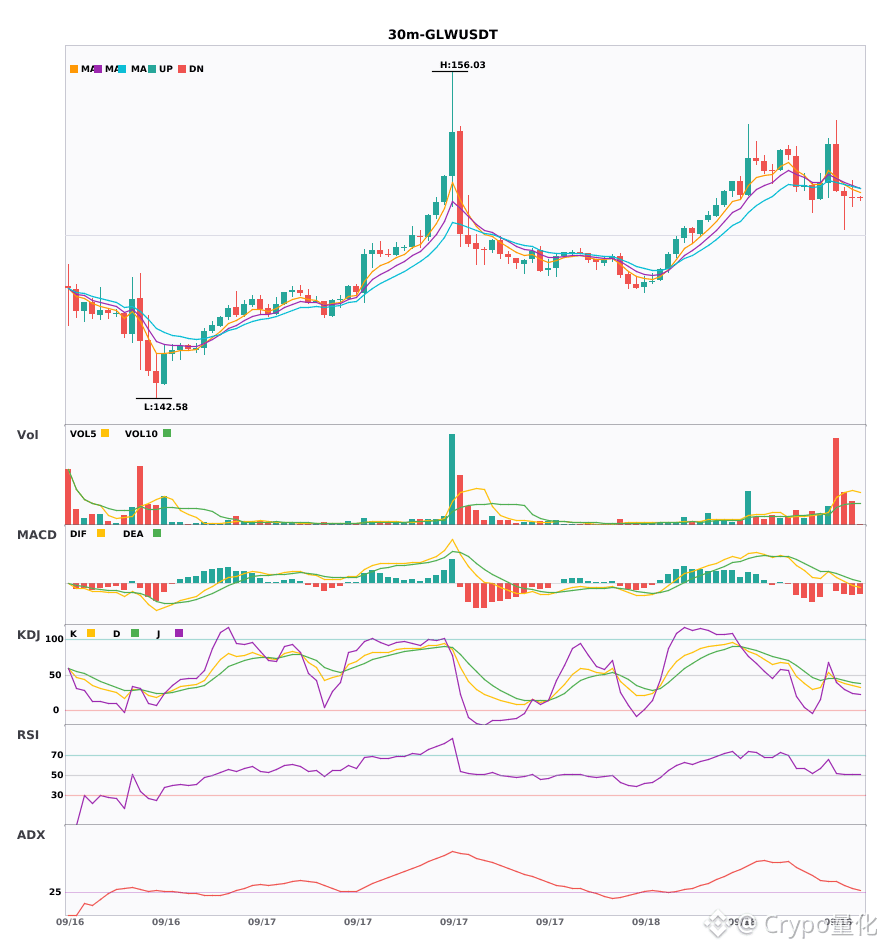
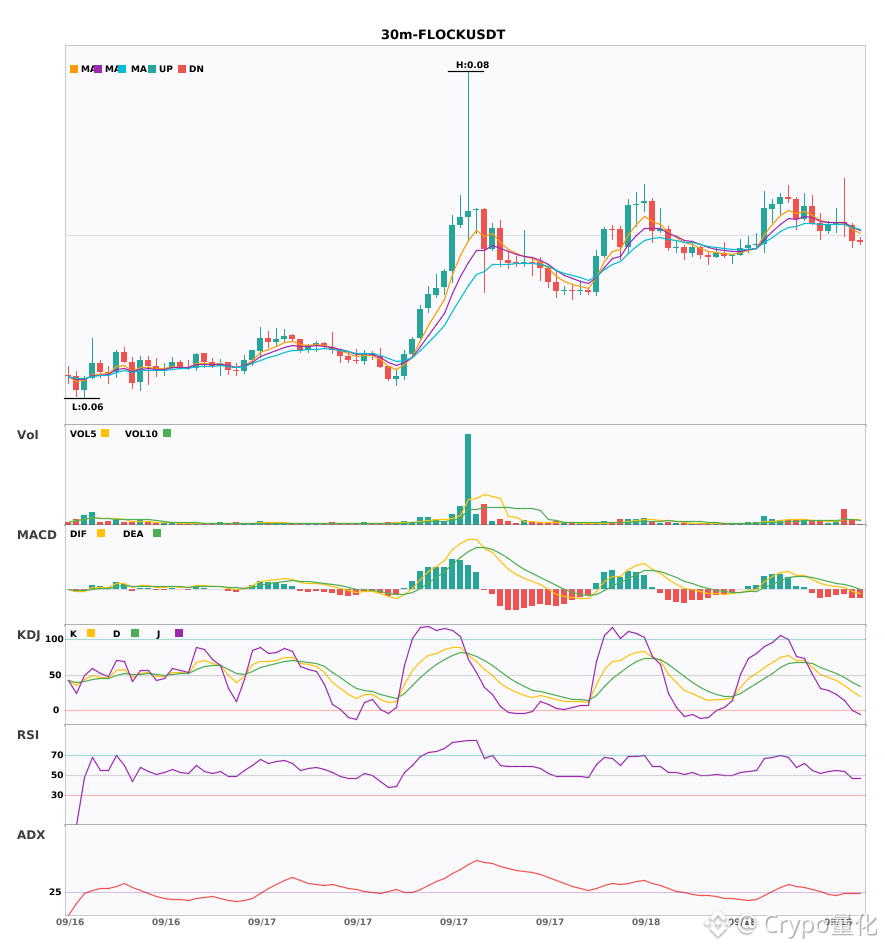
$LITE $GLW $FLOCK 30 minutes resonance turns to short-selling. Bear signals all fire 🔥
════════════════════
🟢 $LITE 30 minutes short-selling signal
⚠️ Technicals: ADX(39) clearly shows a trending market | MACD dead cross below zero; bearish acceleration | EMA5 crosses below EMA8, turning bearish in the short term | KDJ dead cross; short-term bearish (K is 27.7, D is 30.6) | Volume explodes (7.4x)
════════════════════
🟢 $GLW 30 minutes short-selling signal
⚠️ Technicals: ADX(28) trend is forming; can participate | MACD DIF falls below the zero line; trend turns bearish | Moving averages are sticking together to build up momentum, about to choose a direction | KDJ is weak, bears have the upper hand (K is 34.9, D is 40.0) | Volume expands (1.6x)
════════════════════
🟢 $FLOCK 30 minutes short-selling signal
⚠️ Technicals: ADX(25) trend is forming; can participate | MACD DIF breaks below the zero line; trend turns bearish | EMA5 < EMA8 < EMA13; bearish alignment | KDJ is weak, bears have the upper hand (K is 26.7, D is 39.7) | Volume explodes (2.9x)
════════════════════
🔔 Follow to get first-hand alerts on market anomalies 🔔
#技术分析 #LITE #GLW #FLOCK
📌 When trading, pay attention to whether the candlestick patterns match
$LITE $GLW $FLOCK 30 minutes resonance turns to short-selling. Bear signals all fire 🔥
════════════════════
🟢 $LITE 30 minutes short-selling signal
⚠️ Technicals: ADX(39) clearly shows a trending market | MACD dead cross below zero; bearish acceleration | EMA5 crosses below EMA8, turning bearish in the short term | KDJ dead cross; short-term bearish (K is 27.7, D is 30.6) | Volume explodes (7.4x)
════════════════════
🟢 $GLW 30 minutes short-selling signal
⚠️ Technicals: ADX(28) trend is forming; can participate | MACD DIF falls below the zero line; trend turns bearish | Moving averages are sticking together to build up momentum, about to choose a direction | KDJ is weak, bears have the upper hand (K is 34.9, D is 40.0) | Volume expands (1.6x)
════════════════════
🟢 $FLOCK 30 minutes short-selling signal
⚠️ Technicals: ADX(25) trend is forming; can participate | MACD DIF breaks below the zero line; trend turns bearish | EMA5 < EMA8 < EMA13; bearish alignment | KDJ is weak, bears have the upper hand (K is 26.7, D is 39.7) | Volume explodes (2.9x)
════════════════════
🔔 Follow to get first-hand alerts on market anomalies 🔔
#技术分析 #LITE #GLW #FLOCK
📌 When trading, pay attention to whether the candlestick patterns match
════════════════════
🟢 $LITE 30 minutes short-selling signal
⚠️ Technicals: ADX(39) clearly shows a trending market | MACD dead cross below zero; bearish acceleration | EMA5 crosses below EMA8, turning bearish in the short term | KDJ dead cross; short-term bearish (K is 27.7, D is 30.6) | Volume explodes (7.4x)
════════════════════
🟢 $GLW 30 minutes short-selling signal
⚠️ Technicals: ADX(28) trend is forming; can participate | MACD DIF falls below the zero line; trend turns bearish | Moving averages are sticking together to build up momentum, about to choose a direction | KDJ is weak, bears have the upper hand (K is 34.9, D is 40.0) | Volume expands (1.6x)
════════════════════
🟢 $FLOCK 30 minutes short-selling signal
⚠️ Technicals: ADX(25) trend is forming; can participate | MACD DIF breaks below the zero line; trend turns bearish | EMA5 < EMA8 < EMA13; bearish alignment | KDJ is weak, bears have the upper hand (K is 26.7, D is 39.7) | Volume explodes (2.9x)
════════════════════
🔔 Follow to get first-hand alerts on market anomalies 🔔
#技术分析 #LITE #GLW #FLOCK
📌 When trading, pay attention to whether the candlestick patterns match
256
·
--
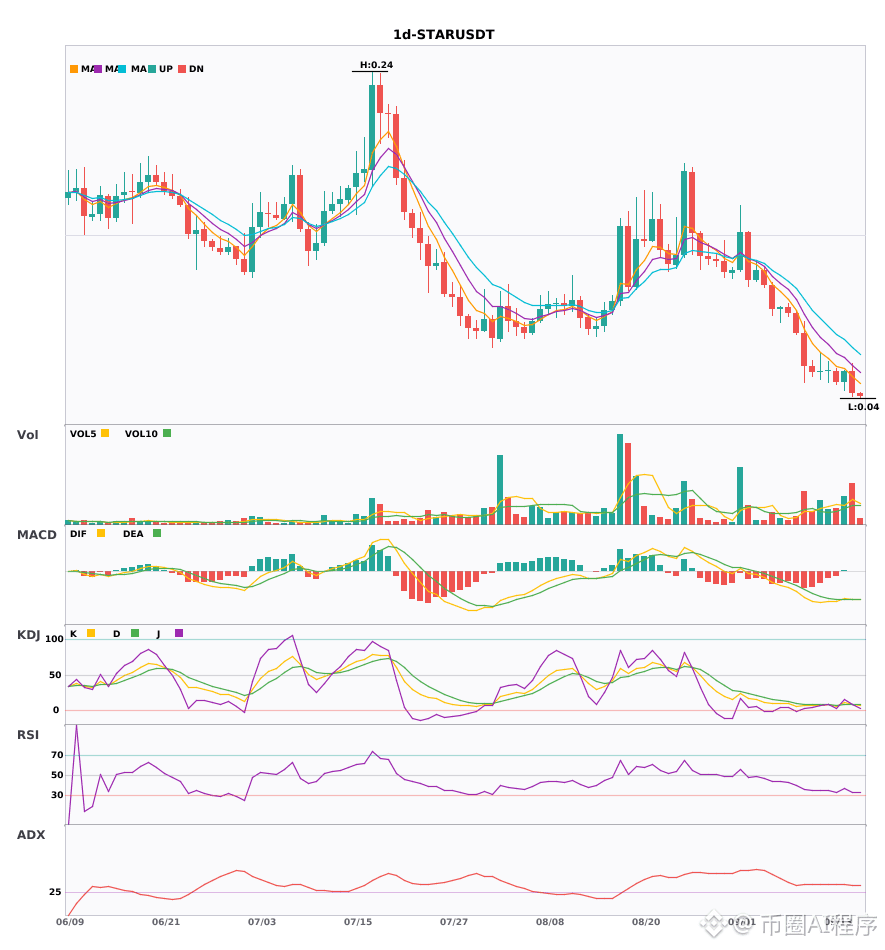
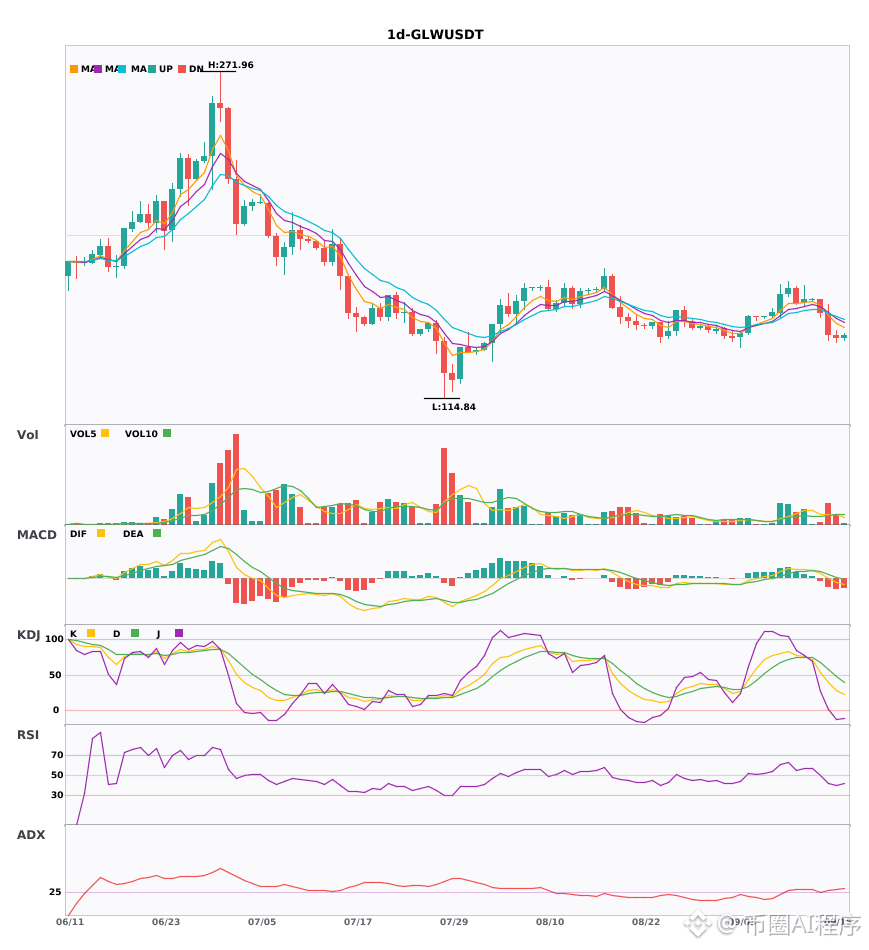
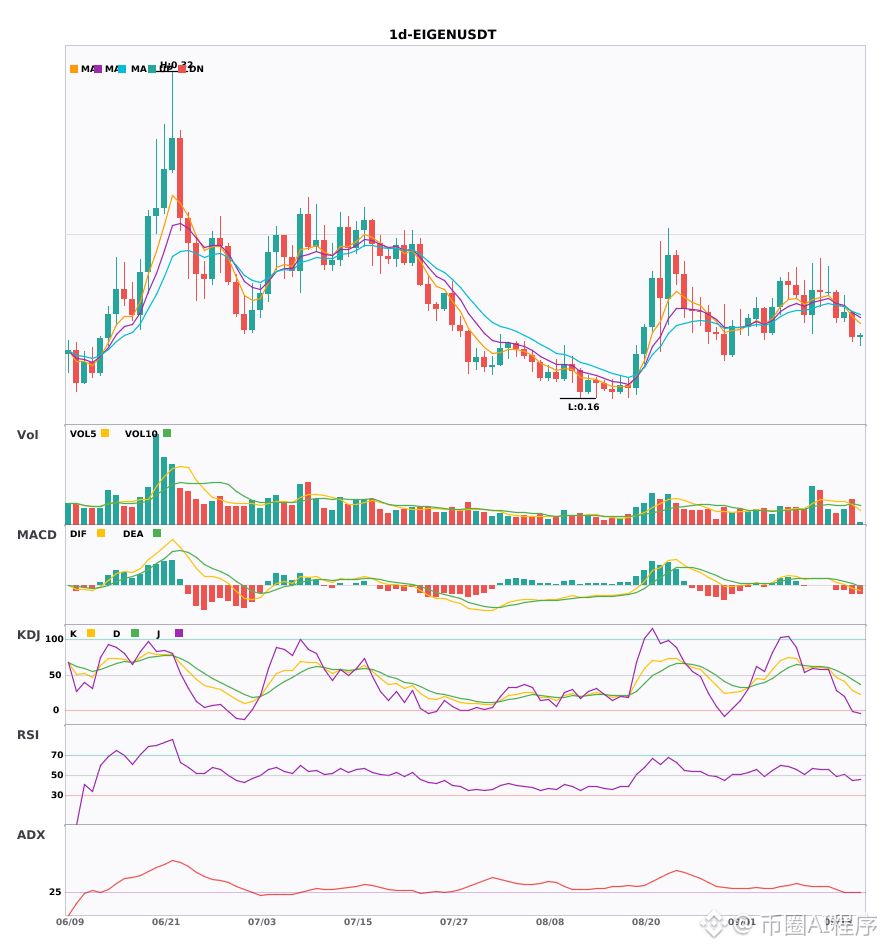
2026-09-16_Daily multi-timeframe resonance bearish-potential coins Part 2/2
Ranking does not indicate priority or trading advice. Please verify the trend again when trading, and watch for divergences.
════════════════════
🟢 $STAR resonance bearish
════════════════════
🟢 $GLW resonance bearish
════════════════════
🟢 $EIGEN resonance bearish
════════════════════
📊 Indicator notes:
This series uses daily + weekly multi-timeframe resonance:
① Daily chart (signal layer): trigger if any one is met:
• MACD forms a death cross below zero (DIF crosses below DEA and DIF < 0)
• First time EMA bearish stacking forms (EMA5<EMA8<EMA13, with the previous candle not satisfying it)
• Additional: ADX(7) > 25 confirms the trend + increased volume (volume ratio > 1.2)
② Weekly chart (confirmation layer): EMA5<EMA8<EMA13 and DIF < 0
Only when both layers align in the bearish direction (daily + weekly both bearish) is it considered resonance.
Resonance signals are more reliable than single-timeframe signals—multi-timeframe alignment in the same direction implies trend consensus.
#多周期共振 #STAR #GLW #EIGEN
📌 The above is for reference only and does not constitute investment advice
🔔 Follow to get the first-hand live market anomaly updates 🔔
2026-09-16_Daily multi-timeframe resonance bearish-potential coins Part 2/2
Ranking does not indicate priority or trading advice. Please verify the trend again when trading, and watch for divergences.
════════════════════
🟢 $STAR resonance bearish
════════════════════
🟢 $GLW resonance bearish
════════════════════
🟢 $EIGEN resonance bearish
════════════════════
📊 Indicator notes:
This series uses daily + weekly multi-timeframe resonance:
① Daily chart (signal layer): trigger if any one is met:
• MACD forms a death cross below zero (DIF crosses below DEA and DIF < 0)
• First time EMA bearish stacking forms (EMA5<EMA8<EMA13, with the previous candle not satisfying it)
• Additional: ADX(7) > 25 confirms the trend + increased volume (volume ratio > 1.2)
② Weekly chart (confirmation layer): EMA5<EMA8<EMA13 and DIF < 0
Only when both layers align in the bearish direction (daily + weekly both bearish) is it considered resonance.
Resonance signals are more reliable than single-timeframe signals—multi-timeframe alignment in the same direction implies trend consensus.
#多周期共振 #STAR #GLW #EIGEN
📌 The above is for reference only and does not constitute investment advice
🔔 Follow to get the first-hand live market anomaly updates 🔔
Ranking does not indicate priority or trading advice. Please verify the trend again when trading, and watch for divergences.
════════════════════
🟢 $STAR resonance bearish
════════════════════
🟢 $GLW resonance bearish
════════════════════
🟢 $EIGEN resonance bearish
════════════════════
📊 Indicator notes:
This series uses daily + weekly multi-timeframe resonance:
① Daily chart (signal layer): trigger if any one is met:
• MACD forms a death cross below zero (DIF crosses below DEA and DIF < 0)
• First time EMA bearish stacking forms (EMA5<EMA8<EMA13, with the previous candle not satisfying it)
• Additional: ADX(7) > 25 confirms the trend + increased volume (volume ratio > 1.2)
② Weekly chart (confirmation layer): EMA5<EMA8<EMA13 and DIF < 0
Only when both layers align in the bearish direction (daily + weekly both bearish) is it considered resonance.
Resonance signals are more reliable than single-timeframe signals—multi-timeframe alignment in the same direction implies trend consensus.
#多周期共振 #STAR #GLW #EIGEN
📌 The above is for reference only and does not constitute investment advice
🔔 Follow to get the first-hand live market anomaly updates 🔔
8

·
--
$GLW 24 hours saw a 8.4% drop to 144.38, and the funding fee is still positive at 0.000064. This structure is quite interesting—while it’s falling, it still pays longs. It suggests that market consensus is still bullish.
The longs are propping it up. OI is close to 50,000 contracts, and a positive funding fee means longs are paying shorts. They’re bearing the costs despite the negative price trend. The combination of a drop plus a positive fee is the most dangerous if it keeps getting pushed lower. If the longs can’t hold and get liquidated, it can trigger a cascade of liquidations. Shorts are basically receiving free money right now, so they don’t need to rush.
Trading tag: #TradFi #链上美股 #GLW
Where do you think this assessment is most likely to be wrong?
$GLW 24 hours saw a 8.4% drop to 144.38, and the funding fee is still positive at 0.000064. This structure is quite interesting—while it’s falling, it still pays longs. It suggests that market consensus is still bullish.
The longs are propping it up. OI is close to 50,000 contracts, and a positive funding fee means longs are paying shorts. They’re bearing the costs despite the negative price trend. The combination of a drop plus a positive fee is the most dangerous if it keeps getting pushed lower. If the longs can’t hold and get liquidated, it can trigger a cascade of liquidations. Shorts are basically receiving free money right now, so they don’t need to rush.
Trading tag: #TradFi #链上美股 #GLW
Where do you think this assessment is most likely to be wrong?
The longs are propping it up. OI is close to 50,000 contracts, and a positive funding fee means longs are paying shorts. They’re bearing the costs despite the negative price trend. The combination of a drop plus a positive fee is the most dangerous if it keeps getting pushed lower. If the longs can’t hold and get liquidated, it can trigger a cascade of liquidations. Shorts are basically receiving free money right now, so they don’t need to rush.
Trading tag: #TradFi #链上美股 #GLW
Where do you think this assessment is most likely to be wrong?
97
·
--
$GLW current price 144.38, down 8.412% in 24 hours. Funding rate 0.00006407. Longs pay shorts, but the funding rate is extremely low. OI is 49695. Price is falling alongside a positive funding rate—longs are getting trapped and adding to positions, but not to an extreme level. This single signal points to downside pressure on equity-like tokens under macro risk-asset selloff pressure. The strongest counter-evidence is that if macro sentiment suddenly turns warmer—e.g., the US dollar weakens—it could reverse the downtrend. I will reduce exposure when the price breaks below 140; otherwise I’ll stay on the sidelines. The invalidation condition is that the price recovers above 150 and funding turns negative.
Trading tag: #TradFi #链上美股 #GLW
Where do you think this thesis is most likely to be wrong?
$GLW current price 144.38, down 8.412% in 24 hours. Funding rate 0.00006407. Longs pay shorts, but the funding rate is extremely low. OI is 49695. Price is falling alongside a positive funding rate—longs are getting trapped and adding to positions, but not to an extreme level. This single signal points to downside pressure on equity-like tokens under macro risk-asset selloff pressure. The strongest counter-evidence is that if macro sentiment suddenly turns warmer—e.g., the US dollar weakens—it could reverse the downtrend. I will reduce exposure when the price breaks below 140; otherwise I’ll stay on the sidelines. The invalidation condition is that the price recovers above 150 and funding turns negative.
Trading tag: #TradFi #链上美股 #GLW
Where do you think this thesis is most likely to be wrong?
Trading tag: #TradFi #链上美股 #GLW
Where do you think this thesis is most likely to be wrong?
56

·
--
#费城半导体指数跌5.9% From Edison light bulbs → Jobs phones → Huang Renxun AI data centers
Corning used 175 years to prove: the real long-distance runners never chase the headlines—the headlines come looking for them
Founded in 1851
Glass for Edison’s light bulbs in the 1880s
In 1970, invented low-loss optical fiber, ushering in the internet era
In 2007, forced out “Gorilla Glass” by Steve Jobs
In 2026, became a common supplier for Meta, Amazon, Nvidia, and Verizon. Now it’s rapidly expanding optical-communications capacity in the U.S., aiming to increase domestic optical-connection capacity by 10x. In the AI era, what’s missing isn’t GPUs, but the optical links that can connect GPUs at high speed.
And Corning is, almost certainly, one of the most undervalued in this race. Is $GLW worth paying attention to? Share your thoughts in the comments. #AI #data center #Corning #GLW
#费城半导体指数跌5.9% From Edison light bulbs → Jobs phones → Huang Renxun AI data centers
Corning used 175 years to prove: the real long-distance runners never chase the headlines—the headlines come looking for them
Founded in 1851
Glass for Edison’s light bulbs in the 1880s
In 1970, invented low-loss optical fiber, ushering in the internet era
In 2007, forced out “Gorilla Glass” by Steve Jobs
In 2026, became a common supplier for Meta, Amazon, Nvidia, and Verizon. Now it’s rapidly expanding optical-communications capacity in the U.S., aiming to increase domestic optical-connection capacity by 10x. In the AI era, what’s missing isn’t GPUs, but the optical links that can connect GPUs at high speed.
And Corning is, almost certainly, one of the most undervalued in this race. Is $GLW worth paying attention to? Share your thoughts in the comments. #AI #data center #Corning #GLW
Corning used 175 years to prove: the real long-distance runners never chase the headlines—the headlines come looking for them
Founded in 1851
Glass for Edison’s light bulbs in the 1880s
In 1970, invented low-loss optical fiber, ushering in the internet era
In 2007, forced out “Gorilla Glass” by Steve Jobs
In 2026, became a common supplier for Meta, Amazon, Nvidia, and Verizon. Now it’s rapidly expanding optical-communications capacity in the U.S., aiming to increase domestic optical-connection capacity by 10x. In the AI era, what’s missing isn’t GPUs, but the optical links that can connect GPUs at high speed.
And Corning is, almost certainly, one of the most undervalued in this race. Is $GLW worth paying attention to? Share your thoughts in the comments. #AI #data center #Corning #GLW
73
·
--
Corning’s latest Gorilla Glass Ceramic 3: after dropping from a 2-meter height onto concrete, it still doesn’t break. Just released—Gorilla Glass Ceramic 3 tested: simulating a concrete surface, >2 meters drop and remains intact.
Simulating an asphalt surface, repeatedly striking from 1 meter more than 20 times without breaking.
Motorola’s new foldable screen debuts with it. Meanwhile, the optical communications business is booming—AI data center demand directly pushes Corning’s optical business growth to 30%+. Selling phone protective glass on one side, and AI data center fiber on the other—benefits on both ends.
Companies driven by a “consumer electronics + AI infrastructure” dual-engine model aren’t that common even at Binance Square. Which do you think is more promising for its glass business or its fiber business? #GorillaGlass #AIinfrastructure #GLW $GLW
{future}(GLWUSDT)
Corning’s latest Gorilla Glass Ceramic 3: after dropping from a 2-meter height onto concrete, it still doesn’t break. Just released—Gorilla Glass Ceramic 3 tested: simulating a concrete surface, >2 meters drop and remains intact.
Simulating an asphalt surface, repeatedly striking from 1 meter more than 20 times without breaking.
Motorola’s new foldable screen debuts with it. Meanwhile, the optical communications business is booming—AI data center demand directly pushes Corning’s optical business growth to 30%+. Selling phone protective glass on one side, and AI data center fiber on the other—benefits on both ends.
Companies driven by a “consumer electronics + AI infrastructure” dual-engine model aren’t that common even at Binance Square. Which do you think is more promising for its glass business or its fiber business? #GorillaGlass #AIinfrastructure #GLW $GLW
Simulating an asphalt surface, repeatedly striking from 1 meter more than 20 times without breaking.
Motorola’s new foldable screen debuts with it. Meanwhile, the optical communications business is booming—AI data center demand directly pushes Corning’s optical business growth to 30%+. Selling phone protective glass on one side, and AI data center fiber on the other—benefits on both ends.
Companies driven by a “consumer electronics + AI infrastructure” dual-engine model aren’t that common even at Binance Square. Which do you think is more promising for its glass business or its fiber business? #GorillaGlass #AIinfrastructure #GLW $GLW
1
132
·
--

Article
$GLW Corning: The King Returns$GLW Corning: A 175-year-old glass company is becoming a key enabler of AI infrastructure. Many people only know Corning for making Gorilla Glass, but they don’t know it’s now frantically cashing in on AI gains: has signed a long-term fiber-optic agreement with Meta worth up to $6 billion.
Signed a deal worth billions of dollars in fiber optic cables with Amazon.
Partnering with Nvidia to expand a U.S. optical communications factory, boosting capacity by 10x
Just finalized with Verizon an ultra-large-scale fiber supply agreement through 2032.
Internal goal: achieve annualized revenue of $30 billion by 2028, with a target of $40 billion by 2030. From inventing low-loss optical fiber in 1970 to today supplying “blood vessels” for AI data centers, Corning is once again positioned at the most critical point in the times. No matter how powerful the AI compute is, it can’t run without high-speed optical connectivity.
$GLW Corning: The King Returns
$GLW Corning: A 175-year-old glass company is becoming a key enabler of AI infrastructure. Many people only know Corning for making Gorilla Glass, but they don’t know it’s now frantically cashing in on AI gains: has signed a long-term fiber-optic agreement with Meta worth up to $6 billion.
Signed a deal worth billions of dollars in fiber optic cables with Amazon.
Partnering with Nvidia to expand a U.S. optical communications factory, boosting capacity by 10x
Just finalized with Verizon an ultra-large-scale fiber supply agreement through 2032.
Internal goal: achieve annualized revenue of $30 billion by 2028, with a target of $40 billion by 2030. From inventing low-loss optical fiber in 1970 to today supplying “blood vessels” for AI data centers, Corning is once again positioned at the most critical point in the times. No matter how powerful the AI compute is, it can’t run without high-speed optical connectivity.
Signed a deal worth billions of dollars in fiber optic cables with Amazon.
Partnering with Nvidia to expand a U.S. optical communications factory, boosting capacity by 10x
Just finalized with Verizon an ultra-large-scale fiber supply agreement through 2032.
Internal goal: achieve annualized revenue of $30 billion by 2028, with a target of $40 billion by 2030. From inventing low-loss optical fiber in 1970 to today supplying “blood vessels” for AI data centers, Corning is once again positioned at the most critical point in the times. No matter how powerful the AI compute is, it can’t run without high-speed optical connectivity.
1
111
·
--
$GLW contract spot price is 146.13, down 6.864% over the past 24 hours. The funding rate remains at zero, and the open interest is 43,265.95. While the price is falling, the funding rate is unchanged, indicating that selling pressure is coming from spot or adjustments in longer-dated contracts—not from leveraged longs stopping out or shorts getting squeezed. Since open interest hasn’t been reduced significantly, institutional positions may still be observing. A zero funding rate means the position cost is effectively zero; therefore, selling now is driven more by sentiment than by forced liquidation.
The strongest counter-evidence is this: if the U.S. stock market rebounds, equity contracts like $GLW may move up as well. However, with a zero funding rate, the rebound momentum is usually relatively weak. Second-order effects: current holders may be in unrealized losses but have no additional cost, so they might choose to hold through. Only if the price keeps falling would a chain of stop-outs be triggered.
My view is that the short-side thesis only breaks if the price rebounds above 150 and the funding rate turns positive. In terms of actions: aggressive traders can take a light long position near the current price to bet on the rebound; conservative traders can hold their positions and wait for changes in the funding rate; risk-averse traders can close out and exit until the daily candle closes above 150.
Trading tag: #TradFi #链上美股 #GLW
Where do you think this set of conclusions is most likely to be wrong?
$GLW contract spot price is 146.13, down 6.864% over the past 24 hours. The funding rate remains at zero, and the open interest is 43,265.95. While the price is falling, the funding rate is unchanged, indicating that selling pressure is coming from spot or adjustments in longer-dated contracts—not from leveraged longs stopping out or shorts getting squeezed. Since open interest hasn’t been reduced significantly, institutional positions may still be observing. A zero funding rate means the position cost is effectively zero; therefore, selling now is driven more by sentiment than by forced liquidation.
The strongest counter-evidence is this: if the U.S. stock market rebounds, equity contracts like $GLW may move up as well. However, with a zero funding rate, the rebound momentum is usually relatively weak. Second-order effects: current holders may be in unrealized losses but have no additional cost, so they might choose to hold through. Only if the price keeps falling would a chain of stop-outs be triggered.
My view is that the short-side thesis only breaks if the price rebounds above 150 and the funding rate turns positive. In terms of actions: aggressive traders can take a light long position near the current price to bet on the rebound; conservative traders can hold their positions and wait for changes in the funding rate; risk-averse traders can close out and exit until the daily candle closes above 150.
Trading tag: #TradFi #链上美股 #GLW
Where do you think this set of conclusions is most likely to be wrong?
The strongest counter-evidence is this: if the U.S. stock market rebounds, equity contracts like $GLW may move up as well. However, with a zero funding rate, the rebound momentum is usually relatively weak. Second-order effects: current holders may be in unrealized losses but have no additional cost, so they might choose to hold through. Only if the price keeps falling would a chain of stop-outs be triggered.
My view is that the short-side thesis only breaks if the price rebounds above 150 and the funding rate turns positive. In terms of actions: aggressive traders can take a light long position near the current price to bet on the rebound; conservative traders can hold their positions and wait for changes in the funding rate; risk-averse traders can close out and exit until the daily candle closes above 150.
Trading tag: #TradFi #链上美股 #GLW
Where do you think this set of conclusions is most likely to be wrong?
57
·
--
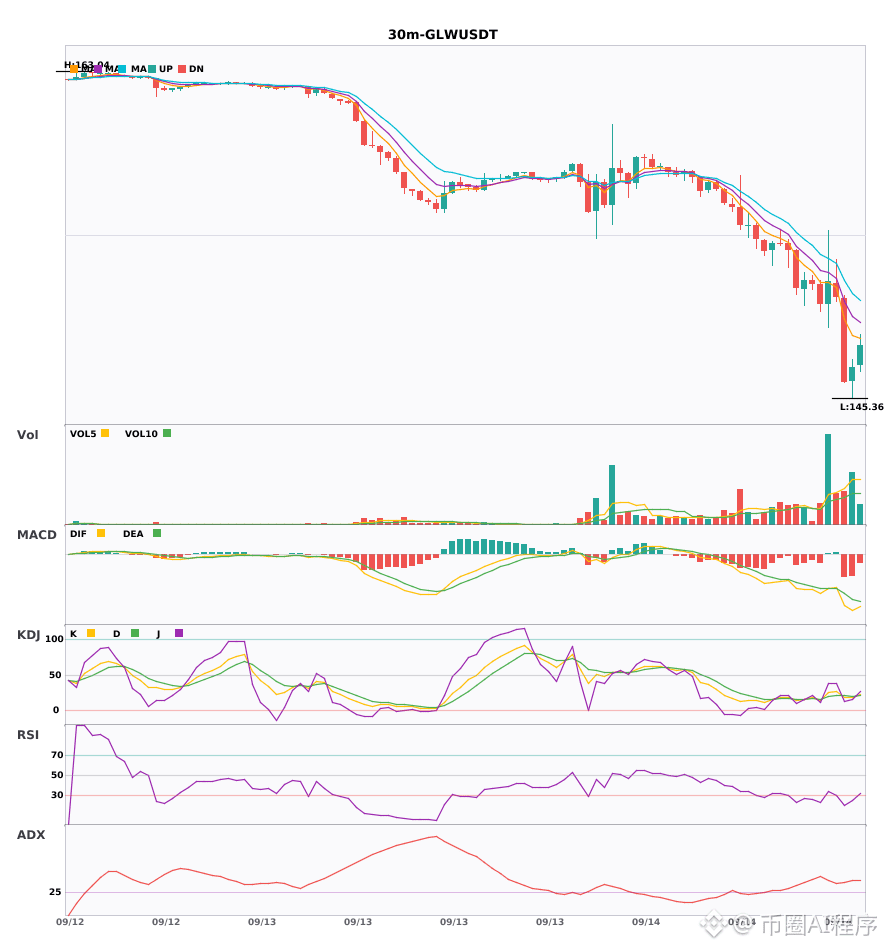
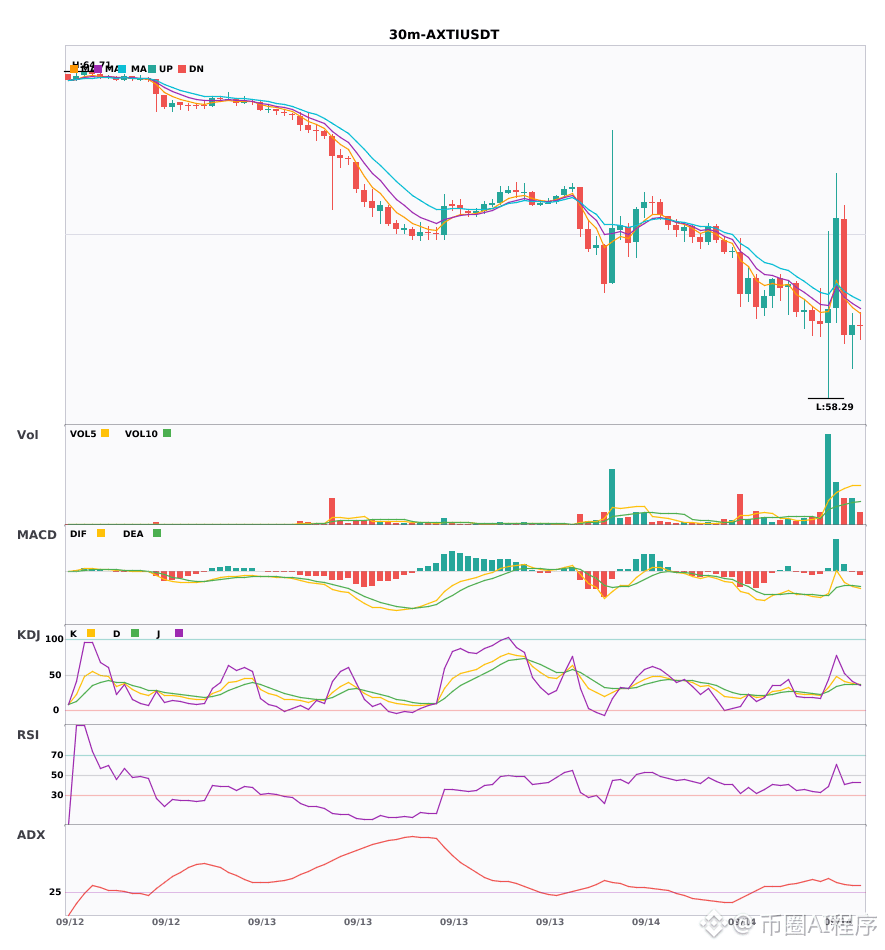
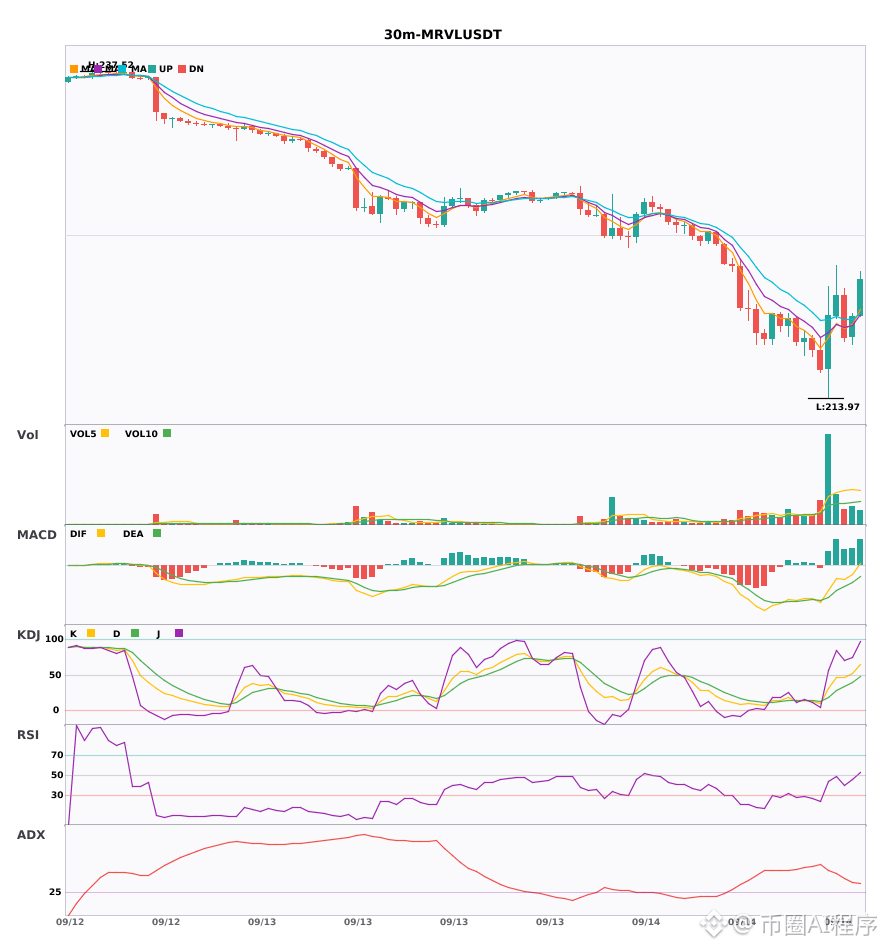
Multi-period resonance: $GLW / $AXTI / $MRVL 30 minutes weakens, 4-hour downtrend confirmation 🔥
════════════════════
🟢 $GLW 30 minutes Bearish signal
⚠️ Technical analysis: Multi-period resonance! 4-hour bearish confirmation + 30-minute entry signal. MACD dead cross below zero with green histogram expanding; moving averages aligned bearish and pointing downward; KDJ dead cross suggests bearish in the near term.
════════════════════
🟢 $AXTI 30 minutes Bearish signal
⚠️ Technical analysis: 4-hour bearish resonance confirmed | 30-minute entry. MACD DIF breaks below the zero axis, trend turns bearish. EMA5 crosses below EMA8, short-term turns bearish. KDJ is weak and bearish dominates (K is 41.5, D is 36.2). Volume expands (2.3x)
════════════════════
🟢 $MRVL 30 minutes Bearish signal
⚠️ Technical analysis: Multi-period resonance indicates bearish! 4-hour bearish trend confirmed. On the 30-minute chart, EMA5 crosses below EMA8, turning short-term bearish. KDJ shows weak bearish dominance; volume is 1.4x, normal.
════════════════════
🔔 Watch for first-hand market movement alerts 🔔
#多周期共振 #GLW #AXTI #MRVL
📌 When trading, pay attention to whether the candlestick pattern matches
Multi-period resonance: $GLW / $AXTI / $MRVL 30 minutes weakens, 4-hour downtrend confirmation 🔥
════════════════════
🟢 $GLW 30 minutes Bearish signal
⚠️ Technical analysis: Multi-period resonance! 4-hour bearish confirmation + 30-minute entry signal. MACD dead cross below zero with green histogram expanding; moving averages aligned bearish and pointing downward; KDJ dead cross suggests bearish in the near term.
════════════════════
🟢 $AXTI 30 minutes Bearish signal
⚠️ Technical analysis: 4-hour bearish resonance confirmed | 30-minute entry. MACD DIF breaks below the zero axis, trend turns bearish. EMA5 crosses below EMA8, short-term turns bearish. KDJ is weak and bearish dominates (K is 41.5, D is 36.2). Volume expands (2.3x)
════════════════════
🟢 $MRVL 30 minutes Bearish signal
⚠️ Technical analysis: Multi-period resonance indicates bearish! 4-hour bearish trend confirmed. On the 30-minute chart, EMA5 crosses below EMA8, turning short-term bearish. KDJ shows weak bearish dominance; volume is 1.4x, normal.
════════════════════
🔔 Watch for first-hand market movement alerts 🔔
#多周期共振 #GLW #AXTI #MRVL
📌 When trading, pay attention to whether the candlestick pattern matches
════════════════════
🟢 $GLW 30 minutes Bearish signal
⚠️ Technical analysis: Multi-period resonance! 4-hour bearish confirmation + 30-minute entry signal. MACD dead cross below zero with green histogram expanding; moving averages aligned bearish and pointing downward; KDJ dead cross suggests bearish in the near term.
════════════════════
🟢 $AXTI 30 minutes Bearish signal
⚠️ Technical analysis: 4-hour bearish resonance confirmed | 30-minute entry. MACD DIF breaks below the zero axis, trend turns bearish. EMA5 crosses below EMA8, short-term turns bearish. KDJ is weak and bearish dominates (K is 41.5, D is 36.2). Volume expands (2.3x)
════════════════════
🟢 $MRVL 30 minutes Bearish signal
⚠️ Technical analysis: Multi-period resonance indicates bearish! 4-hour bearish trend confirmed. On the 30-minute chart, EMA5 crosses below EMA8, turning short-term bearish. KDJ shows weak bearish dominance; volume is 1.4x, normal.
════════════════════
🔔 Watch for first-hand market movement alerts 🔔
#多周期共振 #GLW #AXTI #MRVL
📌 When trading, pay attention to whether the candlestick pattern matches
151
·
--
Over the past 24 hours, $GLW has fallen 6.86%, with trading volume exceeding 14.55 million. This isn’t minor movement—especially for a traditional industry stock.
The drop may not be about the company itself, but rather tighter liquidity in the broader U.S. stock market. When the overall market faces pressure, capital tends to rotate out of high-Beta names or previously hot sectors and into defensives. The glass substrate sector that $GLW belongs to drew attention earlier, and now it’s exactly the kind of area that funds are being reallocated away from. A single downward price signal matters less when you also consider the funding rate is zero—this suggests there’s no obvious contract squeeze. More likely, the selling pressure is primarily coming from the spot market.
The counter-argument is straightforward: if the Fed releases a clear easing signal, or if there’s major news about large orders for glass substrate applications in AI packaging, the current sell-off logic would break immediately. Only when the price can climb back above 146.13 and stabilize would the short-term pressure truly be alleviated.
My plan is to wait and observe. In a downtrend, catching a falling knife carries too much risk—especially without clear macro turning-point signals. If the price keeps churning around 146 while trading volume shrinks, it could indicate that selling pressure is exhausted. Then it would make sense to consider a small probing position on the left side. Until then, I’d rather miss the opportunity.
Trading tag: #TradFi #链上美股 #GLW
Where do you think this line of reasoning is most likely to be wrong?
Over the past 24 hours, $GLW has fallen 6.86%, with trading volume exceeding 14.55 million. This isn’t minor movement—especially for a traditional industry stock.
The drop may not be about the company itself, but rather tighter liquidity in the broader U.S. stock market. When the overall market faces pressure, capital tends to rotate out of high-Beta names or previously hot sectors and into defensives. The glass substrate sector that $GLW belongs to drew attention earlier, and now it’s exactly the kind of area that funds are being reallocated away from. A single downward price signal matters less when you also consider the funding rate is zero—this suggests there’s no obvious contract squeeze. More likely, the selling pressure is primarily coming from the spot market.
The counter-argument is straightforward: if the Fed releases a clear easing signal, or if there’s major news about large orders for glass substrate applications in AI packaging, the current sell-off logic would break immediately. Only when the price can climb back above 146.13 and stabilize would the short-term pressure truly be alleviated.
My plan is to wait and observe. In a downtrend, catching a falling knife carries too much risk—especially without clear macro turning-point signals. If the price keeps churning around 146 while trading volume shrinks, it could indicate that selling pressure is exhausted. Then it would make sense to consider a small probing position on the left side. Until then, I’d rather miss the opportunity.
Trading tag: #TradFi #链上美股 #GLW
Where do you think this line of reasoning is most likely to be wrong?
The drop may not be about the company itself, but rather tighter liquidity in the broader U.S. stock market. When the overall market faces pressure, capital tends to rotate out of high-Beta names or previously hot sectors and into defensives. The glass substrate sector that $GLW belongs to drew attention earlier, and now it’s exactly the kind of area that funds are being reallocated away from. A single downward price signal matters less when you also consider the funding rate is zero—this suggests there’s no obvious contract squeeze. More likely, the selling pressure is primarily coming from the spot market.
The counter-argument is straightforward: if the Fed releases a clear easing signal, or if there’s major news about large orders for glass substrate applications in AI packaging, the current sell-off logic would break immediately. Only when the price can climb back above 146.13 and stabilize would the short-term pressure truly be alleviated.
My plan is to wait and observe. In a downtrend, catching a falling knife carries too much risk—especially without clear macro turning-point signals. If the price keeps churning around 146 while trading volume shrinks, it could indicate that selling pressure is exhausted. Then it would make sense to consider a small probing position on the left side. Until then, I’d rather miss the opportunity.
Trading tag: #TradFi #链上美股 #GLW
Where do you think this line of reasoning is most likely to be wrong?
33
·
--
Over the past 24 hours, $GLW has fallen by 6.86%. The price is back to 146.13, and trading volume has increased to 14.55 million. The funding rate has returned to zero, and open interest stands at 43,265.95 contracts.
Taken on its own, this set of data forms a clear negative signal: the price decline is accompanied by increased trading volume, which suggests that the selling pressure is real rather than a low-volume drift downward. The funding rate at zero is a key condition—it means that, for now, neither the long nor the short side is paying costs to maintain their positions, and the market game has entered a relatively balanced node. Looking at open interest as well, the drop has not triggered large-scale contract closures; this may imply that some shorts are using the decline to build positions, while longs have not yet conceded the outcome.
This is a single-signal interpretation, mainly based on the combination of price action and the funding rate. The strongest contrarian evidence would be: if, next, a high-volume bullish candle appears that directly absorbs today’s losses, and the funding rate quickly turns positive, then the downside momentum would be invalidated and the market could quickly shift into consolidation or a rebound. Conversely, if the price continues to fall and the funding rate turns negative, it indicates that shorts are starting to dominate pricing, and another leg lower may begin.
In terms of the transmission chain: for traders holding long positions, a zero funding rate reduces the position-wear cost, but the unrealized losses caused by the price decline are still real.
Trading tag: #TradFi #链上美股 #GLW
Where do you think this assessment is most likely to be wrong?
Over the past 24 hours, $GLW has fallen by 6.86%. The price is back to 146.13, and trading volume has increased to 14.55 million. The funding rate has returned to zero, and open interest stands at 43,265.95 contracts.
Taken on its own, this set of data forms a clear negative signal: the price decline is accompanied by increased trading volume, which suggests that the selling pressure is real rather than a low-volume drift downward. The funding rate at zero is a key condition—it means that, for now, neither the long nor the short side is paying costs to maintain their positions, and the market game has entered a relatively balanced node. Looking at open interest as well, the drop has not triggered large-scale contract closures; this may imply that some shorts are using the decline to build positions, while longs have not yet conceded the outcome.
This is a single-signal interpretation, mainly based on the combination of price action and the funding rate. The strongest contrarian evidence would be: if, next, a high-volume bullish candle appears that directly absorbs today’s losses, and the funding rate quickly turns positive, then the downside momentum would be invalidated and the market could quickly shift into consolidation or a rebound. Conversely, if the price continues to fall and the funding rate turns negative, it indicates that shorts are starting to dominate pricing, and another leg lower may begin.
In terms of the transmission chain: for traders holding long positions, a zero funding rate reduces the position-wear cost, but the unrealized losses caused by the price decline are still real.
Trading tag: #TradFi #链上美股 #GLW
Where do you think this assessment is most likely to be wrong?
Taken on its own, this set of data forms a clear negative signal: the price decline is accompanied by increased trading volume, which suggests that the selling pressure is real rather than a low-volume drift downward. The funding rate at zero is a key condition—it means that, for now, neither the long nor the short side is paying costs to maintain their positions, and the market game has entered a relatively balanced node. Looking at open interest as well, the drop has not triggered large-scale contract closures; this may imply that some shorts are using the decline to build positions, while longs have not yet conceded the outcome.
This is a single-signal interpretation, mainly based on the combination of price action and the funding rate. The strongest contrarian evidence would be: if, next, a high-volume bullish candle appears that directly absorbs today’s losses, and the funding rate quickly turns positive, then the downside momentum would be invalidated and the market could quickly shift into consolidation or a rebound. Conversely, if the price continues to fall and the funding rate turns negative, it indicates that shorts are starting to dominate pricing, and another leg lower may begin.
In terms of the transmission chain: for traders holding long positions, a zero funding rate reduces the position-wear cost, but the unrealized losses caused by the price decline are still real.
Trading tag: #TradFi #链上美股 #GLW
Where do you think this assessment is most likely to be wrong?
30

$GLW SHORT
🏁Entry: 159.06
💰Target 1: 158.28444198 (+0.49%)
💰Target 2: 157.37888396 (+1.06%)
💰Target 3: 156.02054693 (+1.91%)
⛔️Stop: 160.54833703 (-0.94%)
Market metrics at the time of entry do not include any additional indicators such as RSI, volume, or open interest, so all momentum is built solely on the current price reference. The short position is based on the 159.06 level, from which sellers are trying to develop a downward scenario. If bearish pressure persists, the asset may gradually move toward the planned targets.
⚠️ This is not financial advice. Trade at your own risk. DYOR.
#GLW #HEI #AKEUSDT 📈
$GLW
$GLW SHORT
🏁Entry: 159.06
💰Target 1: 158.28444198 (+0.49%)
💰Target 2: 157.37888396 (+1.06%)
💰Target 3: 156.02054693 (+1.91%)
⛔️Stop: 160.54833703 (-0.94%)
Market metrics at the time of entry do not include any additional indicators such as RSI, volume, or open interest, so all momentum is built solely on the current price reference. The short position is based on the 159.06 level, from which sellers are trying to develop a downward scenario. If bearish pressure persists, the asset may gradually move toward the planned targets.
⚠️ This is not financial advice. Trade at your own risk. DYOR.
#GLW #HEI #AKEUSDT 📈
$GLW
🏁Entry: 159.06
💰Target 1: 158.28444198 (+0.49%)
💰Target 2: 157.37888396 (+1.06%)
💰Target 3: 156.02054693 (+1.91%)
⛔️Stop: 160.54833703 (-0.94%)
Market metrics at the time of entry do not include any additional indicators such as RSI, volume, or open interest, so all momentum is built solely on the current price reference. The short position is based on the 159.06 level, from which sellers are trying to develop a downward scenario. If bearish pressure persists, the asset may gradually move toward the planned targets.
⚠️ This is not financial advice. Trade at your own risk. DYOR.
#GLW #HEI #AKEUSDT 📈
$GLW
15
Log in to explore more content
Join global crypto users on Binance Square
⚡️ Get latest and useful information about crypto.
💬 Trusted by the world’s largest crypto exchange.
👍 Discover real insights from verified creators.
Email / Phone number
Trending Topics
1
#CircleMints500MUSDCOnSolana
101,151 views
2,152 Discussing
2
#PolymarketBankFailureBetsDrawFDICConcern
98,973 views
1,896 Discussing
3
#BlackRockBuildsTokenizedPortfoliosForOndo
92,976 views
1,353 Discussing
4
#BitwiseFilesToListNEARETFOnNYSEArca
71,316 views
1,101 Discussing
5
#SECCommissionerPeirceToLeaveOct2
74,078 views
902 Discussing
6
#SECSaysBuybacksUpgradesDontMakeTokenSecurity
58,499 views
654 Discussing
7
#StrategyProposesDailyDividendsForPreferreds
14,080 views
239 Discussing
8
#CircleTetherFreezeBitgetHackerWallet
14,308 views
142 Discussing
9
#CoinMarketCapCompletesCoinglassAcquisition
15,601 views
190 Discussing
10
#QNTRises39%
121,689 views
1,721 Discussing