
#arm
arm
104,482 views
837 Discussing
Hot
Latest

·
--
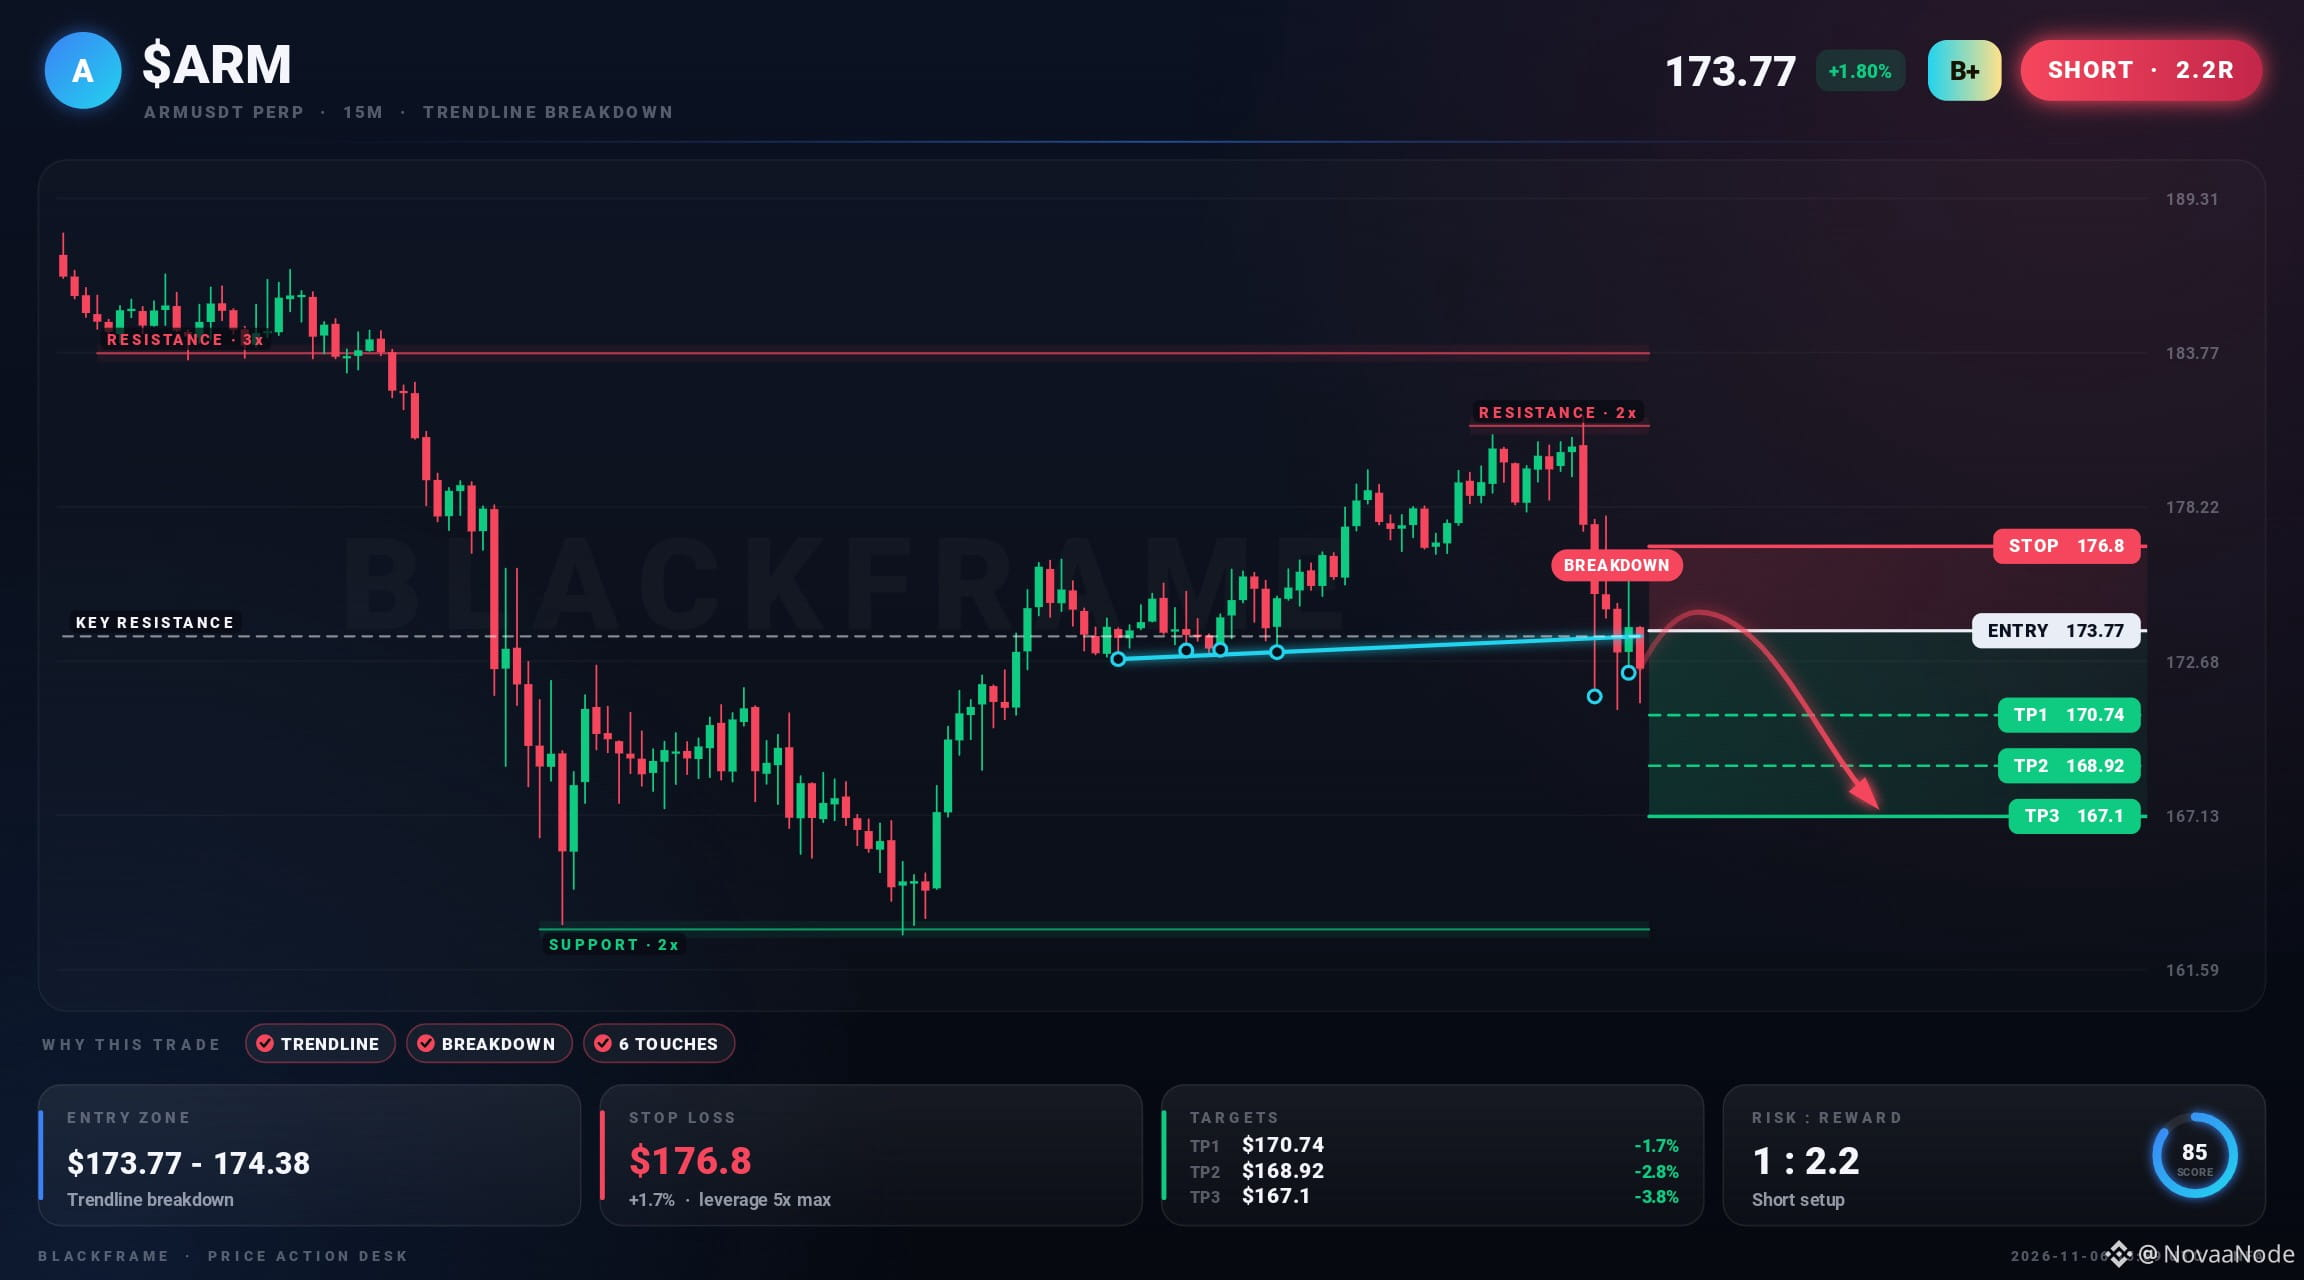
🩸 $ARM just lost the floor
SHORT · 15M
Entry: $173.77 - $174.53
TP1: $170.74
TP2: $168.92
TP3: $167.1
SL: $176.8
Price broke below a trendline near $173.57 and is holding it. Risk is defined just beyond the level.
#ARM #TradingSignals #Trading · NFA
🩸 $ARM just lost the floor
SHORT · 15M
Entry: $173.77 - $174.53
TP1: $170.74
TP2: $168.92
TP3: $167.1
SL: $176.8
Price broke below a trendline near $173.57 and is holding it. Risk is defined just beyond the level.
#ARM #TradingSignals #Trading · NFA
SHORT · 15M
Entry: $173.77 - $174.53
TP1: $170.74
TP2: $168.92
TP3: $167.1
SL: $176.8
Price broke below a trendline near $173.57 and is holding it. Risk is defined just beyond the level.
#ARM #TradingSignals #Trading · NFA
1
5

·
--
📈 $ARM CARVES A SHARP REBOUND FROM 234 DEEPS TO RECLAIM THE 245 BATTLEGROUND! ⚡
Entry: 244.0 - 246.0 ⚡
Target: 250.0 / 258.0 / 268.0 🚀
Stop Loss: 239.0 ⚠️
Buyers stepped up aggressively right inside the 234–238 demand pocket, driving consecutive green candles to flip 245 back into buyer territory. 📊 Order flow is shifting fast as momentum builds toward the major overhead hurdle at 248–250.
A clean break above 250 opens up a clear runway toward higher liquidity targets up to 268. 💡 The risk-to-reward ratio here looks exceptionally sharp as long as 239 holds firm. 💬 Are you loading bids on this reclaim or waiting for the 250 breakout confirmation? 👇
⚠️ Not financial advice. Always manage your risk. 🛡️
🏷️ #ARM #LongSetup #Breakout #Crypto #ZEC
🔥 ⚡
📈 $ARM CARVES A SHARP REBOUND FROM 234 DEEPS TO RECLAIM THE 245 BATTLEGROUND! ⚡
Entry: 244.0 - 246.0 ⚡
Target: 250.0 / 258.0 / 268.0 🚀
Stop Loss: 239.0 ⚠️
Buyers stepped up aggressively right inside the 234–238 demand pocket, driving consecutive green candles to flip 245 back into buyer territory. 📊 Order flow is shifting fast as momentum builds toward the major overhead hurdle at 248–250.
A clean break above 250 opens up a clear runway toward higher liquidity targets up to 268. 💡 The risk-to-reward ratio here looks exceptionally sharp as long as 239 holds firm. 💬 Are you loading bids on this reclaim or waiting for the 250 breakout confirmation? 👇
⚠️ Not financial advice. Always manage your risk. 🛡️
🏷️ #ARM #LongSetup #Breakout #Crypto #ZEC
🔥 ⚡
Entry: 244.0 - 246.0 ⚡
Target: 250.0 / 258.0 / 268.0 🚀
Stop Loss: 239.0 ⚠️
Buyers stepped up aggressively right inside the 234–238 demand pocket, driving consecutive green candles to flip 245 back into buyer territory. 📊 Order flow is shifting fast as momentum builds toward the major overhead hurdle at 248–250.
A clean break above 250 opens up a clear runway toward higher liquidity targets up to 268. 💡 The risk-to-reward ratio here looks exceptionally sharp as long as 239 holds firm. 💬 Are you loading bids on this reclaim or waiting for the 250 breakout confirmation? 👇
⚠️ Not financial advice. Always manage your risk. 🛡️
🏷️ #ARM #LongSetup #Breakout #Crypto #ZEC
🔥 ⚡
11
·
--
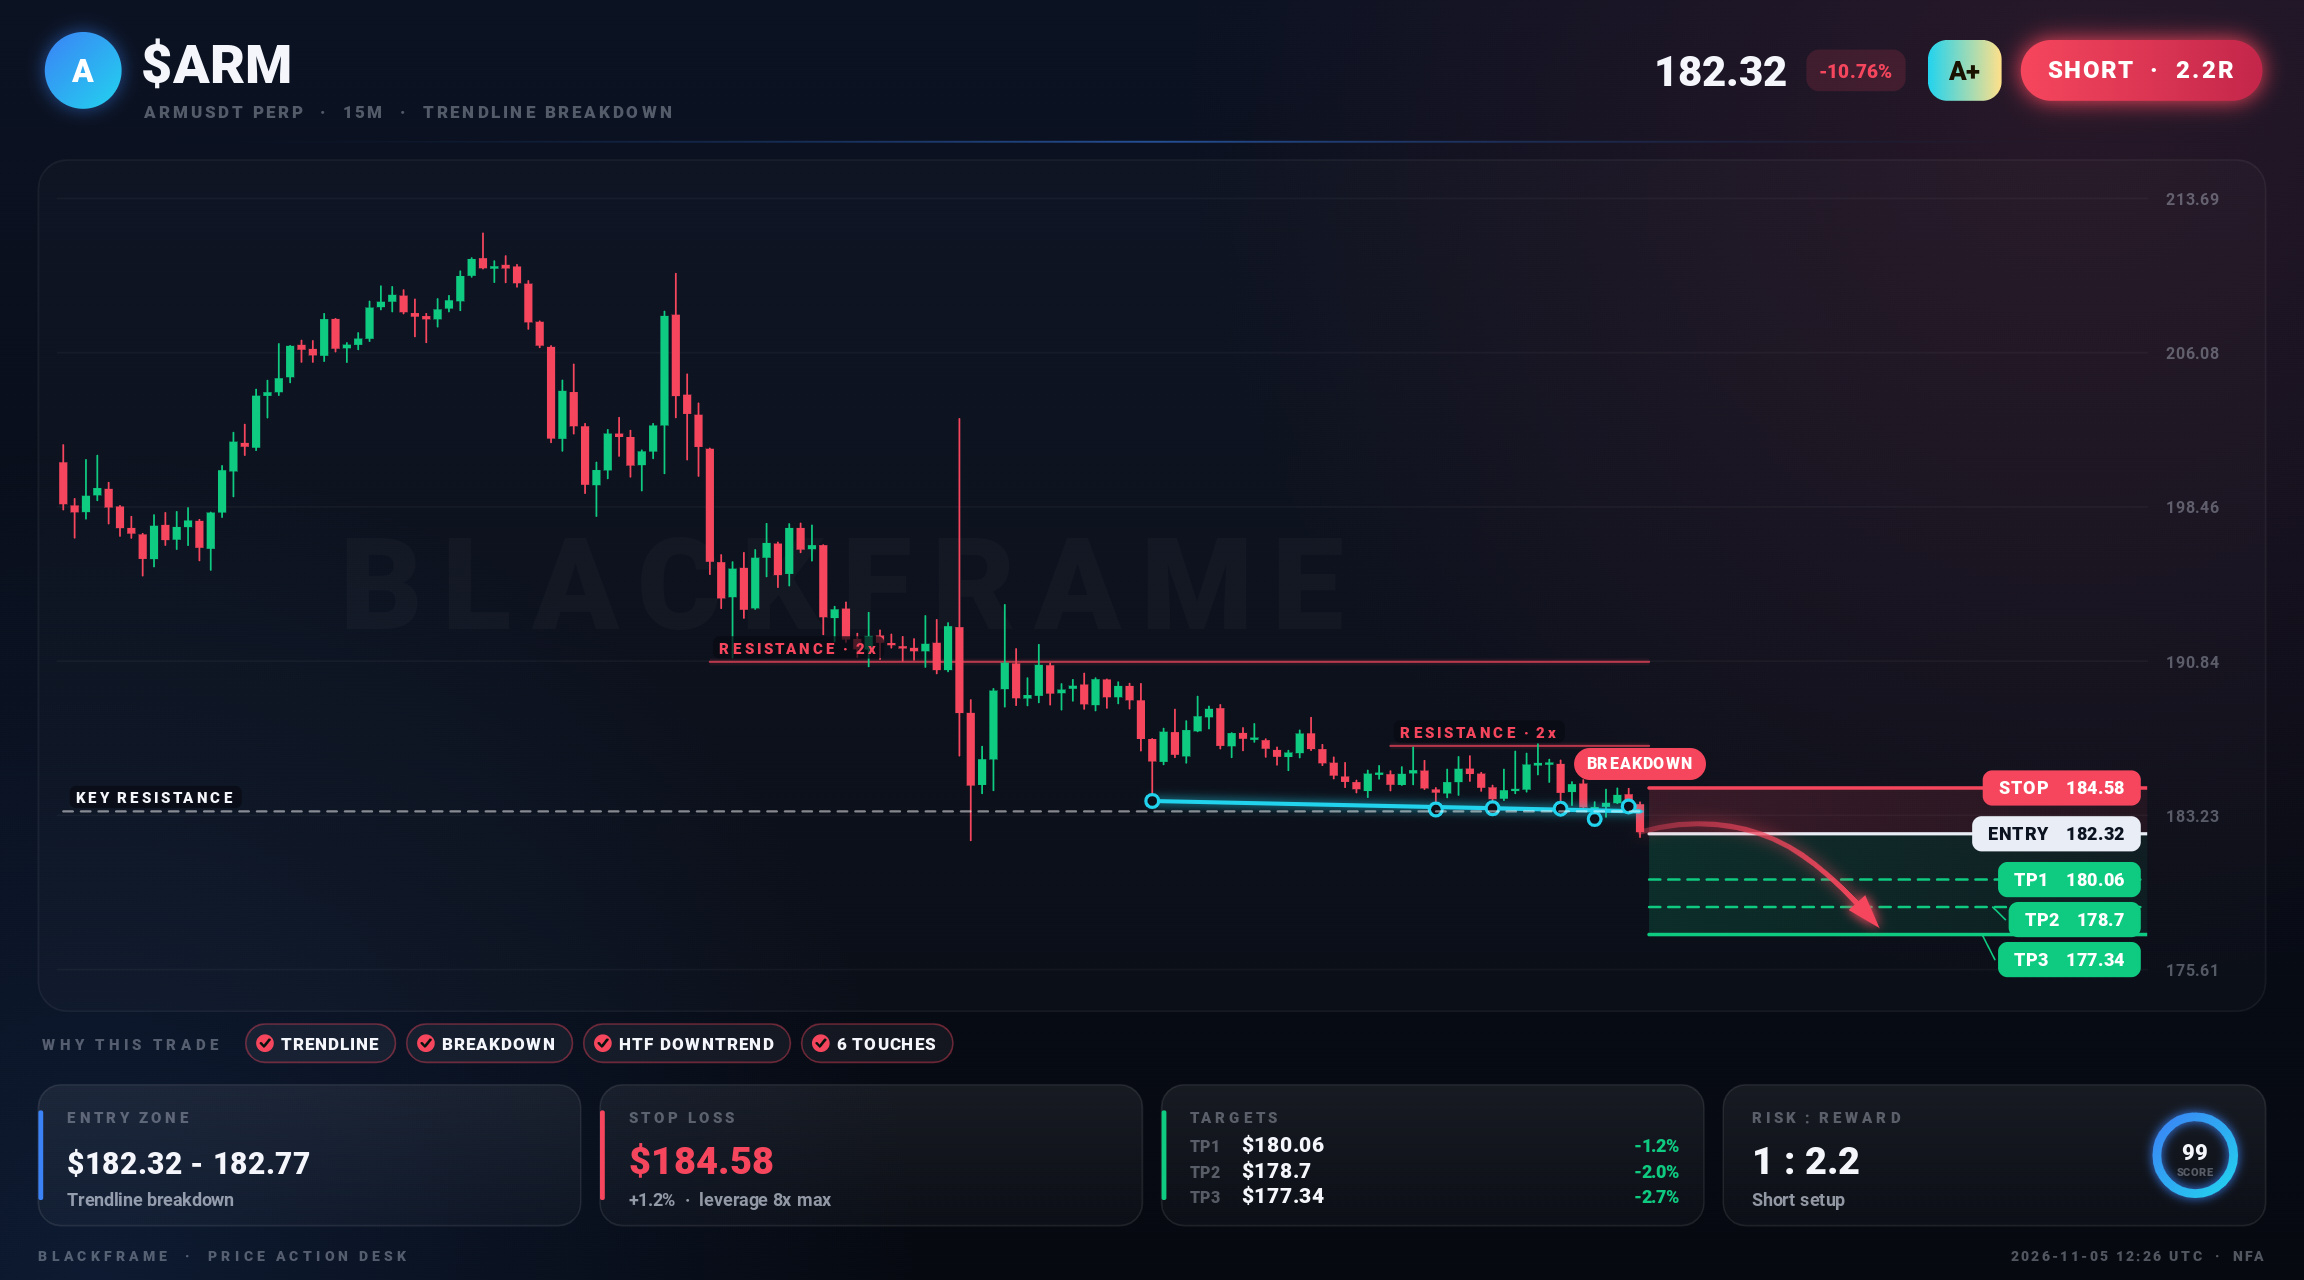
⚠️ Breakdown on $ARM
SHORT · 15M
Entry: $182.32 - $182.89
TP1: $180.06
TP2: $178.7
TP3: $177.34
SL: $184.58
Price broke below a trendline near $183.42 and is holding it. The higher timeframe trend agrees.
#ARM #CryptoTrading #PriceAction · NFA
⚠️ Breakdown on $ARM
SHORT · 15M
Entry: $182.32 - $182.89
TP1: $180.06
TP2: $178.7
TP3: $177.34
SL: $184.58
Price broke below a trendline near $183.42 and is holding it. The higher timeframe trend agrees.
#ARM #CryptoTrading #PriceAction · NFA
SHORT · 15M
Entry: $182.32 - $182.89
TP1: $180.06
TP2: $178.7
TP3: $177.34
SL: $184.58
Price broke below a trendline near $183.42 and is holding it. The higher timeframe trend agrees.
#ARM #CryptoTrading #PriceAction · NFA
3


·
--
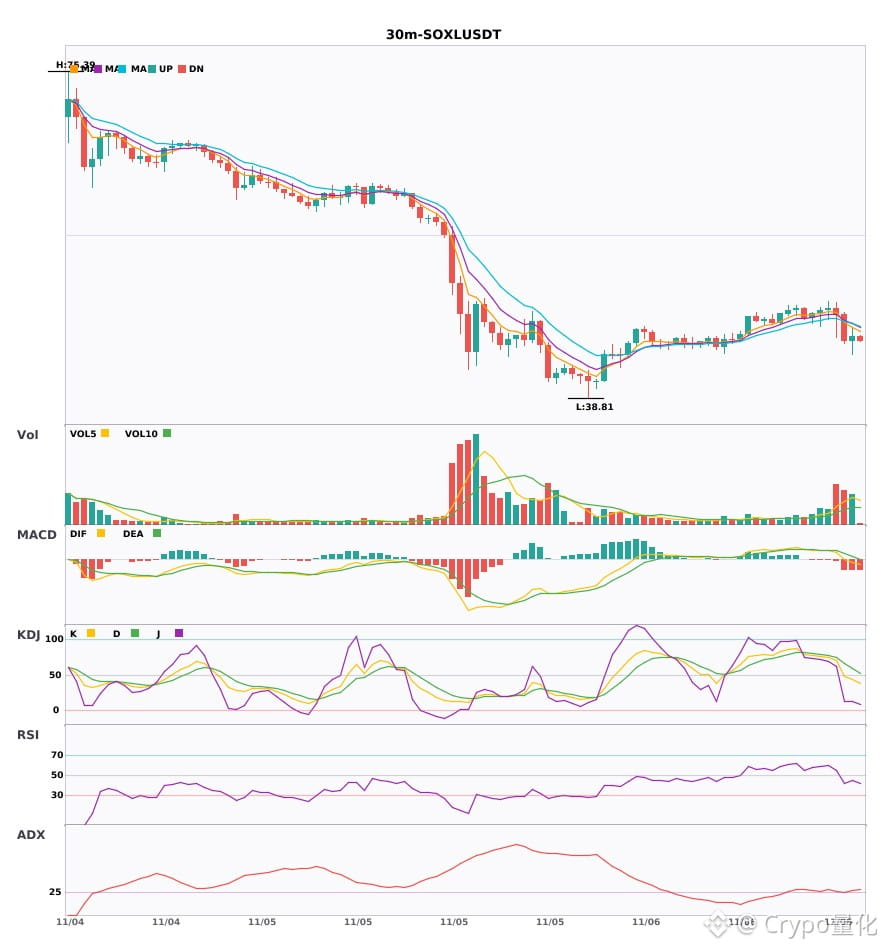
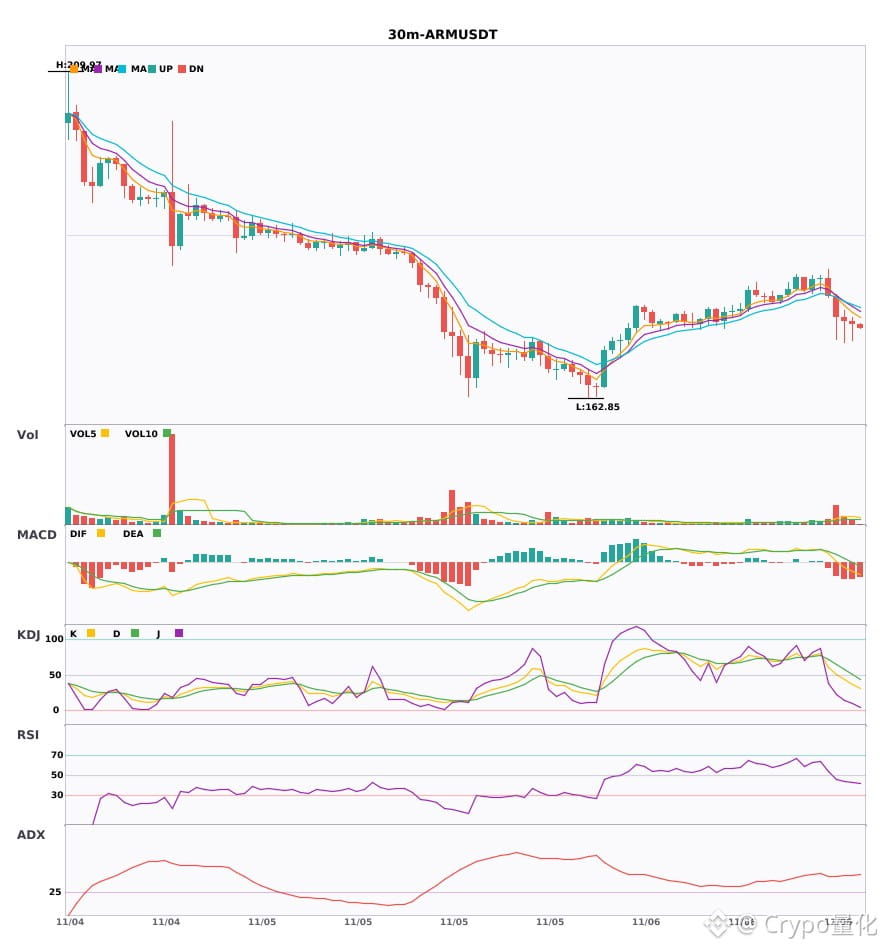
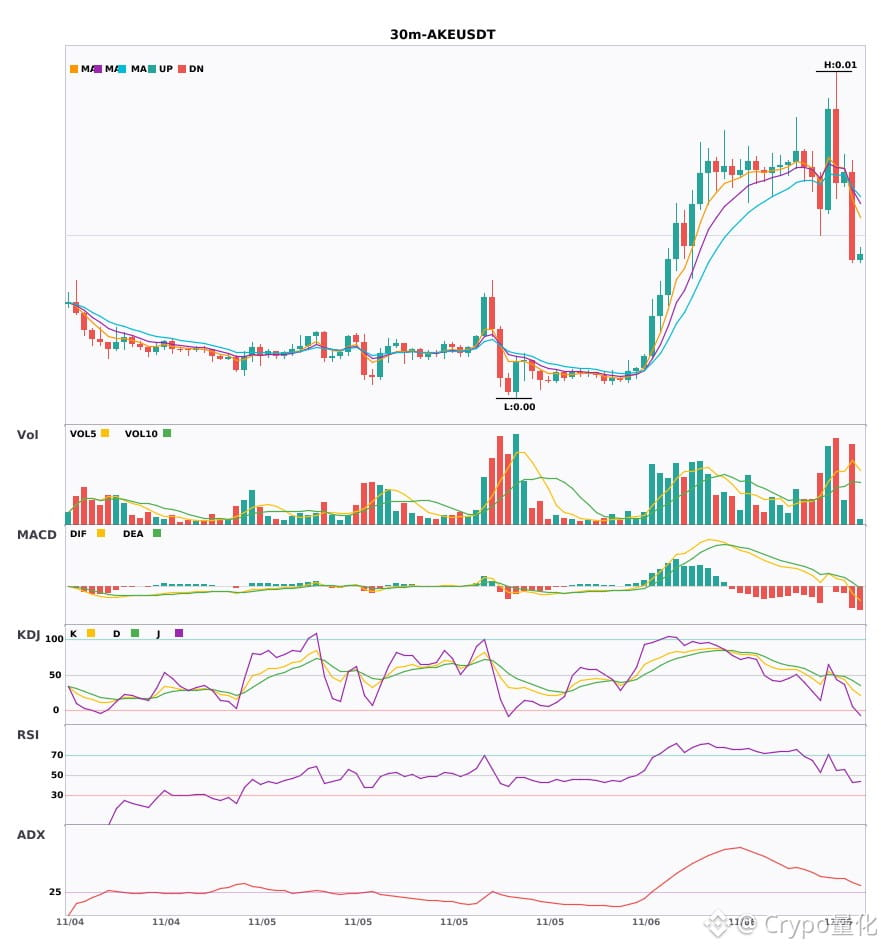
$SOXL / $ARM / $AKE 30-minute signals align bearish, with bearish signals appearing simultaneously🔥
════════════════════
🟢 $SOXL 30-minute bearish signal
⚠️ Technicals: ADX(30): Trend is forming; participation is possible | MACD DIF fell below zero, turning the trend bearish | EMA5 < EMA8 < EMA13: bearish alignment | Volume increased (2.3x)
════════════════════
🟢 $ARM 30-minute bearish signal
⚠️ Technicals: ADX(47): Very strong trend (beware of an overheated pullback) | MACD DIF fell below zero, turning the trend bearish | EMA5 < EMA8 < EMA13: bearish alignment | Volume surge (4.0x)
════════════════════
🟢 $AKE 30-minute bearish signal
⚠️ Technicals: ADX(34): Clear trending market | MACD DIF fell below zero, turning the trend bearish | EMA5 crossed below EMA8, turning bearish in the short term | KDJ is trending weakly, with bears in control (K: 29.8, D: 41.8) | Volume increased (1.8x)
════════════════════
🔔 Follow for real-time market moves 🔔
#技术分析 #SOXL #ARM #AKE
📌 When trading, check whether the candlestick pattern confirms the signal
$SOXL / $ARM / $AKE 30-minute signals align bearish, with bearish signals appearing simultaneously🔥
════════════════════
🟢 $SOXL 30-minute bearish signal
⚠️ Technicals: ADX(30): Trend is forming; participation is possible | MACD DIF fell below zero, turning the trend bearish | EMA5 < EMA8 < EMA13: bearish alignment | Volume increased (2.3x)
════════════════════
🟢 $ARM 30-minute bearish signal
⚠️ Technicals: ADX(47): Very strong trend (beware of an overheated pullback) | MACD DIF fell below zero, turning the trend bearish | EMA5 < EMA8 < EMA13: bearish alignment | Volume surge (4.0x)
════════════════════
🟢 $AKE 30-minute bearish signal
⚠️ Technicals: ADX(34): Clear trending market | MACD DIF fell below zero, turning the trend bearish | EMA5 crossed below EMA8, turning bearish in the short term | KDJ is trending weakly, with bears in control (K: 29.8, D: 41.8) | Volume increased (1.8x)
════════════════════
🔔 Follow for real-time market moves 🔔
#技术分析 #SOXL #ARM #AKE
📌 When trading, check whether the candlestick pattern confirms the signal
════════════════════
🟢 $SOXL 30-minute bearish signal
⚠️ Technicals: ADX(30): Trend is forming; participation is possible | MACD DIF fell below zero, turning the trend bearish | EMA5 < EMA8 < EMA13: bearish alignment | Volume increased (2.3x)
════════════════════
🟢 $ARM 30-minute bearish signal
⚠️ Technicals: ADX(47): Very strong trend (beware of an overheated pullback) | MACD DIF fell below zero, turning the trend bearish | EMA5 < EMA8 < EMA13: bearish alignment | Volume surge (4.0x)
════════════════════
🟢 $AKE 30-minute bearish signal
⚠️ Technicals: ADX(34): Clear trending market | MACD DIF fell below zero, turning the trend bearish | EMA5 crossed below EMA8, turning bearish in the short term | KDJ is trending weakly, with bears in control (K: 29.8, D: 41.8) | Volume increased (1.8x)
════════════════════
🔔 Follow for real-time market moves 🔔
#技术分析 #SOXL #ARM #AKE
📌 When trading, check whether the candlestick pattern confirms the signal
3

·
--
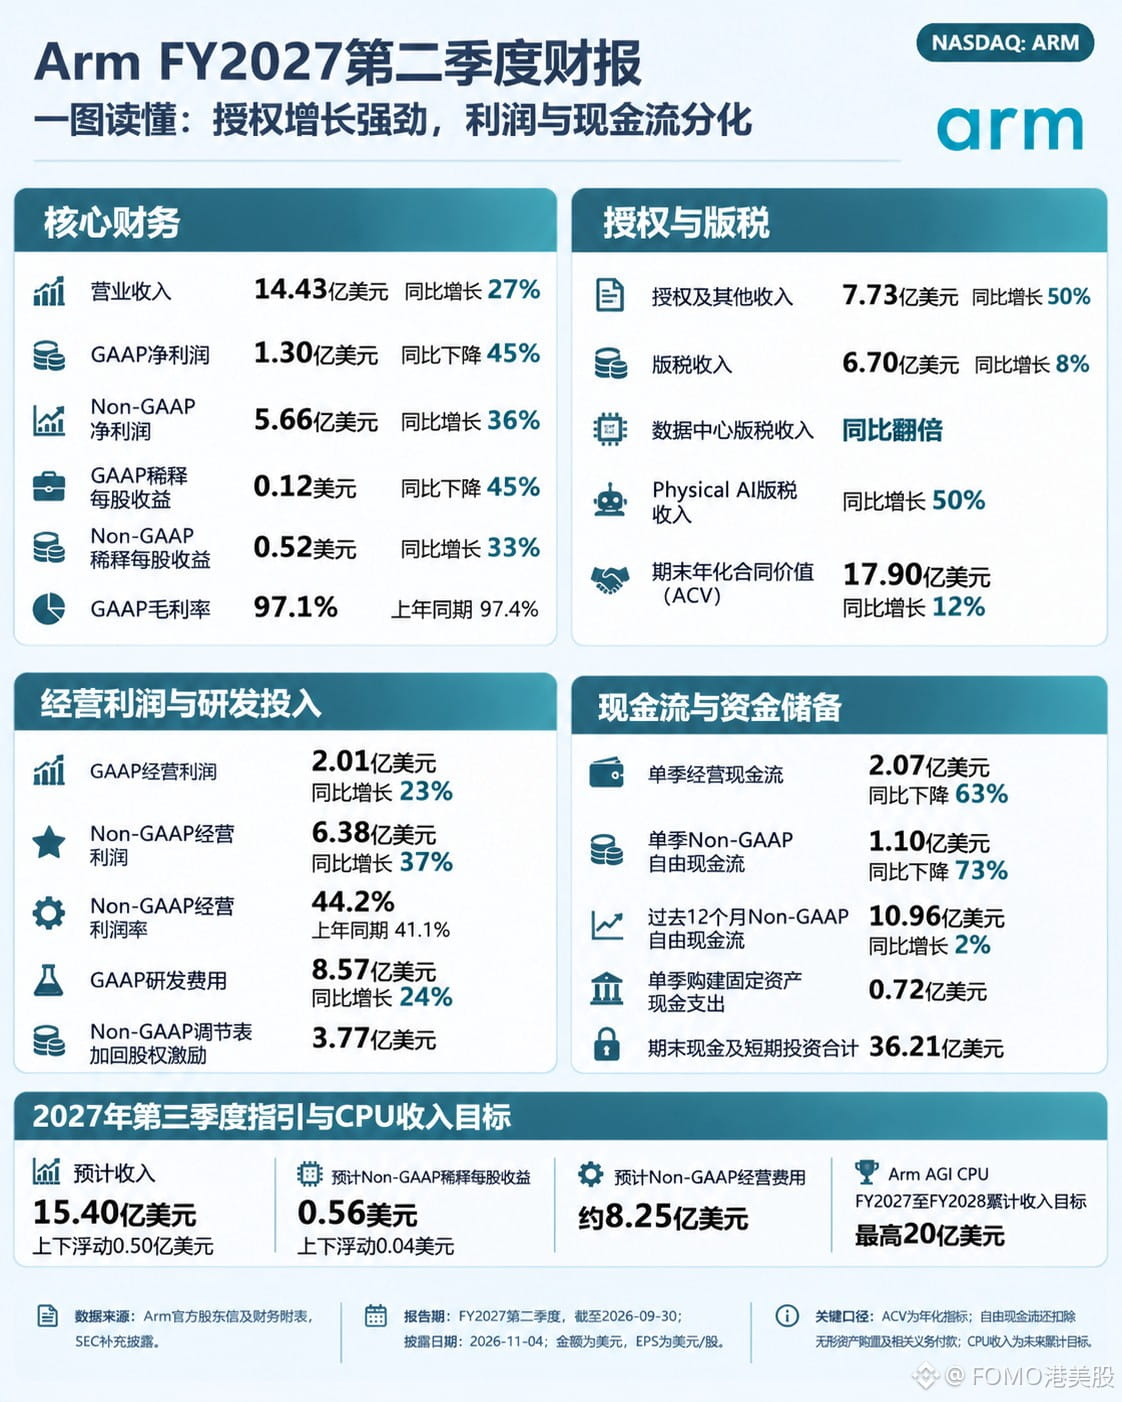
Arm $ARMB revenue of 1.443 billion, +27%.
Reported net income, on the other hand, fell 45%.
· Licensing: 773 million, +50%
· Royalties: 670 million, +8%
· Reported net income: 130 million, −45%
· Adjusted net income: 566 million, +36%
· Operating cash flow: 207 million, −63%
The two lines are moving to different beats.
Licensing revenue of 773 million was up by half, while royalties of 670 million rose just 8%. The former depends on the timing of major deal recognition—and it was what propped up revenue this quarter.
Royalties are the foundation.
Whether royalties can return to double-digit growth is the dividing line in this story.
Initial deliveries of the in-house-developed CPU are scheduled for FY27Q4.
{spot}(ARMBUSDT)
#ARM #BStocks #股票财报季
Arm $ARMB revenue of 1.443 billion, +27%.
Reported net income, on the other hand, fell 45%.
· Licensing: 773 million, +50%
· Royalties: 670 million, +8%
· Reported net income: 130 million, −45%
· Adjusted net income: 566 million, +36%
· Operating cash flow: 207 million, −63%
The two lines are moving to different beats.
Licensing revenue of 773 million was up by half, while royalties of 670 million rose just 8%. The former depends on the timing of major deal recognition—and it was what propped up revenue this quarter.
Royalties are the foundation.
Whether royalties can return to double-digit growth is the dividing line in this story.
Initial deliveries of the in-house-developed CPU are scheduled for FY27Q4.
#ARM #BStocks #股票财报季
Reported net income, on the other hand, fell 45%.
· Licensing: 773 million, +50%
· Royalties: 670 million, +8%
· Reported net income: 130 million, −45%
· Adjusted net income: 566 million, +36%
· Operating cash flow: 207 million, −63%
The two lines are moving to different beats.
Licensing revenue of 773 million was up by half, while royalties of 670 million rose just 8%. The former depends on the timing of major deal recognition—and it was what propped up revenue this quarter.
Royalties are the foundation.
Whether royalties can return to double-digit growth is the dividing line in this story.
Initial deliveries of the in-house-developed CPU are scheduled for FY27Q4.
#ARM #BStocks #股票财报季
370

·
--
🟣ARM: Beats across the board, yet shares fall 5% — the market buys “surprises,” not “meeting expectations”
📊 Trading (U.S. market, 11-04; cross-verified using multiple sources in the finance vertical):
ARM closed regular trading at $191.80 (-5.28%, down $10.69) — earnings were released after the market close, so the 5% drop came as the entire semiconductor sector came under pressure ahead of the report (a storage-sector collapse + headwinds from the midterm elections); after earnings beat expectations, shares fell another ~1% as the conference call got underway after hours.
📊 Q2 (FY2027) numbers were genuinely strong:
Revenue: $1.44 billion (+27%), beating the $1.38 billion estimate; adjusted EPS: $0.52, beating the $0.48 estimate; licensing and other revenue: $773 million (+50%), a record high. Data center royalties doubled year over year, and Arm’s share at top cloud providers is already above 50%, with a forecast to exceed 60% by the end of 2026.
🎯 Why did shares fall despite the beat? Three layers of logic:
① Expectations were too high: shares had already gained 67.8% year to date before earnings, after being cut in half from their June peak of ~$440. The market wanted an “acceleration surprise”; Q3 guidance of $1.54 billion (±$50 million) was only slightly above the $1.53 billion consensus — the big AI story isn’t accelerating;
② The core businesses are diverging: the data center story is real (royalties doubled, licensing hit a record), but mobile is lagging — higher memory prices are weighing on phone shipments, edge AI royalties are essentially flat, and Q3 royalty guidance calls for only low-single-digit growth. “One leg is flying while the other is dragging”;
③ Macroeconomic headwinds: with Democrats sweeping both chambers in the midterm elections, the market applied a “regulatory discount” to data center infrastructure — on Wednesday, Micron fell 7% and Sandisk fell 8%, as the entire AI hardware chain faced selling pressure.
🔍 What to watch next:
Arm’s in-house AGI CPU has already secured orders from multiple customers, with a target of up to $2 billion in revenue in fiscal 2027–2028. Initial deliveries are scheduled for Q4 FY2027 — too far away to help in the near term, but this marks a turning point in ARM’s shift from “collecting licensing fees” to “selling chips.”
⚠️ Risks: Forward P/E is around 76x, leaving very little room for error; if Q3 royalties really fall to low-single-digit growth, the data center narrative could be repriced; post-election regulatory uncertainty has yet to fully materialize.
📌 In a nutshell: ARM’s AI business is accelerating, while mobile is falling behind. The stock fell because “acceleration across the board” didn’t materialize — before buying the dip, see whether the $195 level holds.
💬 Do you think doubling data center royalties can offset the decline in the mobile business? Let’s discuss in the comments.
Personal research; not investment advice.
#ARM #半导体 #AI #EarningsSeason
$ARM $AVGO
🟣ARM: Beats across the board, yet shares fall 5% — the market buys “surprises,” not “meeting expectations”
📊 Trading (U.S. market, 11-04; cross-verified using multiple sources in the finance vertical):
ARM closed regular trading at $191.80 (-5.28%, down $10.69) — earnings were released after the market close, so the 5% drop came as the entire semiconductor sector came under pressure ahead of the report (a storage-sector collapse + headwinds from the midterm elections); after earnings beat expectations, shares fell another ~1% as the conference call got underway after hours.
📊 Q2 (FY2027) numbers were genuinely strong:
Revenue: $1.44 billion (+27%), beating the $1.38 billion estimate; adjusted EPS: $0.52, beating the $0.48 estimate; licensing and other revenue: $773 million (+50%), a record high. Data center royalties doubled year over year, and Arm’s share at top cloud providers is already above 50%, with a forecast to exceed 60% by the end of 2026.
🎯 Why did shares fall despite the beat? Three layers of logic:
① Expectations were too high: shares had already gained 67.8% year to date before earnings, after being cut in half from their June peak of ~$440. The market wanted an “acceleration surprise”; Q3 guidance of $1.54 billion (±$50 million) was only slightly above the $1.53 billion consensus — the big AI story isn’t accelerating;
② The core businesses are diverging: the data center story is real (royalties doubled, licensing hit a record), but mobile is lagging — higher memory prices are weighing on phone shipments, edge AI royalties are essentially flat, and Q3 royalty guidance calls for only low-single-digit growth. “One leg is flying while the other is dragging”;
③ Macroeconomic headwinds: with Democrats sweeping both chambers in the midterm elections, the market applied a “regulatory discount” to data center infrastructure — on Wednesday, Micron fell 7% and Sandisk fell 8%, as the entire AI hardware chain faced selling pressure.
🔍 What to watch next:
Arm’s in-house AGI CPU has already secured orders from multiple customers, with a target of up to $2 billion in revenue in fiscal 2027–2028. Initial deliveries are scheduled for Q4 FY2027 — too far away to help in the near term, but this marks a turning point in ARM’s shift from “collecting licensing fees” to “selling chips.”
⚠️ Risks: Forward P/E is around 76x, leaving very little room for error; if Q3 royalties really fall to low-single-digit growth, the data center narrative could be repriced; post-election regulatory uncertainty has yet to fully materialize.
📌 In a nutshell: ARM’s AI business is accelerating, while mobile is falling behind. The stock fell because “acceleration across the board” didn’t materialize — before buying the dip, see whether the $195 level holds.
💬 Do you think doubling data center royalties can offset the decline in the mobile business? Let’s discuss in the comments.
Personal research; not investment advice.
#ARM #半导体 #AI #EarningsSeason
$ARM $AVGO
📊 Trading (U.S. market, 11-04; cross-verified using multiple sources in the finance vertical):
ARM closed regular trading at $191.80 (-5.28%, down $10.69) — earnings were released after the market close, so the 5% drop came as the entire semiconductor sector came under pressure ahead of the report (a storage-sector collapse + headwinds from the midterm elections); after earnings beat expectations, shares fell another ~1% as the conference call got underway after hours.
📊 Q2 (FY2027) numbers were genuinely strong:
Revenue: $1.44 billion (+27%), beating the $1.38 billion estimate; adjusted EPS: $0.52, beating the $0.48 estimate; licensing and other revenue: $773 million (+50%), a record high. Data center royalties doubled year over year, and Arm’s share at top cloud providers is already above 50%, with a forecast to exceed 60% by the end of 2026.
🎯 Why did shares fall despite the beat? Three layers of logic:
① Expectations were too high: shares had already gained 67.8% year to date before earnings, after being cut in half from their June peak of ~$440. The market wanted an “acceleration surprise”; Q3 guidance of $1.54 billion (±$50 million) was only slightly above the $1.53 billion consensus — the big AI story isn’t accelerating;
② The core businesses are diverging: the data center story is real (royalties doubled, licensing hit a record), but mobile is lagging — higher memory prices are weighing on phone shipments, edge AI royalties are essentially flat, and Q3 royalty guidance calls for only low-single-digit growth. “One leg is flying while the other is dragging”;
③ Macroeconomic headwinds: with Democrats sweeping both chambers in the midterm elections, the market applied a “regulatory discount” to data center infrastructure — on Wednesday, Micron fell 7% and Sandisk fell 8%, as the entire AI hardware chain faced selling pressure.
🔍 What to watch next:
Arm’s in-house AGI CPU has already secured orders from multiple customers, with a target of up to $2 billion in revenue in fiscal 2027–2028. Initial deliveries are scheduled for Q4 FY2027 — too far away to help in the near term, but this marks a turning point in ARM’s shift from “collecting licensing fees” to “selling chips.”
⚠️ Risks: Forward P/E is around 76x, leaving very little room for error; if Q3 royalties really fall to low-single-digit growth, the data center narrative could be repriced; post-election regulatory uncertainty has yet to fully materialize.
📌 In a nutshell: ARM’s AI business is accelerating, while mobile is falling behind. The stock fell because “acceleration across the board” didn’t materialize — before buying the dip, see whether the $195 level holds.
💬 Do you think doubling data center royalties can offset the decline in the mobile business? Let’s discuss in the comments.
Personal research; not investment advice.
#ARM #半导体 #AI #EarningsSeason
$ARM $AVGO

224

·
--
Arm says Amazon Graviton revenue commitments grew more than 20-fold year over year.
This figure refers to “revenue commitments,” not realized revenue, and it does not mean Graviton’s share of the cloud market. It reflects customers making greater purchasing commitments for custom chips based on Arm architecture, rather than actual shipments or revenue at present.
· There is a time lag between commitment growth and the recognition of actual revenue; the 20-fold figure itself does not indicate when that revenue will materialize.
· The information covers only Amazon and Arm and provides no comparable data for other cloud providers, so it cannot be used to infer overall industry trends.
Would you wait for Amazon to disclose Graviton’s actual deployment scale, or look first at Arm’s licensing revenue next quarter?
#Arm #Cloud Computing
Arm says Amazon Graviton revenue commitments grew more than 20-fold year over year.
This figure refers to “revenue commitments,” not realized revenue, and it does not mean Graviton’s share of the cloud market. It reflects customers making greater purchasing commitments for custom chips based on Arm architecture, rather than actual shipments or revenue at present.
· There is a time lag between commitment growth and the recognition of actual revenue; the 20-fold figure itself does not indicate when that revenue will materialize.
· The information covers only Amazon and Arm and provides no comparable data for other cloud providers, so it cannot be used to infer overall industry trends.
Would you wait for Amazon to disclose Graviton’s actual deployment scale, or look first at Arm’s licensing revenue next quarter?
#Arm #Cloud Computing
This figure refers to “revenue commitments,” not realized revenue, and it does not mean Graviton’s share of the cloud market. It reflects customers making greater purchasing commitments for custom chips based on Arm architecture, rather than actual shipments or revenue at present.
· There is a time lag between commitment growth and the recognition of actual revenue; the 20-fold figure itself does not indicate when that revenue will materialize.
· The information covers only Amazon and Arm and provides no comparable data for other cloud providers, so it cannot be used to infer overall industry trends.
Would you wait for Amazon to disclose Graviton’s actual deployment scale, or look first at Arm’s licensing revenue next quarter?
#Arm #Cloud Computing

44

·
--
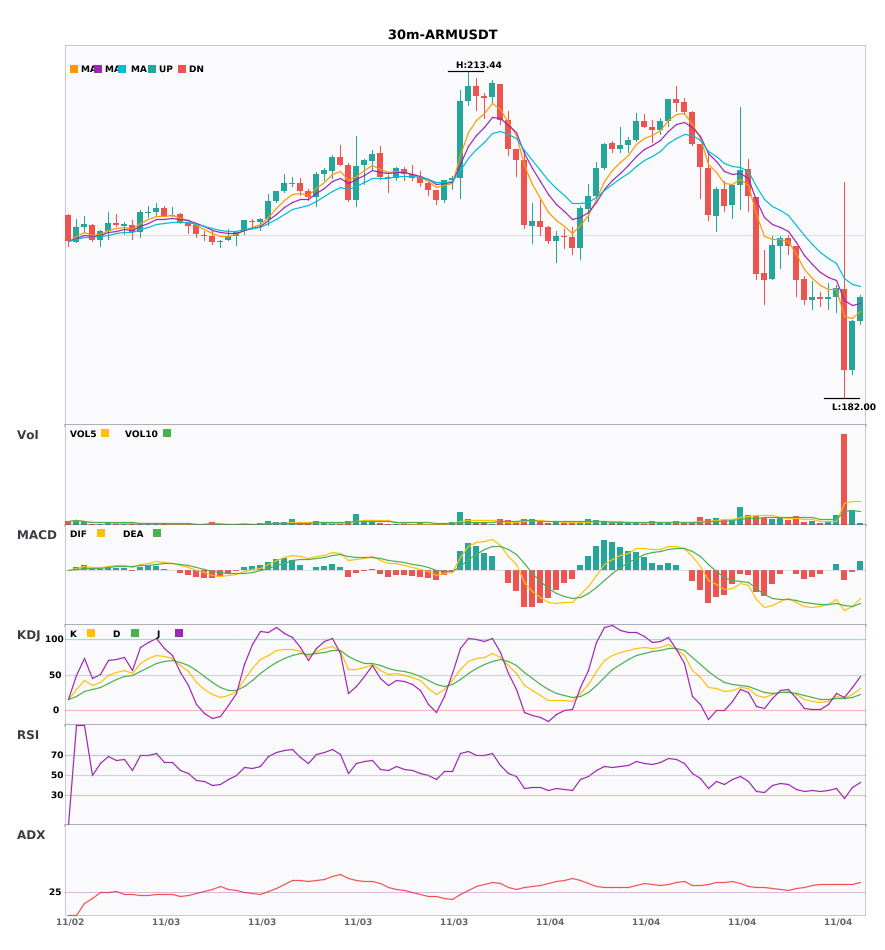
$ARM 30-minute confluence with 4-hour bearish trend; bearish alert—please beware of risk 🔥
════════════════════
🟢 $ARM 30-minute bearish signal
⚠️Technical analysis: 4-hour bearish confluence confirmed | 30-minute entry: MACD death cross below zero, bearish momentum accelerating | EMA5 < EMA8 < EMA13, bearish alignment | KDJ in oversold territory; watch for rebound opportunities (K: 17.2, D: 16.8) | Volume surge (6.7x)
════════════════════
🔔 Follow to get real-time market alerts 🔔
#多周期共振 #ARM
📌 When trading, check whether the candlestick patterns meet the criteria
$ARM 30-minute confluence with 4-hour bearish trend; bearish alert—please beware of risk 🔥
════════════════════
🟢 $ARM 30-minute bearish signal
⚠️Technical analysis: 4-hour bearish confluence confirmed | 30-minute entry: MACD death cross below zero, bearish momentum accelerating | EMA5 < EMA8 < EMA13, bearish alignment | KDJ in oversold territory; watch for rebound opportunities (K: 17.2, D: 16.8) | Volume surge (6.7x)
════════════════════
🔔 Follow to get real-time market alerts 🔔
#多周期共振 #ARM
📌 When trading, check whether the candlestick patterns meet the criteria
════════════════════
🟢 $ARM 30-minute bearish signal
⚠️Technical analysis: 4-hour bearish confluence confirmed | 30-minute entry: MACD death cross below zero, bearish momentum accelerating | EMA5 < EMA8 < EMA13, bearish alignment | KDJ in oversold territory; watch for rebound opportunities (K: 17.2, D: 16.8) | Volume surge (6.7x)
════════════════════
🔔 Follow to get real-time market alerts 🔔
#多周期共振 #ARM
📌 When trading, check whether the candlestick patterns meet the criteria
1

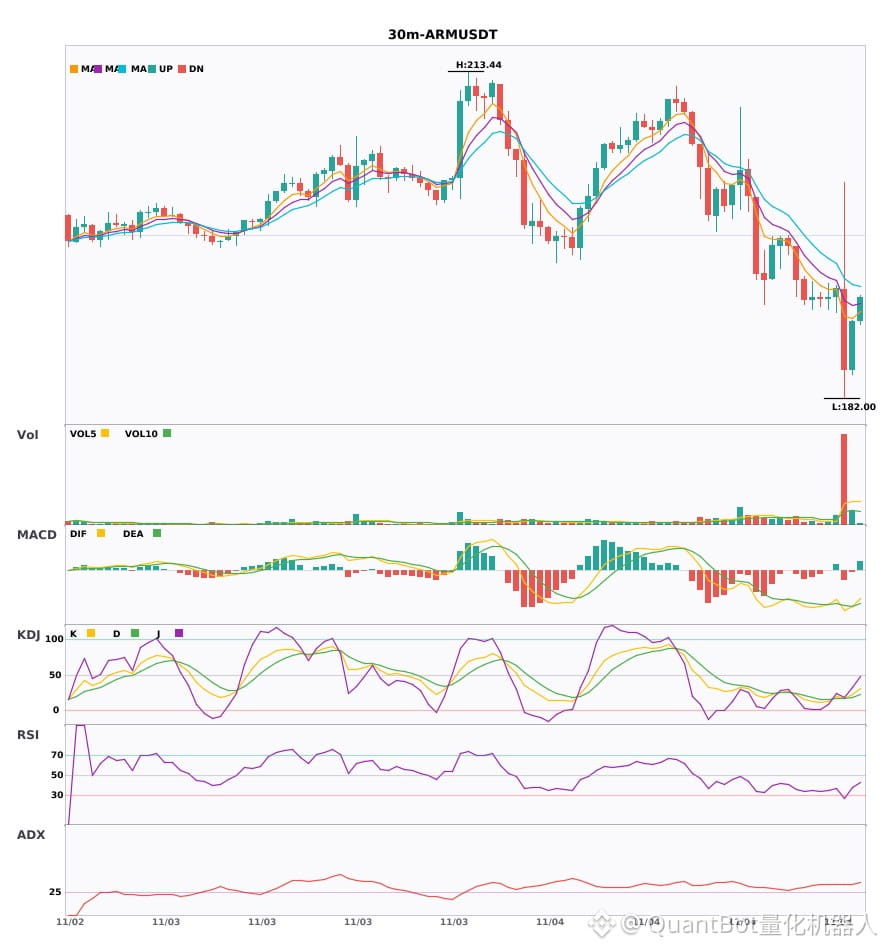
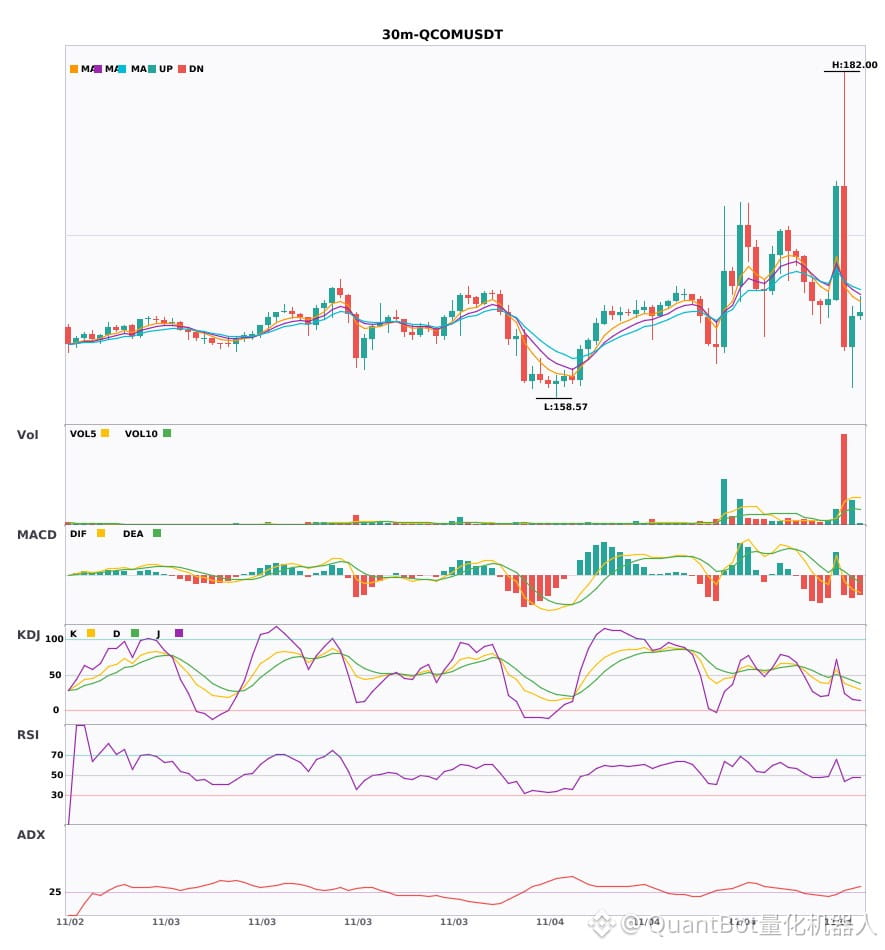
$ARM / $QCOM 30-minute timeframe is bearish, with short-term pressure
📉 $ARM | 30-minute bearish signal
━━━━━━━━━━━━━━━━━━
Technical analysis: ADX(37) indicates a clear trend | MACD death cross below zero, bearish momentum accelerating | EMA5 < EMA8 < EMA13, bearish alignment | KDJ in oversold territory; watch for a potential rebound (K: 17.2, D: 16.8) | Volume surge (6.7x)
Price change: -4.0900%
📉 $QCOM | 30-minute bearish signal
━━━━━━━━━━━━━━━━━━
Technical analysis: ADX(30) indicates a trend is forming; opportunity to participate | MACD death cross below zero, bearish momentum accelerating | EMA5 crossed below EMA8, short-term outlook turns bearish | KDJ death cross, bearish short-term outlook (K: 38.6, D: 46.2) | Volume surge (6.5x)
Price change: -6.6200%
━━━━━━━━━━━━━━━━━━
#技术分析 #ARM #QCOM
📌 The above content is for reference only and does not constitute investment advice
$ARM / $QCOM 30-minute timeframe is bearish, with short-term pressure
📉 $ARM | 30-minute bearish signal
━━━━━━━━━━━━━━━━━━
Technical analysis: ADX(37) indicates a clear trend | MACD death cross below zero, bearish momentum accelerating | EMA5 < EMA8 < EMA13, bearish alignment | KDJ in oversold territory; watch for a potential rebound (K: 17.2, D: 16.8) | Volume surge (6.7x)
Price change: -4.0900%
📉 $QCOM | 30-minute bearish signal
━━━━━━━━━━━━━━━━━━
Technical analysis: ADX(30) indicates a trend is forming; opportunity to participate | MACD death cross below zero, bearish momentum accelerating | EMA5 crossed below EMA8, short-term outlook turns bearish | KDJ death cross, bearish short-term outlook (K: 38.6, D: 46.2) | Volume surge (6.5x)
Price change: -6.6200%
━━━━━━━━━━━━━━━━━━
#技术分析 #ARM #QCOM
📌 The above content is for reference only and does not constitute investment advice
📉 $ARM | 30-minute bearish signal
━━━━━━━━━━━━━━━━━━
Technical analysis: ADX(37) indicates a clear trend | MACD death cross below zero, bearish momentum accelerating | EMA5 < EMA8 < EMA13, bearish alignment | KDJ in oversold territory; watch for a potential rebound (K: 17.2, D: 16.8) | Volume surge (6.7x)
Price change: -4.0900%
📉 $QCOM | 30-minute bearish signal
━━━━━━━━━━━━━━━━━━
Technical analysis: ADX(30) indicates a trend is forming; opportunity to participate | MACD death cross below zero, bearish momentum accelerating | EMA5 crossed below EMA8, short-term outlook turns bearish | KDJ death cross, bearish short-term outlook (K: 38.6, D: 46.2) | Volume surge (6.5x)
Price change: -6.6200%
━━━━━━━━━━━━━━━━━━
#技术分析 #ARM #QCOM
📌 The above content is for reference only and does not constitute investment advice
10
·
--
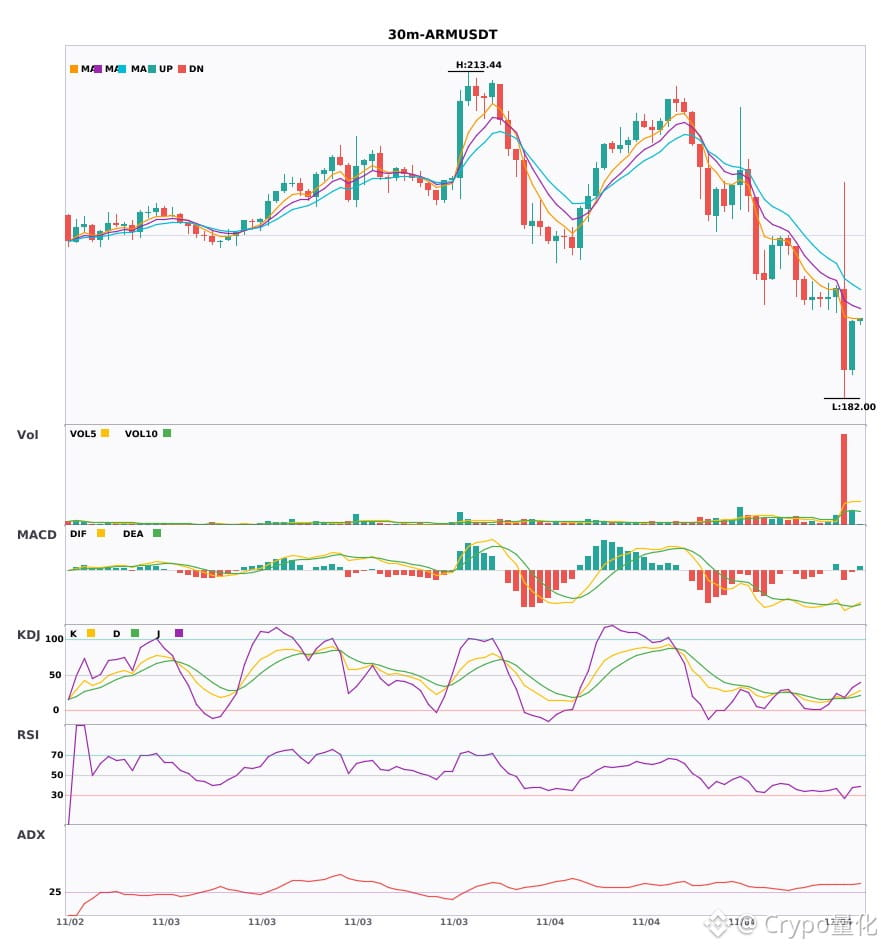
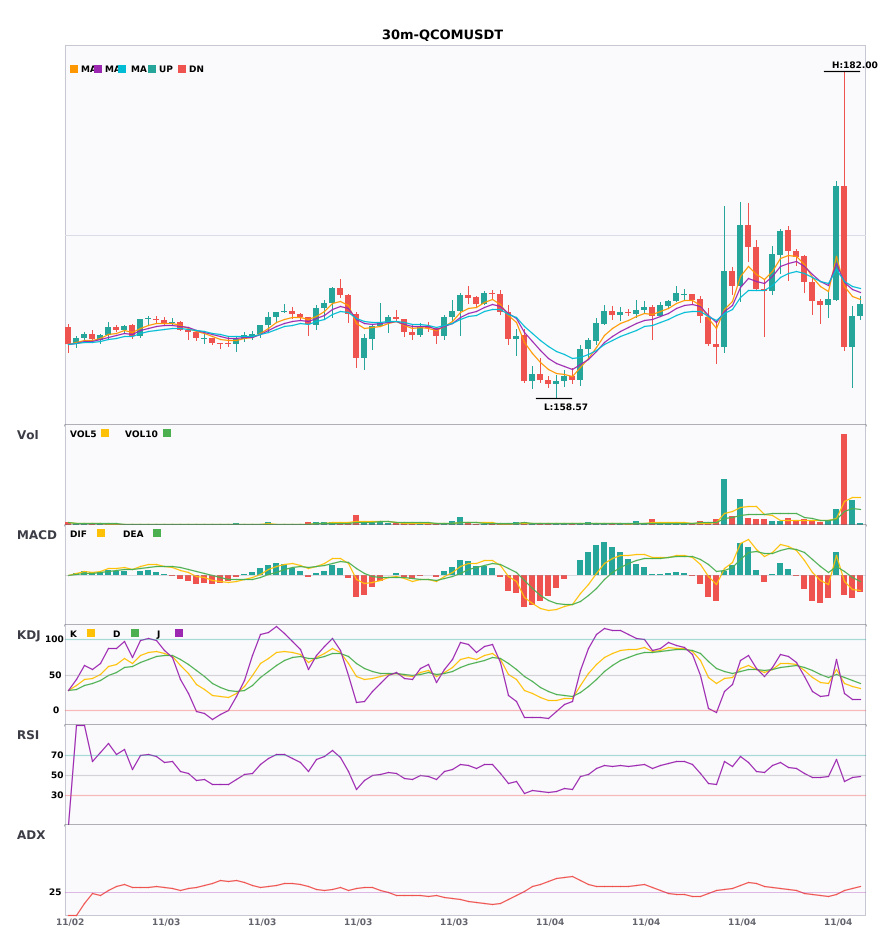
2 30-minute bearish alerts: $ARM / $QCOM🔥
════════════════════
🟢 $ARM 30-minute bearish signal
⚠️Technical analysis: ADX(37) clear trending market | MACD bearish cross below zero, bearish momentum accelerating | EMA5 < EMA8 < EMA13, bearish alignment | KDJ in oversold territory; watch for rebound opportunities (K: 17.2, D: 16.8) | Volume surge (6.7x)
════════════════════
🟢 $QCOM 30-minute bearish signal
⚠️Technical analysis: ADX(30) trend is forming; opportunity to participate | MACD bearish cross below zero, bearish momentum accelerating | EMA5 crosses below EMA8, short-term outlook turns bearish | KDJ bearish cross, short-term outlook bearish (K: 38.6, D: 46.2) | Volume surge (6.5x)
════════════════════
🔔 Follow for first-hand market updates 🔔
#技术分析 #ARM #QCOM
📌 When trading, pay attention to whether the candlestick patterns align
2 30-minute bearish alerts: $ARM / $QCOM 🔥
════════════════════
🟢 $ARM 30-minute bearish signal
⚠️Technical analysis: ADX(37) clear trending market | MACD bearish cross below zero, bearish momentum accelerating | EMA5 < EMA8 < EMA13, bearish alignment | KDJ in oversold territory; watch for rebound opportunities (K: 17.2, D: 16.8) | Volume surge (6.7x)
════════════════════
🟢 $QCOM 30-minute bearish signal
⚠️Technical analysis: ADX(30) trend is forming; opportunity to participate | MACD bearish cross below zero, bearish momentum accelerating | EMA5 crosses below EMA8, short-term outlook turns bearish | KDJ bearish cross, short-term outlook bearish (K: 38.6, D: 46.2) | Volume surge (6.5x)
════════════════════
🔔 Follow for first-hand market updates 🔔
#技术分析 #ARM #QCOM
📌 When trading, pay attention to whether the candlestick patterns align
════════════════════
🟢 $ARM 30-minute bearish signal
⚠️Technical analysis: ADX(37) clear trending market | MACD bearish cross below zero, bearish momentum accelerating | EMA5 < EMA8 < EMA13, bearish alignment | KDJ in oversold territory; watch for rebound opportunities (K: 17.2, D: 16.8) | Volume surge (6.7x)
════════════════════
🟢 $QCOM 30-minute bearish signal
⚠️Technical analysis: ADX(30) trend is forming; opportunity to participate | MACD bearish cross below zero, bearish momentum accelerating | EMA5 crosses below EMA8, short-term outlook turns bearish | KDJ bearish cross, short-term outlook bearish (K: 38.6, D: 46.2) | Volume surge (6.5x)
════════════════════
🔔 Follow for first-hand market updates 🔔
#技术分析 #ARM #QCOM
📌 When trading, pay attention to whether the candlestick patterns align
2
·
--
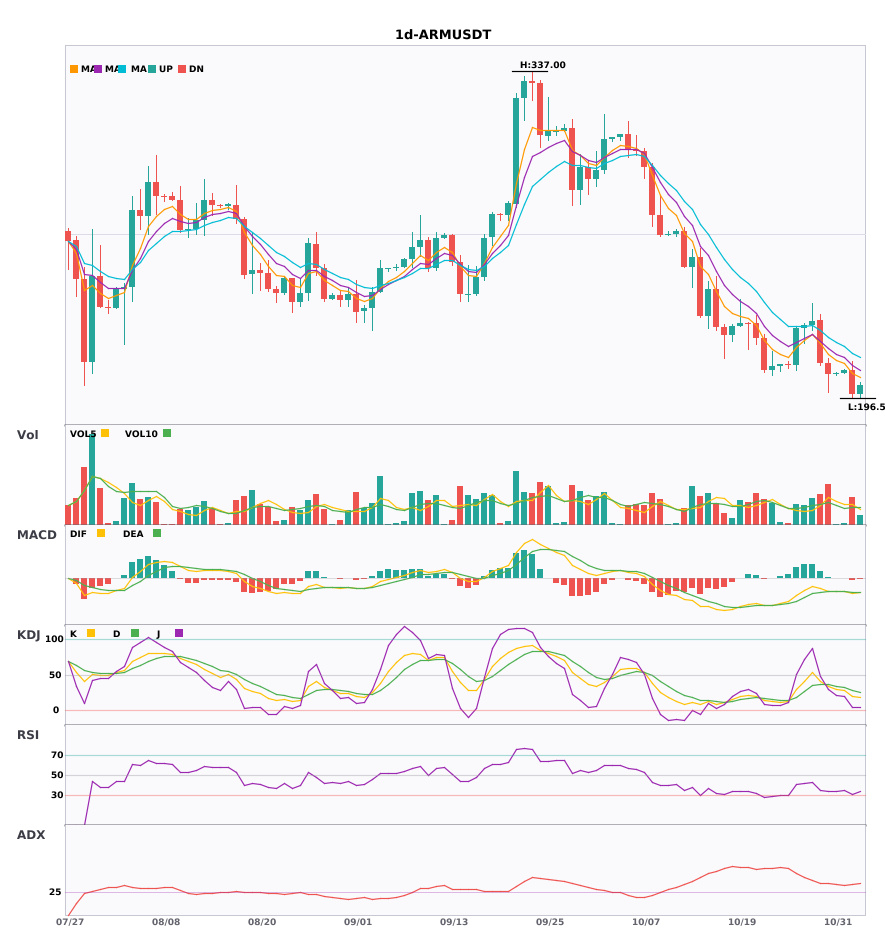
$ARM Daily bearish + weekly bearish aligned; multi-timeframe confluence—trade with the trend 🔥
════════════════════
🟢 $ARM Daily bearish signal
⚠️Technical analysis: Weekly bearish confluence confirmed | Daily entry: MACD death cross below zero, bearish momentum accelerating | EMA5 < EMA8 < EMA13, bearish alignment | KDJ showing weakness, bears in control (K: 20.3, D: 28.1) | Volume increased (1.6x)
📢Market update: Arm Holdings shares slide as AI chip demand worries spread - Arm's stock decline underscores the interconnectedness of semiconductor markets, where negative forecasts can ripple across the entire sector. The pos...
════════════════════
🔔 Follow for first-hand market alerts 🔔
#多周期共振 #ARM
📌 When trading, pay attention to whether the candlestick pattern confirms the signal
$ARM Daily bearish + weekly bearish aligned; multi-timeframe confluence—trade with the trend 🔥
════════════════════
🟢 $ARM Daily bearish signal
⚠️Technical analysis: Weekly bearish confluence confirmed | Daily entry: MACD death cross below zero, bearish momentum accelerating | EMA5 < EMA8 < EMA13, bearish alignment | KDJ showing weakness, bears in control (K: 20.3, D: 28.1) | Volume increased (1.6x)
📢Market update: Arm Holdings shares slide as AI chip demand worries spread - Arm's stock decline underscores the interconnectedness of semiconductor markets, where negative forecasts can ripple across the entire sector. The pos...
════════════════════
🔔 Follow for first-hand market alerts 🔔
#多周期共振 #ARM
📌 When trading, pay attention to whether the candlestick pattern confirms the signal
════════════════════
🟢 $ARM Daily bearish signal
⚠️Technical analysis: Weekly bearish confluence confirmed | Daily entry: MACD death cross below zero, bearish momentum accelerating | EMA5 < EMA8 < EMA13, bearish alignment | KDJ showing weakness, bears in control (K: 20.3, D: 28.1) | Volume increased (1.6x)
📢Market update: Arm Holdings shares slide as AI chip demand worries spread - Arm's stock decline underscores the interconnectedness of semiconductor markets, where negative forecasts can ripple across the entire sector. The pos...
════════════════════
🔔 Follow for first-hand market alerts 🔔
#多周期共振 #ARM
📌 When trading, pay attention to whether the candlestick pattern confirms the signal
6

·
--
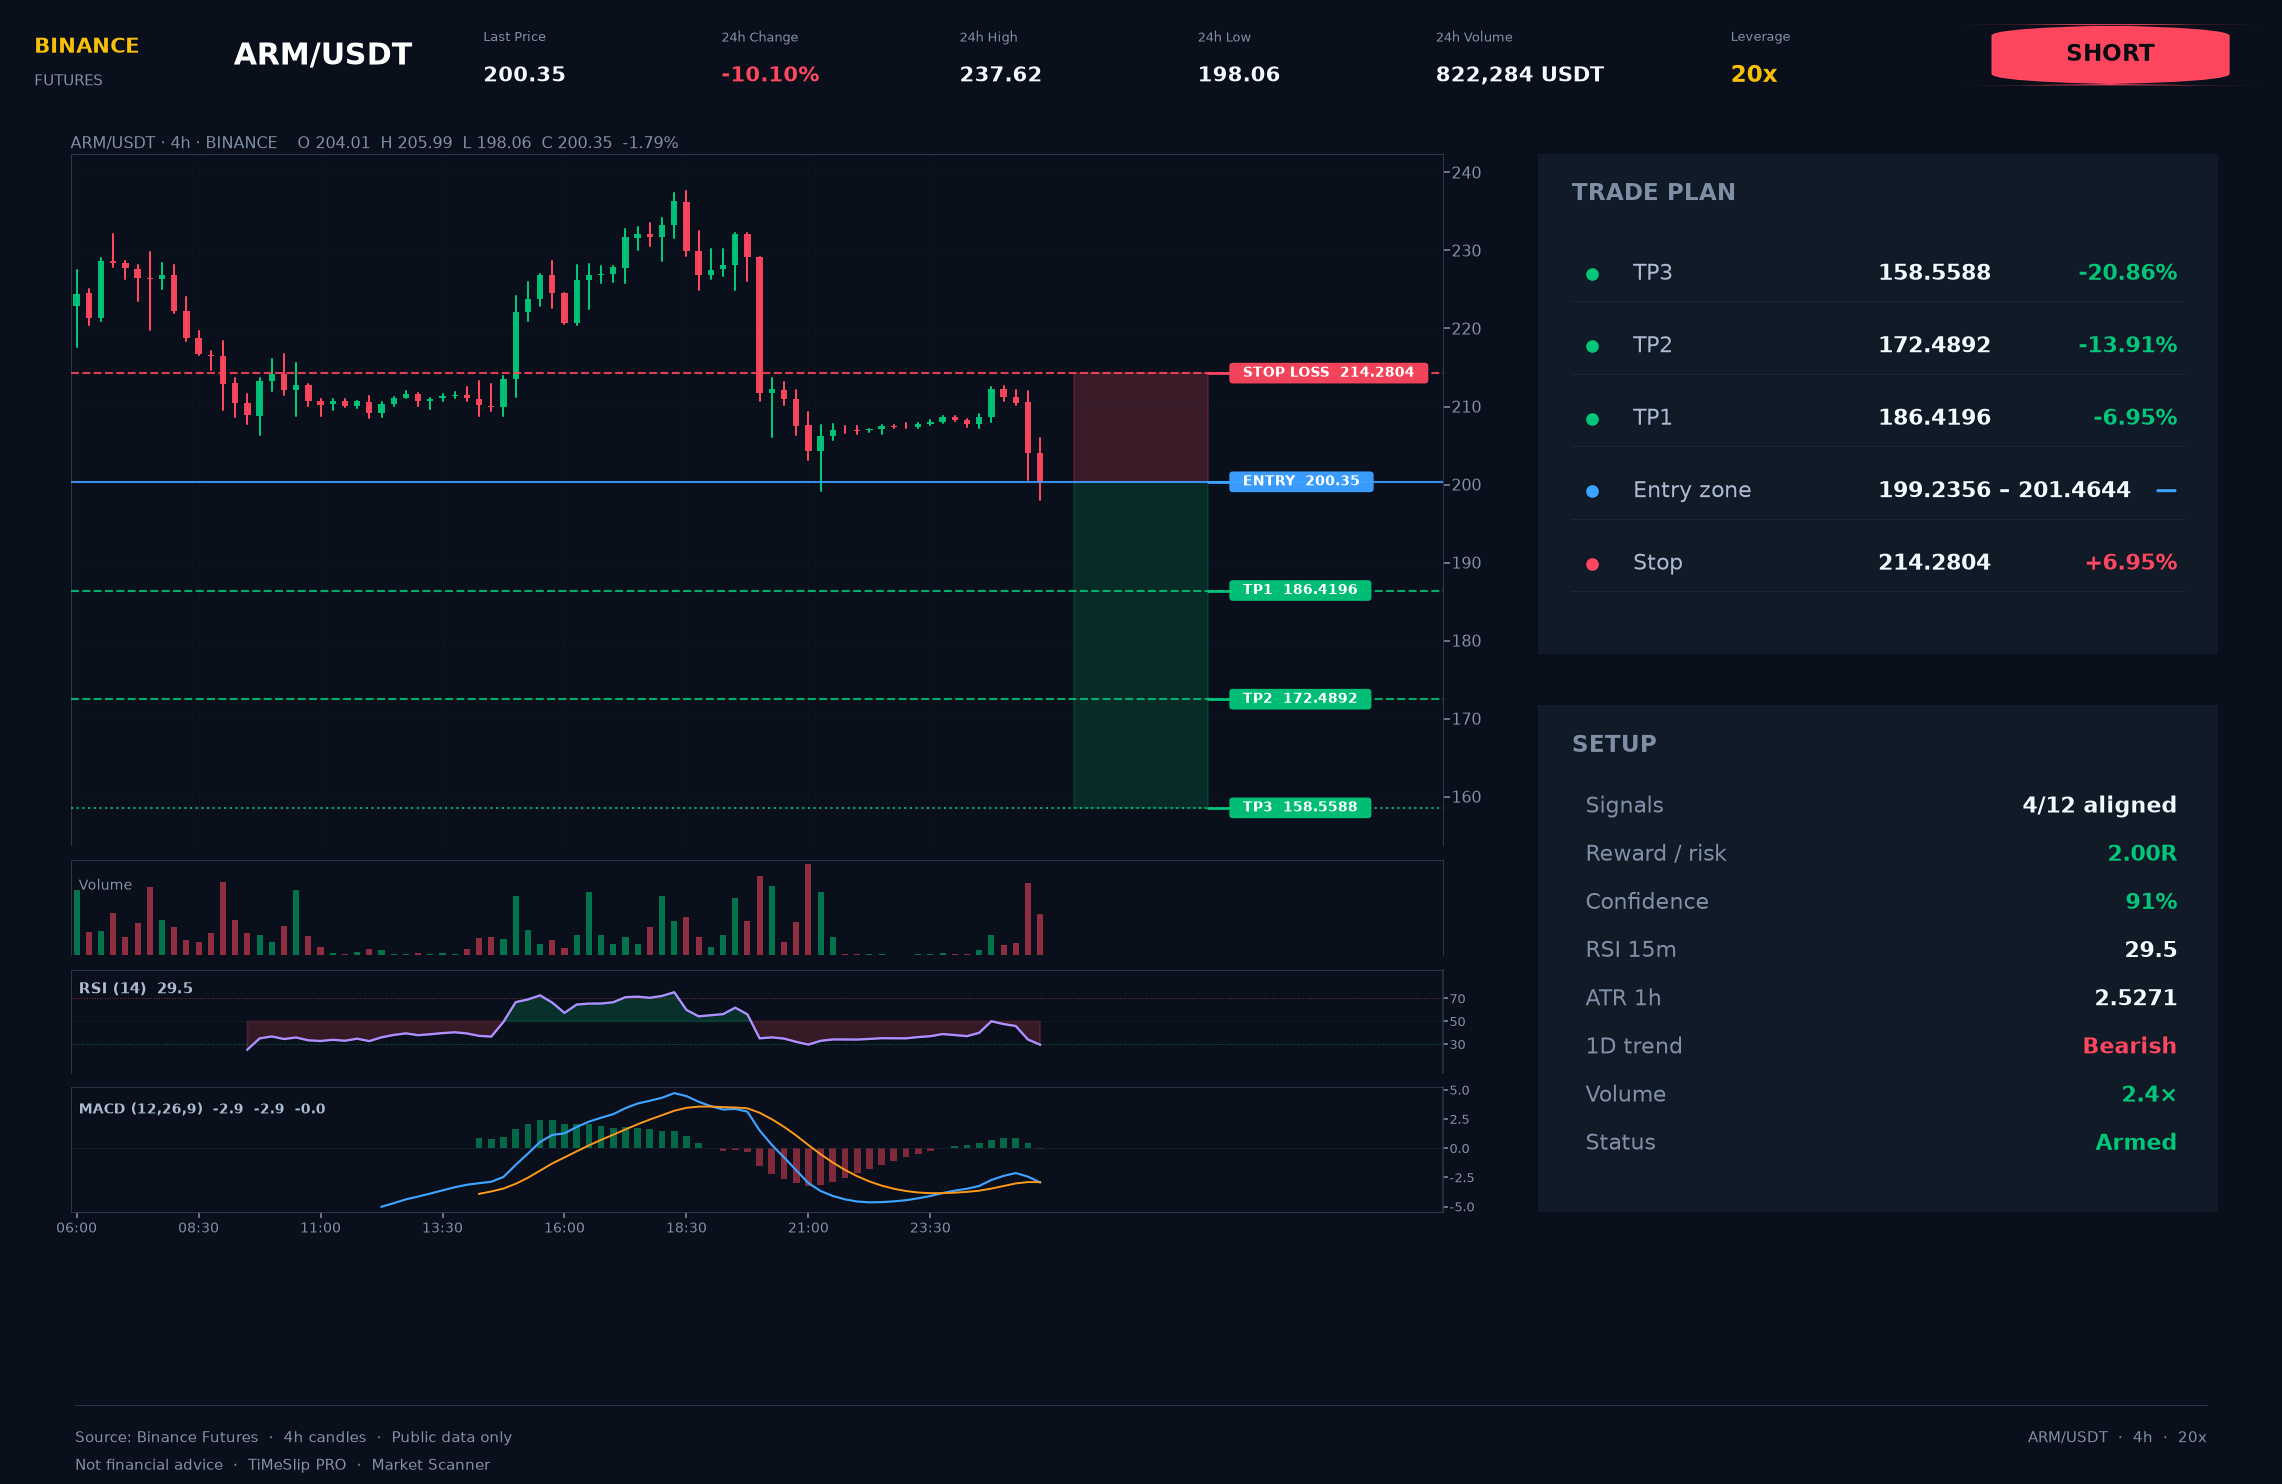
$ARM 🔴 (No position)
Entry: 200.350
Stop-loss: 214.280
• Take-profit 1: 186.420
• Take-profit 2: 172.489
• Take-profit 3: 158.559
🎯 Golden rule: After reaching TP1, move the stop-loss to breakeven to protect your capital.
ARM baseline scenario: Bearish while the breakout level holds as resistance; if reclaimed, the plan is invalidated.
📚 Order Flow: Order book imbalance -3.9%; aggressive buying 27.3%. The data indicates that capital flows support the signal direction.
Setup strength: 91/100. The numbers reflect only potential; risk management always comes first. ⚠️ Stop-loss risk is high (6.95%): please reduce your position size.
Price broke below support at 207.416, then formed a short entry point on the retest. Stop-loss risk: 6.95%. Timeframe confluence: 8h, 12h, 1d, 1w. ATR(14): 2.5271.
🔥 Trading volume has increased significantly (about 2.4 times the average).
📈 Subscribe to avoid missing key entry levels and trading scenarios!
This material is for educational and discussion purposes only. The author is not responsible for trading results.
#ARM #ARMNews $ARM 👈 Click to trade
$ARM 🔴 (No position)
Entry: 200.350
Stop-loss: 214.280
• Take-profit 1: 186.420
• Take-profit 2: 172.489
• Take-profit 3: 158.559
🎯 Golden rule: After reaching TP1, move the stop-loss to breakeven to protect your capital.
ARM baseline scenario: Bearish while the breakout level holds as resistance; if reclaimed, the plan is invalidated.
📚 Order Flow: Order book imbalance -3.9%; aggressive buying 27.3%. The data indicates that capital flows support the signal direction.
Setup strength: 91/100. The numbers reflect only potential; risk management always comes first. ⚠️ Stop-loss risk is high (6.95%): please reduce your position size.
Price broke below support at 207.416, then formed a short entry point on the retest. Stop-loss risk: 6.95%. Timeframe confluence: 8h, 12h, 1d, 1w. ATR(14): 2.5271.
🔥 Trading volume has increased significantly (about 2.4 times the average).
📈 Subscribe to avoid missing key entry levels and trading scenarios!
This material is for educational and discussion purposes only. The author is not responsible for trading results.
#ARM #ARMNews $ARM 👈 Click to trade
Entry: 200.350
Stop-loss: 214.280
• Take-profit 1: 186.420
• Take-profit 2: 172.489
• Take-profit 3: 158.559
🎯 Golden rule: After reaching TP1, move the stop-loss to breakeven to protect your capital.
ARM baseline scenario: Bearish while the breakout level holds as resistance; if reclaimed, the plan is invalidated.
📚 Order Flow: Order book imbalance -3.9%; aggressive buying 27.3%. The data indicates that capital flows support the signal direction.
Setup strength: 91/100. The numbers reflect only potential; risk management always comes first. ⚠️ Stop-loss risk is high (6.95%): please reduce your position size.
Price broke below support at 207.416, then formed a short entry point on the retest. Stop-loss risk: 6.95%. Timeframe confluence: 8h, 12h, 1d, 1w. ATR(14): 2.5271.
🔥 Trading volume has increased significantly (about 2.4 times the average).
📈 Subscribe to avoid missing key entry levels and trading scenarios!
This material is for educational and discussion purposes only. The author is not responsible for trading results.
#ARM #ARMNews $ARM 👈 Click to trade
26
·
--
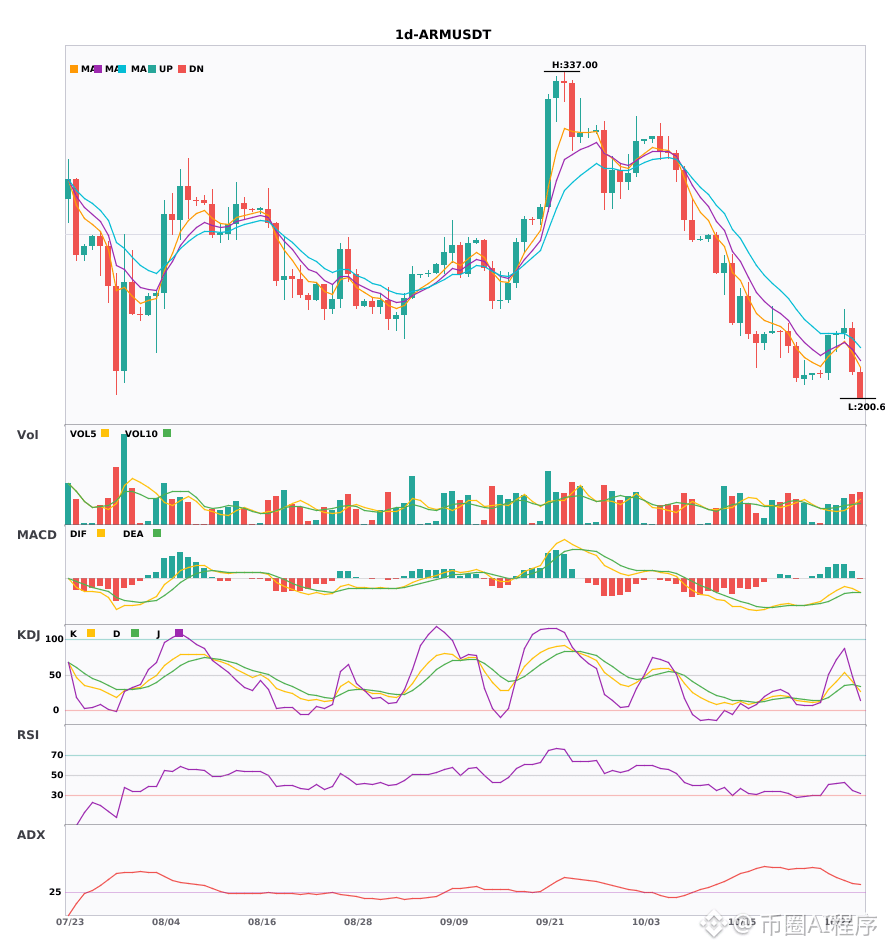
$ARM Daily bearish + weekly bearish alignment, multi-timeframe confluence—trade with the trend 🔥
════════════════════
🟢 $ARM Daily bearish signal
⚠️ Technical analysis: Weekly bearish confluence confirmed | Daily entry: EMA5 crosses below EMA8, signaling a short-term bearish trend | KDJ is trending weakly, with bears in control (K: 40.9, D: 37.2) | Volume increased (1.5x)
════════════════════
🔔 Follow for the latest market-moving updates 🔔
#多周期共振 #ARM
📌 When trading, pay attention to whether the candlestick pattern matches
$ARM Daily bearish + weekly bearish alignment, multi-timeframe confluence—trade with the trend 🔥
════════════════════
🟢 $ARM Daily bearish signal
⚠️ Technical analysis: Weekly bearish confluence confirmed | Daily entry: EMA5 crosses below EMA8, signaling a short-term bearish trend | KDJ is trending weakly, with bears in control (K: 40.9, D: 37.2) | Volume increased (1.5x)
════════════════════
🔔 Follow for the latest market-moving updates 🔔
#多周期共振 #ARM
📌 When trading, pay attention to whether the candlestick pattern matches
════════════════════
🟢 $ARM Daily bearish signal
⚠️ Technical analysis: Weekly bearish confluence confirmed | Daily entry: EMA5 crosses below EMA8, signaling a short-term bearish trend | KDJ is trending weakly, with bears in control (K: 40.9, D: 37.2) | Volume increased (1.5x)
════════════════════
🔔 Follow for the latest market-moving updates 🔔
#多周期共振 #ARM
📌 When trading, pay attention to whether the candlestick pattern matches
3
·
--
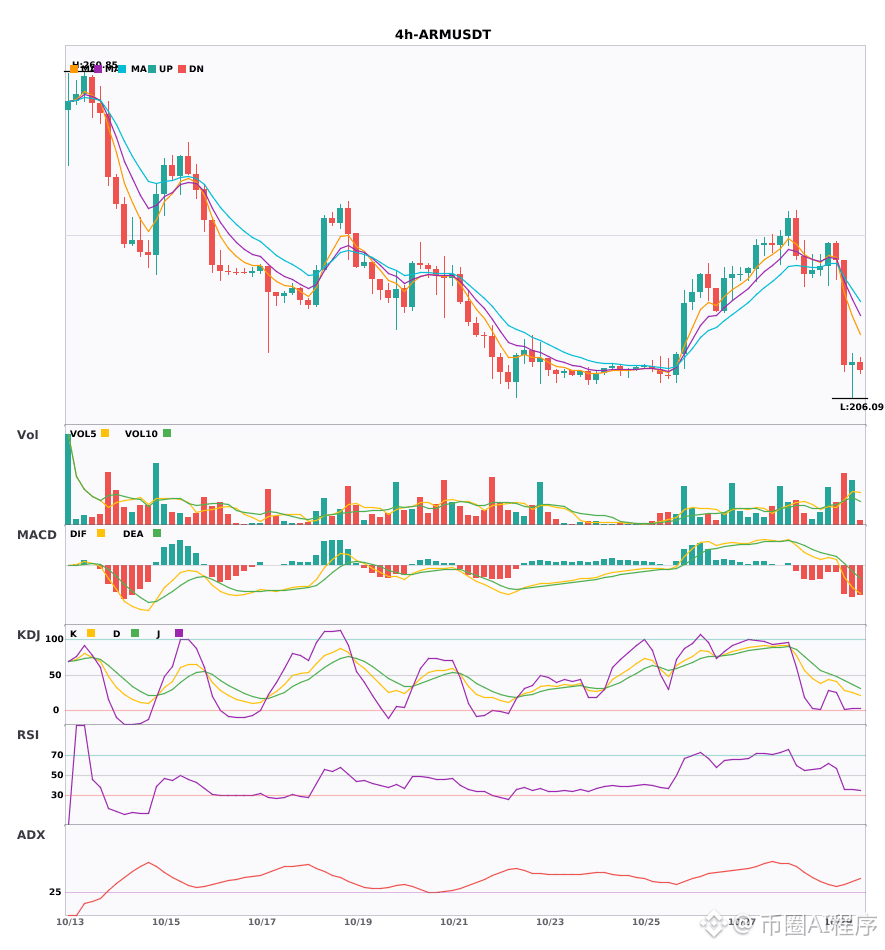
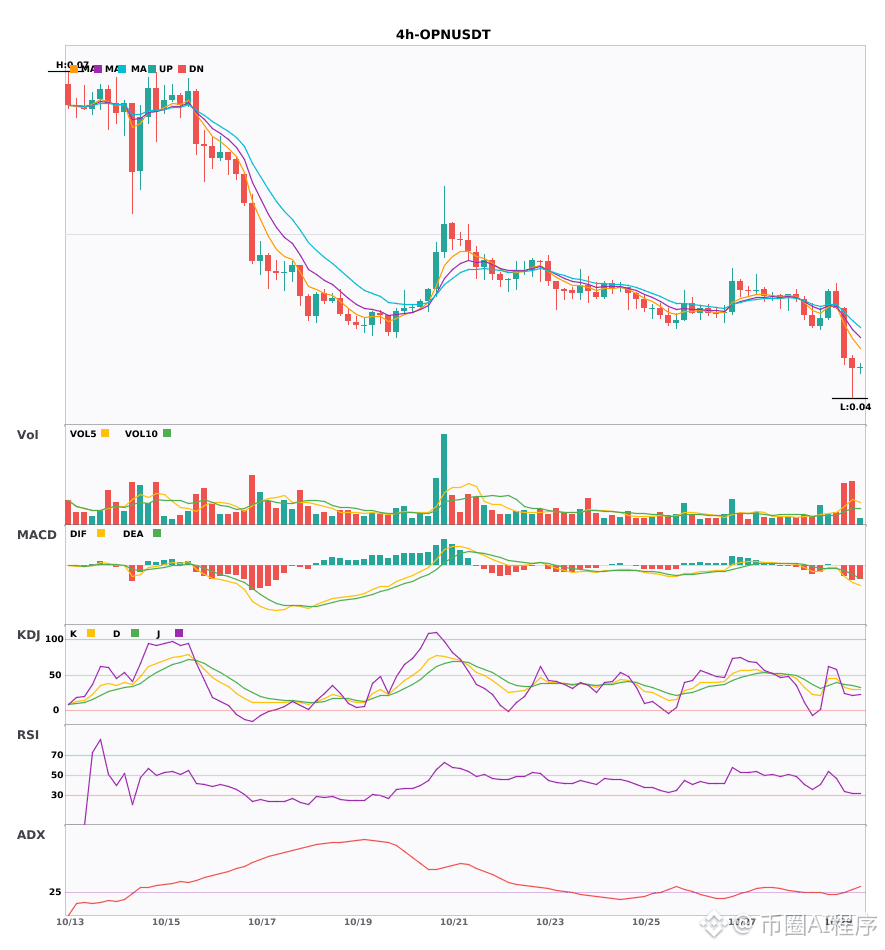
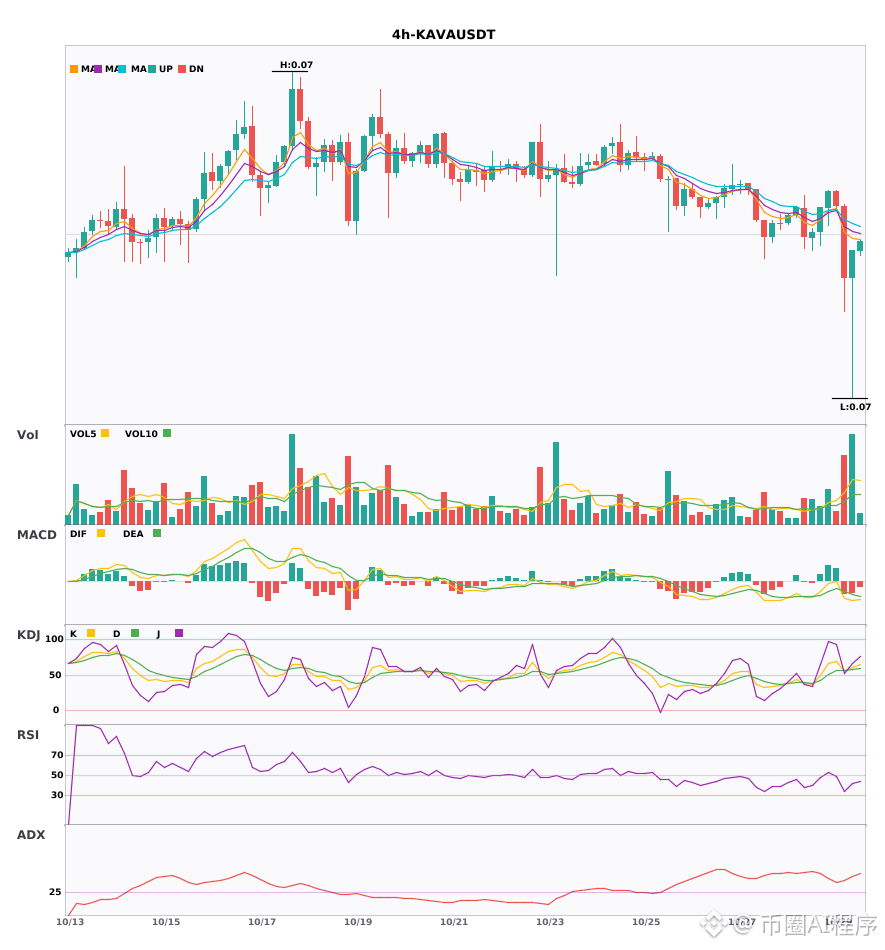
$ARM / $OPN / $KAVA 4-hour short + daily short signals aligned; multi-timeframe confluence turns bearish 🔥
════════════════════
🟢 $ARM 4-hour short signal
⚠️ Technical analysis: Daily bearish confluence confirmed | 4-hour entry: MACD DIF falls below zero, trend turns bearish | EMA5 crosses below EMA8, short-term trend turns bearish | KDJ is weak, favoring bears (K: 28.2, D: 41.7) | Volume increases (2.1x)
════════════════════
🟢 $OPN 4-hour short signal
⚠️ Technical analysis: Daily bearish confluence confirmed | 4-hour entry: MACD death cross below zero, bearish momentum accelerates | EMA5 < EMA8 < EMA13, bearish alignment | KDJ death cross, short-term outlook is bearish (K: 32.4, D: 36.7) | Volume surges (3.1x)
════════════════════
🟢 $KAVA 4-hour short signal
⚠️ Technical analysis: Daily bearish confluence confirmed | 4-hour entry: MACD death cross below zero, bearish momentum accelerates | EMA5 crosses below EMA8, short-term trend turns bearish | KDJ death cross, short-term outlook is bearish (K: 54.5, D: 55.6) | Volume surges (3.0x)
════════════════════
🔔 Follow for the latest market movements 🔔
#多周期共振 #ARM #OPN #KAVA
📌 When trading, watch for whether the candlestick pattern confirms the signal
$ARM / $OPN / $KAVA 4-hour short + daily short signals aligned; multi-timeframe confluence turns bearish 🔥
════════════════════
🟢 $ARM 4-hour short signal
⚠️ Technical analysis: Daily bearish confluence confirmed | 4-hour entry: MACD DIF falls below zero, trend turns bearish | EMA5 crosses below EMA8, short-term trend turns bearish | KDJ is weak, favoring bears (K: 28.2, D: 41.7) | Volume increases (2.1x)
════════════════════
🟢 $OPN 4-hour short signal
⚠️ Technical analysis: Daily bearish confluence confirmed | 4-hour entry: MACD death cross below zero, bearish momentum accelerates | EMA5 < EMA8 < EMA13, bearish alignment | KDJ death cross, short-term outlook is bearish (K: 32.4, D: 36.7) | Volume surges (3.1x)
════════════════════
🟢 $KAVA 4-hour short signal
⚠️ Technical analysis: Daily bearish confluence confirmed | 4-hour entry: MACD death cross below zero, bearish momentum accelerates | EMA5 crosses below EMA8, short-term trend turns bearish | KDJ death cross, short-term outlook is bearish (K: 54.5, D: 55.6) | Volume surges (3.0x)
════════════════════
🔔 Follow for the latest market movements 🔔
#多周期共振 #ARM #OPN #KAVA
📌 When trading, watch for whether the candlestick pattern confirms the signal
════════════════════
🟢 $ARM 4-hour short signal
⚠️ Technical analysis: Daily bearish confluence confirmed | 4-hour entry: MACD DIF falls below zero, trend turns bearish | EMA5 crosses below EMA8, short-term trend turns bearish | KDJ is weak, favoring bears (K: 28.2, D: 41.7) | Volume increases (2.1x)
════════════════════
🟢 $OPN 4-hour short signal
⚠️ Technical analysis: Daily bearish confluence confirmed | 4-hour entry: MACD death cross below zero, bearish momentum accelerates | EMA5 < EMA8 < EMA13, bearish alignment | KDJ death cross, short-term outlook is bearish (K: 32.4, D: 36.7) | Volume surges (3.1x)
════════════════════
🟢 $KAVA 4-hour short signal
⚠️ Technical analysis: Daily bearish confluence confirmed | 4-hour entry: MACD death cross below zero, bearish momentum accelerates | EMA5 crosses below EMA8, short-term trend turns bearish | KDJ death cross, short-term outlook is bearish (K: 54.5, D: 55.6) | Volume surges (3.0x)
════════════════════
🔔 Follow for the latest market movements 🔔
#多周期共振 #ARM #OPN #KAVA
📌 When trading, watch for whether the candlestick pattern confirms the signal
21
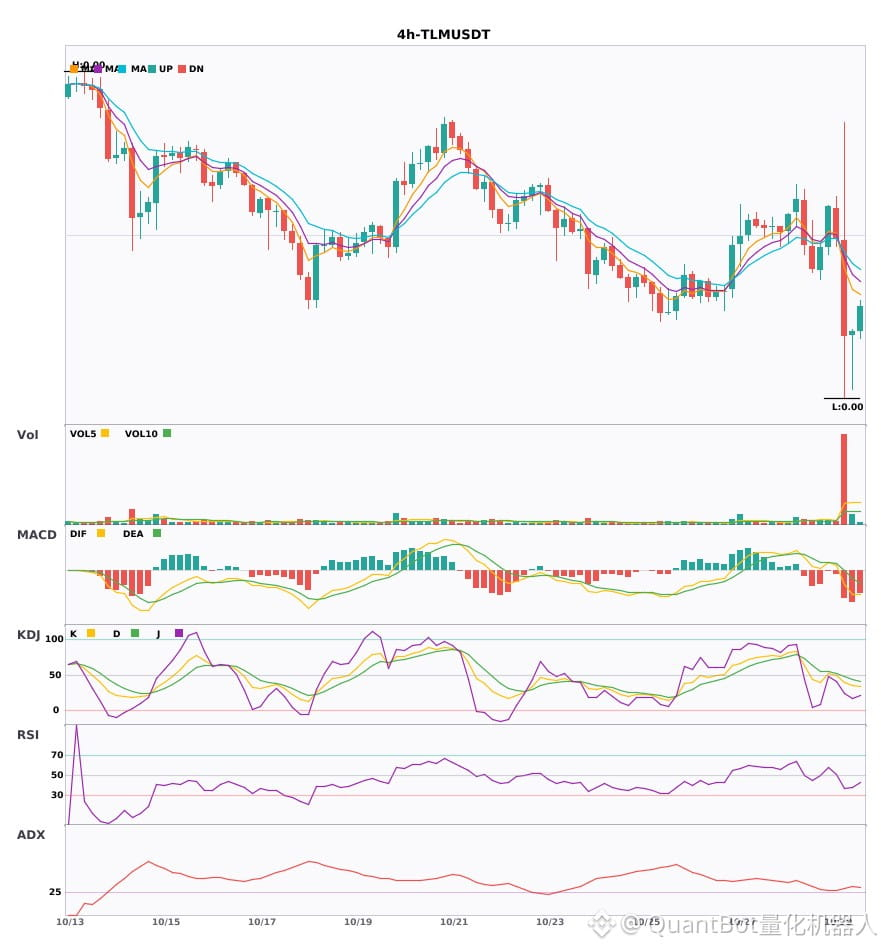
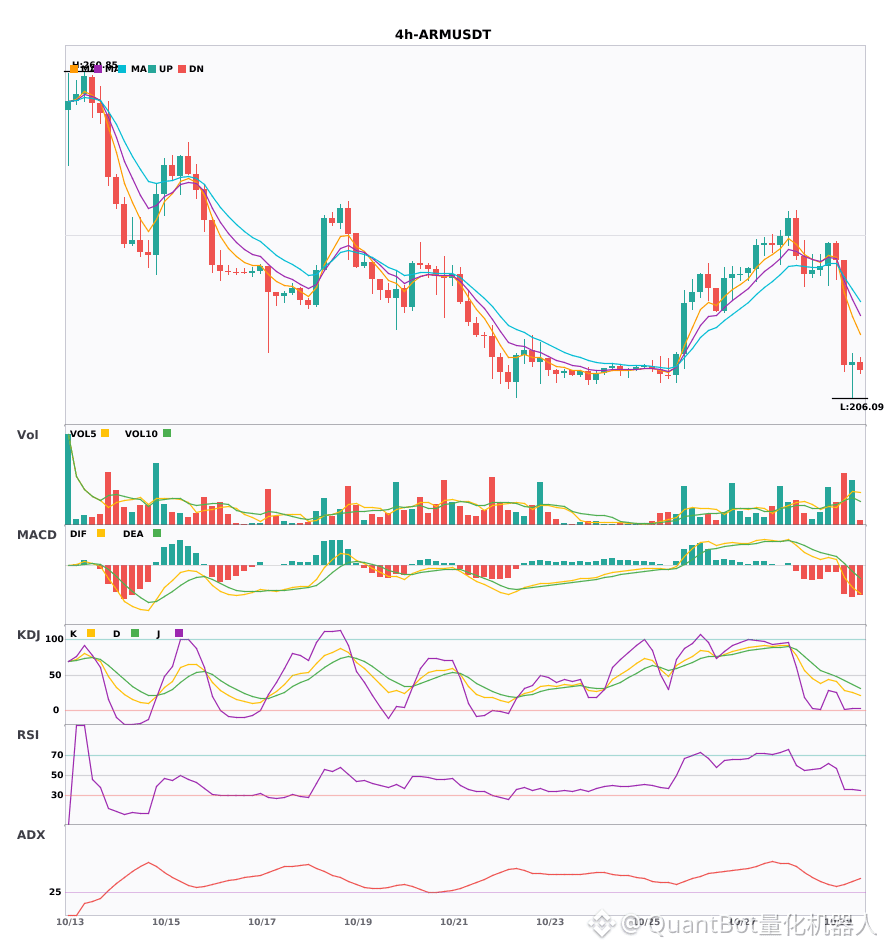
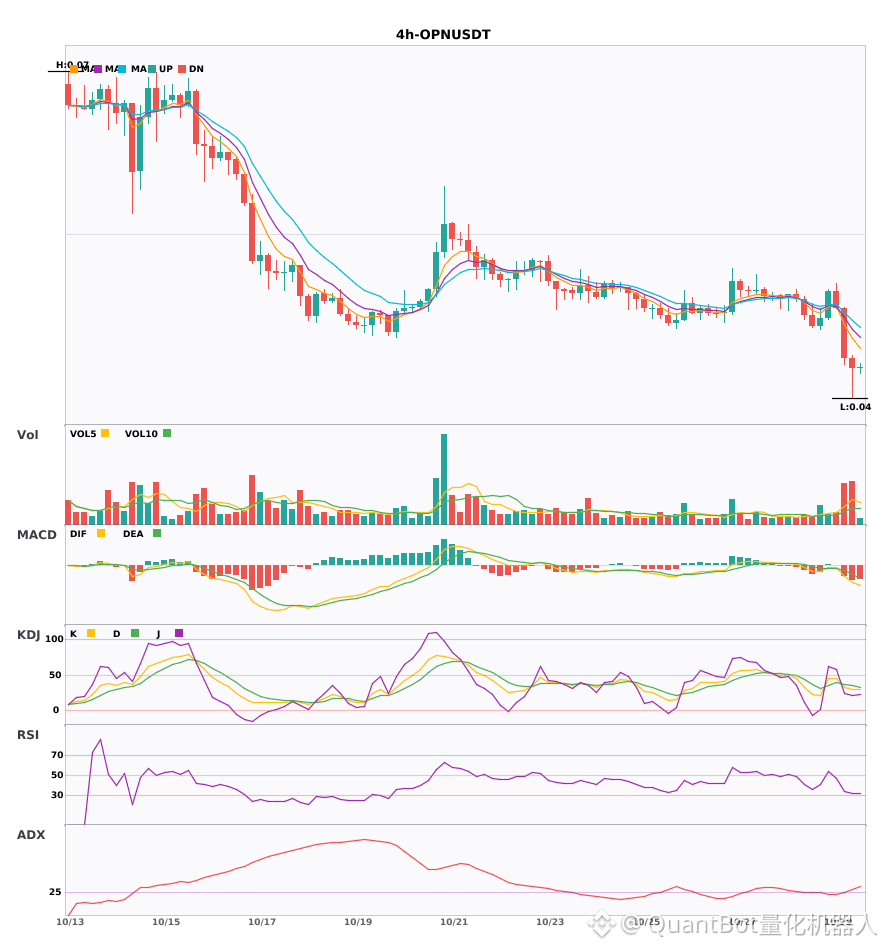
$TLM / $ARM / $OPN 4-hour confluence turns bearish, with bearish signals appearing simultaneously
📉 $TLM | 4-hour bearish signal
━━━━━━━━━━━━━━━━━━
Technical analysis: ADX(31) indicates a clear trending market | MACD DIF has fallen below the zero line, signaling a bearish trend | EMA5 has crossed below EMA8, signaling a short-term bearish trend | KDJ is weak, with bears in control (K: 40.0, D: 48.3) | Volume surge (7.0x)
Price change: -7.4700%
📉 $ARM | 4-hour bearish signal
━━━━━━━━━━━━━━━━━━
Technical analysis: ADX(34) indicates a clear trending market | MACD DIF has fallen below the zero line, signaling a bearish trend | EMA5 has crossed below EMA8, signaling a short-term bearish trend | KDJ is weak, with bears in control (K: 28.2, D: 41.7) | Increased volume (2.1x)
Price change: -7.6200%
📉 $OPN | 4-hour bearish signal
━━━━━━━━━━━━━━━━━━
Technical analysis: ADX(27) indicates a trend is forming and may be traded | MACD has formed a death cross below zero, accelerating the bearish trend | EMA5 < EMA8 < EMA13, in bearish alignment | KDJ death cross, short-term outlook is bearish (K: 32.4, D: 36.7) | Volume surge (3.1x)
Price change: -7.5100%
━━━━━━━━━━━━━━━━━━
#技术分析 #TLM #ARM #OPN
📌 The above content is for reference only and does not constitute investment advice
$TLM / $ARM / $OPN 4-hour confluence turns bearish, with bearish signals appearing simultaneously
📉 $TLM | 4-hour bearish signal
━━━━━━━━━━━━━━━━━━
Technical analysis: ADX(31) indicates a clear trending market | MACD DIF has fallen below the zero line, signaling a bearish trend | EMA5 has crossed below EMA8, signaling a short-term bearish trend | KDJ is weak, with bears in control (K: 40.0, D: 48.3) | Volume surge (7.0x)
Price change: -7.4700%
📉 $ARM | 4-hour bearish signal
━━━━━━━━━━━━━━━━━━
Technical analysis: ADX(34) indicates a clear trending market | MACD DIF has fallen below the zero line, signaling a bearish trend | EMA5 has crossed below EMA8, signaling a short-term bearish trend | KDJ is weak, with bears in control (K: 28.2, D: 41.7) | Increased volume (2.1x)
Price change: -7.6200%
📉 $OPN | 4-hour bearish signal
━━━━━━━━━━━━━━━━━━
Technical analysis: ADX(27) indicates a trend is forming and may be traded | MACD has formed a death cross below zero, accelerating the bearish trend | EMA5 < EMA8 < EMA13, in bearish alignment | KDJ death cross, short-term outlook is bearish (K: 32.4, D: 36.7) | Volume surge (3.1x)
Price change: -7.5100%
━━━━━━━━━━━━━━━━━━
#技术分析 #TLM #ARM #OPN
📌 The above content is for reference only and does not constitute investment advice
📉 $TLM | 4-hour bearish signal
━━━━━━━━━━━━━━━━━━
Technical analysis: ADX(31) indicates a clear trending market | MACD DIF has fallen below the zero line, signaling a bearish trend | EMA5 has crossed below EMA8, signaling a short-term bearish trend | KDJ is weak, with bears in control (K: 40.0, D: 48.3) | Volume surge (7.0x)
Price change: -7.4700%
📉 $ARM | 4-hour bearish signal
━━━━━━━━━━━━━━━━━━
Technical analysis: ADX(34) indicates a clear trending market | MACD DIF has fallen below the zero line, signaling a bearish trend | EMA5 has crossed below EMA8, signaling a short-term bearish trend | KDJ is weak, with bears in control (K: 28.2, D: 41.7) | Increased volume (2.1x)
Price change: -7.6200%
📉 $OPN | 4-hour bearish signal
━━━━━━━━━━━━━━━━━━
Technical analysis: ADX(27) indicates a trend is forming and may be traded | MACD has formed a death cross below zero, accelerating the bearish trend | EMA5 < EMA8 < EMA13, in bearish alignment | KDJ death cross, short-term outlook is bearish (K: 32.4, D: 36.7) | Volume surge (3.1x)
Price change: -7.5100%
━━━━━━━━━━━━━━━━━━
#技术分析 #TLM #ARM #OPN
📌 The above content is for reference only and does not constitute investment advice
22
·
--
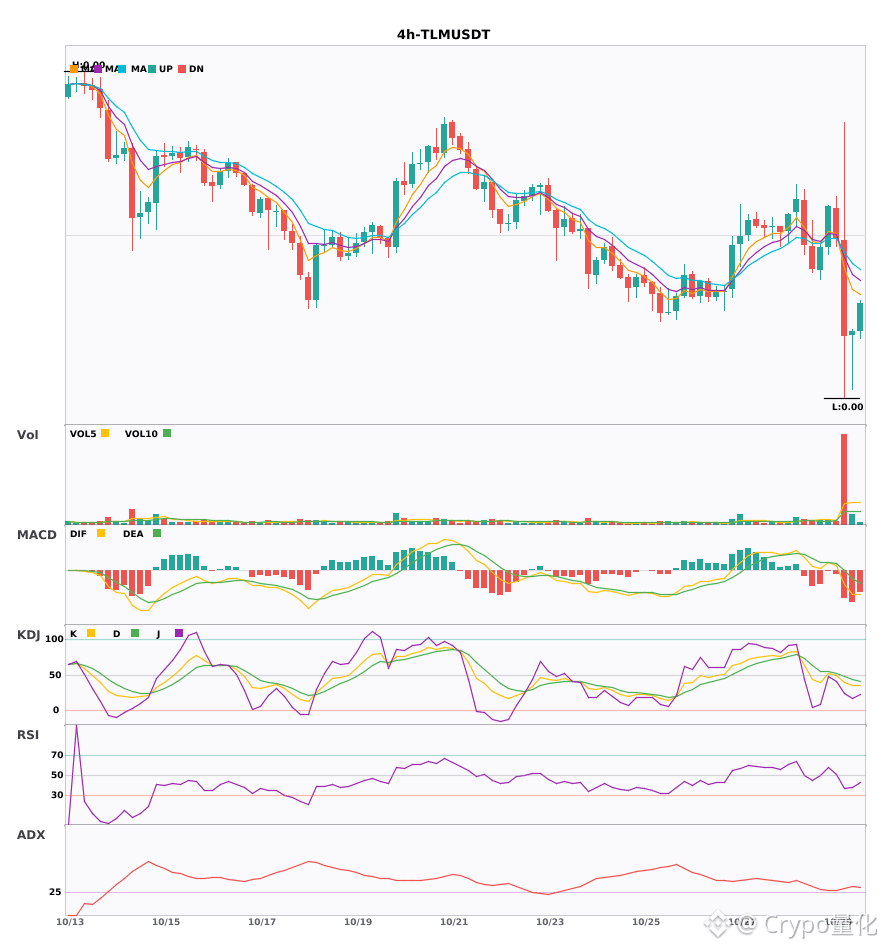
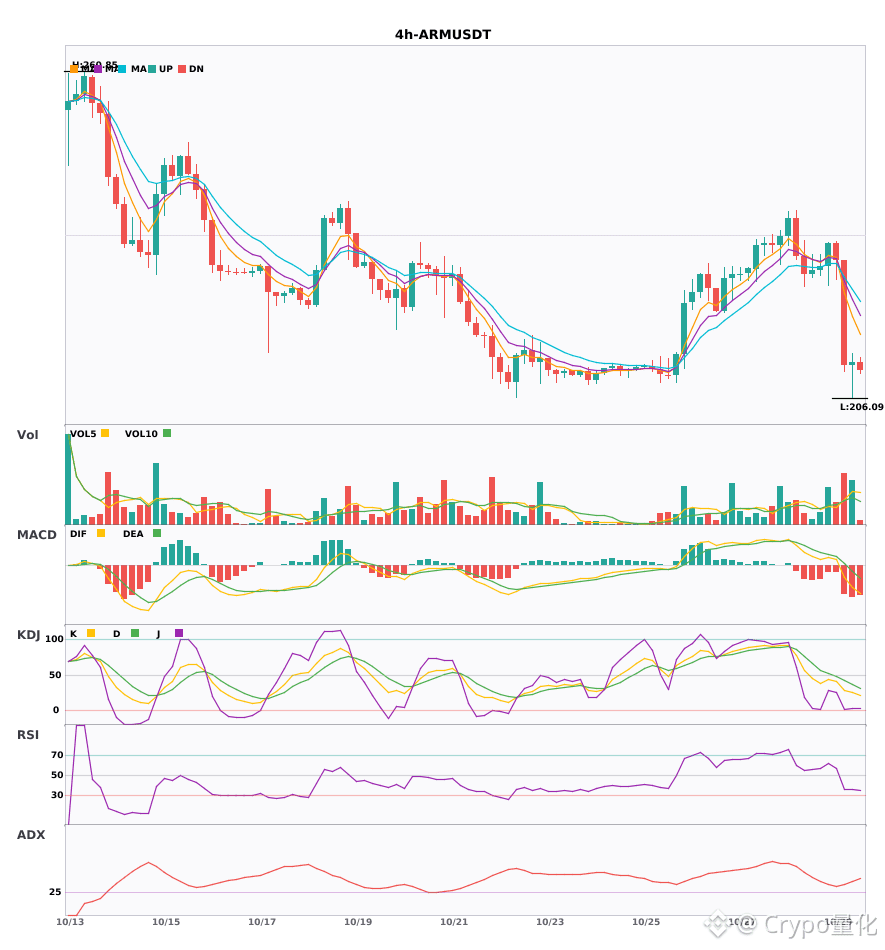
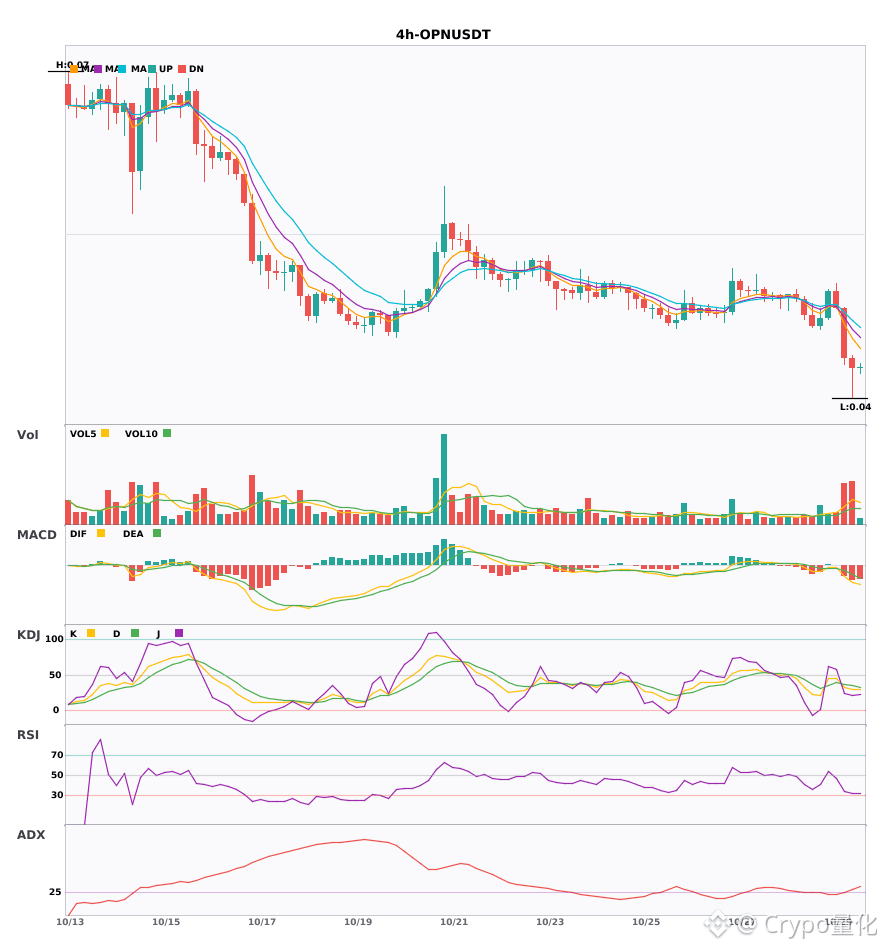
$TLM / $ARM / $OPN -hour technical indicators are weakening in unison. Be aware of the risk 🔥
════════════════════
🟢 $TLM 4-hour bearish signal
⚠️Technical analysis: ADX(31): strong trending market | MACD DIF fell below zero, trend turns bearish | EMA5 crossed below EMA8, short-term bearish | KDJ is weak, bears have the upper hand (K: 40.0, D: 48.3) | Volume surge (7.0x)
════════════════════
🟢 $ARM 4-hour bearish signal
⚠️Technical analysis: ADX(34): strong trending market | MACD DIF fell below zero, trend turns bearish | EMA5 crossed below EMA8, short-term bearish | KDJ is weak, bears have the upper hand (K: 28.2, D: 41.7) | Volume increase (2.1x)
════════════════════
🟢 $OPN 4-hour bearish signal
⚠️Technical analysis: ADX(27): trend is forming; entry is possible | MACD bearish crossover below zero, bearish momentum accelerating | EMA5 < EMA8 < EMA13, bearish alignment | KDJ death cross, short-term bearish (K: 32.4, D: 36.7) | Volume surge (3.1x)
════════════════════
🔔 Follow for first-hand market alerts 🔔
#技术分析 #TLM #ARM #OPN
📌 When trading, check whether the candlestick pattern confirms the signal
$TLM / $ARM / $OPN -hour technical indicators are weakening in unison. Be aware of the risk 🔥
════════════════════
🟢 $TLM 4-hour bearish signal
⚠️Technical analysis: ADX(31): strong trending market | MACD DIF fell below zero, trend turns bearish | EMA5 crossed below EMA8, short-term bearish | KDJ is weak, bears have the upper hand (K: 40.0, D: 48.3) | Volume surge (7.0x)
════════════════════
🟢 $ARM 4-hour bearish signal
⚠️Technical analysis: ADX(34): strong trending market | MACD DIF fell below zero, trend turns bearish | EMA5 crossed below EMA8, short-term bearish | KDJ is weak, bears have the upper hand (K: 28.2, D: 41.7) | Volume increase (2.1x)
════════════════════
🟢 $OPN 4-hour bearish signal
⚠️Technical analysis: ADX(27): trend is forming; entry is possible | MACD bearish crossover below zero, bearish momentum accelerating | EMA5 < EMA8 < EMA13, bearish alignment | KDJ death cross, short-term bearish (K: 32.4, D: 36.7) | Volume surge (3.1x)
════════════════════
🔔 Follow for first-hand market alerts 🔔
#技术分析 #TLM #ARM #OPN
📌 When trading, check whether the candlestick pattern confirms the signal
════════════════════
🟢 $TLM 4-hour bearish signal
⚠️Technical analysis: ADX(31): strong trending market | MACD DIF fell below zero, trend turns bearish | EMA5 crossed below EMA8, short-term bearish | KDJ is weak, bears have the upper hand (K: 40.0, D: 48.3) | Volume surge (7.0x)
════════════════════
🟢 $ARM 4-hour bearish signal
⚠️Technical analysis: ADX(34): strong trending market | MACD DIF fell below zero, trend turns bearish | EMA5 crossed below EMA8, short-term bearish | KDJ is weak, bears have the upper hand (K: 28.2, D: 41.7) | Volume increase (2.1x)
════════════════════
🟢 $OPN 4-hour bearish signal
⚠️Technical analysis: ADX(27): trend is forming; entry is possible | MACD bearish crossover below zero, bearish momentum accelerating | EMA5 < EMA8 < EMA13, bearish alignment | KDJ death cross, short-term bearish (K: 32.4, D: 36.7) | Volume surge (3.1x)
════════════════════
🔔 Follow for first-hand market alerts 🔔
#技术分析 #TLM #ARM #OPN
📌 When trading, check whether the candlestick pattern confirms the signal
13
·
--
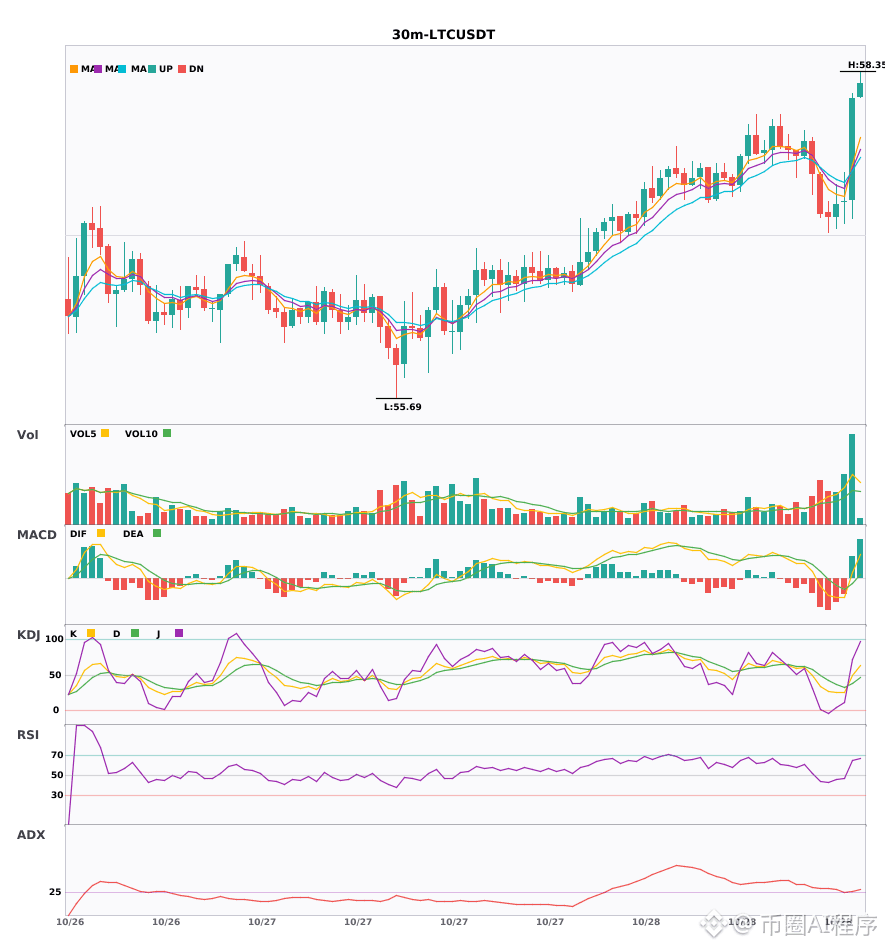
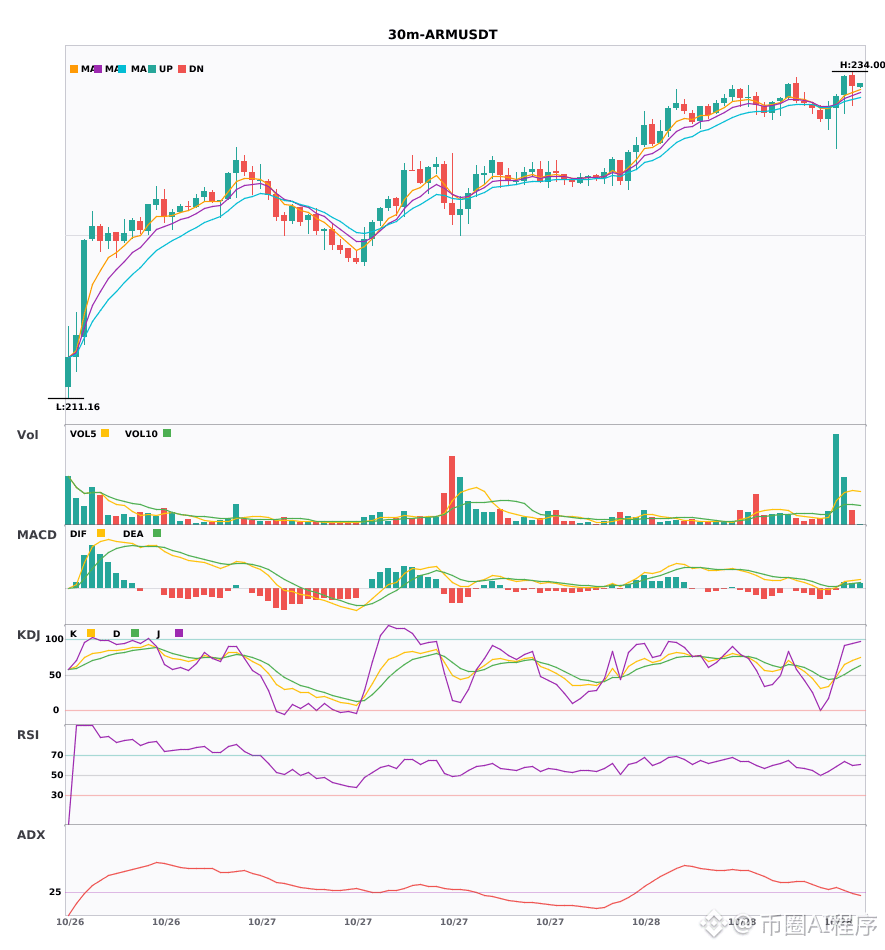
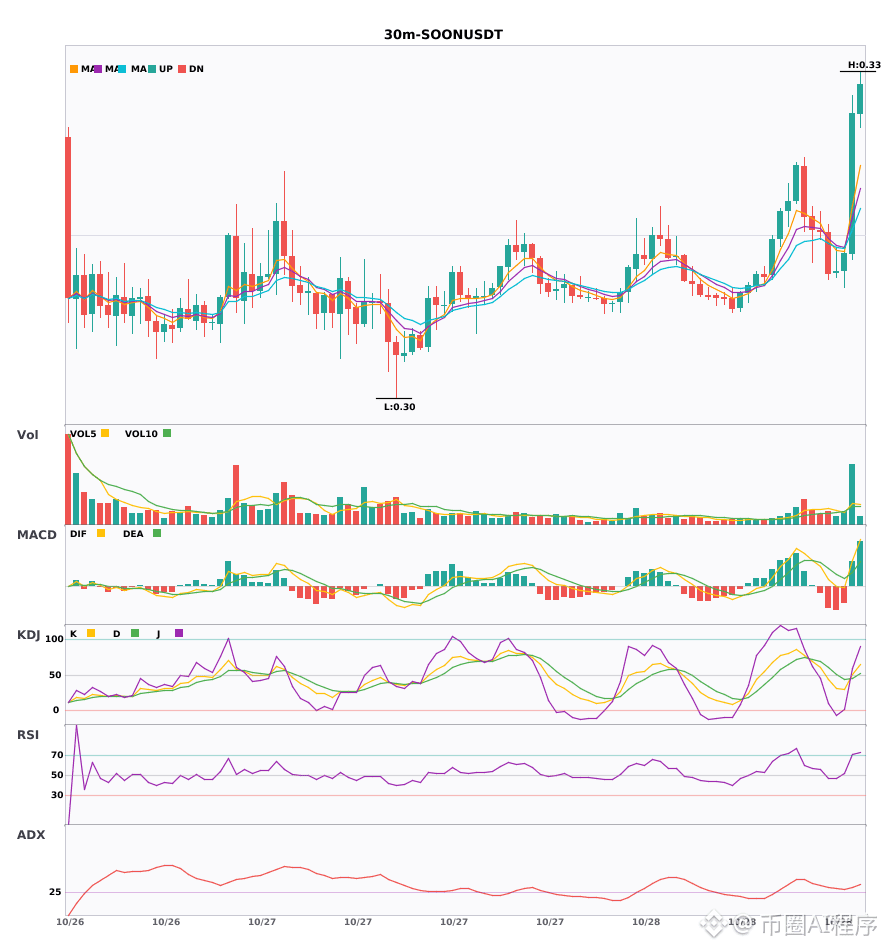
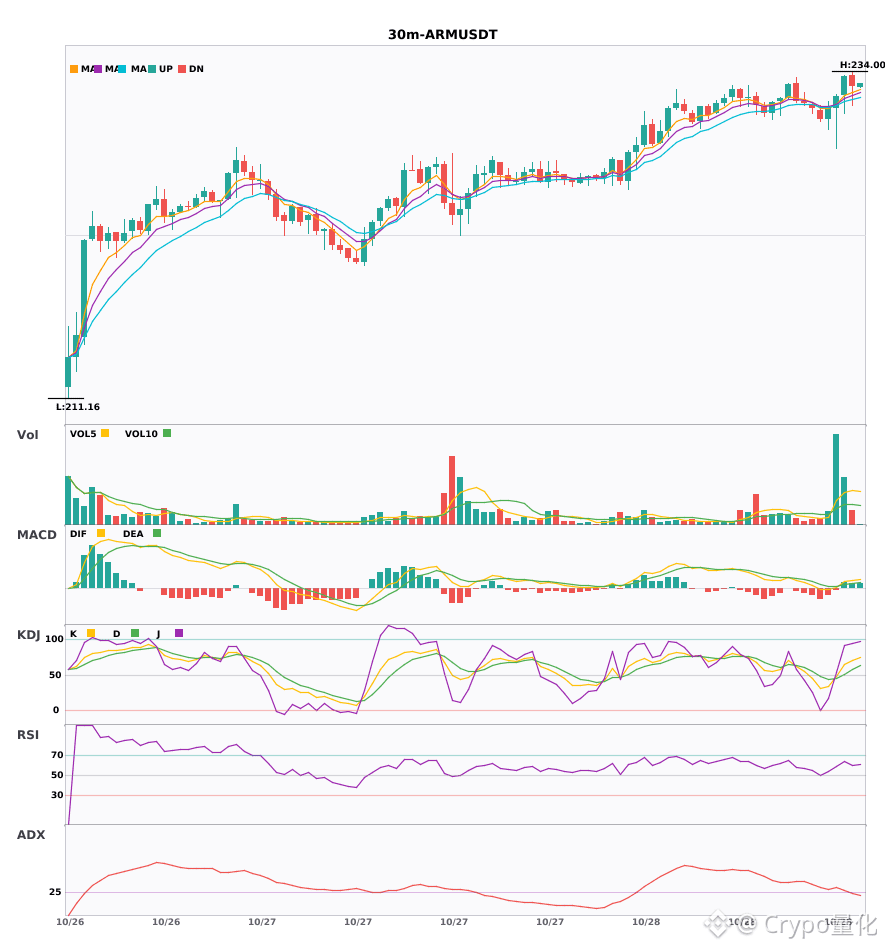
$LTC / $ARM / $SOON 30-minute bullish signal, 4-hour bullish trend confirmed 🔥
════════════════════
🔴 $LTC 30-minute bullish signal
⚠️Technical analysis: 4-hour bullish resonance confirmed | 30-minute entry MACD golden cross above zero, bullish momentum released | EMA5 crosses above EMA8, short-term turning bullish | KDJ golden cross, short-term bullish (K is 49.4 D is 38.5) | Volume surge (2.6x)
════════════════════
🔴 $ARM 30-minute bullish signal
⚠️Technical analysis: 4-hour bullish resonance confirmed | 30-minute entry MACD golden cross above zero, bullish momentum released | EMA5 greater than EMA8 greater than EMA13, bullish alignment | KDJ running strongly, bulls in advantage (K is 64.7 D is 51.3) | Volume surge (5.4x)
════════════════════
🔴 $SOON 30-minute bullish signal
⚠️Technical analysis: 4-hour bullish resonance confirmed | 30-minute entry MACD golden cross above zero, bullish momentum released | EMA5 crosses above EMA8, short-term turning bullish | KDJ golden cross, short-term bullish (K is 50.0 D is 45.6) | Volume surge (3.3x)
════════════════════
🔔 Follow to get the latest market moves first-hand 🔔
#多周期共振 #LTC #ARM #SOON
📌 When trading, pay attention to whether the candlestick pattern is in line with it
$LTC / $ARM / $SOON 30-minute bullish signal, 4-hour bullish trend confirmed 🔥
════════════════════
🔴 $LTC 30-minute bullish signal
⚠️Technical analysis: 4-hour bullish resonance confirmed | 30-minute entry MACD golden cross above zero, bullish momentum released | EMA5 crosses above EMA8, short-term turning bullish | KDJ golden cross, short-term bullish (K is 49.4 D is 38.5) | Volume surge (2.6x)
════════════════════
🔴 $ARM 30-minute bullish signal
⚠️Technical analysis: 4-hour bullish resonance confirmed | 30-minute entry MACD golden cross above zero, bullish momentum released | EMA5 greater than EMA8 greater than EMA13, bullish alignment | KDJ running strongly, bulls in advantage (K is 64.7 D is 51.3) | Volume surge (5.4x)
════════════════════
🔴 $SOON 30-minute bullish signal
⚠️Technical analysis: 4-hour bullish resonance confirmed | 30-minute entry MACD golden cross above zero, bullish momentum released | EMA5 crosses above EMA8, short-term turning bullish | KDJ golden cross, short-term bullish (K is 50.0 D is 45.6) | Volume surge (3.3x)
════════════════════
🔔 Follow to get the latest market moves first-hand 🔔
#多周期共振 #LTC #ARM #SOON
📌 When trading, pay attention to whether the candlestick pattern is in line with it
════════════════════
🔴 $LTC 30-minute bullish signal
⚠️Technical analysis: 4-hour bullish resonance confirmed | 30-minute entry MACD golden cross above zero, bullish momentum released | EMA5 crosses above EMA8, short-term turning bullish | KDJ golden cross, short-term bullish (K is 49.4 D is 38.5) | Volume surge (2.6x)
════════════════════
🔴 $ARM 30-minute bullish signal
⚠️Technical analysis: 4-hour bullish resonance confirmed | 30-minute entry MACD golden cross above zero, bullish momentum released | EMA5 greater than EMA8 greater than EMA13, bullish alignment | KDJ running strongly, bulls in advantage (K is 64.7 D is 51.3) | Volume surge (5.4x)
════════════════════
🔴 $SOON 30-minute bullish signal
⚠️Technical analysis: 4-hour bullish resonance confirmed | 30-minute entry MACD golden cross above zero, bullish momentum released | EMA5 crosses above EMA8, short-term turning bullish | KDJ golden cross, short-term bullish (K is 50.0 D is 45.6) | Volume surge (3.3x)
════════════════════
🔔 Follow to get the latest market moves first-hand 🔔
#多周期共振 #LTC #ARM #SOON
📌 When trading, pay attention to whether the candlestick pattern is in line with it
12
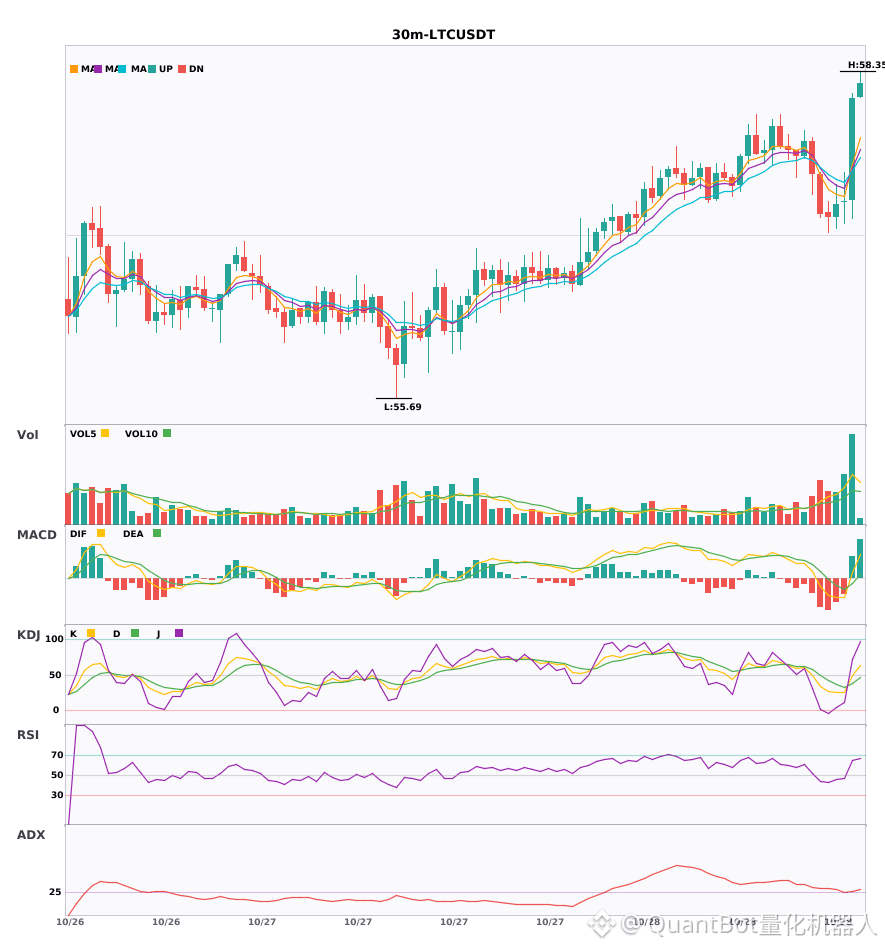
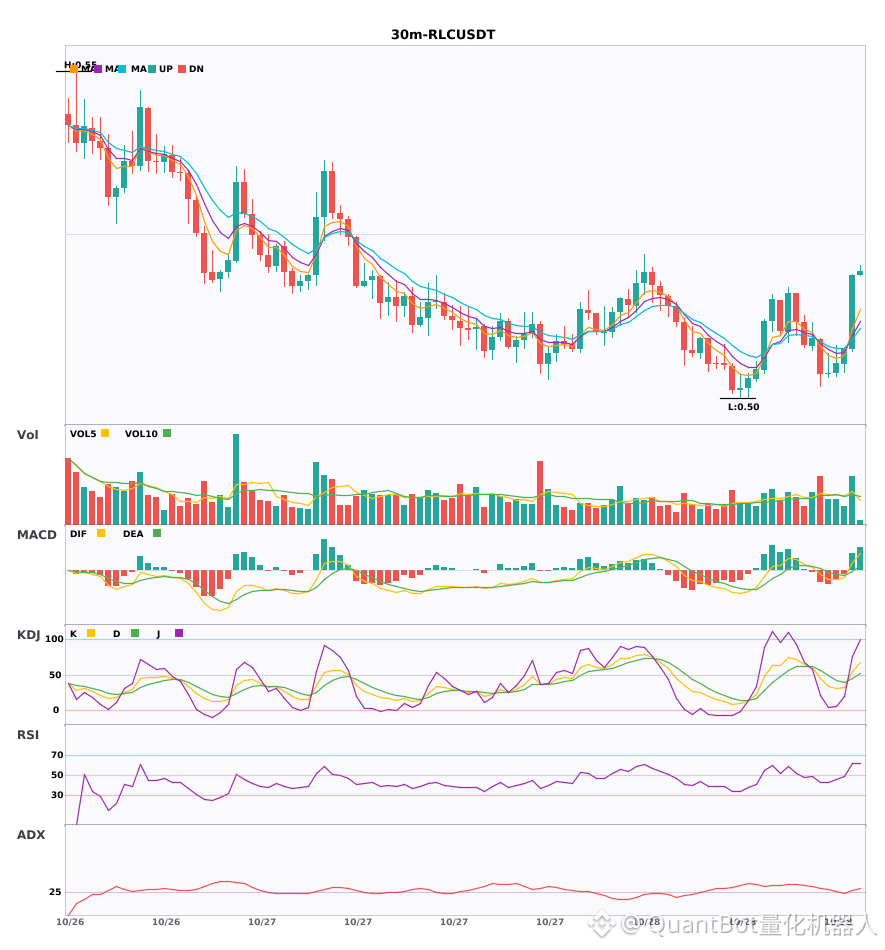
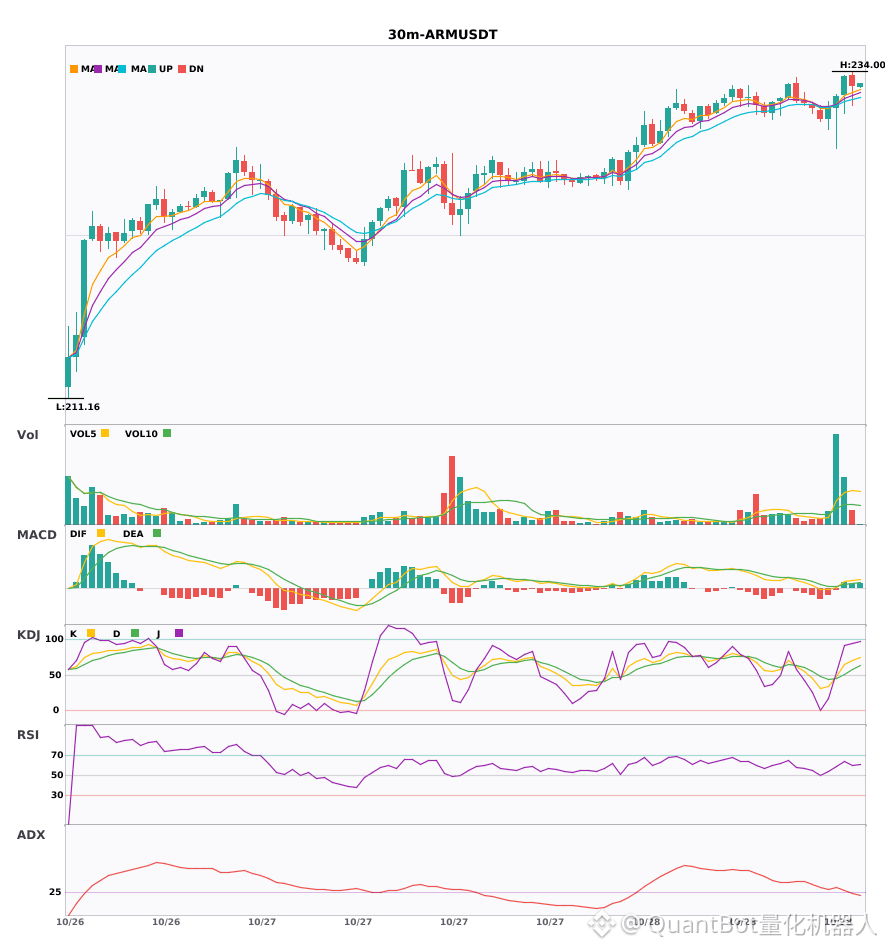
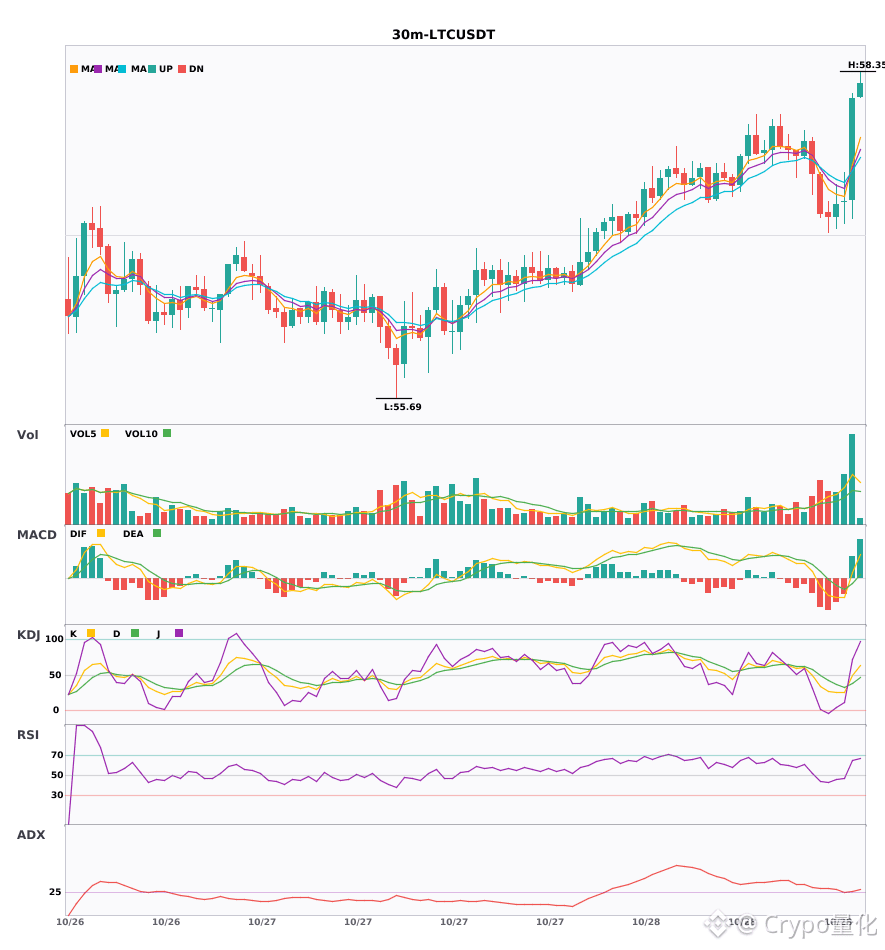
$LTC / $RLC / $ARM 30-minute confluence turns bullish, with bullish signals appearing simultaneously
📈 $LTC | 30-minute bullish signal
━━━━━━━━━━━━━━━━━━
Technical analysis: ADX(27): Trend is forming; opportunity to participate | MACD bullish crossover above zero, bullish momentum released | EMA5 crosses above EMA8, short-term trend turns bullish | KDJ bullish crossover, short-term outlook bullish (K: 49.4, D: 38.5) | Volume surge (2.6x)
Price change: 1.4700%
📈 $RLC | 30-minute bullish signal
━━━━━━━━━━━━━━━━━━
Technical analysis: ADX(29): Trend is forming; opportunity to participate | MACD bullish crossover above zero, bullish momentum released | EMA5 crosses above EMA8, short-term trend turns bullish | KDJ bullish crossover, short-term outlook bullish (K: 54.9, D: 44.6) | Volume increase (1.6x)
Price change: 2.4600%
📈 $ARM | 30-minute bullish signal
━━━━━━━━━━━━━━━━━━
Technical analysis: ADX(27): Trend is forming; opportunity to participate | MACD bullish crossover above zero, bullish momentum released | EMA5 > EMA8 > EMA13, bullish alignment | KDJ showing strong momentum, bulls in control (K: 64.7, D: 51.3) | Volume surge (5.4x)
Price change: 0.6000%
━━━━━━━━━━━━━━━━━━
#技术分析 #LTC #RLC #ARM
📌 The above content is for reference only and does not constitute investment advice
$LTC / $RLC / $ARM 30-minute confluence turns bullish, with bullish signals appearing simultaneously
📈 $LTC | 30-minute bullish signal
━━━━━━━━━━━━━━━━━━
Technical analysis: ADX(27): Trend is forming; opportunity to participate | MACD bullish crossover above zero, bullish momentum released | EMA5 crosses above EMA8, short-term trend turns bullish | KDJ bullish crossover, short-term outlook bullish (K: 49.4, D: 38.5) | Volume surge (2.6x)
Price change: 1.4700%
📈 $RLC | 30-minute bullish signal
━━━━━━━━━━━━━━━━━━
Technical analysis: ADX(29): Trend is forming; opportunity to participate | MACD bullish crossover above zero, bullish momentum released | EMA5 crosses above EMA8, short-term trend turns bullish | KDJ bullish crossover, short-term outlook bullish (K: 54.9, D: 44.6) | Volume increase (1.6x)
Price change: 2.4600%
📈 $ARM | 30-minute bullish signal
━━━━━━━━━━━━━━━━━━
Technical analysis: ADX(27): Trend is forming; opportunity to participate | MACD bullish crossover above zero, bullish momentum released | EMA5 > EMA8 > EMA13, bullish alignment | KDJ showing strong momentum, bulls in control (K: 64.7, D: 51.3) | Volume surge (5.4x)
Price change: 0.6000%
━━━━━━━━━━━━━━━━━━
#技术分析 #LTC #RLC #ARM
📌 The above content is for reference only and does not constitute investment advice
📈 $LTC | 30-minute bullish signal
━━━━━━━━━━━━━━━━━━
Technical analysis: ADX(27): Trend is forming; opportunity to participate | MACD bullish crossover above zero, bullish momentum released | EMA5 crosses above EMA8, short-term trend turns bullish | KDJ bullish crossover, short-term outlook bullish (K: 49.4, D: 38.5) | Volume surge (2.6x)
Price change: 1.4700%
📈 $RLC | 30-minute bullish signal
━━━━━━━━━━━━━━━━━━
Technical analysis: ADX(29): Trend is forming; opportunity to participate | MACD bullish crossover above zero, bullish momentum released | EMA5 crosses above EMA8, short-term trend turns bullish | KDJ bullish crossover, short-term outlook bullish (K: 54.9, D: 44.6) | Volume increase (1.6x)
Price change: 2.4600%
📈 $ARM | 30-minute bullish signal
━━━━━━━━━━━━━━━━━━
Technical analysis: ADX(27): Trend is forming; opportunity to participate | MACD bullish crossover above zero, bullish momentum released | EMA5 > EMA8 > EMA13, bullish alignment | KDJ showing strong momentum, bulls in control (K: 64.7, D: 51.3) | Volume surge (5.4x)
Price change: 0.6000%
━━━━━━━━━━━━━━━━━━
#技术分析 #LTC #RLC #ARM
📌 The above content is for reference only and does not constitute investment advice
8
·
--
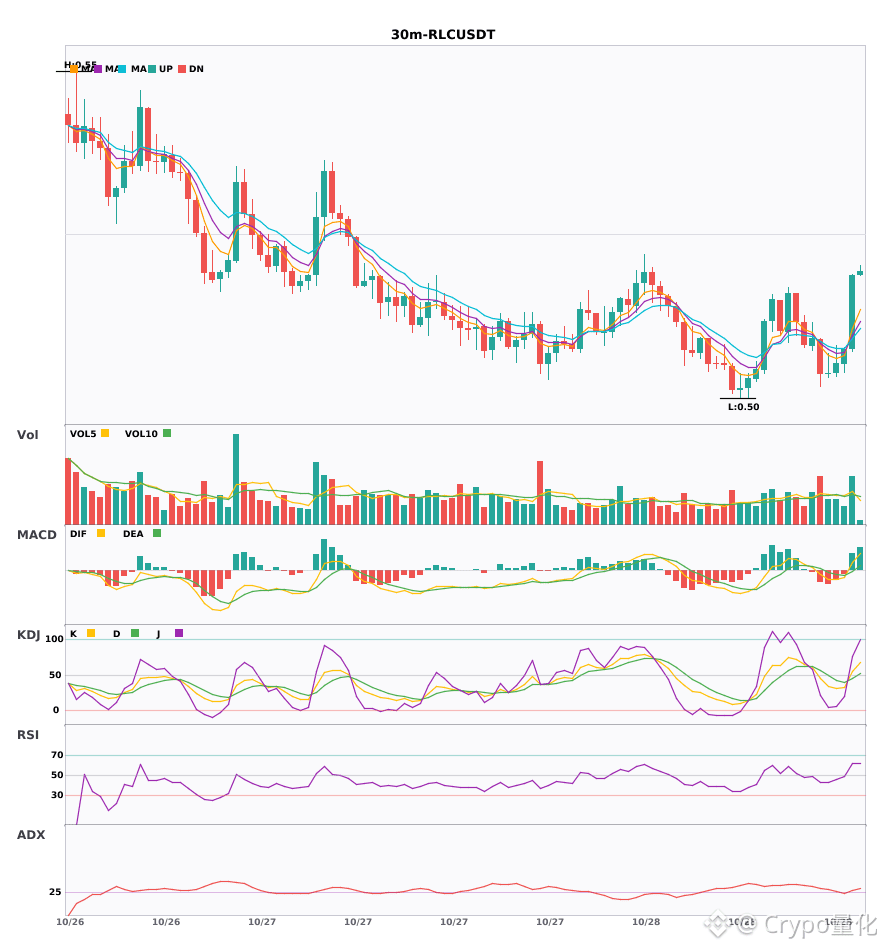
$LTC / $RLC / $ARM 30 minutes technical indicators are moving up together, which has the most explosive potential? 🔥
════════════════════
🔴 $LTC 30 minutes Bullish Signal
⚠️Technical: ADX(27) trend is forming, can participate | MACD golden cross above zero, bullish momentum is releasing | EMA5 crosses above EMA8, short-term turning bullish | KDJ golden cross, short-term bullish (K=49.4 D=38.5) | Volume surge (2.6x)
════════════════════
🔴 $RLC 30 minutes Bullish Signal
⚠️Technical: ADX(29) trend is forming, can participate | MACD golden cross above zero, bullish momentum is releasing | EMA5 crosses above EMA8, short-term turning bullish | KDJ golden cross, short-term bullish (K=54.9 D=44.6) | Volume increase (1.6x)
════════════════════
🔴 $ARM 30 minutes Bullish Signal
⚠️Technical: ADX(27) trend is forming, can participate | MACD golden cross above zero, bullish momentum is releasing | EMA5 is above EMA8 and EMA13, bullish alignment | KDJ is running strongly, bulls are dominant (K=64.7 D=51.3) | Volume surge (5.4x)
════════════════════
🔔 Follow to get the latest market moves first-hand 🔔
#技术分析 #LTC #RLC #ARM
📌 When trading, pay attention to whether the candlestick pattern matches
$LTC / $RLC / $ARM 30 minutes technical indicators are moving up together, which has the most explosive potential? 🔥
════════════════════
🔴 $LTC 30 minutes Bullish Signal
⚠️Technical: ADX(27) trend is forming, can participate | MACD golden cross above zero, bullish momentum is releasing | EMA5 crosses above EMA8, short-term turning bullish | KDJ golden cross, short-term bullish (K=49.4 D=38.5) | Volume surge (2.6x)
════════════════════
🔴 $RLC 30 minutes Bullish Signal
⚠️Technical: ADX(29) trend is forming, can participate | MACD golden cross above zero, bullish momentum is releasing | EMA5 crosses above EMA8, short-term turning bullish | KDJ golden cross, short-term bullish (K=54.9 D=44.6) | Volume increase (1.6x)
════════════════════
🔴 $ARM 30 minutes Bullish Signal
⚠️Technical: ADX(27) trend is forming, can participate | MACD golden cross above zero, bullish momentum is releasing | EMA5 is above EMA8 and EMA13, bullish alignment | KDJ is running strongly, bulls are dominant (K=64.7 D=51.3) | Volume surge (5.4x)
════════════════════
🔔 Follow to get the latest market moves first-hand 🔔
#技术分析 #LTC #RLC #ARM
📌 When trading, pay attention to whether the candlestick pattern matches
════════════════════
🔴 $LTC 30 minutes Bullish Signal
⚠️Technical: ADX(27) trend is forming, can participate | MACD golden cross above zero, bullish momentum is releasing | EMA5 crosses above EMA8, short-term turning bullish | KDJ golden cross, short-term bullish (K=49.4 D=38.5) | Volume surge (2.6x)
════════════════════
🔴 $RLC 30 minutes Bullish Signal
⚠️Technical: ADX(29) trend is forming, can participate | MACD golden cross above zero, bullish momentum is releasing | EMA5 crosses above EMA8, short-term turning bullish | KDJ golden cross, short-term bullish (K=54.9 D=44.6) | Volume increase (1.6x)
════════════════════
🔴 $ARM 30 minutes Bullish Signal
⚠️Technical: ADX(27) trend is forming, can participate | MACD golden cross above zero, bullish momentum is releasing | EMA5 is above EMA8 and EMA13, bullish alignment | KDJ is running strongly, bulls are dominant (K=64.7 D=51.3) | Volume surge (5.4x)
════════════════════
🔔 Follow to get the latest market moves first-hand 🔔
#技术分析 #LTC #RLC #ARM
📌 When trading, pay attention to whether the candlestick pattern matches
19
Log in to explore more content
Join global crypto users on Binance Square
⚡️ Get latest and useful information about crypto.
💬 Trusted by the world’s largest crypto exchange.
👍 Discover real insights from verified creators.
Email / Phone number
Trending Topics
1
#BitcoinRebounds$75KAsChipsLead
5,042 views
99 Discussing
2
#JobsReportRaisesHikeOdds
81,255 views
835 Discussing
3
#US Data Center Rules May Constrain AI Expansion
9,983 views
91 Discussing
4
#$2TWipedOutHedgeFundsFaceLiquidation
11,747 views
95 Discussing
5
#WillAnthropicListOnTime
10,291 views
225 Discussing
6
#USNovemberMichiganExpectationsIndexPrelimAt50.9
19,081 views
331 Discussing
7
#OilPlungesBelow$100
19,123 views
37 Discussing
8
#TradFiForBeginners
11,484 views
210 Discussing
9
#USMidtermsCouldShakeUpUS-IranTies
37,790 views
501 Discussing
10
#RussianCentralBankNamesBTCETHUSDTForNonQualifiedInvestors
729 views
11 Discussing