
#eth
eth
4.5G views
27.3M Discussing
Hot
Latest

·
--
Bearish
**$ETH TH BEARS EYE ANOTHER DROP — SHORT SETUP!**
ETH is showing bearish signals on both 4H and 1H charts, with price trading below key EMAs.
🔴 **SHORT ENTRY:** $2,240.23 – $2,243.99
🎯 TP1: $2,205.47 (-1.6%)
🎯 TP2: $2,181.04 (-2.7%)
🎯 Final TP: $2,144.40 (-4.4%)
🛑 Stop Loss: $2,290.96 (+2.2%)
**Why I'm Watching This Setup:**
- 4H and 1H EMA alignment remains bearish.
- Sellers could push $ETH H toward lower support levels.
- However, short-term buying pressure is still present.
**Trade Management:**
- Close 50% at TP1.
- Close 25% at TP2.
- Close remaining 25% at TP3.
- Move SL to entry after TP1.
⚠️ Moderate conviction only. Keep position size light and manage risk carefully.
**Will ETH drop toward $2,144 or surprise the bears?** 👀
#ETH #ETHUSDT #ShortSetup #CryptoTrading #BinanceSquare
{future}(ETHUSDT)
**$ETH TH BEARS EYE ANOTHER DROP — SHORT SETUP!**
ETH is showing bearish signals on both 4H and 1H charts, with price trading below key EMAs.
🔴 **SHORT ENTRY:** $2,240.23 – $2,243.99
🎯 TP1: $2,205.47 (-1.6%)
🎯 TP2: $2,181.04 (-2.7%)
🎯 Final TP: $2,144.40 (-4.4%)
🛑 Stop Loss: $2,290.96 (+2.2%)
**Why I'm Watching This Setup:**
- 4H and 1H EMA alignment remains bearish.
- Sellers could push $ETH H toward lower support levels.
- However, short-term buying pressure is still present.
**Trade Management:**
- Close 50% at TP1.
- Close 25% at TP2.
- Close remaining 25% at TP3.
- Move SL to entry after TP1.
⚠️ Moderate conviction only. Keep position size light and manage risk carefully.
**Will ETH drop toward $2,144 or surprise the bears?** 👀
#ETH #ETHUSDT #ShortSetup #CryptoTrading #BinanceSquare
ETH is showing bearish signals on both 4H and 1H charts, with price trading below key EMAs.
🔴 **SHORT ENTRY:** $2,240.23 – $2,243.99
🎯 TP1: $2,205.47 (-1.6%)
🎯 TP2: $2,181.04 (-2.7%)
🎯 Final TP: $2,144.40 (-4.4%)
🛑 Stop Loss: $2,290.96 (+2.2%)
**Why I'm Watching This Setup:**
- 4H and 1H EMA alignment remains bearish.
- Sellers could push $ETH H toward lower support levels.
- However, short-term buying pressure is still present.
**Trade Management:**
- Close 50% at TP1.
- Close 25% at TP2.
- Close remaining 25% at TP3.
- Move SL to entry after TP1.
⚠️ Moderate conviction only. Keep position size light and manage risk carefully.
**Will ETH drop toward $2,144 or surprise the bears?** 👀
#ETH #ETHUSDT #ShortSetup #CryptoTrading #BinanceSquare
259

·
--
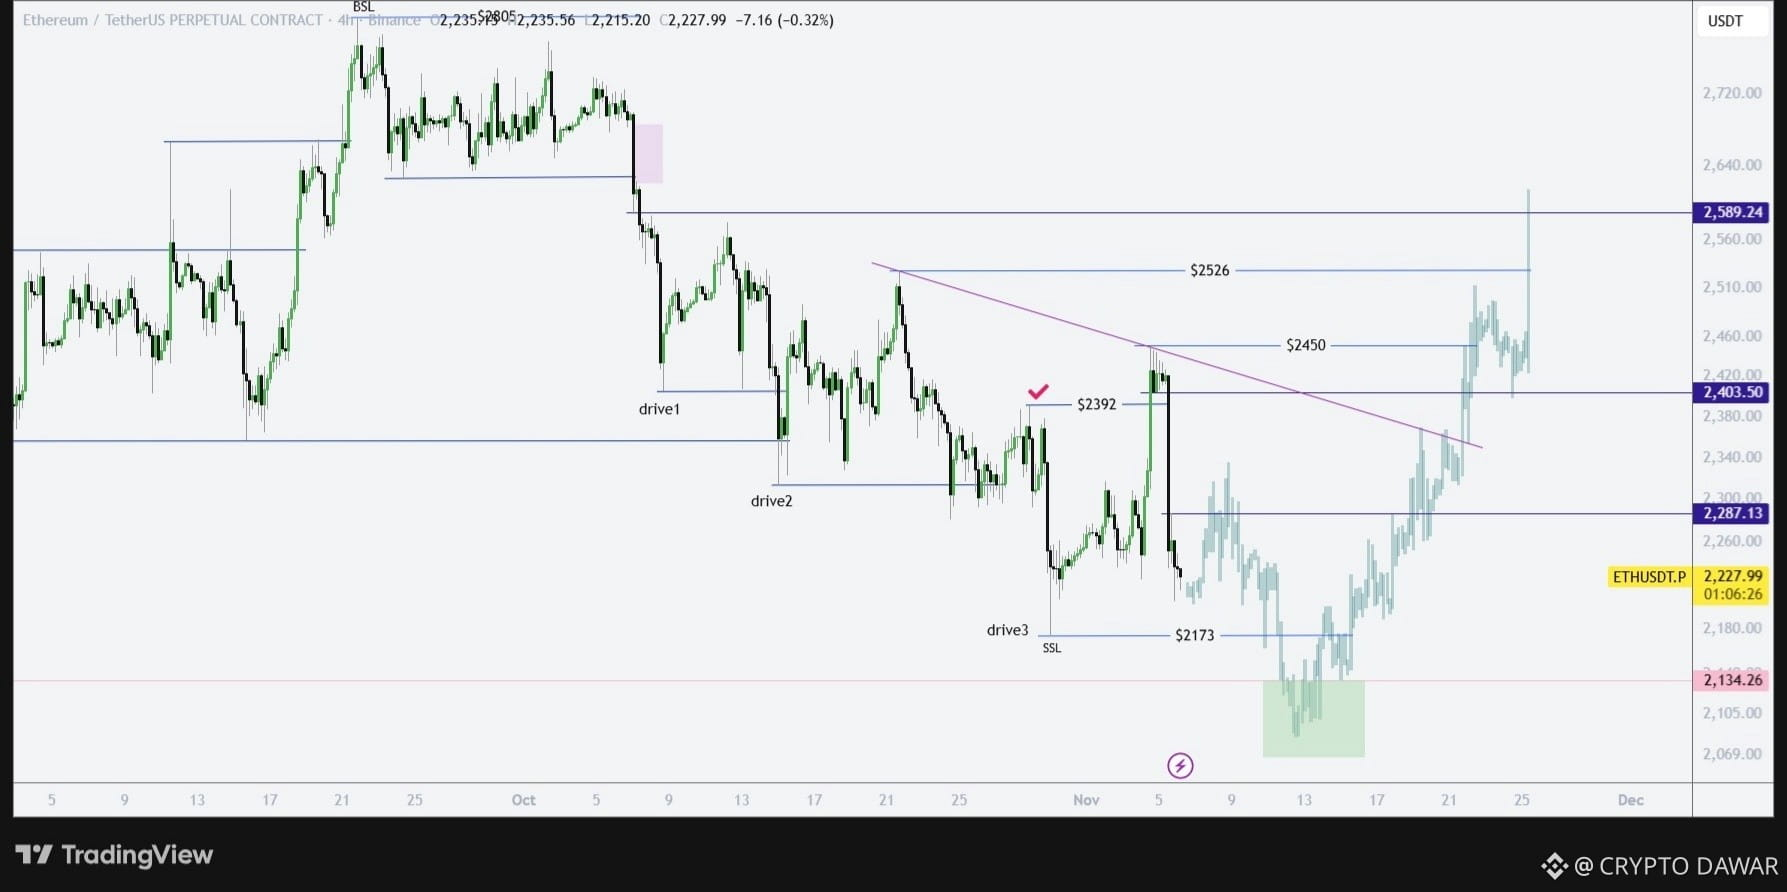
#ETH — Analysis- 👀
After a pullback, I expect one more low before a potential reversal to the upside from our highlighted zone.🕔
$ETH
{future}(ETHUSDT)
$XRP
{future}(XRPUSDT)
$BNB
{future}(BNBUSDT)
#BinanceReopensWithdrawalsForMoreAssets #CryptoDawar #AnthropicIPOValuationDoubts #BinancePick
#ETH — Analysis- 👀
After a pullback, I expect one more low before a potential reversal to the upside from our highlighted zone.🕔
$ETH
$XRP
$BNB
#BinanceReopensWithdrawalsForMoreAssets #CryptoDawar #AnthropicIPOValuationDoubts #BinancePick
After a pullback, I expect one more low before a potential reversal to the upside from our highlighted zone.🕔
$ETH
$XRP
$BNB
#BinanceReopensWithdrawalsForMoreAssets #CryptoDawar #AnthropicIPOValuationDoubts #BinancePick
1
1
573

·
--
Bearish
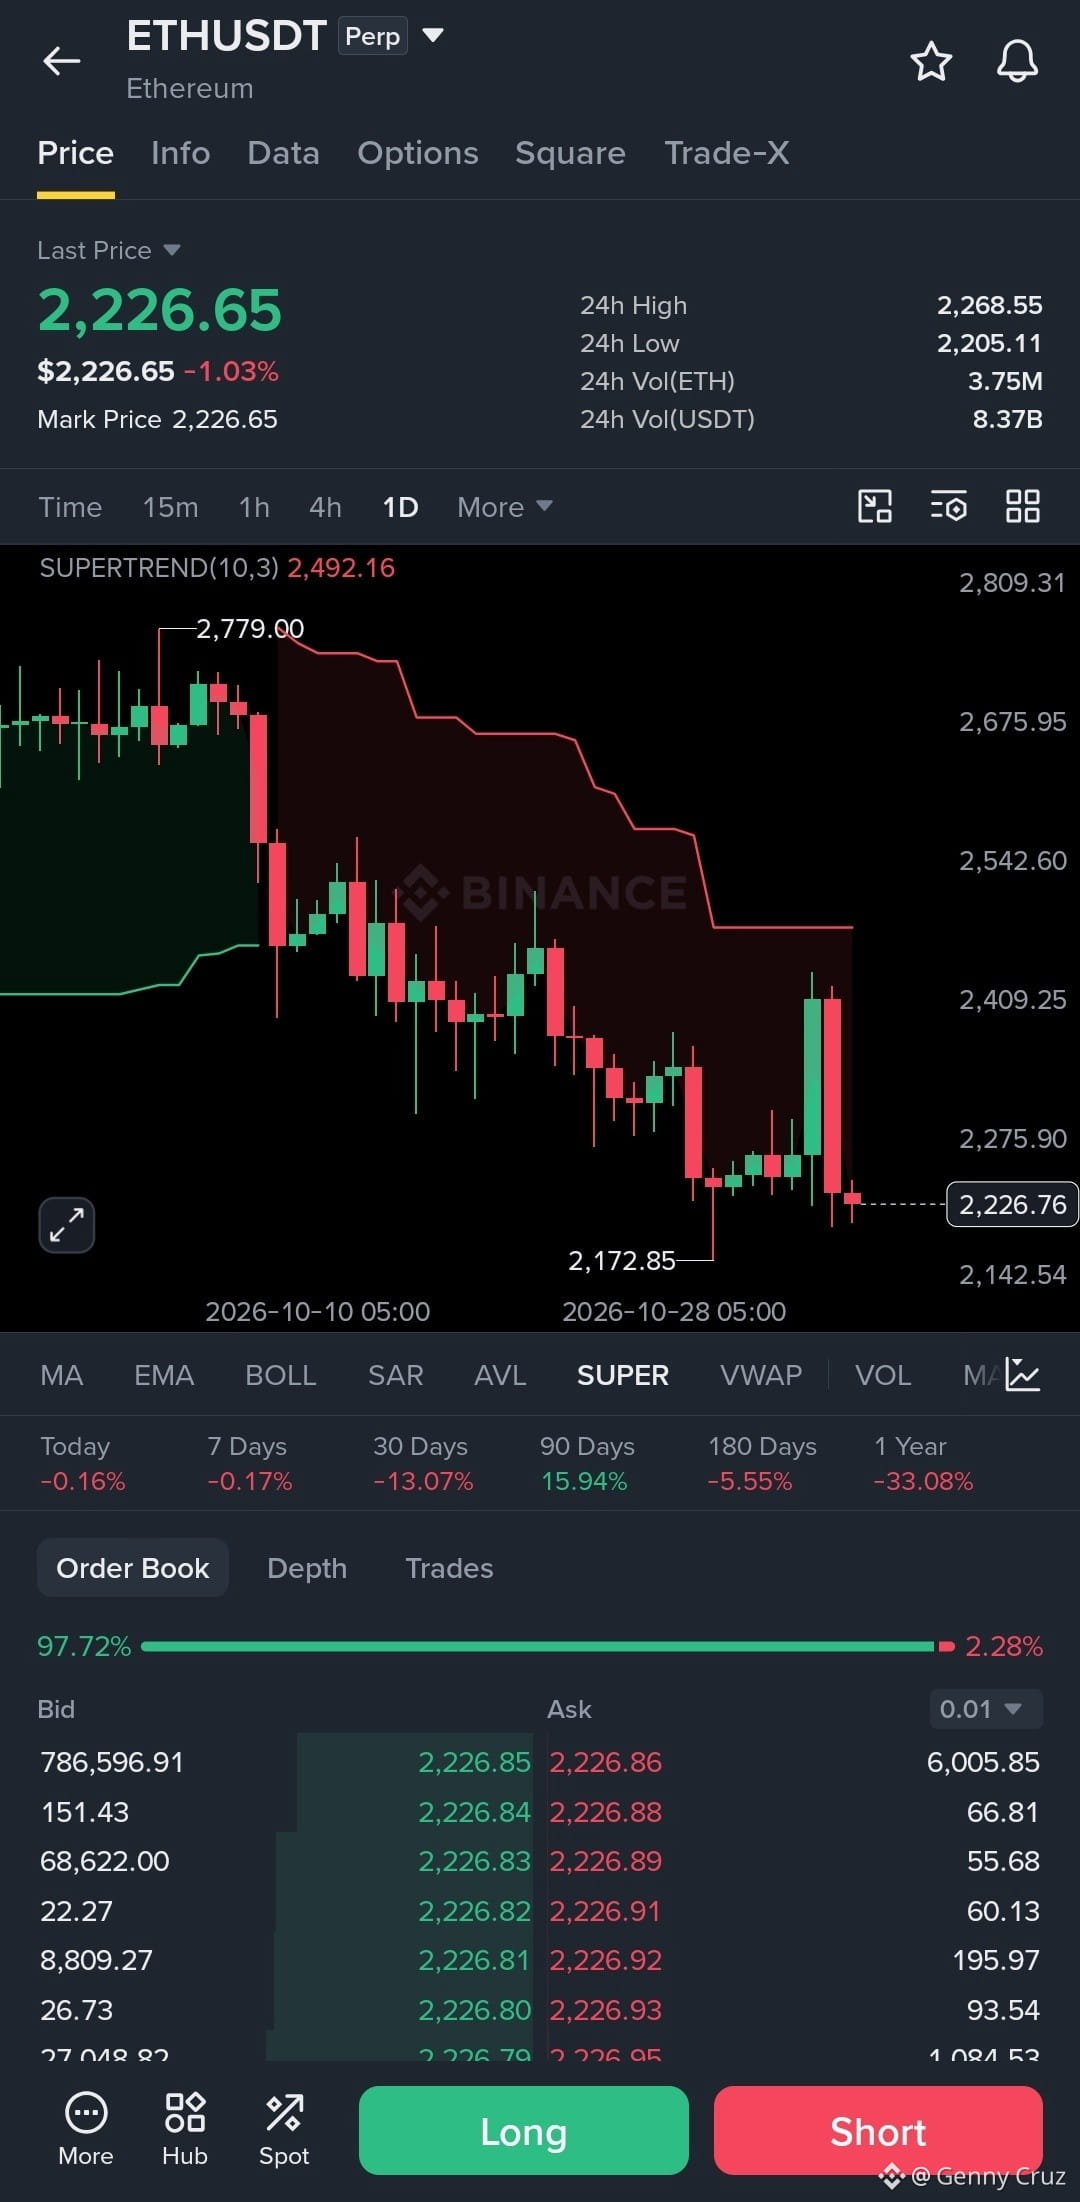
$ETH is still under pressure, and that recent bounce hasn't changed the bigger picture yet.
Trading around $2,226, Ethereum remains below the daily Supertrend at $2,492. The rejection near $2,409 shows sellers are still active.
Key levels to watch:
Support: $2,205
Major support: $2,172.85
Resistance: $2,275–$2,300
Next resistance: $2,409
Trend reversal zone: $2,492
Holding above $2,172 keeps room for another recovery attempt. A reclaim of $2,409 would be a stronger sign of buyers returning.
For now, ETH needs confirmation, not just a green candle.
#Write2Earn #ETH
{spot}(ETHUSDT)
$ETH is still under pressure, and that recent bounce hasn't changed the bigger picture yet.
Trading around $2,226, Ethereum remains below the daily Supertrend at $2,492. The rejection near $2,409 shows sellers are still active.
Key levels to watch:
Support: $2,205
Major support: $2,172.85
Resistance: $2,275–$2,300
Next resistance: $2,409
Trend reversal zone: $2,492
Holding above $2,172 keeps room for another recovery attempt. A reclaim of $2,409 would be a stronger sign of buyers returning.
For now, ETH needs confirmation, not just a green candle.
#Write2Earn #ETH
Trading around $2,226, Ethereum remains below the daily Supertrend at $2,492. The rejection near $2,409 shows sellers are still active.
Key levels to watch:
Support: $2,205
Major support: $2,172.85
Resistance: $2,275–$2,300
Next resistance: $2,409
Trend reversal zone: $2,492
Holding above $2,172 keeps room for another recovery attempt. A reclaim of $2,409 would be a stronger sign of buyers returning.
For now, ETH needs confirmation, not just a green candle.
#Write2Earn #ETH
90

·
--
Bearish
#ETH
Ethereum prepares to overhaul its state structure with a Partitioned Binary Tree
Ethereum is getting ready to reorganize the data underneath it. The plan is EIP-8297, known as the Partitioned Binary Tree, or PBT.
The goals are smaller state proofs and a path to state expiry without taking the network offline.
The proposal recently passed a meaningful test. On October 29, 2026, PBT went live on a mainnet shadowfork called glamsterdam-pbt-1, run by ethPandaOps.
What the Partitioned Binary Tree actually changes
To understand the upgrade, start with Ethereum’s “state.” That is the full record of every account balance, every smart contract’s code, and every piece of data those contracts store.
Today, Ethereum organizes that record using a hexary Merkle Patricia Trie, or MPT.
EIP-8297 swaps that for a binary tree. Every branch splits in two, which makes the structure simpler to walk through and simpler to prove things about.
The proposal also folds three separate categories into one structure. Account headers, contract storage, and contract code would all live in a single binary tree.
The “partitioned” part refers to how keys get sorted. They are grouped into designated zones, which keeps related data closer together.
The design also drops RLP encoding, the serialization format Ethereum currently uses. Removing it addresses some of the proving headaches the existing setup creates.
The shadowfork test and the timeline
A shadowfork copies the real mainnet and runs it separately. It lets developers rehearse an upgrade against live conditions without putting actual funds at risk.
On glamsterdam-pbt-1, the switch to PBT went smoothly. Nodes running Besu, the client built by Consensys, rebuilt their state into the new format directly from their existing databases.#Write2Earn #Ethereum $ETH
{spot}(ETHUSDT)
#ETH
Ethereum prepares to overhaul its state structure with a Partitioned Binary Tree
Ethereum is getting ready to reorganize the data underneath it. The plan is EIP-8297, known as the Partitioned Binary Tree, or PBT.
The goals are smaller state proofs and a path to state expiry without taking the network offline.
The proposal recently passed a meaningful test. On October 29, 2026, PBT went live on a mainnet shadowfork called glamsterdam-pbt-1, run by ethPandaOps.
What the Partitioned Binary Tree actually changes
To understand the upgrade, start with Ethereum’s “state.” That is the full record of every account balance, every smart contract’s code, and every piece of data those contracts store.
Today, Ethereum organizes that record using a hexary Merkle Patricia Trie, or MPT.
EIP-8297 swaps that for a binary tree. Every branch splits in two, which makes the structure simpler to walk through and simpler to prove things about.
The proposal also folds three separate categories into one structure. Account headers, contract storage, and contract code would all live in a single binary tree.
The “partitioned” part refers to how keys get sorted. They are grouped into designated zones, which keeps related data closer together.
The design also drops RLP encoding, the serialization format Ethereum currently uses. Removing it addresses some of the proving headaches the existing setup creates.
The shadowfork test and the timeline
A shadowfork copies the real mainnet and runs it separately. It lets developers rehearse an upgrade against live conditions without putting actual funds at risk.
On glamsterdam-pbt-1, the switch to PBT went smoothly. Nodes running Besu, the client built by Consensys, rebuilt their state into the new format directly from their existing databases.#Write2Earn #Ethereum $ETH
Ethereum prepares to overhaul its state structure with a Partitioned Binary Tree
Ethereum is getting ready to reorganize the data underneath it. The plan is EIP-8297, known as the Partitioned Binary Tree, or PBT.
The goals are smaller state proofs and a path to state expiry without taking the network offline.
The proposal recently passed a meaningful test. On October 29, 2026, PBT went live on a mainnet shadowfork called glamsterdam-pbt-1, run by ethPandaOps.
What the Partitioned Binary Tree actually changes
To understand the upgrade, start with Ethereum’s “state.” That is the full record of every account balance, every smart contract’s code, and every piece of data those contracts store.
Today, Ethereum organizes that record using a hexary Merkle Patricia Trie, or MPT.
EIP-8297 swaps that for a binary tree. Every branch splits in two, which makes the structure simpler to walk through and simpler to prove things about.
The proposal also folds three separate categories into one structure. Account headers, contract storage, and contract code would all live in a single binary tree.
The “partitioned” part refers to how keys get sorted. They are grouped into designated zones, which keeps related data closer together.
The design also drops RLP encoding, the serialization format Ethereum currently uses. Removing it addresses some of the proving headaches the existing setup creates.
The shadowfork test and the timeline
A shadowfork copies the real mainnet and runs it separately. It lets developers rehearse an upgrade against live conditions without putting actual funds at risk.
On glamsterdam-pbt-1, the switch to PBT went smoothly. Nodes running Besu, the client built by Consensys, rebuilt their state into the new format directly from their existing databases.#Write2Earn #Ethereum $ETH

4
383


·
--
$ETH long — Reclaiming $2,287 for a push to $2,367 🚀
ETH is holding the immediate support at $2,139 after a pullback from the $2,450 region. A clean 4H close above the pivot level of $2,287 will confirm the short-term trend reversal and open the path toward the next major resistance zone.
Entry: 4H close above $2,287
SL: Below $2,139
Target 1: $2,367
Target 2: $2,450
If $2,139 breaks down, the setup is invalid — cut your losses.
$ETH
{future}(ETHUSDT)
DYOR. NFA.
#ETH #Ethereum #TradeIdea
$ETH long — Reclaiming $2,287 for a push to $2,367 🚀
ETH is holding the immediate support at $2,139 after a pullback from the $2,450 region. A clean 4H close above the pivot level of $2,287 will confirm the short-term trend reversal and open the path toward the next major resistance zone.
Entry: 4H close above $2,287
SL: Below $2,139
Target 1: $2,367
Target 2: $2,450
If $2,139 breaks down, the setup is invalid — cut your losses.
$ETH
DYOR. NFA.
#ETH #Ethereum #TradeIdea
ETH is holding the immediate support at $2,139 after a pullback from the $2,450 region. A clean 4H close above the pivot level of $2,287 will confirm the short-term trend reversal and open the path toward the next major resistance zone.
Entry: 4H close above $2,287
SL: Below $2,139
Target 1: $2,367
Target 2: $2,450
If $2,139 breaks down, the setup is invalid — cut your losses.
$ETH
DYOR. NFA.
#ETH #Ethereum #TradeIdea
41

🚨 BEARS PREPARE TO STRIKE AS $ETH FACES HEAVY RESISTANCE PRESSURE! 📉
Target: 2400 🎯
Stop Loss: 2560 ⚠️
Sellers are stepping up around this supply zone, taking control as momentum weakens and buy volume dries up. 📉 Notice how price action is struggling to reclaim higher ground, signaling smart money preparing for a pullback toward major support levels.
📊 With the current market structure breaking down, downside liquidity targets at 2400 and lower down to 1982 are coming into sharp focus. 🔍 Managing your risk closely remains critical as volatility expands. 💬 Are you taking short positioning here or waiting for a confirmation sweep? 👇
⚠️ Not financial advice. Always manage your risk. 🛡️
🏷️ #ETH #ShortSetup #Ethereum #Bearish #Crypto
🐻 📉
🚨 BEARS PREPARE TO STRIKE AS $ETH FACES HEAVY RESISTANCE PRESSURE! 📉
Target: 2400 🎯
Stop Loss: 2560 ⚠️
Sellers are stepping up around this supply zone, taking control as momentum weakens and buy volume dries up. 📉 Notice how price action is struggling to reclaim higher ground, signaling smart money preparing for a pullback toward major support levels.
📊 With the current market structure breaking down, downside liquidity targets at 2400 and lower down to 1982 are coming into sharp focus. 🔍 Managing your risk closely remains critical as volatility expands. 💬 Are you taking short positioning here or waiting for a confirmation sweep? 👇
⚠️ Not financial advice. Always manage your risk. 🛡️
🏷️ #ETH #ShortSetup #Ethereum #Bearish #Crypto
🐻 📉
Target: 2400 🎯
Stop Loss: 2560 ⚠️
Sellers are stepping up around this supply zone, taking control as momentum weakens and buy volume dries up. 📉 Notice how price action is struggling to reclaim higher ground, signaling smart money preparing for a pullback toward major support levels.
📊 With the current market structure breaking down, downside liquidity targets at 2400 and lower down to 1982 are coming into sharp focus. 🔍 Managing your risk closely remains critical as volatility expands. 💬 Are you taking short positioning here or waiting for a confirmation sweep? 👇
⚠️ Not financial advice. Always manage your risk. 🛡️
🏷️ #ETH #ShortSetup #Ethereum #Bearish #Crypto
🐻 📉
4

·
--
Bearish
Guys Wait..Wait..
$ETH Could Be Preparing For A Recovery Bounce…!!
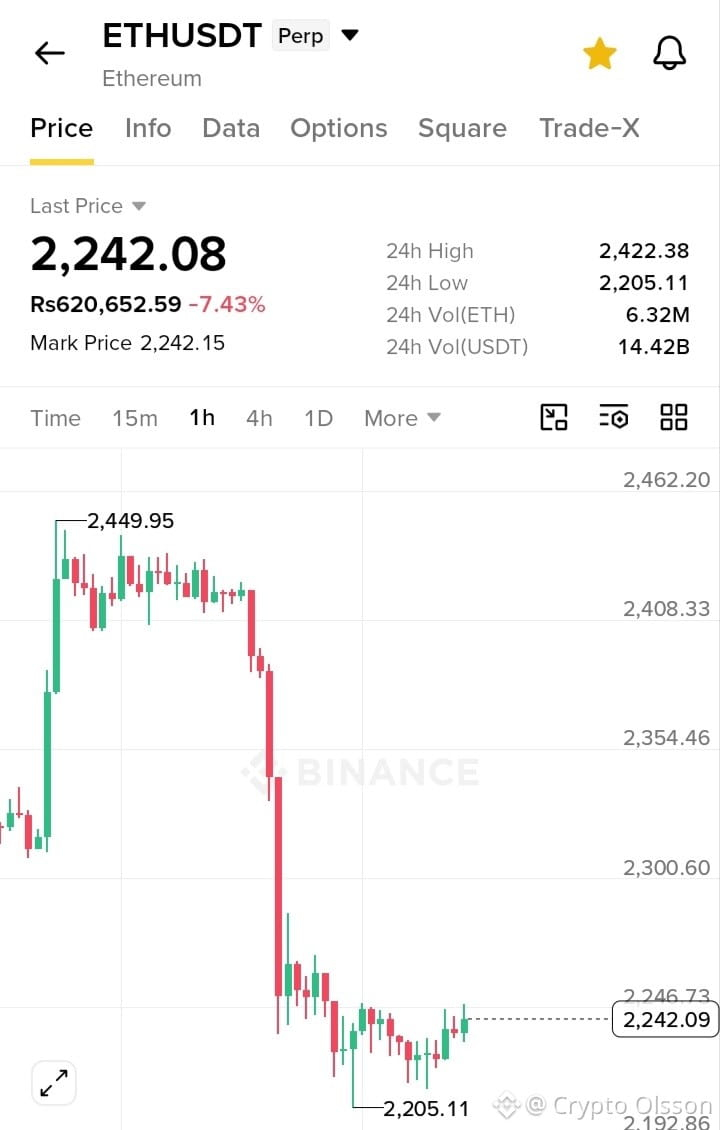
Trade Setup: Long
Entry Zone: $2,225 – $2,245
Tp1: $2,275 Tp2: $2,315 Tp3: $2,355
SL: $2,195
#ETH is trading near a critical support area after a sharp decline. A successful hold above $2,205 could trigger a relief bounce toward the upside targets, while losing this support may invite further selling pressure. Watch for confirmation before entering.
Trade Here On $ETH 👇.
{future}(ETHUSDT)
$SOL
{future}(SOLUSDT)
Guys Wait..Wait..
$ETH Could Be Preparing For A Recovery Bounce…!!
Trade Setup: Long
Entry Zone: $2,225 – $2,245
Tp1: $2,275 Tp2: $2,315 Tp3: $2,355
SL: $2,195
#ETH is trading near a critical support area after a sharp decline. A successful hold above $2,205 could trigger a relief bounce toward the upside targets, while losing this support may invite further selling pressure. Watch for confirmation before entering.
Trade Here On $ETH 👇.
$SOL
$ETH Could Be Preparing For A Recovery Bounce…!!
Trade Setup: Long
Entry Zone: $2,225 – $2,245
Tp1: $2,275 Tp2: $2,315 Tp3: $2,355
SL: $2,195
#ETH is trading near a critical support area after a sharp decline. A successful hold above $2,205 could trigger a relief bounce toward the upside targets, while losing this support may invite further selling pressure. Watch for confirmation before entering.
Trade Here On $ETH 👇.
$SOL
1
50

·
--
🚨 ETH/USDT: Crucial Support Test Underway! Key Levels to Watch 📉 Target & Recovery Zones 📊⛔️
⛔️Ethereum ($ETH) is showing heightened volatility after facing resistance at $2,251. After dipping to $2,210, bulls managed a swift bounce back toward $2,230, keeping the short-term battle‼️📉
👉🏻 KEY LEVEL TO WATCH ‼️
🟢 Bullish Breakout Target:
To delay further crash we need a resistance from $2255 to$2275 which can temporarily stable it
🔻 Bearish Downside Risk:
Losing $2,205 will likely accelerate sell pressure down toward $2,170 support.
⚠️ Critical Support Level: $2,205
We took a bounce from $2205,if market take another dip and break the $2205 and didnt recover for 30 min . This will indicate clear downside moment ‼️
👉🏻 only for education purpose. Not a financial advise ❌
#ETH #MarketUpdates #BinanceFeed #CryptoAnalysis #Trading
🚨 ETH/USDT: Crucial Support Test Underway! Key Levels to Watch 📉 Target & Recovery Zones 📊⛔️
⛔️Ethereum ($ETH) is showing heightened volatility after facing resistance at $2,251. After dipping to $2,210, bulls managed a swift bounce back toward $2,230, keeping the short-term battle‼️📉
👉🏻 KEY LEVEL TO WATCH ‼️
🟢 Bullish Breakout Target:
To delay further crash we need a resistance from $2255 to$2275 which can temporarily stable it
🔻 Bearish Downside Risk:
Losing $2,205 will likely accelerate sell pressure down toward $2,170 support.
⚠️ Critical Support Level: $2,205
We took a bounce from $2205,if market take another dip and break the $2205 and didnt recover for 30 min . This will indicate clear downside moment ‼️
👉🏻 only for education purpose. Not a financial advise ❌
#ETH #MarketUpdates #BinanceFeed #CryptoAnalysis #Trading
⛔️Ethereum ($ETH) is showing heightened volatility after facing resistance at $2,251. After dipping to $2,210, bulls managed a swift bounce back toward $2,230, keeping the short-term battle‼️📉
👉🏻 KEY LEVEL TO WATCH ‼️
🟢 Bullish Breakout Target:
To delay further crash we need a resistance from $2255 to$2275 which can temporarily stable it
🔻 Bearish Downside Risk:
Losing $2,205 will likely accelerate sell pressure down toward $2,170 support.
⚠️ Critical Support Level: $2,205
We took a bounce from $2205,if market take another dip and break the $2205 and didnt recover for 30 min . This will indicate clear downside moment ‼️
👉🏻 only for education purpose. Not a financial advise ❌
#ETH #MarketUpdates #BinanceFeed #CryptoAnalysis #Trading

1
64

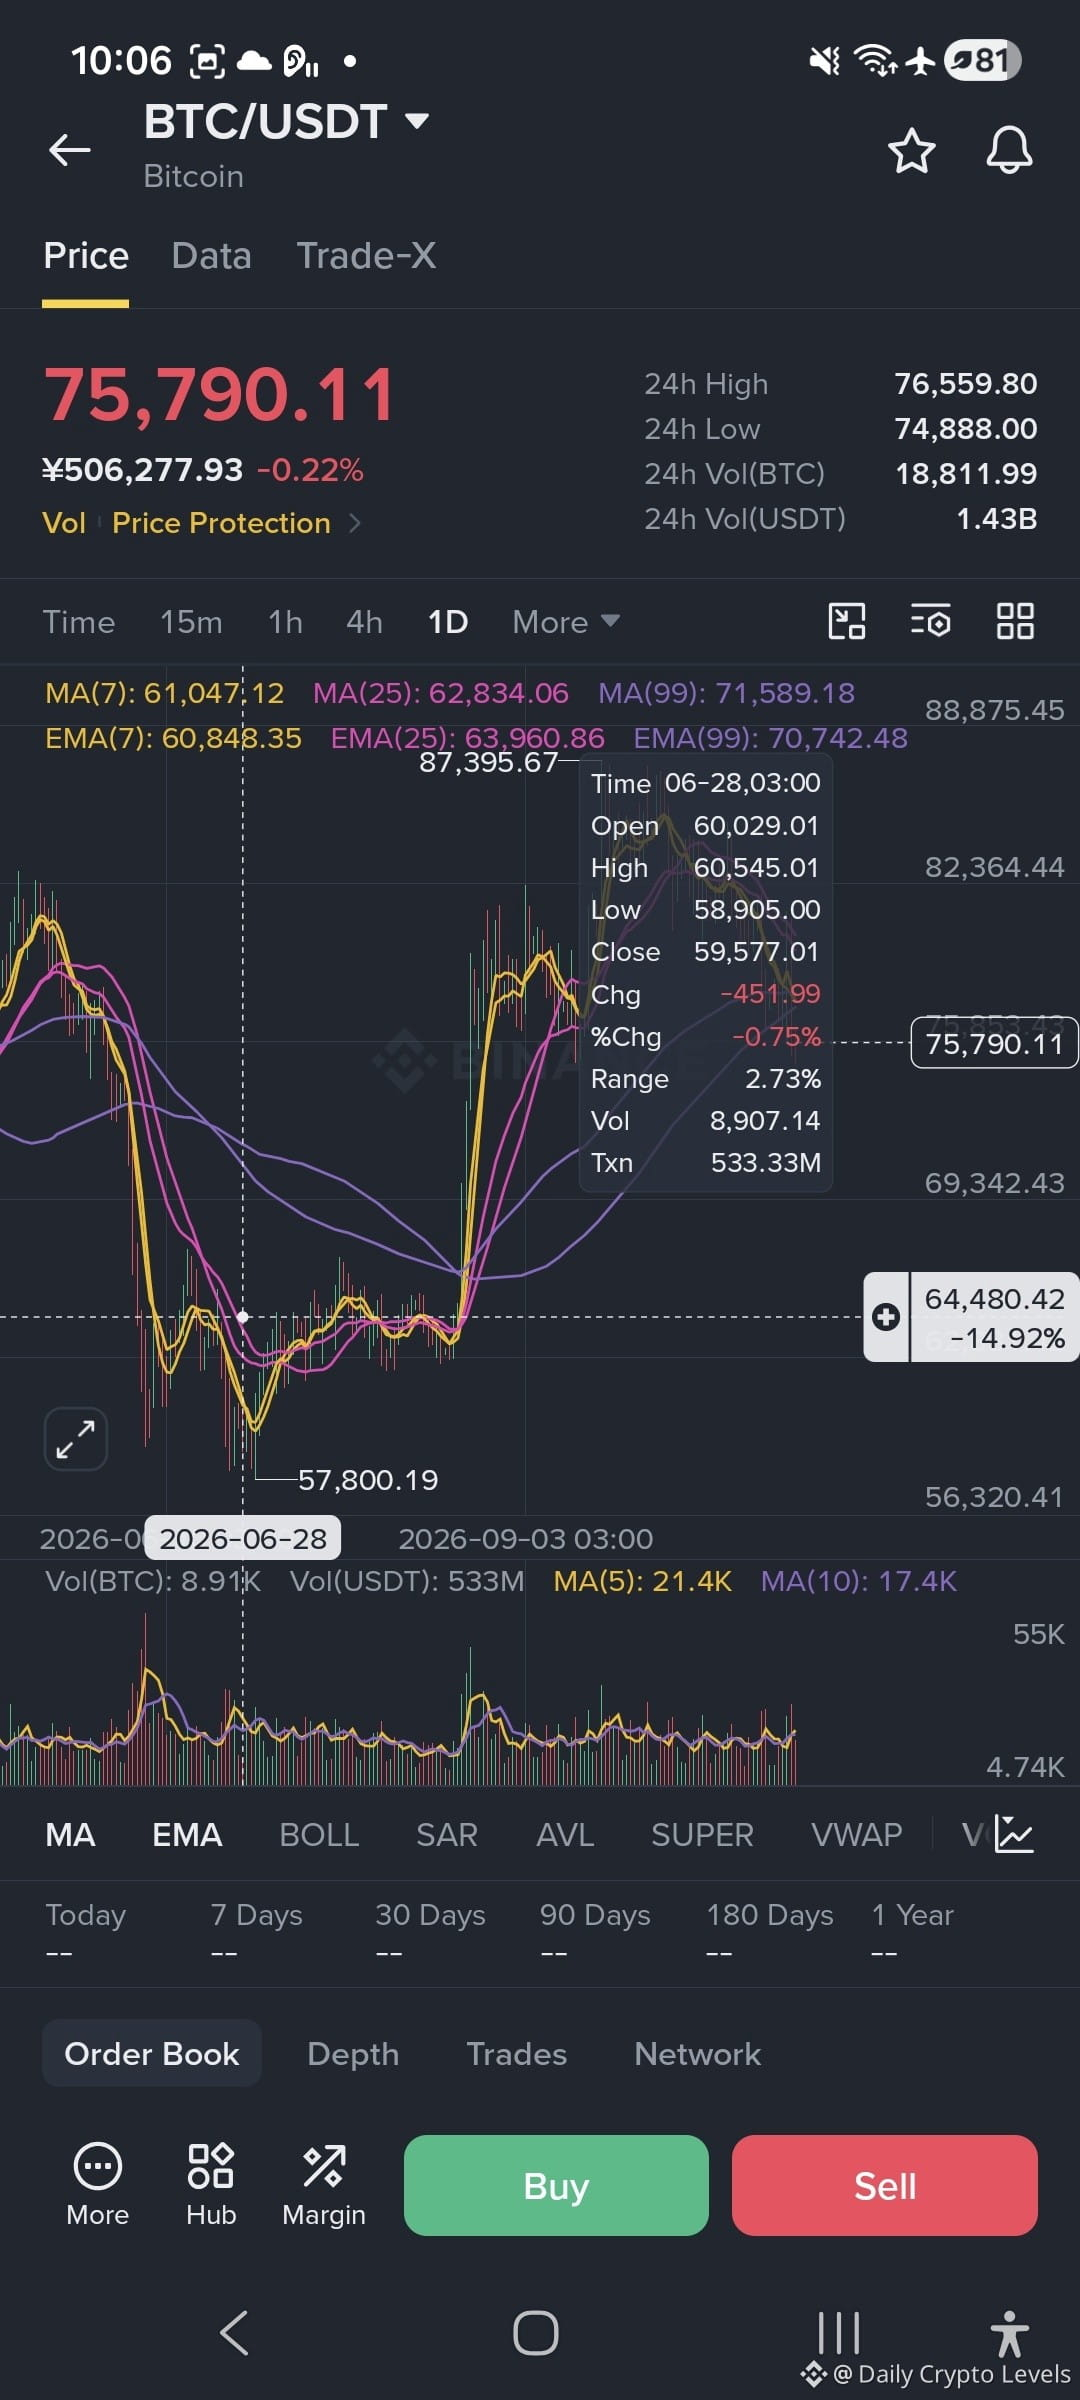
Tap the live $BTC and $ETH widgets below to analyze open positions.
🌐 Macro Parameters
The October US jobs report showed nonfarm payrolls rising by 165,000, well above forecasts of roughly 59,000 to 65,000. Unemployment fell to 4.1% from 4.2%, while monthly wages increased 0.4%.
The Fed held rates at 3.75% to 4.00% on October 28, 2026. Strong employment data has shifted expectations, with futures markets pricing roughly a 77% to 80% chance of a 25 basis point Fed hike at the December 9, 2026 meeting.
📊 Market Structure
$BTC trades at $75,711.76, down 0.60% over 24 hours and 2.20% over 7 days, with a 24-hour range of $74,921.12 to $76,892.13. Despite recovering the $76,000 area after this week's tech-stock rout, US spot Bitcoin ETFs shed roughly $430 million.
$ETH trades at $2,223.02, down 1.30% over 24 hours but up 0.40% over 7 days. Its 24-hour range stands at $2,208.54 to $2,265.81, reflecting a mixed short-term picture.
💧 Allocation Framework
The combination of stronger employment data and rising Fed hike expectations creates a challenging macro backdrop for risk assets. ETF outflows also remain an important factor when assessing institutional demand for $BTC.
Traders may watch employment-driven rate expectations, ETF flow trends, and key price levels across $BTC and $ETH. Whether conditions shift toward risk-on or risk-off will depend on how these factors develop, with neither outcome guaranteed.
━━━━━━━━━━━━━━
💬 Risk-on or risk-off?
#BTC #ETH #Crypto #BinanceSquare
Tap the live $BTC and $ETH widgets below to analyze open positions.
🌐 Macro Parameters
The October US jobs report showed nonfarm payrolls rising by 165,000, well above forecasts of roughly 59,000 to 65,000. Unemployment fell to 4.1% from 4.2%, while monthly wages increased 0.4%.
The Fed held rates at 3.75% to 4.00% on October 28, 2026. Strong employment data has shifted expectations, with futures markets pricing roughly a 77% to 80% chance of a 25 basis point Fed hike at the December 9, 2026 meeting.
📊 Market Structure
$BTC trades at $75,711.76, down 0.60% over 24 hours and 2.20% over 7 days, with a 24-hour range of $74,921.12 to $76,892.13. Despite recovering the $76,000 area after this week's tech-stock rout, US spot Bitcoin ETFs shed roughly $430 million.
$ETH trades at $2,223.02, down 1.30% over 24 hours but up 0.40% over 7 days. Its 24-hour range stands at $2,208.54 to $2,265.81, reflecting a mixed short-term picture.
💧 Allocation Framework
The combination of stronger employment data and rising Fed hike expectations creates a challenging macro backdrop for risk assets. ETF outflows also remain an important factor when assessing institutional demand for $BTC.
Traders may watch employment-driven rate expectations, ETF flow trends, and key price levels across $BTC and $ETH. Whether conditions shift toward risk-on or risk-off will depend on how these factors develop, with neither outcome guaranteed.
━━━━━━━━━━━━━━
💬 Risk-on or risk-off?
#BTC #ETH #Crypto #BinanceSquare
🌐 Macro Parameters
The October US jobs report showed nonfarm payrolls rising by 165,000, well above forecasts of roughly 59,000 to 65,000. Unemployment fell to 4.1% from 4.2%, while monthly wages increased 0.4%.
The Fed held rates at 3.75% to 4.00% on October 28, 2026. Strong employment data has shifted expectations, with futures markets pricing roughly a 77% to 80% chance of a 25 basis point Fed hike at the December 9, 2026 meeting.
📊 Market Structure
$BTC trades at $75,711.76, down 0.60% over 24 hours and 2.20% over 7 days, with a 24-hour range of $74,921.12 to $76,892.13. Despite recovering the $76,000 area after this week's tech-stock rout, US spot Bitcoin ETFs shed roughly $430 million.
$ETH trades at $2,223.02, down 1.30% over 24 hours but up 0.40% over 7 days. Its 24-hour range stands at $2,208.54 to $2,265.81, reflecting a mixed short-term picture.
💧 Allocation Framework
The combination of stronger employment data and rising Fed hike expectations creates a challenging macro backdrop for risk assets. ETF outflows also remain an important factor when assessing institutional demand for $BTC.
Traders may watch employment-driven rate expectations, ETF flow trends, and key price levels across $BTC and $ETH. Whether conditions shift toward risk-on or risk-off will depend on how these factors develop, with neither outcome guaranteed.
━━━━━━━━━━━━━━
💬 Risk-on or risk-off?
#BTC #ETH #Crypto #BinanceSquare
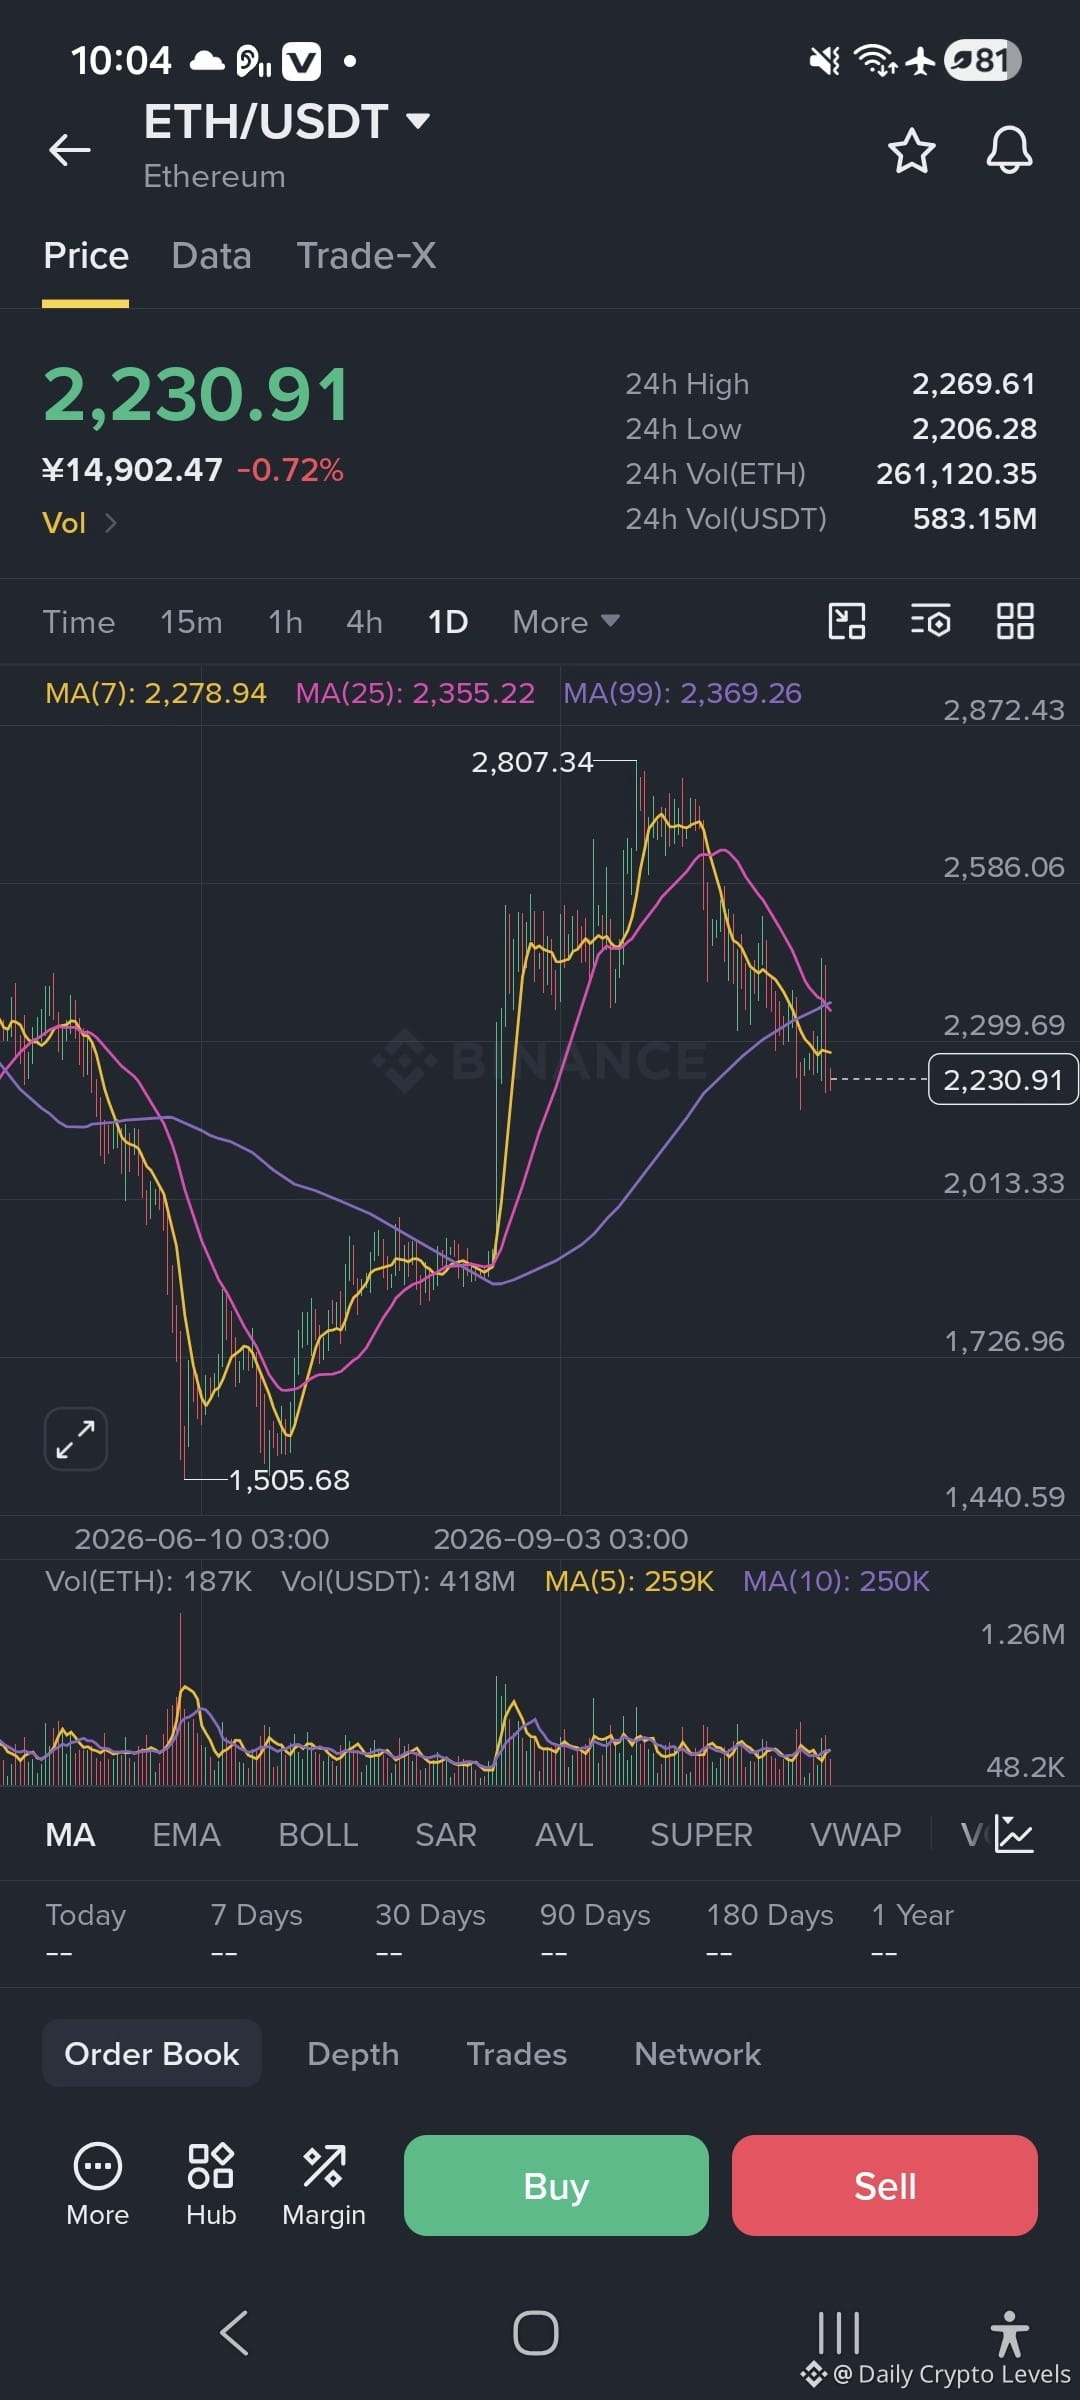
2
193

·
--
Bearish
📊 ETH/USDT – 15-Minute Technical Analysis
Ethereum is currently trading around $2,224.09, down approximately 0.97% over the last 24 hours. The 15-minute chart shows continued bearish pressure, with sellers maintaining control of the short-term trend.
🔴 Technical Overview:
Price is trading below MA(7), MA(25), and MA(99), indicating bearish momentum.
EMA indicators also suggest continued downside pressure.
MACD remains in negative territory, showing weakness in buying momentum.
RSI-style momentum indicators are not showing a strong bullish recovery yet.
The Supertrend and SAR indicators are also signaling a bearish market structure.
📉 Key Support Levels:
$2,219 – Immediate support
$2,216 – Important short-term support
$2,206 – Stronger support zone
📈 Key Resistance Levels:
$2,230 – First resistance
$2,238 – Important resistance
$2,242 – Potential breakout level
🔍 Market Outlook:
As long as ETH remains below the $2,230–$2,238 resistance zone, bearish pressure may continue. A breakdown below $2,216 could open the door for another move toward $2,206.
However, if buyers regain control and push the price above $2,238, a short-term recovery toward higher resistance levels could develop.
Conclusion: ETH is showing a bearish short-term structure. Traders should watch the key support and resistance levels carefully and wait for confirmation before making decisions.
⚠️ Trade carefully and always manage your risk.
#ETH #Ethereum #ETHUSDT #CryptoAnalysis #TechnicalAnalysis #Binance
#ETH $ETH
{future}(ETHUSDT)
📊 ETH/USDT – 15-Minute Technical Analysis
Ethereum is currently trading around $2,224.09, down approximately 0.97% over the last 24 hours. The 15-minute chart shows continued bearish pressure, with sellers maintaining control of the short-term trend.
🔴 Technical Overview:
Price is trading below MA(7), MA(25), and MA(99), indicating bearish momentum.
EMA indicators also suggest continued downside pressure.
MACD remains in negative territory, showing weakness in buying momentum.
RSI-style momentum indicators are not showing a strong bullish recovery yet.
The Supertrend and SAR indicators are also signaling a bearish market structure.
📉 Key Support Levels:
$2,219 – Immediate support
$2,216 – Important short-term support
$2,206 – Stronger support zone
📈 Key Resistance Levels:
$2,230 – First resistance
$2,238 – Important resistance
$2,242 – Potential breakout level
🔍 Market Outlook:
As long as ETH remains below the $2,230–$2,238 resistance zone, bearish pressure may continue. A breakdown below $2,216 could open the door for another move toward $2,206.
However, if buyers regain control and push the price above $2,238, a short-term recovery toward higher resistance levels could develop.
Conclusion: ETH is showing a bearish short-term structure. Traders should watch the key support and resistance levels carefully and wait for confirmation before making decisions.
⚠️ Trade carefully and always manage your risk.
#ETH #Ethereum #ETHUSDT #CryptoAnalysis #TechnicalAnalysis #Binance
#ETH $ETH
Ethereum is currently trading around $2,224.09, down approximately 0.97% over the last 24 hours. The 15-minute chart shows continued bearish pressure, with sellers maintaining control of the short-term trend.
🔴 Technical Overview:
Price is trading below MA(7), MA(25), and MA(99), indicating bearish momentum.
EMA indicators also suggest continued downside pressure.
MACD remains in negative territory, showing weakness in buying momentum.
RSI-style momentum indicators are not showing a strong bullish recovery yet.
The Supertrend and SAR indicators are also signaling a bearish market structure.
📉 Key Support Levels:
$2,219 – Immediate support
$2,216 – Important short-term support
$2,206 – Stronger support zone
📈 Key Resistance Levels:
$2,230 – First resistance
$2,238 – Important resistance
$2,242 – Potential breakout level
🔍 Market Outlook:
As long as ETH remains below the $2,230–$2,238 resistance zone, bearish pressure may continue. A breakdown below $2,216 could open the door for another move toward $2,206.
However, if buyers regain control and push the price above $2,238, a short-term recovery toward higher resistance levels could develop.
Conclusion: ETH is showing a bearish short-term structure. Traders should watch the key support and resistance levels carefully and wait for confirmation before making decisions.
⚠️ Trade carefully and always manage your risk.
#ETH #Ethereum #ETHUSDT #CryptoAnalysis #TechnicalAnalysis #Binance
#ETH $ETH
166

·
--
Bearish
ETHEREUM FACES A MAKE-OR-BREAK MOMENT!
$ETH is trading at $2,224.45 (Rs615,060.42), down 2.15%. Selling pressure is increasing, and Ethereum is approaching an important support zone. Can buyers defend the level that has held over the past 2–3 weeks?
If support survives, ETH could lead a recovery. If it breaks, further downside is possible.
Support holds = recovery opportunity. Support breaks = stay defensive.
#Binance #crypto #ETH #kingbro1
#Write2Earn
ETHEREUM FACES A MAKE-OR-BREAK MOMENT!
$ETH is trading at $2,224.45 (Rs615,060.42), down 2.15%. Selling pressure is increasing, and Ethereum is approaching an important support zone. Can buyers defend the level that has held over the past 2–3 weeks?
If support survives, ETH could lead a recovery. If it breaks, further downside is possible.
Support holds = recovery opportunity. Support breaks = stay defensive.
#Binance #crypto #ETH #kingbro1
#Write2Earn
$ETH is trading at $2,224.45 (Rs615,060.42), down 2.15%. Selling pressure is increasing, and Ethereum is approaching an important support zone. Can buyers defend the level that has held over the past 2–3 weeks?
If support survives, ETH could lead a recovery. If it breaks, further downside is possible.
Support holds = recovery opportunity. Support breaks = stay defensive.
#Binance #crypto #ETH #kingbro1
#Write2Earn
2
248

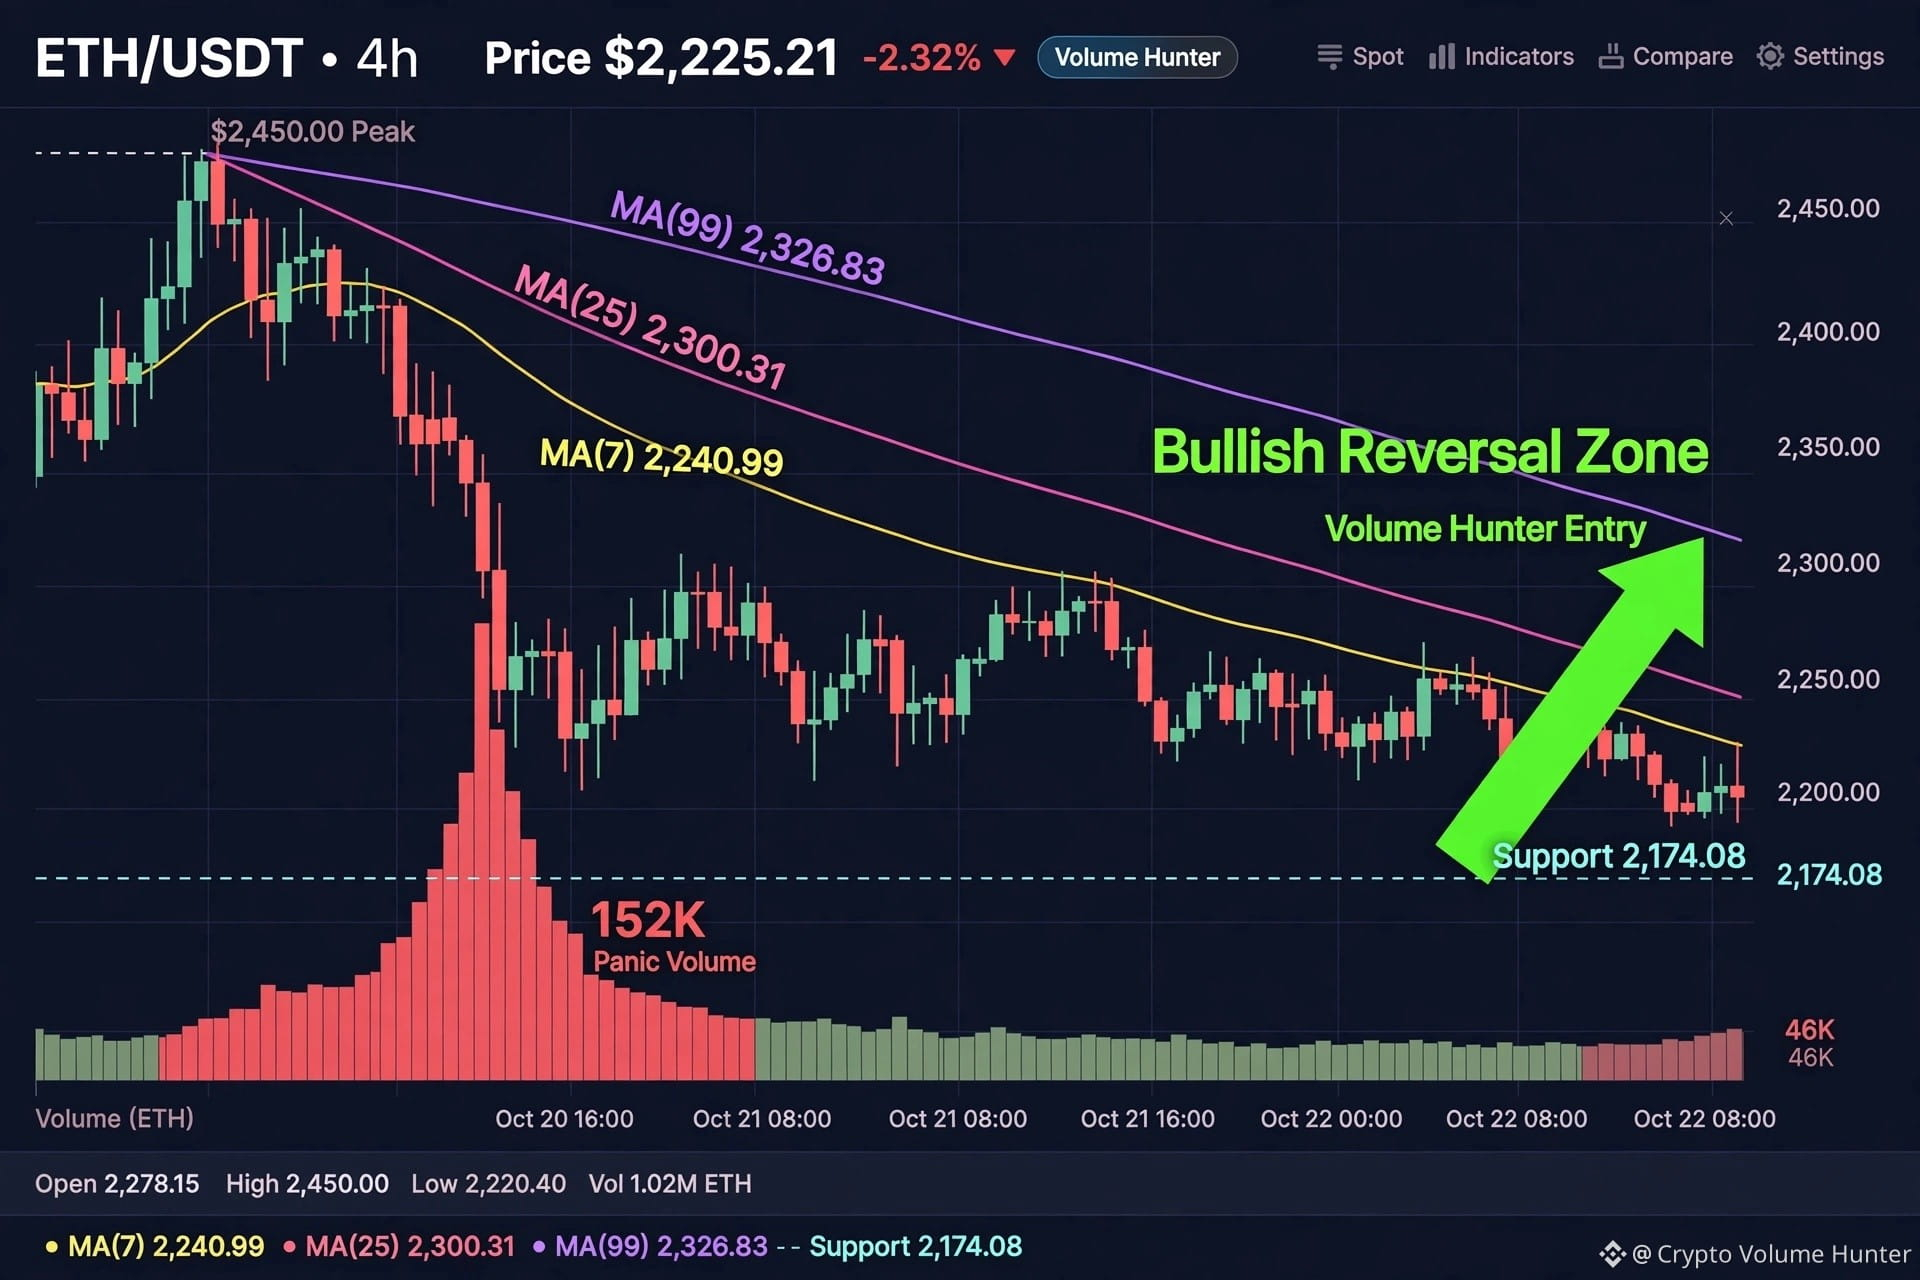
> $ETH Selling Exhaustion? 📉 $2,450 Crash to $2,225 but Volume Dropped to 46K from 152K! MA(99) 2,326 resistance now. No sellers left? Is $2,174 the FINAL bottom? Volume Hunter says watch! #ETH $ETH
> $ETH Selling Exhaustion? 📉 $2,450 Crash to $2,225 but Volume Dropped to 46K from 152K! MA(99) 2,326 resistance now. No sellers left? Is $2,174 the FINAL bottom? Volume Hunter says watch! #ETH $ETH
1
1
81

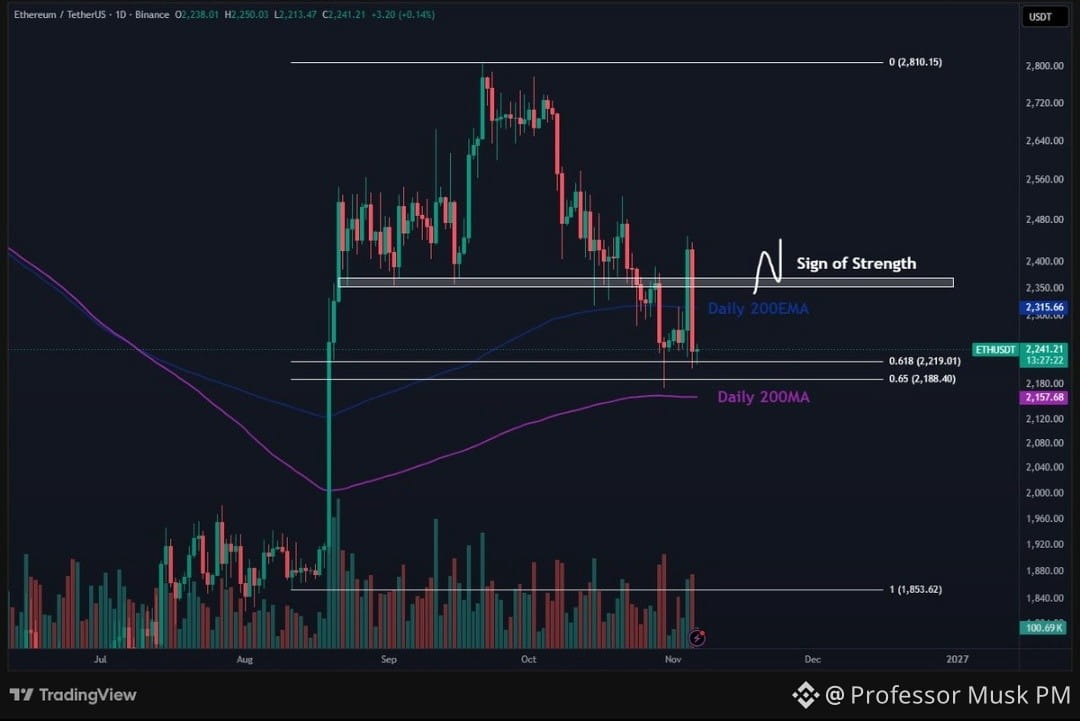
$ETH Currently caught in between some big levels.
Right on the big .618 Fibonacci retracement level and the Daily 200MA.
But the Daily 200EMA and $2350 horizontal area have been causing trouble.
You'd want to see a move back above $2350 for a proper sign of strength that the bullish momentum is back. Below, that ~$2150 level is key otherwise this just keeps bleeding lower and starts giving back a lot of that breakout candle.
Would recommend to play this level by level to not get chopped up in the middle.
#ETH #DYOR
{future}(ETHUSDT)
$ETH Currently caught in between some big levels.
Right on the big .618 Fibonacci retracement level and the Daily 200MA.
But the Daily 200EMA and $2350 horizontal area have been causing trouble.
You'd want to see a move back above $2350 for a proper sign of strength that the bullish momentum is back. Below, that ~$2150 level is key otherwise this just keeps bleeding lower and starts giving back a lot of that breakout candle.
Would recommend to play this level by level to not get chopped up in the middle.
#ETH #DYOR
Right on the big .618 Fibonacci retracement level and the Daily 200MA.
But the Daily 200EMA and $2350 horizontal area have been causing trouble.
You'd want to see a move back above $2350 for a proper sign of strength that the bullish momentum is back. Below, that ~$2150 level is key otherwise this just keeps bleeding lower and starts giving back a lot of that breakout candle.
Would recommend to play this level by level to not get chopped up in the middle.
#ETH #DYOR
1
74
🦈 SURPRISING DIVERGENCE: $ETH DERIVATIVES FLIP BULLISH WHILE SPOT DIPS BELOW $BTC ! ⚡
While $BTC sits calm in neutral territory around 0.0097% funding, the perpetual market is telling a fascinating story on $ETH . 📊 Despite taking a deeper spot haircut, Ethereum funding rates pushed up to 0.0123%, crossing the 0.01% baseline into clear long-bias territory.
Derivatives traders are actively absorbing the spot drop, bidding up leverage contracts while weak hands get flushed out. 🦈 This growing leverage conviction during a price pullback often signals smart money positioning before a momentum reversal.
💡 When perpetual positioning diverges this sharply from spot price action, volatility usually follows fast. 💬 Are you siding with the aggressive futures longs on Ethereum or waiting for spot buyers to confirm the bid? 👇
⚠️ Not financial advice. Always manage your risk. 🛡️
🏷️ #ETH #BTC #Futures #MarketInsight #Crypto
⚡ 💎
🦈 SURPRISING DIVERGENCE: $ETH DERIVATIVES FLIP BULLISH WHILE SPOT DIPS BELOW $BTC ! ⚡
While $BTC sits calm in neutral territory around 0.0097% funding, the perpetual market is telling a fascinating story on $ETH . 📊 Despite taking a deeper spot haircut, Ethereum funding rates pushed up to 0.0123%, crossing the 0.01% baseline into clear long-bias territory.
Derivatives traders are actively absorbing the spot drop, bidding up leverage contracts while weak hands get flushed out. 🦈 This growing leverage conviction during a price pullback often signals smart money positioning before a momentum reversal.
💡 When perpetual positioning diverges this sharply from spot price action, volatility usually follows fast. 💬 Are you siding with the aggressive futures longs on Ethereum or waiting for spot buyers to confirm the bid? 👇
⚠️ Not financial advice. Always manage your risk. 🛡️
🏷️ #ETH #BTC #Futures #MarketInsight #Crypto
⚡ 💎
While $BTC sits calm in neutral territory around 0.0097% funding, the perpetual market is telling a fascinating story on $ETH . 📊 Despite taking a deeper spot haircut, Ethereum funding rates pushed up to 0.0123%, crossing the 0.01% baseline into clear long-bias territory.
Derivatives traders are actively absorbing the spot drop, bidding up leverage contracts while weak hands get flushed out. 🦈 This growing leverage conviction during a price pullback often signals smart money positioning before a momentum reversal.
💡 When perpetual positioning diverges this sharply from spot price action, volatility usually follows fast. 💬 Are you siding with the aggressive futures longs on Ethereum or waiting for spot buyers to confirm the bid? 👇
⚠️ Not financial advice. Always manage your risk. 🛡️
🏷️ #ETH #BTC #Futures #MarketInsight #Crypto
⚡ 💎
4

🚨 INSTITUTIONAL WHALE FLUSHES $116M IN $ETH AND $SOL ONTO EXCHANGES! 🔻
🦈 Wintermute just transferred $65M in $ETH and $51M in $SOL directly into top-tier exchange wallets over the past 12 hours. We already saw $ETH take an immediate 4% hit as market makers weaponized thin weekend order books to trigger forced liquidations. 📉
📌 When tens of millions in $SOL land on exchange reserves alongside heavy $ETH deposits, smart money rarely sends funds to sit idle. They are orchestrating liquidity sweeps and testing market depth before the weekly close. 📊
💬 Is smart money setting up a weekend bear trap, or are you preparing to bid the bottom of this flush? 👇
⚠️ Not financial advice. Always manage your risk. 🛡️
🏷️ #ETH #SOL #SmartMoney #Crypto #WhaleAlert
🦈 👁️
🚨 INSTITUTIONAL WHALE FLUSHES $116M IN $ETH AND $SOL ONTO EXCHANGES! 🔻
🦈 Wintermute just transferred $65M in $ETH and $51M in $SOL directly into top-tier exchange wallets over the past 12 hours. We already saw $ETH take an immediate 4% hit as market makers weaponized thin weekend order books to trigger forced liquidations. 📉
📌 When tens of millions in $SOL land on exchange reserves alongside heavy $ETH deposits, smart money rarely sends funds to sit idle. They are orchestrating liquidity sweeps and testing market depth before the weekly close. 📊
💬 Is smart money setting up a weekend bear trap, or are you preparing to bid the bottom of this flush? 👇
⚠️ Not financial advice. Always manage your risk. 🛡️
🏷️ #ETH #SOL #SmartMoney #Crypto #WhaleAlert
🦈 👁️
🦈 Wintermute just transferred $65M in $ETH and $51M in $SOL directly into top-tier exchange wallets over the past 12 hours. We already saw $ETH take an immediate 4% hit as market makers weaponized thin weekend order books to trigger forced liquidations. 📉
📌 When tens of millions in $SOL land on exchange reserves alongside heavy $ETH deposits, smart money rarely sends funds to sit idle. They are orchestrating liquidity sweeps and testing market depth before the weekly close. 📊
💬 Is smart money setting up a weekend bear trap, or are you preparing to bid the bottom of this flush? 👇
⚠️ Not financial advice. Always manage your risk. 🛡️
🏷️ #ETH #SOL #SmartMoney #Crypto #WhaleAlert
🦈 👁️
2

🚨 $ETH BULLS TRAPPED AS LIQUIDITY SWEEP AT 2434 REJECTS HARD! 📉
Entry: 2405 - 2430 ⚡
Target: 2375 / 2300 / 2200 📉
Stop Loss: 2455 ⚠️
$ETH just flushed aggressive buyers after sweeping liquidity above 2434, leaving late breakout traders hanging. 📊 Open interest is actively bleeding while retail long positioning swells, revealing a textbook trap where traders are paying inflated funding rates to hold underwater positions.
With 1H volatility expanding out of tight compression, sellers are positioned to push price down into lower demand zones. 🔍 A sustained reclaim above 2455 invalidates this thesis, but until then, downside momentum remains in firm control.
💬 Are you positioning for the breakdown or hunting for a bid near 2200? 👇
⚠️ Not financial advice. Always manage your risk. 🛡️
🏷️ #ETH #ShortSetup #Ethereum #Trading #Crypto
🐻 🩸
🚨 $ETH BULLS TRAPPED AS LIQUIDITY SWEEP AT 2434 REJECTS HARD! 📉
Entry: 2405 - 2430 ⚡
Target: 2375 / 2300 / 2200 📉
Stop Loss: 2455 ⚠️
$ETH just flushed aggressive buyers after sweeping liquidity above 2434, leaving late breakout traders hanging. 📊 Open interest is actively bleeding while retail long positioning swells, revealing a textbook trap where traders are paying inflated funding rates to hold underwater positions.
With 1H volatility expanding out of tight compression, sellers are positioned to push price down into lower demand zones. 🔍 A sustained reclaim above 2455 invalidates this thesis, but until then, downside momentum remains in firm control.
💬 Are you positioning for the breakdown or hunting for a bid near 2200? 👇
⚠️ Not financial advice. Always manage your risk. 🛡️
🏷️ #ETH #ShortSetup #Ethereum #Trading #Crypto
🐻 🩸
Entry: 2405 - 2430 ⚡
Target: 2375 / 2300 / 2200 📉
Stop Loss: 2455 ⚠️
$ETH just flushed aggressive buyers after sweeping liquidity above 2434, leaving late breakout traders hanging. 📊 Open interest is actively bleeding while retail long positioning swells, revealing a textbook trap where traders are paying inflated funding rates to hold underwater positions.
With 1H volatility expanding out of tight compression, sellers are positioned to push price down into lower demand zones. 🔍 A sustained reclaim above 2455 invalidates this thesis, but until then, downside momentum remains in firm control.
💬 Are you positioning for the breakdown or hunting for a bid near 2200? 👇
⚠️ Not financial advice. Always manage your risk. 🛡️
🏷️ #ETH #ShortSetup #Ethereum #Trading #Crypto
🐻 🩸
44

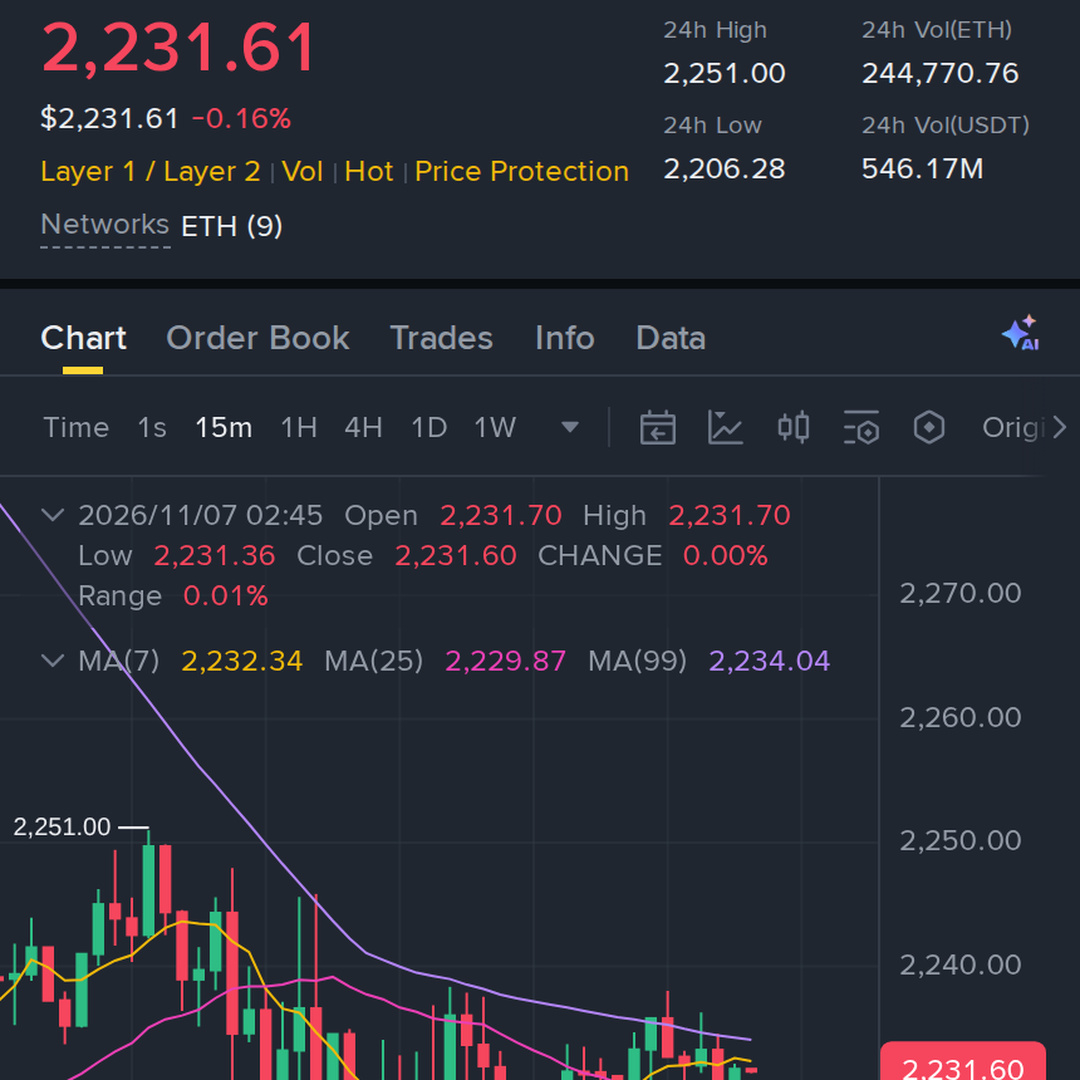

·
--
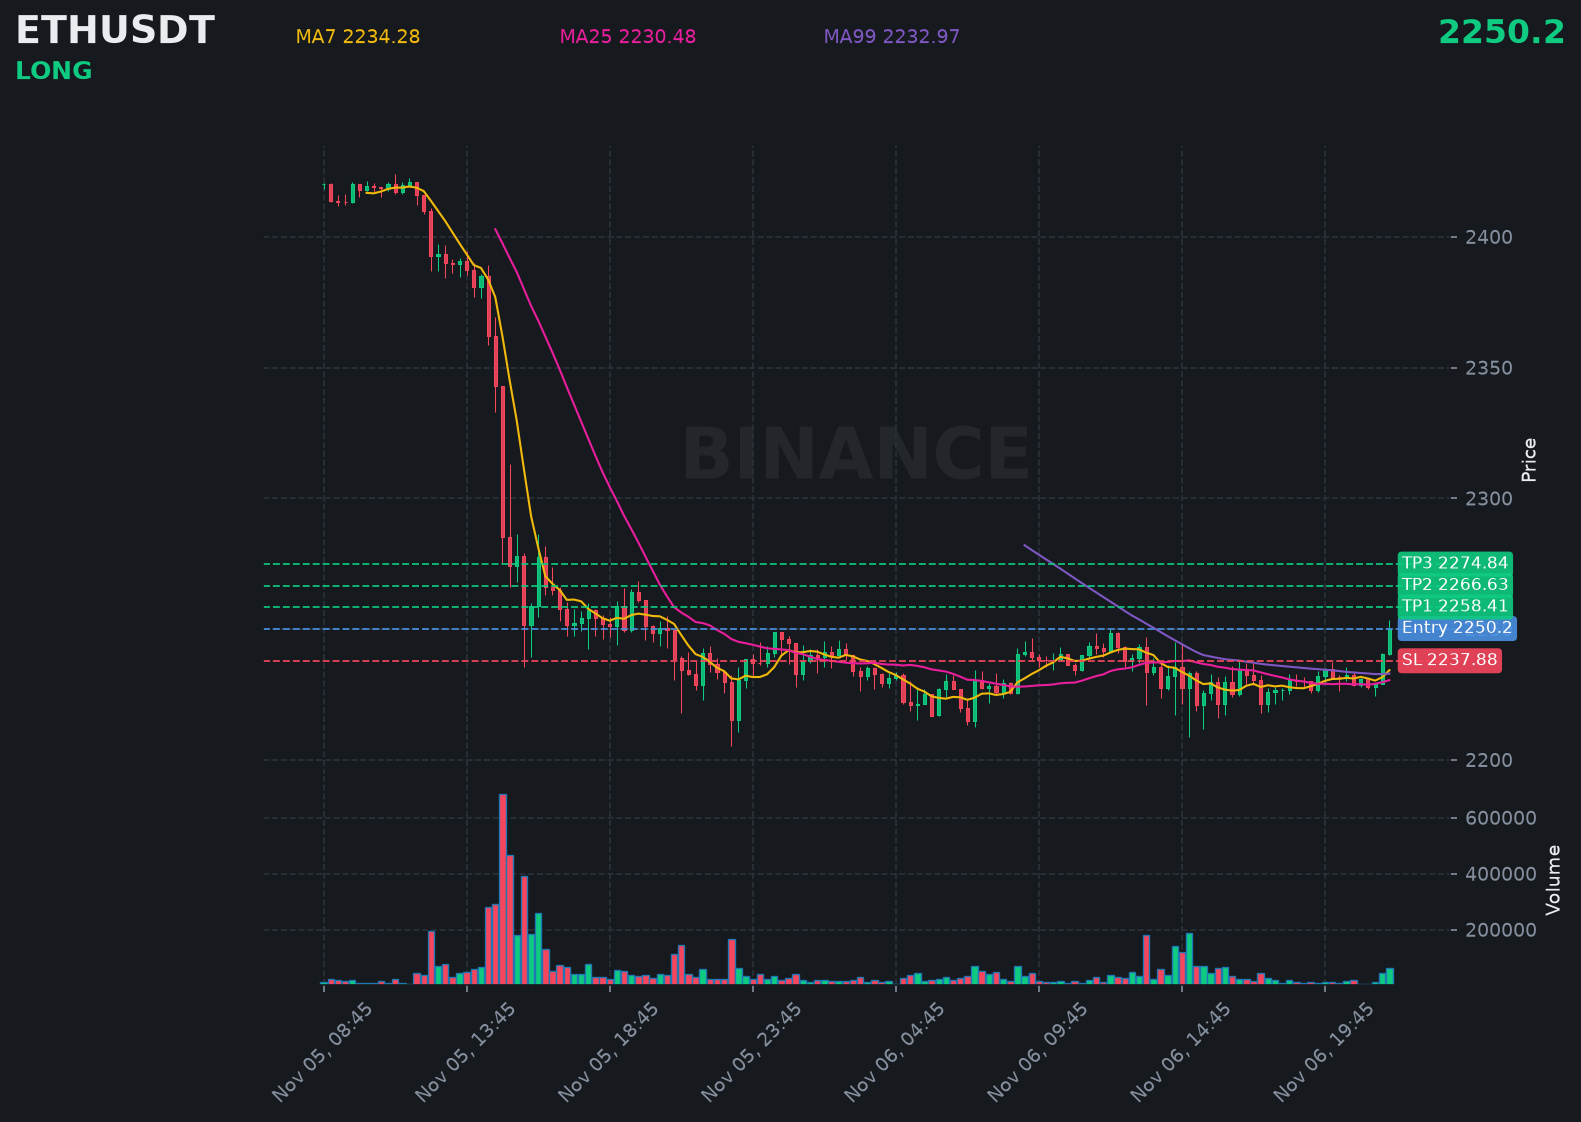
$ETH just printed a strong bullish candle, signaling more upside pressure building right now.
📍 @ 2250.2 | Volume: 138.32M USD
RSI 66 | EMA20: 2232.91 USD
📈 Trade Plan:
📈 Entry: 2247.74 – 2252.66
🛑 Stop Loss: 2237.88
🎯 TP1: 2258.41
🎯 TP2: 2266.63
🎯 TP3: 2274.84
Waiting for a retest, then riding the uptrend.
👉 $ETH 👈 Catch it
#ETH
$ETH just printed a strong bullish candle, signaling more upside pressure building right now.
📍 @ 2250.2 | Volume: 138.32M USD
RSI 66 | EMA20: 2232.91 USD
📈 Trade Plan:
📈 Entry: 2247.74 – 2252.66
🛑 Stop Loss: 2237.88
🎯 TP1: 2258.41
🎯 TP2: 2266.63
🎯 TP3: 2274.84
Waiting for a retest, then riding the uptrend.
👉 $ETH 👈 Catch it
#ETH
📍 @ 2250.2 | Volume: 138.32M USD
RSI 66 | EMA20: 2232.91 USD
📈 Trade Plan:
📈 Entry: 2247.74 – 2252.66
🛑 Stop Loss: 2237.88
🎯 TP1: 2258.41
🎯 TP2: 2266.63
🎯 TP3: 2274.84
Waiting for a retest, then riding the uptrend.
👉 $ETH 👈 Catch it
#ETH
107

·
--
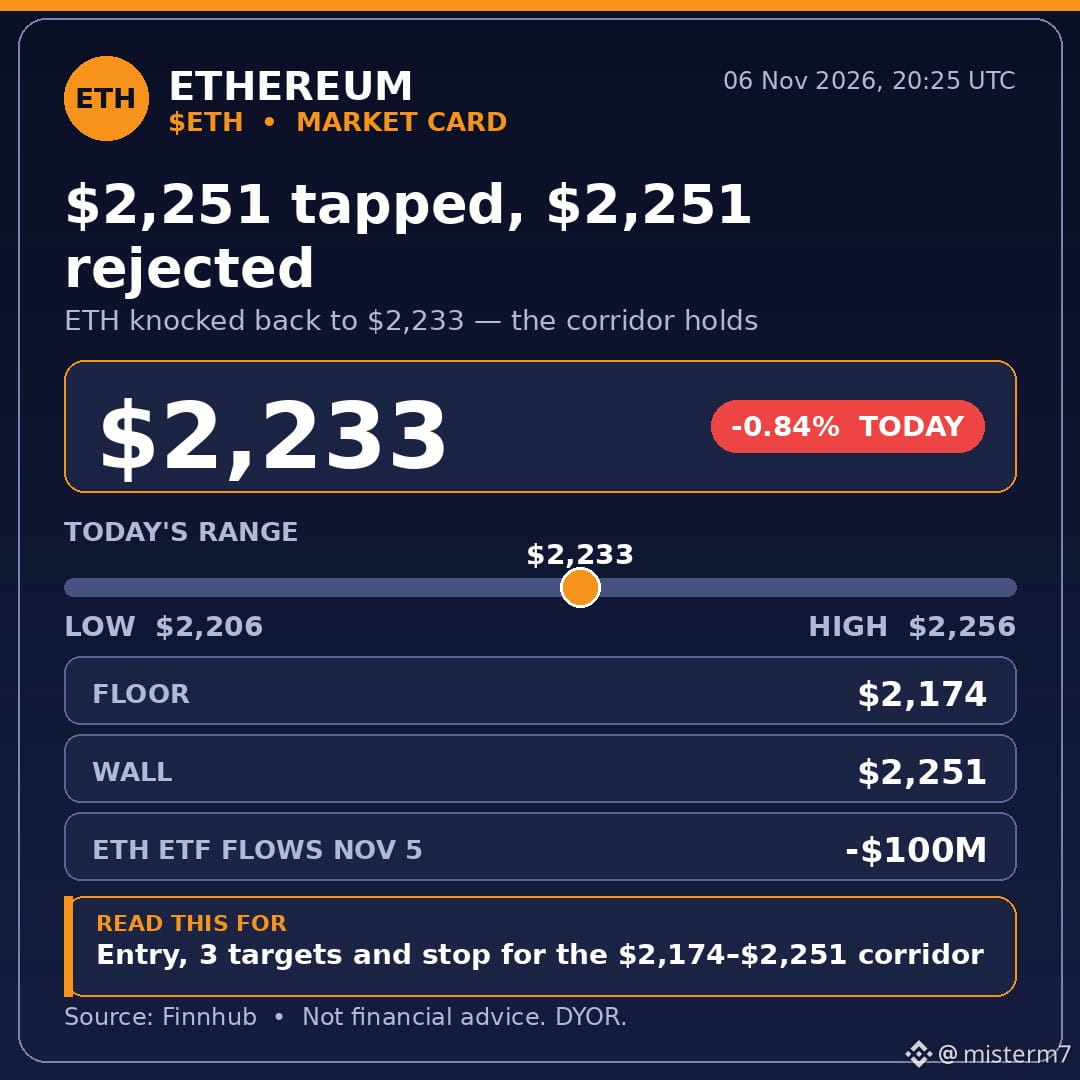
$2,251 tapped, $2,251 rejected — ETH knocked again, sent back to $2,233.
Same corridor all week: $2,174 floor won't break, $2,251 wall won't open. ETH poked to $2,255.65 today, then faded — Finnhub puts it at $2,233, down 0.84%, range $2,206.28–$2,255.65.
Jobs didn't help the bulls: 165,000 added in October vs a 65,000 forecast, and ETH ETFs bled another $100M on Nov 5, BlackRock's ETHA alone -$75.2M. $BTC did the same at ~$75,768, low $74,888 held.
Leaning cautious, no chase until a door opens. Entry $2,206–$2,233. TP1 $2,251, TP2 $2,347, TP3 $2,380. Stop below $2,206; a daily close under $2,174 kills it. Half out at TP1, quarters at TP2/TP3, stop to entry after TP1.
Daily close above $2,251 opens the corridor toward $2,347. Lose $2,174 and nothing honest sits under it until $2,100.
$ETH $2,251 breaks or $2,174 gives — which door opens first?
Not financial advice. DYOR.
#ETH #TradingPsychology #CryptoTrading
$2,251 tapped, $2,251 rejected — ETH knocked again, sent back to $2,233.
Same corridor all week: $2,174 floor won't break, $2,251 wall won't open. ETH poked to $2,255.65 today, then faded — Finnhub puts it at $2,233, down 0.84%, range $2,206.28–$2,255.65.
Jobs didn't help the bulls: 165,000 added in October vs a 65,000 forecast, and ETH ETFs bled another $100M on Nov 5, BlackRock's ETHA alone -$75.2M. $BTC did the same at ~$75,768, low $74,888 held.
Leaning cautious, no chase until a door opens. Entry $2,206–$2,233. TP1 $2,251, TP2 $2,347, TP3 $2,380. Stop below $2,206; a daily close under $2,174 kills it. Half out at TP1, quarters at TP2/TP3, stop to entry after TP1.
Daily close above $2,251 opens the corridor toward $2,347. Lose $2,174 and nothing honest sits under it until $2,100.
$ETH $2,251 breaks or $2,174 gives — which door opens first?
Not financial advice. DYOR.
#ETH #TradingPsychology #CryptoTrading
Same corridor all week: $2,174 floor won't break, $2,251 wall won't open. ETH poked to $2,255.65 today, then faded — Finnhub puts it at $2,233, down 0.84%, range $2,206.28–$2,255.65.
Jobs didn't help the bulls: 165,000 added in October vs a 65,000 forecast, and ETH ETFs bled another $100M on Nov 5, BlackRock's ETHA alone -$75.2M. $BTC did the same at ~$75,768, low $74,888 held.
Leaning cautious, no chase until a door opens. Entry $2,206–$2,233. TP1 $2,251, TP2 $2,347, TP3 $2,380. Stop below $2,206; a daily close under $2,174 kills it. Half out at TP1, quarters at TP2/TP3, stop to entry after TP1.
Daily close above $2,251 opens the corridor toward $2,347. Lose $2,174 and nothing honest sits under it until $2,100.
$ETH $2,251 breaks or $2,174 gives — which door opens first?
Not financial advice. DYOR.
#ETH #TradingPsychology #CryptoTrading
1

·
--
$ETH CLEARS $2,400 BREAKOUT ACCELERATION — NEXT LIQUIDITY TARGET AT $3,200! 🐂 💥
After a textbook demand defense in the $1,500–$1,600 zone, $ETH has officially awakened, slicing through $2,400 on expanding buying momentum. 📊 Sellers got caught flat-footed as spot absorption flipped short-term market structure heavily back to the upside. ⚡
The primary target zone now shifts directly to the liquidity parked between $2,800 and $3,200. 📌 Slicing through that overhead supply unlocks a clean trajectory toward $3,600–$4,300, setting up the broader roadmap for a macro retest of the $4,800 peak. 🌊 Pay attention to momentum spilling down to sub-$1 plays like $DOGE and $SUI as risk appetite expands. 🔍
🤔 Are you riding this Ethereum momentum right now, or waiting for a retest before bidding? 👇
⚠️ Not financial advice. Always manage your risk. 🛡️
🏷️ #ETH #Ethereum #Altcoins #Crypto
🔥 💎
$ETH CLEARS $2,400 BREAKOUT ACCELERATION — NEXT LIQUIDITY TARGET AT $3,200! 🐂 💥
After a textbook demand defense in the $1,500–$1,600 zone, $ETH has officially awakened, slicing through $2,400 on expanding buying momentum. 📊 Sellers got caught flat-footed as spot absorption flipped short-term market structure heavily back to the upside. ⚡
The primary target zone now shifts directly to the liquidity parked between $2,800 and $3,200. 📌 Slicing through that overhead supply unlocks a clean trajectory toward $3,600–$4,300, setting up the broader roadmap for a macro retest of the $4,800 peak. 🌊 Pay attention to momentum spilling down to sub-$1 plays like $DOGE and $SUI as risk appetite expands. 🔍
🤔 Are you riding this Ethereum momentum right now, or waiting for a retest before bidding? 👇
⚠️ Not financial advice. Always manage your risk. 🛡️
🏷️ #ETH #Ethereum #Altcoins #Crypto
🔥 💎
After a textbook demand defense in the $1,500–$1,600 zone, $ETH has officially awakened, slicing through $2,400 on expanding buying momentum. 📊 Sellers got caught flat-footed as spot absorption flipped short-term market structure heavily back to the upside. ⚡
The primary target zone now shifts directly to the liquidity parked between $2,800 and $3,200. 📌 Slicing through that overhead supply unlocks a clean trajectory toward $3,600–$4,300, setting up the broader roadmap for a macro retest of the $4,800 peak. 🌊 Pay attention to momentum spilling down to sub-$1 plays like $DOGE and $SUI as risk appetite expands. 🔍
🤔 Are you riding this Ethereum momentum right now, or waiting for a retest before bidding? 👇
⚠️ Not financial advice. Always manage your risk. 🛡️
🏷️ #ETH #Ethereum #Altcoins #Crypto
🔥 💎
2
Log in to explore more content
Join global crypto users on Binance Square
⚡️ Get latest and useful information about crypto.
💬 Trusted by the world’s largest crypto exchange.
👍 Discover real insights from verified creators.
Email / Phone number
Trending Topics
1
#BitcoinRebounds$75KAsChipsLead
5,194 views
101 Discussing
2
#JobsReportRaisesHikeOdds
82,535 views
841 Discussing
3
#US Data Center Rules May Constrain AI Expansion
10,208 views
91 Discussing
4
#$2TWipedOutHedgeFundsFaceLiquidation
11,992 views
95 Discussing
5
#WillAnthropicListOnTime
10,631 views
233 Discussing
6
#USNovemberMichiganExpectationsIndexPrelimAt50.9
19,850 views
335 Discussing
7
#OilPlungesBelow$100
19,478 views
38 Discussing
8
#TradFiForBeginners
11,735 views
214 Discussing
9
#USMidtermsCouldShakeUpUS-IranTies
38,750 views
504 Discussing
10
#RussianCentralBankNamesBTCETHUSDTForNonQualifiedInvestors
737 views
11 Discussing