
#cryptowithali
cryptowithali
282 views
12 Discussing
Hot
Latest

Market Structure vs Market Noise: How to Separate the Two
Crypto markets produce information constantly.
Price moves. Headlines appear. Social media reacts
But not everything deserves your attention.
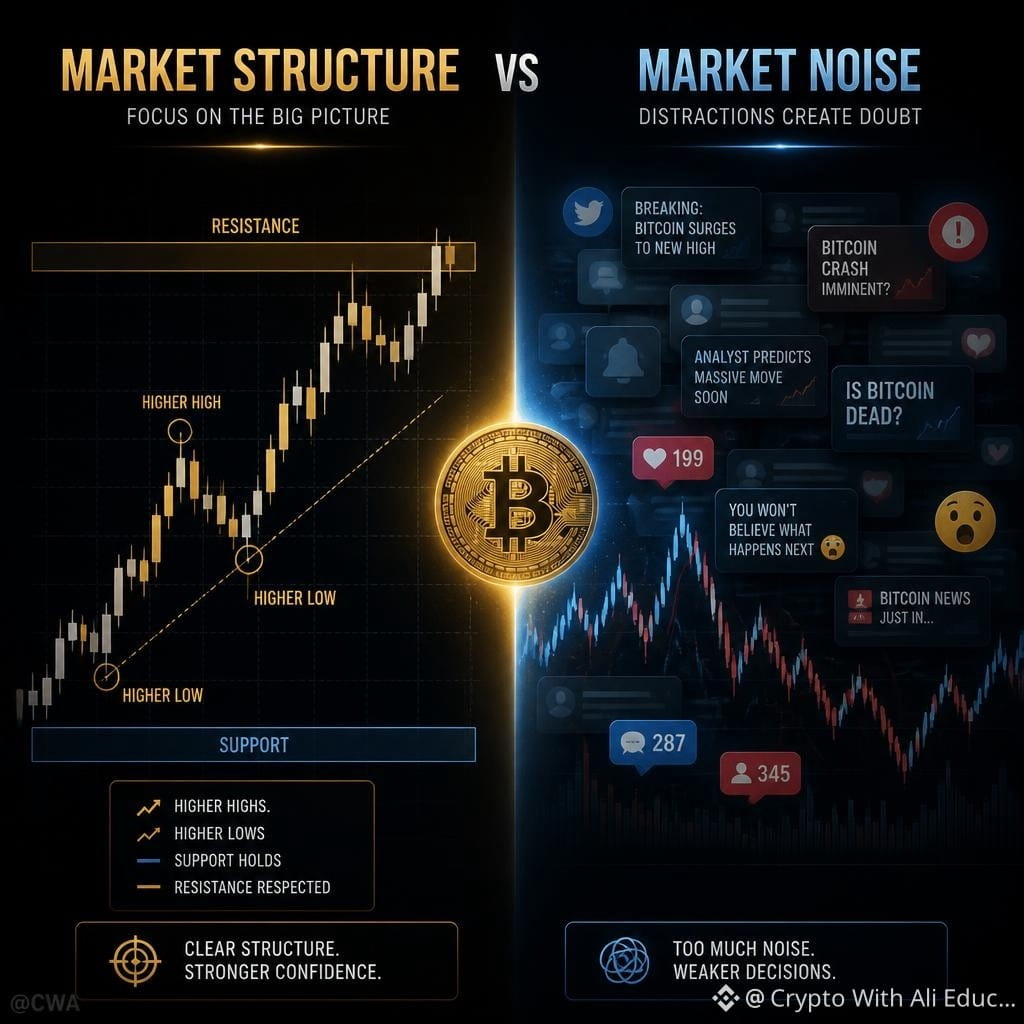
🔹 What Is Market Structure?
Market structure focuses on how price is actually behaving.
Look for:
• Higher highs and higher lows
• Lower highs and lower lows
• Breaks of important levels
• Consolidation and ranges
• Reactions around support and resistance
These observations can help you understand the market without reacting to every short-term move.
🔹 What Is Market Noise?
Noise is information or movement that can distract you from the bigger picture.
Examples include:
• Sudden social-media hype
• Emotional headlines
• Very short-term price fluctuations
• Repeated opinions without new information
• Focusing on every small candle
Noise isn't necessarily false.
It simply may not be important enough to change the bigger structure.
🔹 A Simple Filter
Before reacting to any crypto update, ask:
1. Did market structure change?
2. Did an important level break?
3. Is there meaningful volume or participation?
4. Does the move matter on my timeframe?
5. Is this new information—or just a reaction to a reaction?
This simple process can help reduce information overload.
🧠 The Key Lesson
You don't need to react to everything the crypto market says.
Learn to separate what the market is doing from what everyone is saying about it.
That difference can make chart analysis much clearer.
💬 What creates more noise for you: Social Media, Headlines, or Short-Term Price?
Educational content only — not financial advice.
More market updates coming daily — follow along
#CryptoMarket #tradingeducation #Marketpsychology #cryptotrading #CryptoWithAli
Market Structure vs Market Noise: How to Separate the Two
Crypto markets produce information constantly.
Price moves. Headlines appear. Social media reacts
But not everything deserves your attention.
🔹 What Is Market Structure?
Market structure focuses on how price is actually behaving.
Look for:
• Higher highs and higher lows
• Lower highs and lower lows
• Breaks of important levels
• Consolidation and ranges
• Reactions around support and resistance
These observations can help you understand the market without reacting to every short-term move.
🔹 What Is Market Noise?
Noise is information or movement that can distract you from the bigger picture.
Examples include:
• Sudden social-media hype
• Emotional headlines
• Very short-term price fluctuations
• Repeated opinions without new information
• Focusing on every small candle
Noise isn't necessarily false.
It simply may not be important enough to change the bigger structure.
🔹 A Simple Filter
Before reacting to any crypto update, ask:
1. Did market structure change?
2. Did an important level break?
3. Is there meaningful volume or participation?
4. Does the move matter on my timeframe?
5. Is this new information—or just a reaction to a reaction?
This simple process can help reduce information overload.
🧠 The Key Lesson
You don't need to react to everything the crypto market says.
Learn to separate what the market is doing from what everyone is saying about it.
That difference can make chart analysis much clearer.
💬 What creates more noise for you: Social Media, Headlines, or Short-Term Price?
Educational content only — not financial advice.
More market updates coming daily — follow along
#CryptoMarket #tradingeducation #Marketpsychology #cryptotrading #CryptoWithAli
Crypto markets produce information constantly.
Price moves. Headlines appear. Social media reacts
But not everything deserves your attention.
🔹 What Is Market Structure?
Market structure focuses on how price is actually behaving.
Look for:
• Higher highs and higher lows
• Lower highs and lower lows
• Breaks of important levels
• Consolidation and ranges
• Reactions around support and resistance
These observations can help you understand the market without reacting to every short-term move.
🔹 What Is Market Noise?
Noise is information or movement that can distract you from the bigger picture.
Examples include:
• Sudden social-media hype
• Emotional headlines
• Very short-term price fluctuations
• Repeated opinions without new information
• Focusing on every small candle
Noise isn't necessarily false.
It simply may not be important enough to change the bigger structure.
🔹 A Simple Filter
Before reacting to any crypto update, ask:
1. Did market structure change?
2. Did an important level break?
3. Is there meaningful volume or participation?
4. Does the move matter on my timeframe?
5. Is this new information—or just a reaction to a reaction?
This simple process can help reduce information overload.
🧠 The Key Lesson
You don't need to react to everything the crypto market says.
Learn to separate what the market is doing from what everyone is saying about it.
That difference can make chart analysis much clearer.
💬 What creates more noise for you: Social Media, Headlines, or Short-Term Price?
Educational content only — not financial advice.
More market updates coming daily — follow along
#CryptoMarket #tradingeducation #Marketpsychology #cryptotrading #CryptoWithAli
71
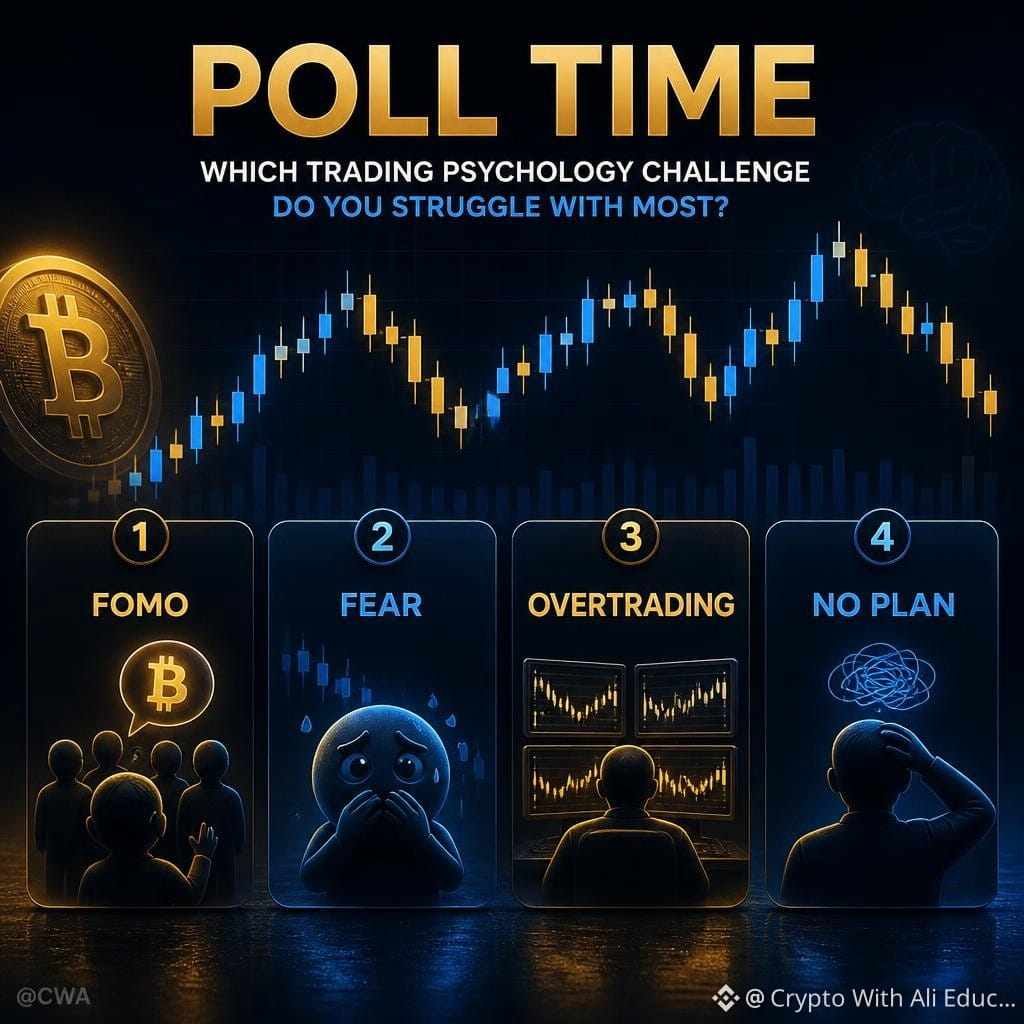
📊 Quick Trading Psychology Poll
Biggest Trading Problem?
🔘 FOMO
🔘 Fear
🔘 Overtrading
🔘 No Plan
Which one do you think causes the most problems for traders?
💬 Tell us why in the comments.
Understanding your own decision-making process is an important part of learning.
If this helped you, follow for more 👍
#BTC #TradingPsychology #FOMO #cryptoeducation #CryptoWithAli
📊 Quick Trading Psychology Poll
Biggest Trading Problem?
🔘 FOMO
🔘 Fear
🔘 Overtrading
🔘 No Plan
Which one do you think causes the most problems for traders?
💬 Tell us why in the comments.
Understanding your own decision-making process is an important part of learning.
If this helped you, follow for more 👍
#BTC #TradingPsychology #FOMO #cryptoeducation #CryptoWithAli
Biggest Trading Problem?
🔘 FOMO
🔘 Fear
🔘 Overtrading
🔘 No Plan
Which one do you think causes the most problems for traders?
💬 Tell us why in the comments.
Understanding your own decision-making process is an important part of learning.
If this helped you, follow for more 👍
#BTC #TradingPsychology #FOMO #cryptoeducation #CryptoWithAli
55
Candlestick Psychology: What Buyers and Sellers Are Really Showing
Candlesticks are more than red and green bars.
They show a simple story of buyers and sellers competing for control.
🔹 Long Upper Wick
Price moved higher, but sellers pushed it back down.
This can show rejection from higher levels.
🔹 Long Lower Wick
Sellers pushed price lower, but buyers stepped in and recovered part of the move.
This can show rejection from lower levels.
🔹 Engulfing Candle
An engulfing pattern occurs when one candle strongly covers the body of the previous candle.
It can show a shift in short-term momentum—but context matters.
🔹 Doji
A Doji usually shows that the opening and closing prices were close together.
It can represent indecision, especially after a strong move.
The Important Lesson
No single candle should be treated as a guaranteed signal.
Always consider:
• Market structure
• Support & resistance
• Volume
• Timeframe
• Previous price action
A candle tells you what happened during a period.
The surrounding context helps explain why it happened.
💬 Which candle signal do you find most useful: Rejection, Engulfing, or Doji?
Educational content only — not financial advice.
Crypto isn’t a sprint — follow for the long game
#BTC #candlestick #CandlestickPatterns #CryptoWithAli #BinanceSquare
Candlestick Psychology: What Buyers and Sellers Are Really Showing
Candlesticks are more than red and green bars.
They show a simple story of buyers and sellers competing for control.
🔹 Long Upper Wick
Price moved higher, but sellers pushed it back down.
This can show rejection from higher levels.
🔹 Long Lower Wick
Sellers pushed price lower, but buyers stepped in and recovered part of the move.
This can show rejection from lower levels.
🔹 Engulfing Candle
An engulfing pattern occurs when one candle strongly covers the body of the previous candle.
It can show a shift in short-term momentum—but context matters.
🔹 Doji
A Doji usually shows that the opening and closing prices were close together.
It can represent indecision, especially after a strong move.
The Important Lesson
No single candle should be treated as a guaranteed signal.
Always consider:
• Market structure
• Support & resistance
• Volume
• Timeframe
• Previous price action
A candle tells you what happened during a period.
The surrounding context helps explain why it happened.
💬 Which candle signal do you find most useful: Rejection, Engulfing, or Doji?
Educational content only — not financial advice.
Crypto isn’t a sprint — follow for the long game
#BTC #candlestick #CandlestickPatterns #CryptoWithAli #BinanceSquare
Candlesticks are more than red and green bars.
They show a simple story of buyers and sellers competing for control.
🔹 Long Upper Wick
Price moved higher, but sellers pushed it back down.
This can show rejection from higher levels.
🔹 Long Lower Wick
Sellers pushed price lower, but buyers stepped in and recovered part of the move.
This can show rejection from lower levels.
🔹 Engulfing Candle
An engulfing pattern occurs when one candle strongly covers the body of the previous candle.
It can show a shift in short-term momentum—but context matters.
🔹 Doji
A Doji usually shows that the opening and closing prices were close together.
It can represent indecision, especially after a strong move.
The Important Lesson
No single candle should be treated as a guaranteed signal.
Always consider:
• Market structure
• Support & resistance
• Volume
• Timeframe
• Previous price action
A candle tells you what happened during a period.
The surrounding context helps explain why it happened.
💬 Which candle signal do you find most useful: Rejection, Engulfing, or Doji?
Educational content only — not financial advice.
Crypto isn’t a sprint — follow for the long game
#BTC #candlestick #CandlestickPatterns #CryptoWithAli #BinanceSquare

84
📊 Volume Explained: How to Know Whether a Price Move Has Participation
Price tells you what happened.
Volume can help you understand how much participation was behind it.
When studying a crypto chart, don't look at price movement in isolation.
🔹 What Does Volume Show?
Volume represents the amount of trading activity during a specific period.
A price move accompanied by increasing volume can suggest stronger market participation.
But here's the important part:
High volume does not automatically mean bullish.
It can appear during buying, selling, breakouts, reversals, or periods of intense market activity.
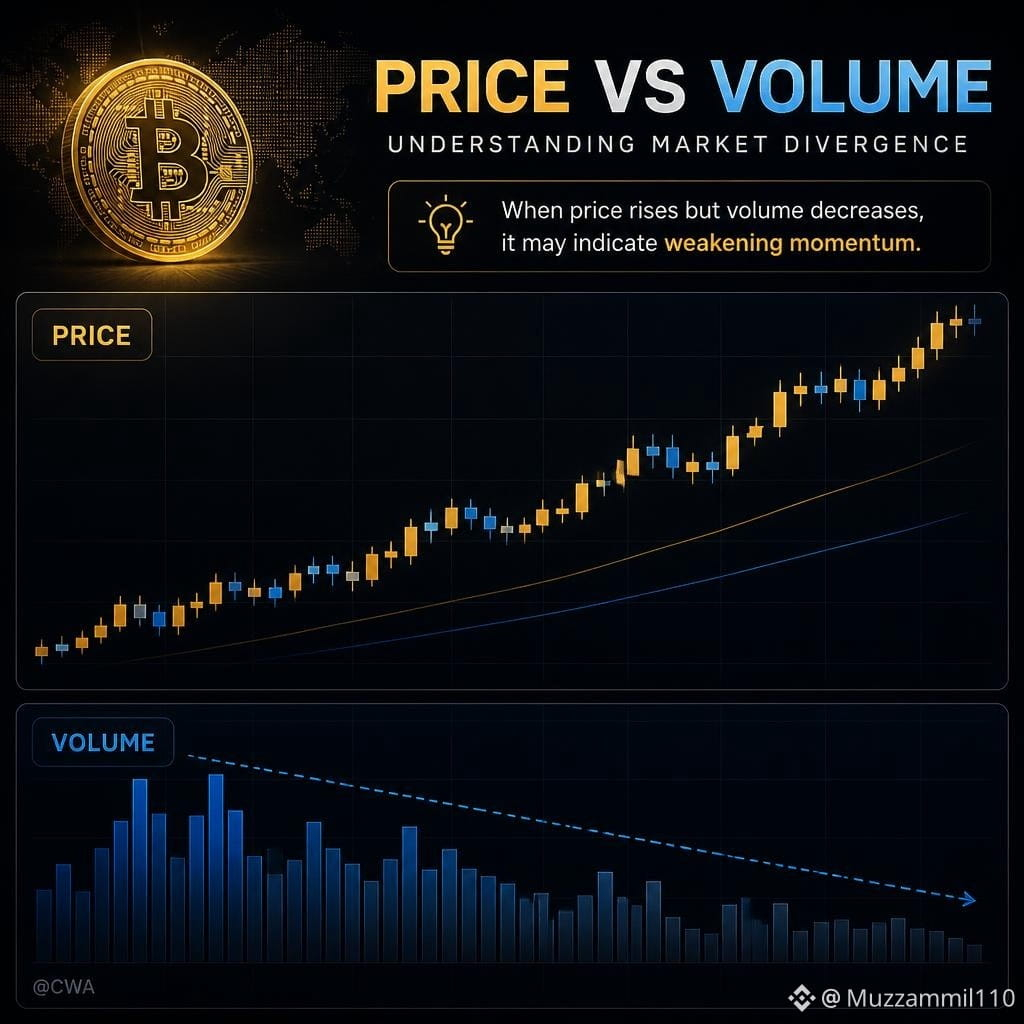
🔹 What If Price Goes Up but Volume Falls?
This is where traders often jump to conclusions.
Price moving higher while volume decreases may indicate that the move has less participation than earlier price action.
But it does NOT automatically mean the price must reverse.
Context matters.
Look at:
• Market structure
• Support & resistance
• Previous volume levels
• Timeframe
• Momentum
• The overall market environment
🔹 The Key Lesson
Don't ask only:
“Did price go up?”
Also ask:
“Was there enough participation behind the move?”
Understanding the relationship between price + volume can give you a much clearer view of market behavior.
💬 What do you think: Price Up + Volume Down = Strong or Weak Move?
Share your reasoning below. 👇
Educational content only — not financial advice.
If you're building patiently in crypto, follow
#BTC #Volume #VolumeAnalysis #CryptoWithAli #BinanceSquare
📊 Volume Explained: How to Know Whether a Price Move Has Participation
Price tells you what happened.
Volume can help you understand how much participation was behind it.
When studying a crypto chart, don't look at price movement in isolation.
🔹 What Does Volume Show?
Volume represents the amount of trading activity during a specific period.
A price move accompanied by increasing volume can suggest stronger market participation.
But here's the important part:
High volume does not automatically mean bullish.
It can appear during buying, selling, breakouts, reversals, or periods of intense market activity.
🔹 What If Price Goes Up but Volume Falls?
This is where traders often jump to conclusions.
Price moving higher while volume decreases may indicate that the move has less participation than earlier price action.
But it does NOT automatically mean the price must reverse.
Context matters.
Look at:
• Market structure
• Support & resistance
• Previous volume levels
• Timeframe
• Momentum
• The overall market environment
🔹 The Key Lesson
Don't ask only:
“Did price go up?”
Also ask:
“Was there enough participation behind the move?”
Understanding the relationship between price + volume can give you a much clearer view of market behavior.
💬 What do you think: Price Up + Volume Down = Strong or Weak Move?
Share your reasoning below. 👇
Educational content only — not financial advice.
If you're building patiently in crypto, follow
#BTC #Volume #VolumeAnalysis #CryptoWithAli #BinanceSquare
Price tells you what happened.
Volume can help you understand how much participation was behind it.
When studying a crypto chart, don't look at price movement in isolation.
🔹 What Does Volume Show?
Volume represents the amount of trading activity during a specific period.
A price move accompanied by increasing volume can suggest stronger market participation.
But here's the important part:
High volume does not automatically mean bullish.
It can appear during buying, selling, breakouts, reversals, or periods of intense market activity.
🔹 What If Price Goes Up but Volume Falls?
This is where traders often jump to conclusions.
Price moving higher while volume decreases may indicate that the move has less participation than earlier price action.
But it does NOT automatically mean the price must reverse.
Context matters.
Look at:
• Market structure
• Support & resistance
• Previous volume levels
• Timeframe
• Momentum
• The overall market environment
🔹 The Key Lesson
Don't ask only:
“Did price go up?”
Also ask:
“Was there enough participation behind the move?”
Understanding the relationship between price + volume can give you a much clearer view of market behavior.
💬 What do you think: Price Up + Volume Down = Strong or Weak Move?
Share your reasoning below. 👇
Educational content only — not financial advice.
If you're building patiently in crypto, follow
#BTC #Volume #VolumeAnalysis #CryptoWithAli #BinanceSquare
57
📊 RSI for Beginners: What Overbought and Oversold Actually Mean
If you've ever seen RSI above 70 and immediately thought "SELL,"
there's an important concept to understand.
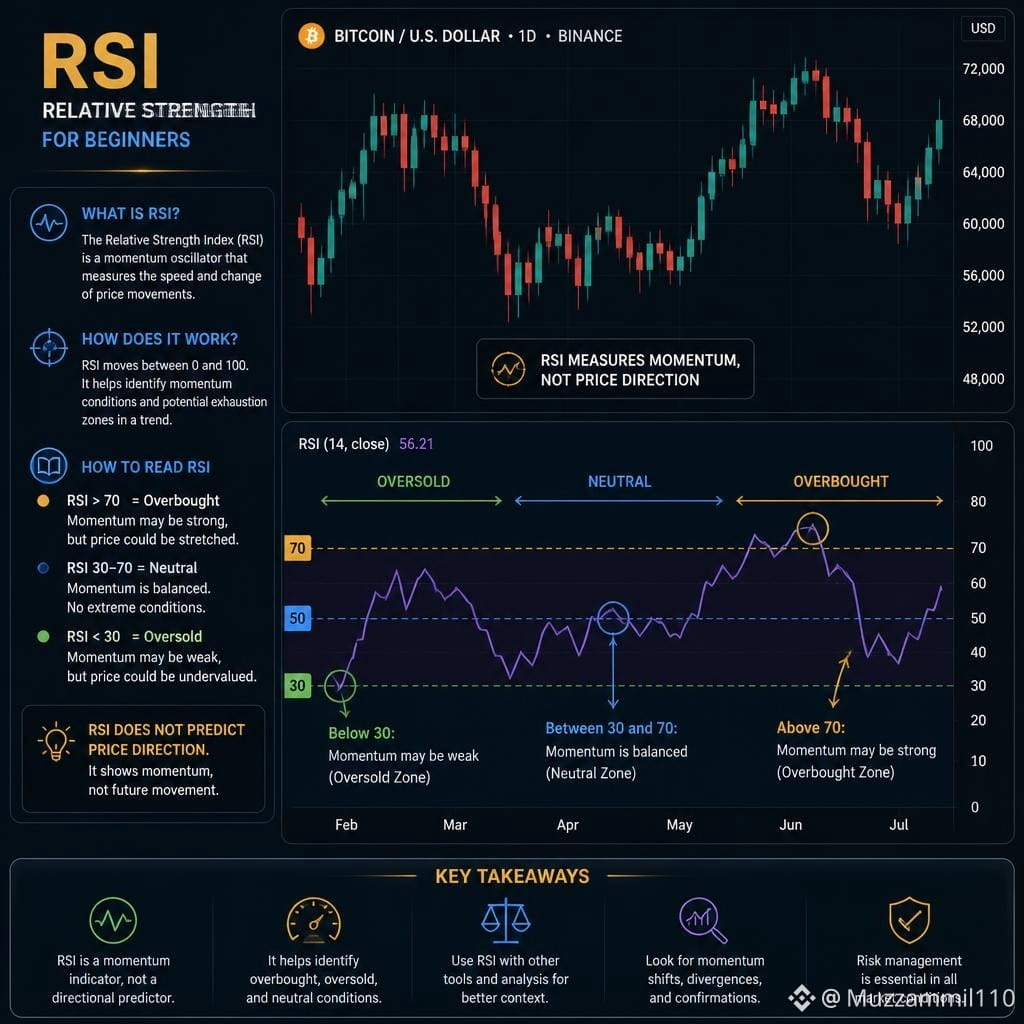
RSI is a momentum indicator. It helps show how strongly price has been moving recently.
🔹 RSI Above 70 — Overbought?
Traditionally, an RSI above 70 is described as overbought.
But overbought does not automatically mean:
❌ Price must fall
❌ Sell immediately
❌ Trend has reversed
During a strong uptrend, RSI can remain above 70 for an extended period because momentum is strong.
🔹 RSI Below 30 — Oversold?
An RSI below 30 is traditionally described as oversold.
But oversold does not automatically mean:
❌ Price must rise
❌ Buy immediately
❌ The downtrend is finished
Strong bearish trends can keep RSI near oversold territory.
🔹 So What Is RSI Actually Telling You?
Think of RSI as a momentum thermometer, not a prediction machine.
Use it alongside:
• Market structure
• Support & resistance
• Volume
• Trend
• Higher and lower timeframes
For example, an RSI reading above 70 means momentum has been strong—it doesn't tell you by itself what happens next.
📌 Beginner takeaway:
Overbought ≠ automatic sell.
Oversold ≠ automatic buy.
The indicator provides context. Your job is to understand that context.
$BTC
This is educational content, not a trading signal or financial advice.
💬 When RSI moves above 70, what do you think it shows: selling opportunity, strong momentum, or nothing by itself?
Sharing what I learn in crypto every day — follow along
#priceaction #cryptotrading #Marketstructure #CryptoWithAli #BinanceSquare
📊 RSI for Beginners: What Overbought and Oversold Actually Mean
If you've ever seen RSI above 70 and immediately thought "SELL,"
there's an important concept to understand.
RSI is a momentum indicator. It helps show how strongly price has been moving recently.
🔹 RSI Above 70 — Overbought?
Traditionally, an RSI above 70 is described as overbought.
But overbought does not automatically mean:
❌ Price must fall
❌ Sell immediately
❌ Trend has reversed
During a strong uptrend, RSI can remain above 70 for an extended period because momentum is strong.
🔹 RSI Below 30 — Oversold?
An RSI below 30 is traditionally described as oversold.
But oversold does not automatically mean:
❌ Price must rise
❌ Buy immediately
❌ The downtrend is finished
Strong bearish trends can keep RSI near oversold territory.
🔹 So What Is RSI Actually Telling You?
Think of RSI as a momentum thermometer, not a prediction machine.
Use it alongside:
• Market structure
• Support & resistance
• Volume
• Trend
• Higher and lower timeframes
For example, an RSI reading above 70 means momentum has been strong—it doesn't tell you by itself what happens next.
📌 Beginner takeaway:
Overbought ≠ automatic sell.
Oversold ≠ automatic buy.
The indicator provides context. Your job is to understand that context.
$BTC
This is educational content, not a trading signal or financial advice.
💬 When RSI moves above 70, what do you think it shows: selling opportunity, strong momentum, or nothing by itself?
Sharing what I learn in crypto every day — follow along
#priceaction #cryptotrading #Marketstructure #CryptoWithAli #BinanceSquare
If you've ever seen RSI above 70 and immediately thought "SELL,"
there's an important concept to understand.
RSI is a momentum indicator. It helps show how strongly price has been moving recently.
🔹 RSI Above 70 — Overbought?
Traditionally, an RSI above 70 is described as overbought.
But overbought does not automatically mean:
❌ Price must fall
❌ Sell immediately
❌ Trend has reversed
During a strong uptrend, RSI can remain above 70 for an extended period because momentum is strong.
🔹 RSI Below 30 — Oversold?
An RSI below 30 is traditionally described as oversold.
But oversold does not automatically mean:
❌ Price must rise
❌ Buy immediately
❌ The downtrend is finished
Strong bearish trends can keep RSI near oversold territory.
🔹 So What Is RSI Actually Telling You?
Think of RSI as a momentum thermometer, not a prediction machine.
Use it alongside:
• Market structure
• Support & resistance
• Volume
• Trend
• Higher and lower timeframes
For example, an RSI reading above 70 means momentum has been strong—it doesn't tell you by itself what happens next.
📌 Beginner takeaway:
Overbought ≠ automatic sell.
Oversold ≠ automatic buy.
The indicator provides context. Your job is to understand that context.
$BTC
This is educational content, not a trading signal or financial advice.
💬 When RSI moves above 70, what do you think it shows: selling opportunity, strong momentum, or nothing by itself?
Sharing what I learn in crypto every day — follow along
#priceaction #cryptotrading #Marketstructure #CryptoWithAli #BinanceSquare
56
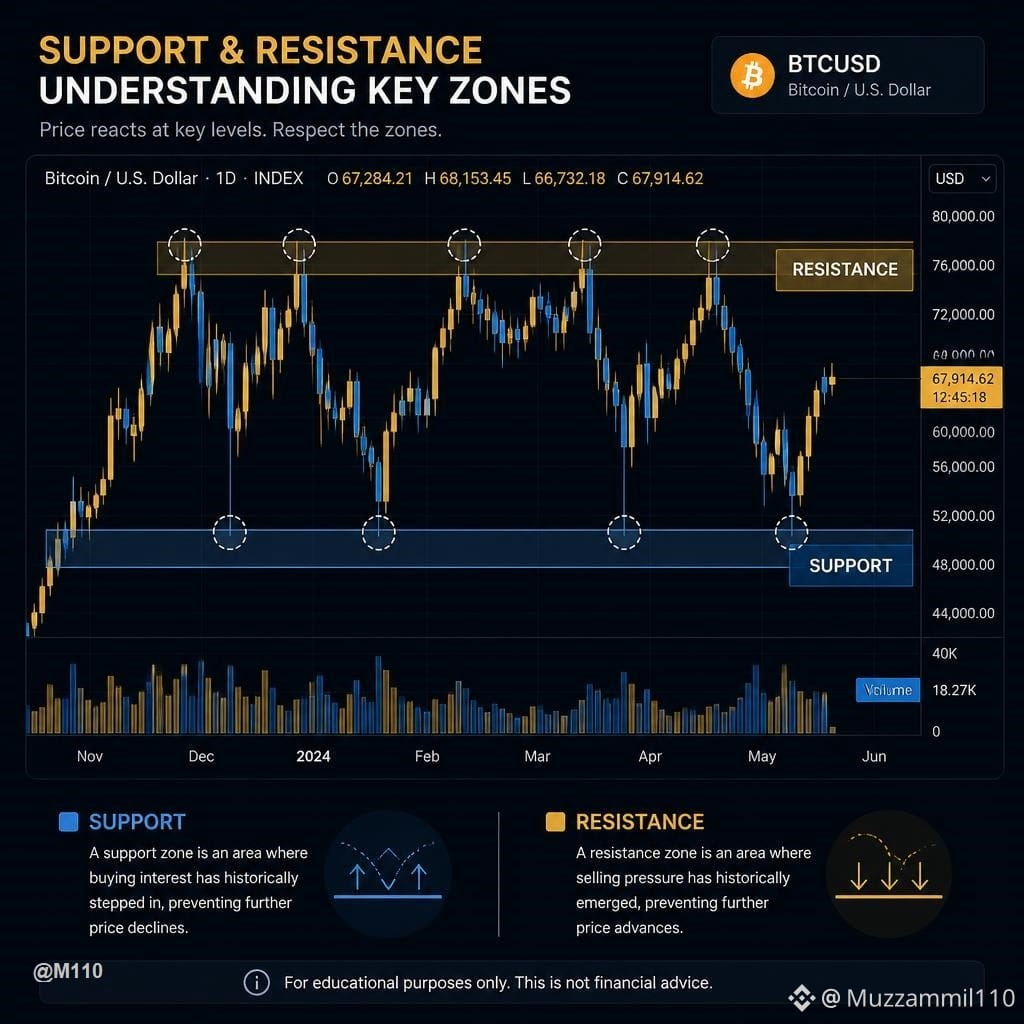
📊 Support & Resistance: Why These Levels Matter More Than Random Price Targets
When studying a crypto chart, it's easy to focus on a specific price target.
But before thinking about where price might go, it's often more useful to understand where price has previously reacted.
That's where support and resistance come in.
🔹 Support
A price area where buying interest has previously helped slow or stop a decline.
🔹 Resistance
A price area where selling pressure has previously slowed or stopped an advance.
🔹 Why Are They Important?
These aren't magic numbers.
They are areas where traders and market participants have previously shown interest. The more clearly a level has been respected, the more useful it can be as part of your chart analysis.
🔹 Levels vs. Exact Lines
Beginners often draw one perfect line.
In reality, support and resistance are often better viewed as zones because price can move slightly above or below an area before reacting.
🔹 Context Matters
A level should not be analyzed in isolation.
Consider:
• Market structure
• Volume
• Previous reactions
• Timeframe
• Overall market conditions
📌 Beginner takeaway:
Instead of asking:
"What's the next random price target?"
Start by asking:
"Where has the market previously shown strong interest?"
That simple change can make chart analysis much more structured.
$BTC
This is educational content, not a trading signal or financial advice.
💬 When analyzing a chart, do you focus more on support, resistance, or both?
Daily crypto thoughts for calm decision-makers — follow
#Marketstructure #tradingeducation #CryptoTrading #CryptoWithAli #BinanceSquare
📊 Support & Resistance: Why These Levels Matter More Than Random Price Targets
When studying a crypto chart, it's easy to focus on a specific price target.
But before thinking about where price might go, it's often more useful to understand where price has previously reacted.
That's where support and resistance come in.
🔹 Support
A price area where buying interest has previously helped slow or stop a decline.
🔹 Resistance
A price area where selling pressure has previously slowed or stopped an advance.
🔹 Why Are They Important?
These aren't magic numbers.
They are areas where traders and market participants have previously shown interest. The more clearly a level has been respected, the more useful it can be as part of your chart analysis.
🔹 Levels vs. Exact Lines
Beginners often draw one perfect line.
In reality, support and resistance are often better viewed as zones because price can move slightly above or below an area before reacting.
🔹 Context Matters
A level should not be analyzed in isolation.
Consider:
• Market structure
• Volume
• Previous reactions
• Timeframe
• Overall market conditions
📌 Beginner takeaway:
Instead of asking:
"What's the next random price target?"
Start by asking:
"Where has the market previously shown strong interest?"
That simple change can make chart analysis much more structured.
$BTC
This is educational content, not a trading signal or financial advice.
💬 When analyzing a chart, do you focus more on support, resistance, or both?
Daily crypto thoughts for calm decision-makers — follow
#Marketstructure #tradingeducation #CryptoTrading #CryptoWithAli #BinanceSquare
When studying a crypto chart, it's easy to focus on a specific price target.
But before thinking about where price might go, it's often more useful to understand where price has previously reacted.
That's where support and resistance come in.
🔹 Support
A price area where buying interest has previously helped slow or stop a decline.
🔹 Resistance
A price area where selling pressure has previously slowed or stopped an advance.
🔹 Why Are They Important?
These aren't magic numbers.
They are areas where traders and market participants have previously shown interest. The more clearly a level has been respected, the more useful it can be as part of your chart analysis.
🔹 Levels vs. Exact Lines
Beginners often draw one perfect line.
In reality, support and resistance are often better viewed as zones because price can move slightly above or below an area before reacting.
🔹 Context Matters
A level should not be analyzed in isolation.
Consider:
• Market structure
• Volume
• Previous reactions
• Timeframe
• Overall market conditions
📌 Beginner takeaway:
Instead of asking:
"What's the next random price target?"
Start by asking:
"Where has the market previously shown strong interest?"
That simple change can make chart analysis much more structured.
$BTC
This is educational content, not a trading signal or financial advice.
💬 When analyzing a chart, do you focus more on support, resistance, or both?
Daily crypto thoughts for calm decision-makers — follow
#Marketstructure #tradingeducation #CryptoTrading #CryptoWithAli #BinanceSquare
65
📊 BTC Dominance Rising → Good or Bad for Altcoins?
🔹 Good
🔹 Bad
🔹 Depends on Market Context
💡 Think beyond a simple bullish/bearish answer.
BTC Dominance tells us about Bitcoin's relative share of the crypto market, but the broader market context still matters.
👇 What's your view?
#CryptoPoll #crypto #CryptoWithAli
📊 BTC Dominance Rising → Good or Bad for Altcoins?
🔹 Good
🔹 Bad
🔹 Depends on Market Context
💡 Think beyond a simple bullish/bearish answer.
BTC Dominance tells us about Bitcoin's relative share of the crypto market, but the broader market context still matters.
👇 What's your view?
#CryptoPoll #crypto #CryptoWithAli
🔹 Good
🔹 Bad
🔹 Depends on Market Context
💡 Think beyond a simple bullish/bearish answer.
BTC Dominance tells us about Bitcoin's relative share of the crypto market, but the broader market context still matters.
👇 What's your view?
#CryptoPoll #crypto #CryptoWithAli
50
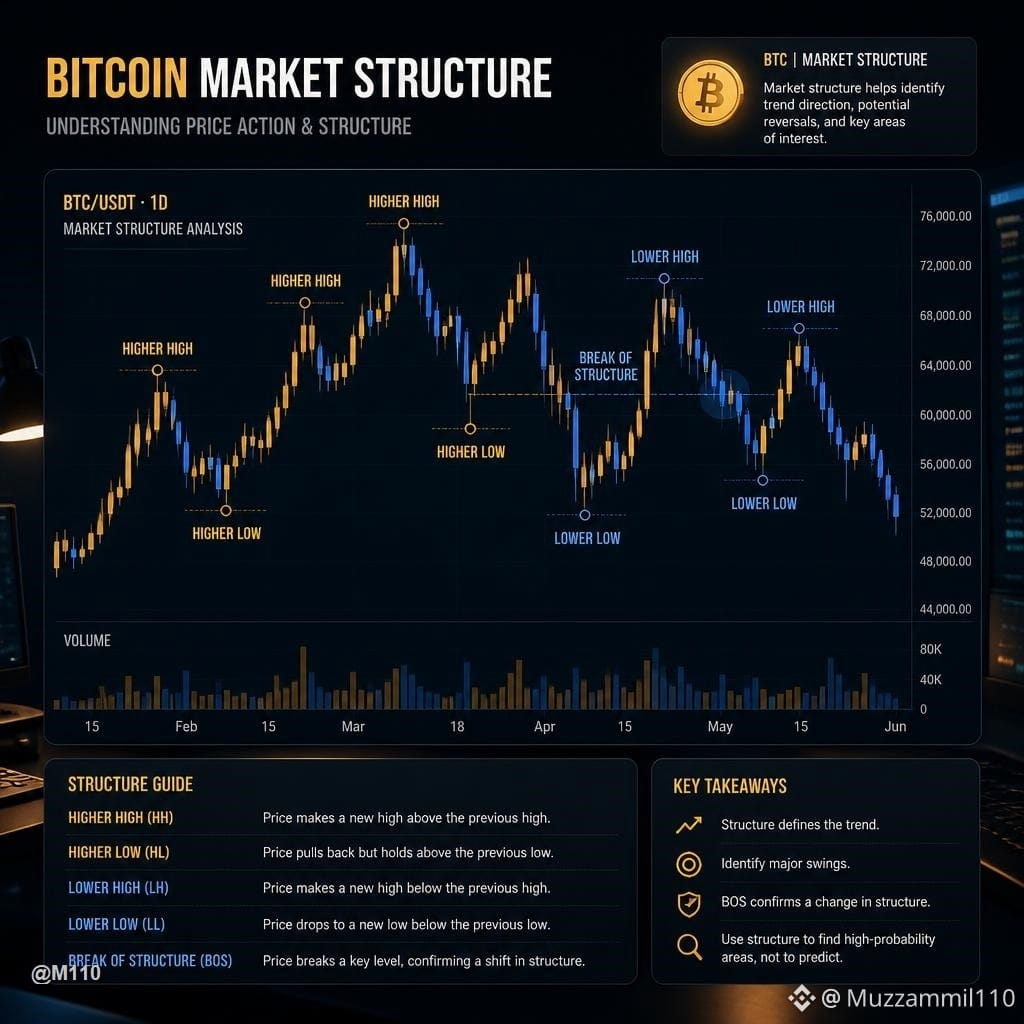
📊 BTC Market Structure: How to Tell If the Trend Is Actually Changing
A price move alone doesn't always mean the trend has changed.
Before calling a trend reversal, look at the market structure.
🔹 1. Higher Highs + Higher Lows
A series of higher highs and higher lows generally shows that buyers are maintaining the structure.
🔹 2. Lower Highs + Lower Lows
When the structure starts producing lower highs and lower lows, selling pressure may be becoming more dominant.
🔹 3. Break of Structure
A meaningful break of a previous swing point can be an important clue—but one break alone doesn't confirm a complete trend reversal.
🔹 4. Volume
Price structure becomes more useful when you also examine participation. A move with stronger volume can provide additional context.
🔹 5. Timeframe Matters
A structure change on a short timeframe doesn't automatically mean the larger trend has changed.
📌 Simple rule:
Don't ask only, "Is Bitcoin going up or down?"
Ask:
"What is the market structure showing?"
$BTC
This is educational content, not a trading signal or financial advice.
💬 What do you check first when studying BTC: structure, volume, or sentiment?
More market updates coming daily — follow along
#cryptotrading #priceaction #tradingeducation #CryptoWithAli #BinanceSquare
📊 BTC Market Structure: How to Tell If the Trend Is Actually Changing
A price move alone doesn't always mean the trend has changed.
Before calling a trend reversal, look at the market structure.
🔹 1. Higher Highs + Higher Lows
A series of higher highs and higher lows generally shows that buyers are maintaining the structure.
🔹 2. Lower Highs + Lower Lows
When the structure starts producing lower highs and lower lows, selling pressure may be becoming more dominant.
🔹 3. Break of Structure
A meaningful break of a previous swing point can be an important clue—but one break alone doesn't confirm a complete trend reversal.
🔹 4. Volume
Price structure becomes more useful when you also examine participation. A move with stronger volume can provide additional context.
🔹 5. Timeframe Matters
A structure change on a short timeframe doesn't automatically mean the larger trend has changed.
📌 Simple rule:
Don't ask only, "Is Bitcoin going up or down?"
Ask:
"What is the market structure showing?"
$BTC
This is educational content, not a trading signal or financial advice.
💬 What do you check first when studying BTC: structure, volume, or sentiment?
More market updates coming daily — follow along
#cryptotrading #priceaction #tradingeducation #CryptoWithAli #BinanceSquare
A price move alone doesn't always mean the trend has changed.
Before calling a trend reversal, look at the market structure.
🔹 1. Higher Highs + Higher Lows
A series of higher highs and higher lows generally shows that buyers are maintaining the structure.
🔹 2. Lower Highs + Lower Lows
When the structure starts producing lower highs and lower lows, selling pressure may be becoming more dominant.
🔹 3. Break of Structure
A meaningful break of a previous swing point can be an important clue—but one break alone doesn't confirm a complete trend reversal.
🔹 4. Volume
Price structure becomes more useful when you also examine participation. A move with stronger volume can provide additional context.
🔹 5. Timeframe Matters
A structure change on a short timeframe doesn't automatically mean the larger trend has changed.
📌 Simple rule:
Don't ask only, "Is Bitcoin going up or down?"
Ask:
"What is the market structure showing?"
$BTC
This is educational content, not a trading signal or financial advice.
💬 What do you check first when studying BTC: structure, volume, or sentiment?
More market updates coming daily — follow along
#cryptotrading #priceaction #tradingeducation #CryptoWithAli #BinanceSquare
68
🇵🇰 Happy Independence Day, Pakistan!
Today we celebrate the freedom, unity, and sacrifices that shaped our nation.
May Pakistan continue moving forward with knowledge, innovation,
technology, and new opportunities for its people. 💚
From @M110, wishing everyone a peaceful and prosperous Independence Day.
Pakistan Zindabad! 🇵🇰💚
#PakistanIndependenceday #14August #pakistanzindabad #IndependenceDay #CryptoWithAli
🇵🇰 Happy Independence Day, Pakistan!
Today we celebrate the freedom, unity, and sacrifices that shaped our nation.
May Pakistan continue moving forward with knowledge, innovation,
technology, and new opportunities for its people. 💚
From @M110, wishing everyone a peaceful and prosperous Independence Day.
Pakistan Zindabad! 🇵🇰💚
#PakistanIndependenceday #14August #pakistanzindabad #IndependenceDay #CryptoWithAli
Today we celebrate the freedom, unity, and sacrifices that shaped our nation.
May Pakistan continue moving forward with knowledge, innovation,
technology, and new opportunities for its people. 💚
From @M110, wishing everyone a peaceful and prosperous Independence Day.
Pakistan Zindabad! 🇵🇰💚
#PakistanIndependenceday #14August #pakistanzindabad #IndependenceDay #CryptoWithAli

79
Log in to explore more content
Join global crypto users on Binance Square
⚡️ Get latest and useful information about crypto.
💬 Trusted by the world’s largest crypto exchange.
👍 Discover real insights from verified creators.
Email / Phone number
Trending Topics
1
#FedRateWatch
765,415 views
3,644 Discussing
2
#BitcoinFalls4%
17 views
11 Discussing
3
#ArgentinaCommitsToOECDCryptoReportingBy2029
3,825 views
119 Discussing
4
#EthereumFallsBelow$2400
2,152 views
52 Discussing
5
#USDTLaunchesOnZamaPrivacyProtocol
979 views
51 Discussing
6
#USSenateBlocksClarityAct
16,470 views
290 Discussing
7
#BitcoinSlidesTo$76000
34,176 views
156 Discussing
8
#BitcoinReboundsTo$79K
66,539 views
427 Discussing
9
#StrategyMarketCapPassesFord
59,292 views
876 Discussing
10
#ClarityActOddsHalveOnPolymarket
98,399 views
798 Discussing