
#volume
volume
821,906 views
2,707 Discussing
Hot
Latest

·
--
Crypto just went quiet: spot volume fell 46.72% in 24 hours, and derivatives volume dropped 58.34% (CryptoBuyingTips).
Total market cap sits near $2.54T. Stablecoin volume also fell nearly 48%.
That's not a slow drift. It looks like traders stepping away while regulatory headlines hit exchanges. Thin volume can mean sharp moves either way when it returns, so watch whether $BTC holds the $75K area and whether $ETH stays above $2,200.
Are you sitting out this week, or using the quiet to position?
Not financial advice.
#Bitcoin #CryptoMarket #Volume
Crypto just went quiet: spot volume fell 46.72% in 24 hours, and derivatives volume dropped 58.34% (CryptoBuyingTips).
Total market cap sits near $2.54T. Stablecoin volume also fell nearly 48%.
That's not a slow drift. It looks like traders stepping away while regulatory headlines hit exchanges. Thin volume can mean sharp moves either way when it returns, so watch whether $BTC holds the $75K area and whether $ETH stays above $2,200.
Are you sitting out this week, or using the quiet to position?
Not financial advice.
#Bitcoin #CryptoMarket #Volume
Total market cap sits near $2.54T. Stablecoin volume also fell nearly 48%.
That's not a slow drift. It looks like traders stepping away while regulatory headlines hit exchanges. Thin volume can mean sharp moves either way when it returns, so watch whether $BTC holds the $75K area and whether $ETH stays above $2,200.
Are you sitting out this week, or using the quiet to position?
Not financial advice.
#Bitcoin #CryptoMarket #Volume
1

·
--
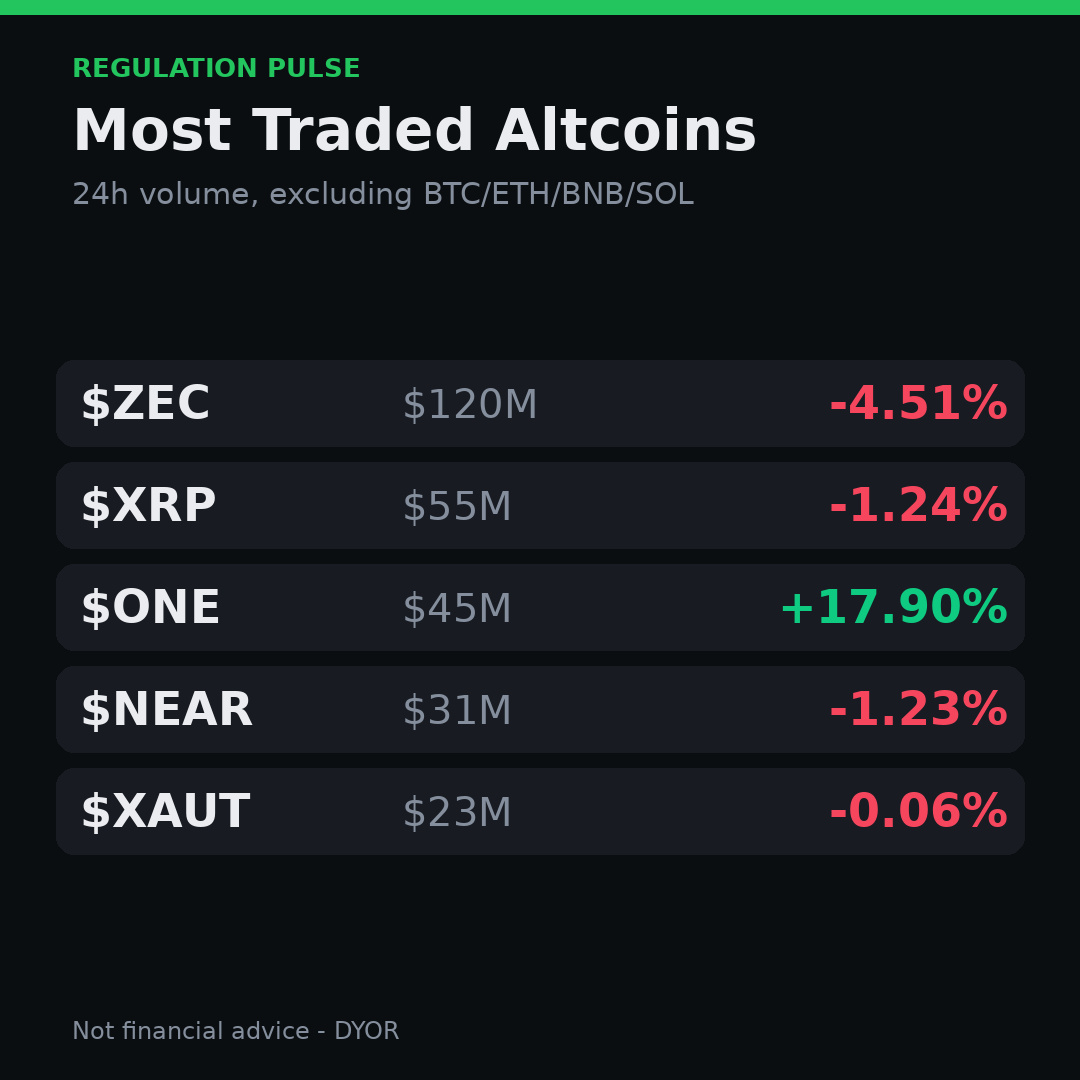
These altcoins got the most action today, skipping BTC, ETH, BNB and SOL.
🤔 $ZEC, vol $120M -4.51%
$XRP, vol $55M -1.24%
$ONE, vol $45M +17.90%
NEAR, vol $31M -1.23%
XAUT, vol $23M -0.06%
Big volume, but I'm not sure if it's buying or selling. What do you think? NFA, always DYOR.
#Altcoins #Volume
These altcoins got the most action today, skipping BTC, ETH, BNB and SOL.
🤔 $ZEC , vol $120M -4.51%
$XRP , vol $55M -1.24%
$ONE , vol $45M +17.90%
NEAR, vol $31M -1.23%
XAUT, vol $23M -0.06%
Big volume, but I'm not sure if it's buying or selling. What do you think? NFA, always DYOR.
#Altcoins #Volume
🤔 $ZEC , vol $120M -4.51%
$XRP , vol $55M -1.24%
$ONE , vol $45M +17.90%
NEAR, vol $31M -1.23%
XAUT, vol $23M -0.06%
Big volume, but I'm not sure if it's buying or selling. What do you think? NFA, always DYOR.
#Altcoins #Volume
715

Ever wondered why a tiny dip can hide a massive shift in market sentiment?
Right now $ETH is down ‑0.4% over 24 hours, trading around $2232.87 with a 24‑hr volume of $159 M. The price move looks modest, but the volume tells a different story. When volume spikes above the average, it confirms that traders are actively buying or selling, giving the price move credibility. In this case, the volume is well above the typical daily average, suggesting that the slight pull‑back is supported by strong participation—often a sign that the current trend could hold or even reverse if buying pressure continues.
If volume had been flat or falling while the price dropped, the move would likely be a false signal, prone to quick reversal. Watching the volume‑price relationship helps you avoid chasing noise and focus on moves backed by real market interest.
Do you check volume before entering a trade?
#CryptoEducation #Volume
We post every algo signal's REAL result openly and the full live track record + a free preview channel are in our bio/profile.
Ever wondered why a tiny dip can hide a massive shift in market sentiment?
Right now $ETH is down ‑0.4% over 24 hours, trading around $2232.87 with a 24‑hr volume of $159 M. The price move looks modest, but the volume tells a different story. When volume spikes above the average, it confirms that traders are actively buying or selling, giving the price move credibility. In this case, the volume is well above the typical daily average, suggesting that the slight pull‑back is supported by strong participation—often a sign that the current trend could hold or even reverse if buying pressure continues.
If volume had been flat or falling while the price dropped, the move would likely be a false signal, prone to quick reversal. Watching the volume‑price relationship helps you avoid chasing noise and focus on moves backed by real market interest.
Do you check volume before entering a trade?
#CryptoEducation #Volume
We post every algo signal's REAL result openly and the full live track record + a free preview channel are in our bio/profile.
Right now $ETH is down ‑0.4% over 24 hours, trading around $2232.87 with a 24‑hr volume of $159 M. The price move looks modest, but the volume tells a different story. When volume spikes above the average, it confirms that traders are actively buying or selling, giving the price move credibility. In this case, the volume is well above the typical daily average, suggesting that the slight pull‑back is supported by strong participation—often a sign that the current trend could hold or even reverse if buying pressure continues.
If volume had been flat or falling while the price dropped, the move would likely be a false signal, prone to quick reversal. Watching the volume‑price relationship helps you avoid chasing noise and focus on moves backed by real market interest.
Do you check volume before entering a trade?
#CryptoEducation #Volume
We post every algo signal's REAL result openly and the full live track record + a free preview channel are in our bio/profile.
25

·
--
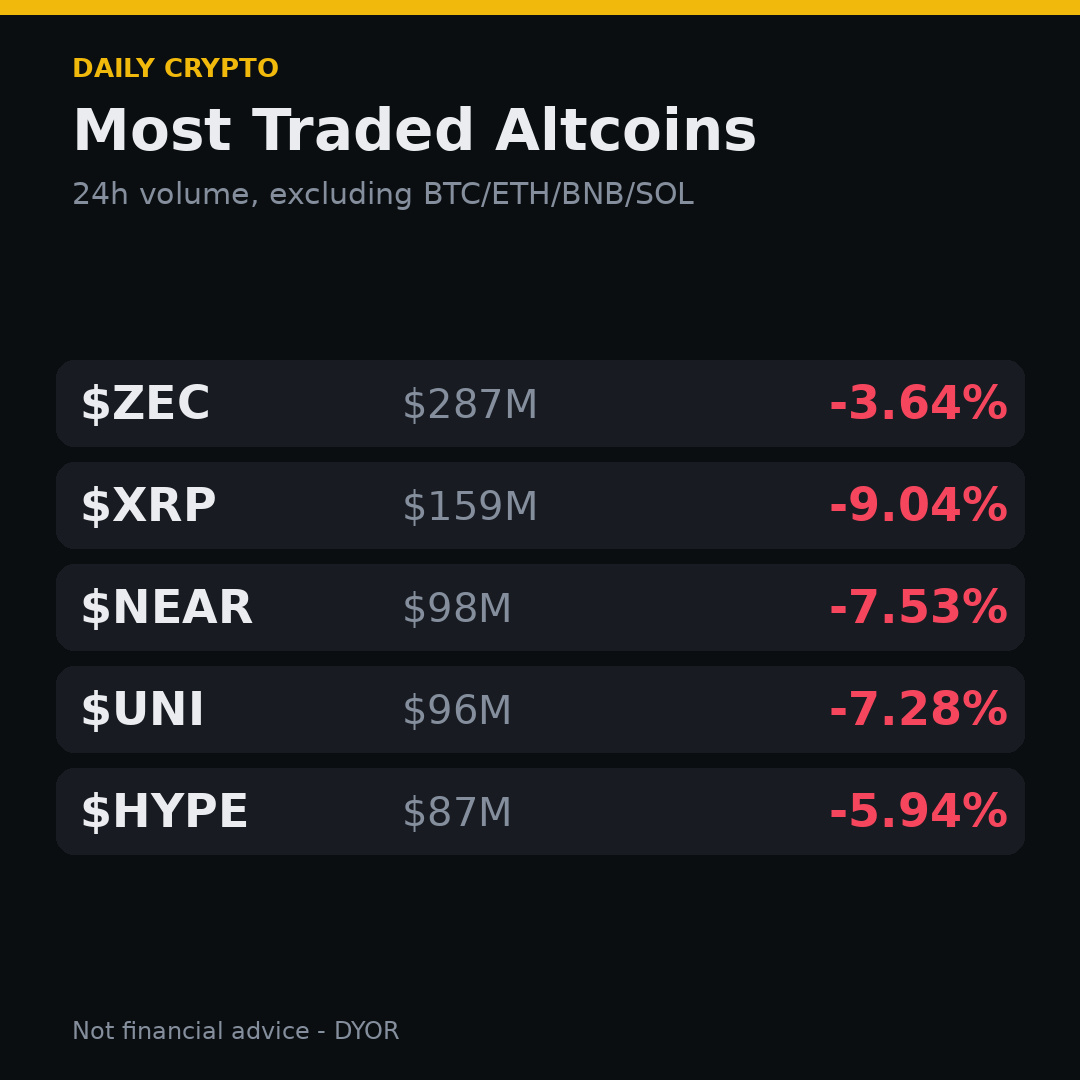
Just skimmed the 24h alt trade board 😐, all red.
$ZEC, vol $287M 🔴 down 3.64%
$XRP, vol $159M 🔴 down 9.04%
$NEAR, vol $98M 🔴 down 7.53%
UNI, vol $96M 🔴 down 7.28%
HYPE, vol $87M 🔴 down 5.94%
Big volume catches eyes. Accumulation or distribution? NFA, DYOR.
What do you think?
#Altcoins #Volume
Just skimmed the 24h alt trade board 😐, all red.
$ZEC , vol $287M 🔴 down 3.64%
$XRP , vol $159M 🔴 down 9.04%
$NEAR , vol $98M 🔴 down 7.53%
UNI, vol $96M 🔴 down 7.28%
HYPE, vol $87M 🔴 down 5.94%
Big volume catches eyes. Accumulation or distribution? NFA, DYOR.
What do you think?
#Altcoins #Volume
$ZEC , vol $287M 🔴 down 3.64%
$XRP , vol $159M 🔴 down 9.04%
$NEAR , vol $98M 🔴 down 7.53%
UNI, vol $96M 🔴 down 7.28%
HYPE, vol $87M 🔴 down 5.94%
Big volume catches eyes. Accumulation or distribution? NFA, DYOR.
What do you think?
#Altcoins #Volume
582

noticed a lot of action on the smaller alts yesterday.
$ZEC, vol $269M 🔴 down 3.05%
$XRP, vol $145M 🔴 down 8.11%
$UNI, vol $99M 🔴 down 9.59%
NEAR, vol $90M 🔴 down 9.09%
HYPE, vol $80M 🔴 down 6.97%
big volume, but is it accumulation or distribution? just wondering. not financial advice, DYOR 🙏
#Altcoins #Volume
noticed a lot of action on the smaller alts yesterday.
$ZEC , vol $269M 🔴 down 3.05%
$XRP , vol $145M 🔴 down 8.11%
$UNI , vol $99M 🔴 down 9.59%
NEAR, vol $90M 🔴 down 9.09%
HYPE, vol $80M 🔴 down 6.97%
big volume, but is it accumulation or distribution? just wondering. not financial advice, DYOR 🙏
#Altcoins #Volume
$ZEC , vol $269M 🔴 down 3.05%
$XRP , vol $145M 🔴 down 8.11%
$UNI , vol $99M 🔴 down 9.59%
NEAR, vol $90M 🔴 down 9.09%
HYPE, vol $80M 🔴 down 6.97%
big volume, but is it accumulation or distribution? just wondering. not financial advice, DYOR 🙏
#Altcoins #Volume
394
·
--
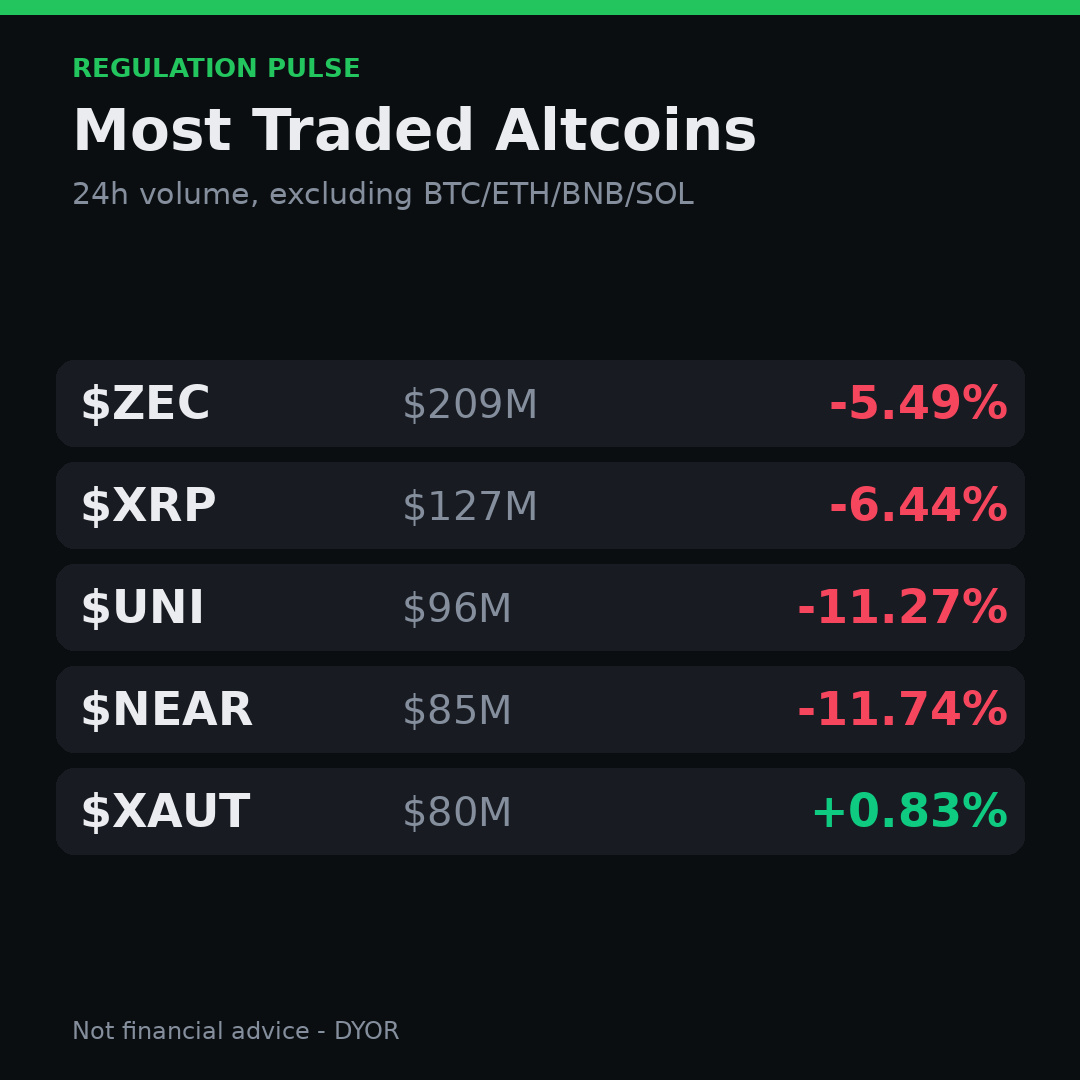
Seeing the 24 hour trade flow, I'm noting which altcoins are pulling the most volume after we strip out the big guys. $ZEC, vol $209M, down 5.49%; $XRP, vol $127M, down 6.44%; $UNI, vol $96M, down 11.27%; NEAR, vol $85M, down 11.74%; XAUT, vol $80M, up 0.83%.
Heavy volume usually means eyes are on the market, could be people loading up or unloading. I'm watching whether this signals a shift in sentiment or just short-term noise. NFA, always DYOR.
What do you think the market's intention is behind this burst of activity?
#Altcoins #Volume
Seeing the 24 hour trade flow, I'm noting which altcoins are pulling the most volume after we strip out the big guys. $ZEC , vol $209M, down 5.49%; $XRP , vol $127M, down 6.44%; $UNI , vol $96M, down 11.27%; NEAR, vol $85M, down 11.74%; XAUT, vol $80M, up 0.83%.
Heavy volume usually means eyes are on the market, could be people loading up or unloading. I'm watching whether this signals a shift in sentiment or just short-term noise. NFA, always DYOR.
What do you think the market's intention is behind this burst of activity?
#Altcoins #Volume
Heavy volume usually means eyes are on the market, could be people loading up or unloading. I'm watching whether this signals a shift in sentiment or just short-term noise. NFA, always DYOR.
What do you think the market's intention is behind this burst of activity?
#Altcoins #Volume
683

·
--
🚀 $BTC BREAKOUT SEEKING VOLUME POWER! 📈
📊 Volume’s the silent engine behind any real rally – the price can flash, but without heft, the move fizzles.
On the 4‑hour chart the breakout just cracked resistance, yet the order flow shows a thin buying wall. If smart money drops a wave of buy pressure now, we could see the next leg punch through the 27k‑28k ceiling 🦈.
⚡ Watch the depth: a sudden surge in bid size would be the catalyst to lock in the upside, while a lack of follow‑through signals a quick retreat.
💬 Do you see the volume building enough to fuel the next push? 👇
⚠️ Not financial advice. Always manage your risk. 🛡️
🏷️ #BTC #Breakout #Volume #Crypto
🚀 🔥
🚀 $BTC BREAKOUT SEEKING VOLUME POWER! 📈
📊 Volume’s the silent engine behind any real rally – the price can flash, but without heft, the move fizzles.
On the 4‑hour chart the breakout just cracked resistance, yet the order flow shows a thin buying wall. If smart money drops a wave of buy pressure now, we could see the next leg punch through the 27k‑28k ceiling 🦈.
⚡ Watch the depth: a sudden surge in bid size would be the catalyst to lock in the upside, while a lack of follow‑through signals a quick retreat.
💬 Do you see the volume building enough to fuel the next push? 👇
⚠️ Not financial advice. Always manage your risk. 🛡️
🏷️ #BTC #Breakout #Volume #Crypto
🚀 🔥
📊 Volume’s the silent engine behind any real rally – the price can flash, but without heft, the move fizzles.
On the 4‑hour chart the breakout just cracked resistance, yet the order flow shows a thin buying wall. If smart money drops a wave of buy pressure now, we could see the next leg punch through the 27k‑28k ceiling 🦈.
⚡ Watch the depth: a sudden surge in bid size would be the catalyst to lock in the upside, while a lack of follow‑through signals a quick retreat.
💬 Do you see the volume building enough to fuel the next push? 👇
⚠️ Not financial advice. Always manage your risk. 🛡️
🏷️ #BTC #Breakout #Volume #Crypto
🚀 🔥
2

·
--
🚨 SNDKB is crashing! Down 18.6% in 24H and another 9.8% in 1H, with 5-minute trading volume briefly surging to 15.7×!
But here's what's interesting: the price broke below the 90-day low of 1015.56 and the 1000 mark on heavy volume. Daily trading value reached 1.9× the average, retail sentiment was even 8.3× bearish, and there were only 21 discussions on Square in 4 hours—almost unanimously bearish.
📊 What does this mean? Selling pressure is indeed accelerating, but sentiment is also extremely one-sided. Shorting now could mean chasing the tail end of a panic sell-off; rushing to buy the dip could make you the next bagholder in another leg down.
🎯 Key levels:
Resistance: 981 / 1000 / 1015.56
Watch zone: 972–1006
A rebound is only confirmed if it gets back above 1000 and then reclaims 1015.56.
My take: The trend is bearish, but I don't recommend blindly chasing shorts! If it breaks below 972, watch out for further lows; if it recovers 1000 on heavy volume, the bearish thesis needs to be reassessed.
Do you think SNDKB will reclaim 1015.56 first, or continue to lose 972? 👇
#breakdown #volume-spike
🚨 SNDKB is crashing! Down 18.6% in 24H and another 9.8% in 1H, with 5-minute trading volume briefly surging to 15.7×!
But here's what's interesting: the price broke below the 90-day low of 1015.56 and the 1000 mark on heavy volume. Daily trading value reached 1.9× the average, retail sentiment was even 8.3× bearish, and there were only 21 discussions on Square in 4 hours—almost unanimously bearish.
📊 What does this mean? Selling pressure is indeed accelerating, but sentiment is also extremely one-sided. Shorting now could mean chasing the tail end of a panic sell-off; rushing to buy the dip could make you the next bagholder in another leg down.
🎯 Key levels:
Resistance: 981 / 1000 / 1015.56
Watch zone: 972–1006
A rebound is only confirmed if it gets back above 1000 and then reclaims 1015.56.
My take: The trend is bearish, but I don't recommend blindly chasing shorts! If it breaks below 972, watch out for further lows; if it recovers 1000 on heavy volume, the bearish thesis needs to be reassessed.
Do you think SNDKB will reclaim 1015.56 first, or continue to lose 972? 👇
#breakdown #volume-spike
But here's what's interesting: the price broke below the 90-day low of 1015.56 and the 1000 mark on heavy volume. Daily trading value reached 1.9× the average, retail sentiment was even 8.3× bearish, and there were only 21 discussions on Square in 4 hours—almost unanimously bearish.
📊 What does this mean? Selling pressure is indeed accelerating, but sentiment is also extremely one-sided. Shorting now could mean chasing the tail end of a panic sell-off; rushing to buy the dip could make you the next bagholder in another leg down.
🎯 Key levels:
Resistance: 981 / 1000 / 1015.56
Watch zone: 972–1006
A rebound is only confirmed if it gets back above 1000 and then reclaims 1015.56.
My take: The trend is bearish, but I don't recommend blindly chasing shorts! If it breaks below 972, watch out for further lows; if it recovers 1000 on heavy volume, the bearish thesis needs to be reassessed.
Do you think SNDKB will reclaim 1015.56 first, or continue to lose 972? 👇
#breakdown #volume-spike
2
·
--
🚨 SNDKB is crashing! Down 19.4% in 24H, with another 10.8% drop in 1 hour—bears have smashed straight through a key level!
But here's what's interesting: this isn't a slow decline on light volume. Trading volume surged 11.9x, briefly hitting 15.7x over 5 minutes; bearish sentiment among retail traders also surged to 12.0× over 24 hours, with the community almost unanimously bearish.
📊 What does this mean? The price has broken below the 90-day low of 1015.56 and the 1000 psychological level on heavy volume. The biggest risk isn't getting the direction wrong—it's thinking the price has fallen far enough to bounce, only to catch a falling knife and get hit by another wave of long liquidations.
🎯 Key levels:
Resistance: 1000 / 1015.56
Watch zone: 972—1006
A rebound can only be confirmed if the price climbs back above 1000 and then reclaims 1015.56.
My view: The trend is bearish, so don't rush to buy the dip! A recovery above 1000 on strong volume could ease the decline; if the rebound fails and the price drops below 972, the risk of further losses shouldn't be underestimated.
Do you think SNDKB will rebound and get back above 1000, or keep falling toward 972? 👇
#breakdown #volume-spike
🚨 SNDKB is crashing! Down 19.4% in 24H, with another 10.8% drop in 1 hour—bears have smashed straight through a key level!
But here's what's interesting: this isn't a slow decline on light volume. Trading volume surged 11.9x, briefly hitting 15.7x over 5 minutes; bearish sentiment among retail traders also surged to 12.0× over 24 hours, with the community almost unanimously bearish.
📊 What does this mean? The price has broken below the 90-day low of 1015.56 and the 1000 psychological level on heavy volume. The biggest risk isn't getting the direction wrong—it's thinking the price has fallen far enough to bounce, only to catch a falling knife and get hit by another wave of long liquidations.
🎯 Key levels:
Resistance: 1000 / 1015.56
Watch zone: 972—1006
A rebound can only be confirmed if the price climbs back above 1000 and then reclaims 1015.56.
My view: The trend is bearish, so don't rush to buy the dip! A recovery above 1000 on strong volume could ease the decline; if the rebound fails and the price drops below 972, the risk of further losses shouldn't be underestimated.
Do you think SNDKB will rebound and get back above 1000, or keep falling toward 972? 👇
#breakdown #volume-spike
But here's what's interesting: this isn't a slow decline on light volume. Trading volume surged 11.9x, briefly hitting 15.7x over 5 minutes; bearish sentiment among retail traders also surged to 12.0× over 24 hours, with the community almost unanimously bearish.
📊 What does this mean? The price has broken below the 90-day low of 1015.56 and the 1000 psychological level on heavy volume. The biggest risk isn't getting the direction wrong—it's thinking the price has fallen far enough to bounce, only to catch a falling knife and get hit by another wave of long liquidations.
🎯 Key levels:
Resistance: 1000 / 1015.56
Watch zone: 972—1006
A rebound can only be confirmed if the price climbs back above 1000 and then reclaims 1015.56.
My view: The trend is bearish, so don't rush to buy the dip! A recovery above 1000 on strong volume could ease the decline; if the rebound fails and the price drops below 972, the risk of further losses shouldn't be underestimated.
Do you think SNDKB will rebound and get back above 1000, or keep falling toward 972? 👇
#breakdown #volume-spike
3
·
--
🚨 SNDKB is crashing! Down 20.7% in 24H, then plunged another 11.4% in 1H—bears are accelerating!
But what’s really alarming is this: trading volume surged 7.1×, briefly hitting 15.7× in 5m; retail sentiment is 12.0× bearish, with 21 mentions in the discussion section over 4 hours—almost unanimously bearish.
📊 What does this mean? This isn’t a quiet, slow bleed with nobody trading—it’s a high-volume sell-off. The biggest danger isn’t getting the direction wrong; it’s thinking an oversold bounce is coming, only to catch the knife halfway down.
🎯 Key levels:
Resistance: $1000 / $1015.56
Watch: $981
A high-volume move back above $1015.56 would be the first sign of a bottom.
My take: The trend is clearly bearish. Absolutely don’t blindly buy the dip! If a rebound can’t reclaim $1000, watch out for further downside; only a sustained move back above $1015.56 would weaken the bears’ advantage.
Do you think SNDKB will rebound to $1015.56 first, or break below $1000 and continue weakening? 👇
#SNDKB #breakdown #volume-spike
🚨 SNDKB is crashing! Down 20.7% in 24H, then plunged another 11.4% in 1H—bears are accelerating!
But what’s really alarming is this: trading volume surged 7.1×, briefly hitting 15.7× in 5m; retail sentiment is 12.0× bearish, with 21 mentions in the discussion section over 4 hours—almost unanimously bearish.
📊 What does this mean? This isn’t a quiet, slow bleed with nobody trading—it’s a high-volume sell-off. The biggest danger isn’t getting the direction wrong; it’s thinking an oversold bounce is coming, only to catch the knife halfway down.
🎯 Key levels:
Resistance: $1000 / $1015.56
Watch: $981
A high-volume move back above $1015.56 would be the first sign of a bottom.
My take: The trend is clearly bearish. Absolutely don’t blindly buy the dip! If a rebound can’t reclaim $1000, watch out for further downside; only a sustained move back above $1015.56 would weaken the bears’ advantage.
Do you think SNDKB will rebound to $1015.56 first, or break below $1000 and continue weakening? 👇
#SNDKB #breakdown #volume-spike
But what’s really alarming is this: trading volume surged 7.1×, briefly hitting 15.7× in 5m; retail sentiment is 12.0× bearish, with 21 mentions in the discussion section over 4 hours—almost unanimously bearish.
📊 What does this mean? This isn’t a quiet, slow bleed with nobody trading—it’s a high-volume sell-off. The biggest danger isn’t getting the direction wrong; it’s thinking an oversold bounce is coming, only to catch the knife halfway down.
🎯 Key levels:
Resistance: $1000 / $1015.56
Watch: $981
A high-volume move back above $1015.56 would be the first sign of a bottom.
My take: The trend is clearly bearish. Absolutely don’t blindly buy the dip! If a rebound can’t reclaim $1000, watch out for further downside; only a sustained move back above $1015.56 would weaken the bears’ advantage.
Do you think SNDKB will rebound to $1015.56 first, or break below $1000 and continue weakening? 👇
#SNDKB #breakdown #volume-spike
22

·
--
$ETH traded about $335M on Binance spot yesterday. Its 30-day daily average is roughly $595M. That's a 44% gap, and most people only looked at the price.
Volume is the part of the chart that tells you how much conviction sits behind a move. A quick framework I keep coming back to:
1. Price up + volume up = real demand. Buyers are paying up, and breakouts on this combo tend to hold better.
2. Price up + volume down = thin air. The move can continue, but it's fragile and easy to reverse.
3. Price down + volume up = distribution or capitulation. Watch whether the next candles absorb the selling.
4. Price down + volume down = no one cares yet. Usually chop, not a trend.
Right now ETH sits near 2,280, up about 1% on the day, with volume well under average. That's case 2: a quiet grind, not a confirmed push. Same story on BTC, where yesterday's ~$969M also came in below its ~$1.14B monthly average.
Practical habits:
- Compare volume to its own average, never to another coin.
- A breakout without a volume expansion deserves a smaller position, or a wait.
- Low-volume ranges often end with a sharp move. Plan both directions before it happens.
Do you check volume before entering, or just price?
Not financial advice.
#TradingTips #CryptoEducation #Volume
$ETH traded about $335M on Binance spot yesterday. Its 30-day daily average is roughly $595M. That's a 44% gap, and most people only looked at the price.
Volume is the part of the chart that tells you how much conviction sits behind a move. A quick framework I keep coming back to:
1. Price up + volume up = real demand. Buyers are paying up, and breakouts on this combo tend to hold better.
2. Price up + volume down = thin air. The move can continue, but it's fragile and easy to reverse.
3. Price down + volume up = distribution or capitulation. Watch whether the next candles absorb the selling.
4. Price down + volume down = no one cares yet. Usually chop, not a trend.
Right now ETH sits near 2,280, up about 1% on the day, with volume well under average. That's case 2: a quiet grind, not a confirmed push. Same story on BTC, where yesterday's ~$969M also came in below its ~$1.14B monthly average.
Practical habits:
- Compare volume to its own average, never to another coin.
- A breakout without a volume expansion deserves a smaller position, or a wait.
- Low-volume ranges often end with a sharp move. Plan both directions before it happens.
Do you check volume before entering, or just price?
Not financial advice.
#TradingTips #CryptoEducation #Volume
Volume is the part of the chart that tells you how much conviction sits behind a move. A quick framework I keep coming back to:
1. Price up + volume up = real demand. Buyers are paying up, and breakouts on this combo tend to hold better.
2. Price up + volume down = thin air. The move can continue, but it's fragile and easy to reverse.
3. Price down + volume up = distribution or capitulation. Watch whether the next candles absorb the selling.
4. Price down + volume down = no one cares yet. Usually chop, not a trend.
Right now ETH sits near 2,280, up about 1% on the day, with volume well under average. That's case 2: a quiet grind, not a confirmed push. Same story on BTC, where yesterday's ~$969M also came in below its ~$1.14B monthly average.
Practical habits:
- Compare volume to its own average, never to another coin.
- A breakout without a volume expansion deserves a smaller position, or a wait.
- Low-volume ranges often end with a sharp move. Plan both directions before it happens.
Do you check volume before entering, or just price?
Not financial advice.
#TradingTips #CryptoEducation #Volume
7
Most traders panic when a coin drops 4%. Smart traders look at volume first.
$NEAR is down -3.9% over 24h, sitting at $3.856. But here's the key detail: its 24h volume is $91M. That number tells us whether the move is real or just noise.
**The concept: Volume Confirmation**
Volume is the fuel behind price movement. When price drops on HIGH volume, it means large sellers are actively dumping. When price drops on LOW volume, it often means a lack of buyers, not aggressive selling.
Right now, $NEAR's $91M volume needs context. Compare it to the previous 24h. If volume is decreasing while price drops, the selling pressure is likely exhausted. If volume is spiking, the downtrend has real conviction behind it.
This simple check prevents you from selling into a fakeout or buying into a genuine cascade. Always pair price action with volume before making a move.
What’s your go-to volume indicator for confirming a trend? Drop it below.
We post every algo signal's real result openly and the full live track record plus a free preview channel are in our bio/profile.
#Volume #TradingStrategy
Most traders panic when a coin drops 4%. Smart traders look at volume first.
$NEAR is down -3.9% over 24h, sitting at $3.856. But here's the key detail: its 24h volume is $91M. That number tells us whether the move is real or just noise.
**The concept: Volume Confirmation**
Volume is the fuel behind price movement. When price drops on HIGH volume, it means large sellers are actively dumping. When price drops on LOW volume, it often means a lack of buyers, not aggressive selling.
Right now, $NEAR 's $91M volume needs context. Compare it to the previous 24h. If volume is decreasing while price drops, the selling pressure is likely exhausted. If volume is spiking, the downtrend has real conviction behind it.
This simple check prevents you from selling into a fakeout or buying into a genuine cascade. Always pair price action with volume before making a move.
What’s your go-to volume indicator for confirming a trend? Drop it below.
We post every algo signal's real result openly and the full live track record plus a free preview channel are in our bio/profile.
#Volume #TradingStrategy
$NEAR is down -3.9% over 24h, sitting at $3.856. But here's the key detail: its 24h volume is $91M. That number tells us whether the move is real or just noise.
**The concept: Volume Confirmation**
Volume is the fuel behind price movement. When price drops on HIGH volume, it means large sellers are actively dumping. When price drops on LOW volume, it often means a lack of buyers, not aggressive selling.
Right now, $NEAR 's $91M volume needs context. Compare it to the previous 24h. If volume is decreasing while price drops, the selling pressure is likely exhausted. If volume is spiking, the downtrend has real conviction behind it.
This simple check prevents you from selling into a fakeout or buying into a genuine cascade. Always pair price action with volume before making a move.
What’s your go-to volume indicator for confirming a trend? Drop it below.
We post every algo signal's real result openly and the full live track record plus a free preview channel are in our bio/profile.
#Volume #TradingStrategy
30

·
--
🚀 $BTC BREAKOUT SEEKING VOLUME CONFIRMATION 🟢
📊 The 4H chart is flashing a classic liquidity sweep, but the real litmus test is the order flow. ⚡ Volume has been expanding on each candle, suggesting smart money is positioning behind the move. 🌊 If the buying pressure holds, the demand block at the recent swing low could become a launchpad for the next leg.
📌 Watch the 200‑EMA for a potential re‑entry zone; a decisive close above it would signal the institutional hand fully committing. 💡 The risk‑reward remains attractive as long as the volume stays bullish.
💬 Do you see enough buying pressure to sustain the rally? 👇
⚠️ Not financial advice. Always manage your risk. 🛡️
🏷️ #BTC #Breakout #Volume #Crypto
🚀 ⚡
🚀 $BTC BREAKOUT SEEKING VOLUME CONFIRMATION 🟢
📊 The 4H chart is flashing a classic liquidity sweep, but the real litmus test is the order flow. ⚡ Volume has been expanding on each candle, suggesting smart money is positioning behind the move. 🌊 If the buying pressure holds, the demand block at the recent swing low could become a launchpad for the next leg.
📌 Watch the 200‑EMA for a potential re‑entry zone; a decisive close above it would signal the institutional hand fully committing. 💡 The risk‑reward remains attractive as long as the volume stays bullish.
💬 Do you see enough buying pressure to sustain the rally? 👇
⚠️ Not financial advice. Always manage your risk. 🛡️
🏷️ #BTC #Breakout #Volume #Crypto
🚀 ⚡
📊 The 4H chart is flashing a classic liquidity sweep, but the real litmus test is the order flow. ⚡ Volume has been expanding on each candle, suggesting smart money is positioning behind the move. 🌊 If the buying pressure holds, the demand block at the recent swing low could become a launchpad for the next leg.
📌 Watch the 200‑EMA for a potential re‑entry zone; a decisive close above it would signal the institutional hand fully committing. 💡 The risk‑reward remains attractive as long as the volume stays bullish.
💬 Do you see enough buying pressure to sustain the rally? 👇
⚠️ Not financial advice. Always manage your risk. 🛡️
🏷️ #BTC #Breakout #Volume #Crypto
🚀 ⚡
1
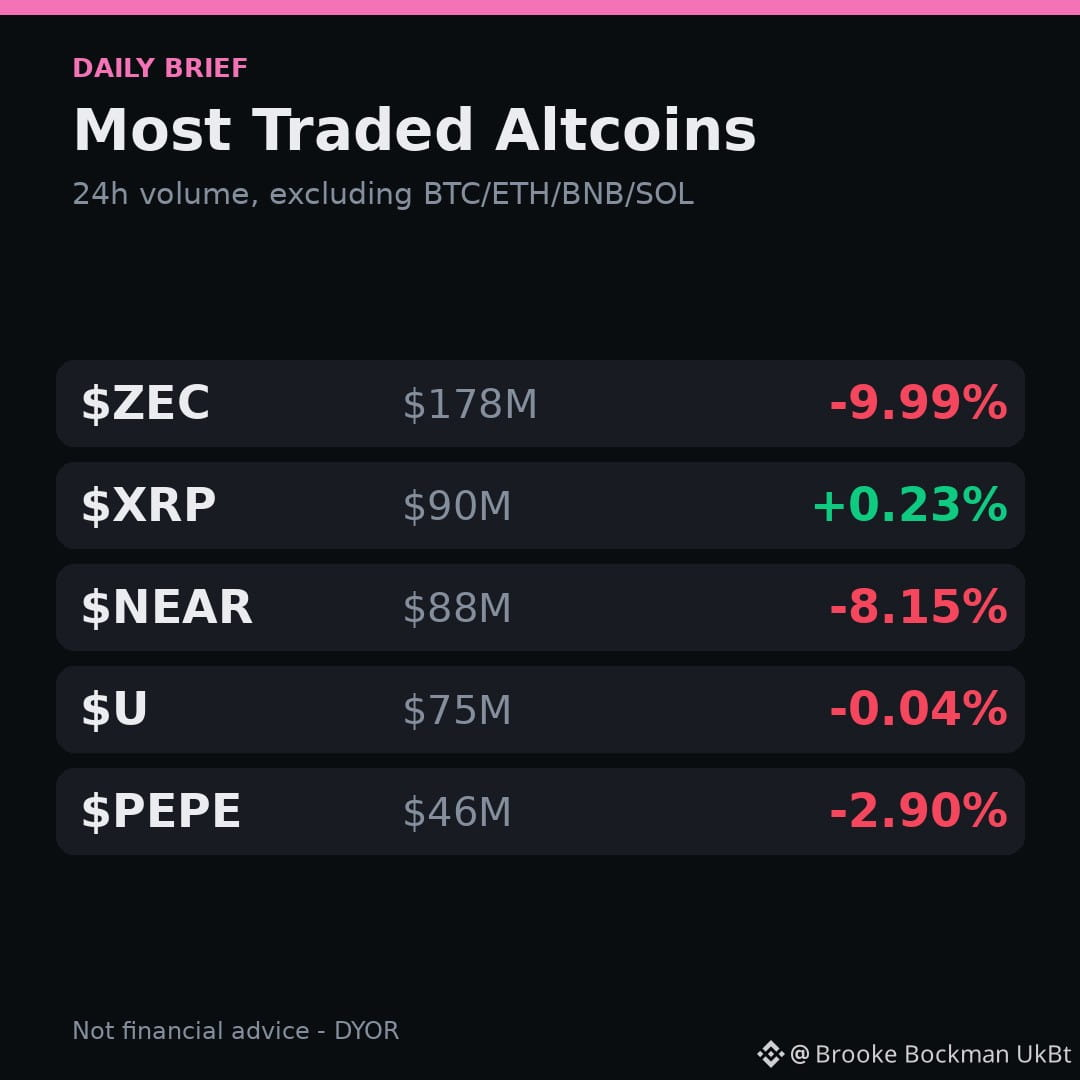
Here's the quick look at the altcoins pulling the most trade action (aside from BTC, ETH, BNB, SOL).
$ZEC, vol $178M down 9.99%
$XRP, vol $90M up 0.23%
NEAR, vol $88M down 8.15%
$U, vol $75M down 0.04%
PEPE, vol $46M down 2.90%
Big volume usually means big attention. Is it accumulation or distribution? 📊 nfa, dyor
Which side are you leaning toward?
#Altcoins #Volume
Here's the quick look at the altcoins pulling the most trade action (aside from BTC, ETH, BNB, SOL).
$ZEC , vol $178M down 9.99%
$XRP , vol $90M up 0.23%
NEAR, vol $88M down 8.15%
$U , vol $75M down 0.04%
PEPE, vol $46M down 2.90%
Big volume usually means big attention. Is it accumulation or distribution? 📊 nfa, dyor
Which side are you leaning toward?
#Altcoins #Volume
$ZEC , vol $178M down 9.99%
$XRP , vol $90M up 0.23%
NEAR, vol $88M down 8.15%
$U , vol $75M down 0.04%
PEPE, vol $46M down 2.90%
Big volume usually means big attention. Is it accumulation or distribution? 📊 nfa, dyor
Which side are you leaning toward?
#Altcoins #Volume
404

·
--
Seeing ZEC lead the pack with $196M volume and down 7.82% feels odd.
$ZEC - $196M, down 7.82%
$NEAR - $101M, down 9.65%
XRP - $94M, down 0.11%
$U - $65M, down 0.03%
PEPE - $47M, down 3.06%
Big volume, but is it accumulation or distribution? Which side are you on?
Not financial advice. DYOR
#Altcoins #Volume
Seeing ZEC lead the pack with $196M volume and down 7.82% feels odd.
$ZEC - $196M, down 7.82%
$NEAR - $101M, down 9.65%
XRP - $94M, down 0.11%
$U - $65M, down 0.03%
PEPE - $47M, down 3.06%
Big volume, but is it accumulation or distribution? Which side are you on?
Not financial advice. DYOR
#Altcoins #Volume
$ZEC - $196M, down 7.82%
$NEAR - $101M, down 9.65%
XRP - $94M, down 0.11%
$U - $65M, down 0.03%
PEPE - $47M, down 3.06%
Big volume, but is it accumulation or distribution? Which side are you on?
Not financial advice. DYOR
#Altcoins #Volume
642
·
--
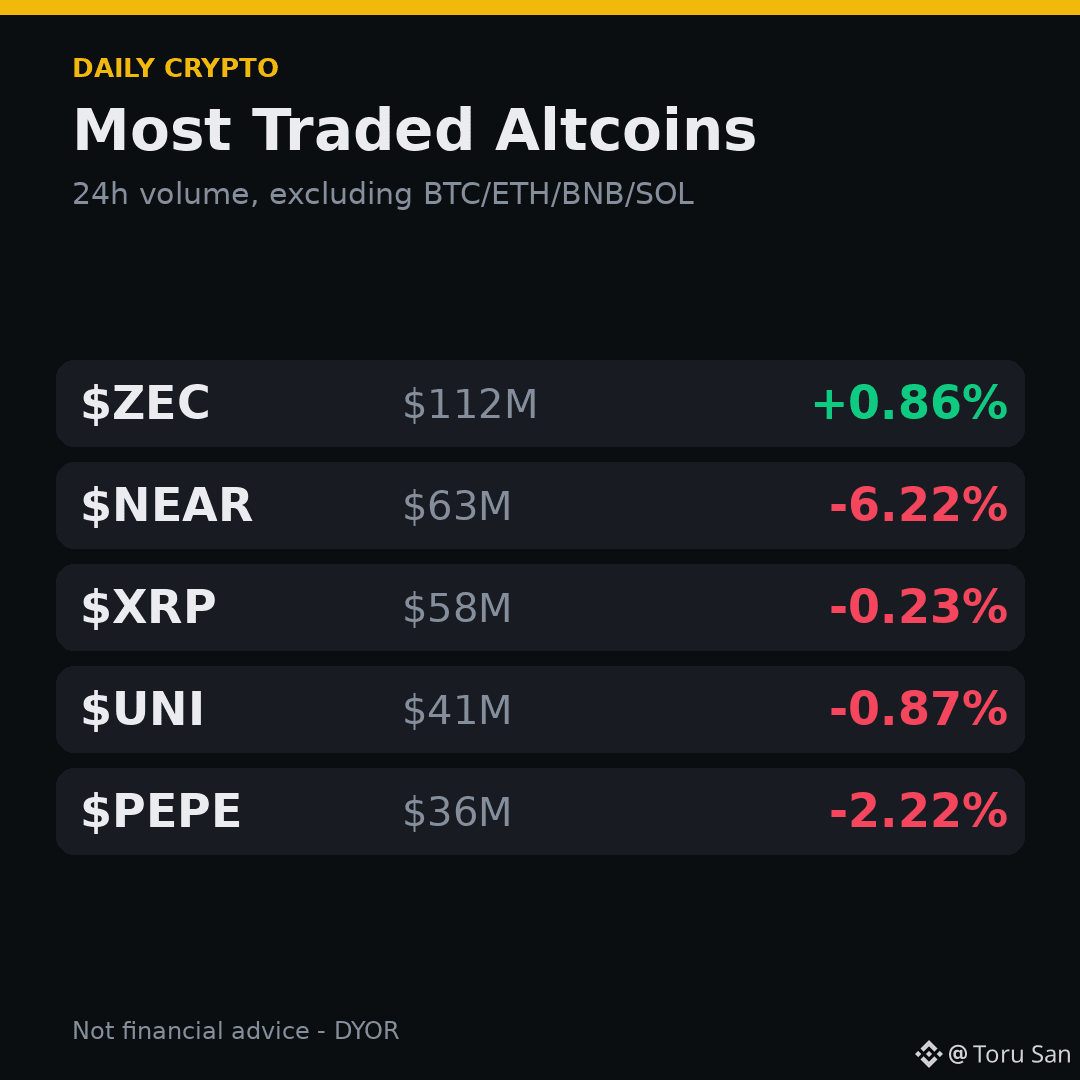
Just skimmed the 24h volume board and wow, the hype is still on. ZEC leads with $112M and a tiny uptick, while NEAR is sliding hard. XRP, UNI and PEPE are all down too. 🤔
$ZEC, vol $112M 🟢 +0.86%
$NEAR, vol $63M 🔴 -6.22%
$XRP, vol $58M 🔴 -0.23%
UNI, vol $41M 🔴 -0.87%
PEPE, vol $36M 🔴 -2.22%
Not financial advice. DYOR 🙏 What do you think is driving the moves?
#Altcoins #Volume
Just skimmed the 24h volume board and wow, the hype is still on. ZEC leads with $112M and a tiny uptick, while NEAR is sliding hard. XRP, UNI and PEPE are all down too. 🤔
$ZEC , vol $112M 🟢 +0.86%
$NEAR , vol $63M 🔴 -6.22%
$XRP , vol $58M 🔴 -0.23%
UNI, vol $41M 🔴 -0.87%
PEPE, vol $36M 🔴 -2.22%
Not financial advice. DYOR 🙏 What do you think is driving the moves?
#Altcoins #Volume
$ZEC , vol $112M 🟢 +0.86%
$NEAR , vol $63M 🔴 -6.22%
$XRP , vol $58M 🔴 -0.23%
UNI, vol $41M 🔴 -0.87%
PEPE, vol $36M 🔴 -2.22%
Not financial advice. DYOR 🙏 What do you think is driving the moves?
#Altcoins #Volume
389
Ever wondered why a tiny price bump can signal a bigger move? 📈
Ethereum is up +0.7% in the last 24 hours, trading at $2267.99 with a 24 h volume of $175 M. That volume is a crucial clue: when price rises *and* volume spikes, it confirms that buyers are truly stepping in, not just a fleeting scalp. Low volume on a rise often fizzles, but here the $175 M surge shows strong participation, increasing the odds of a sustained uptrend.
If volume had stayed flat, the move could've been a false breakout, but the heavy buying pressure validates the price action.
What volume pattern do you expect next for $ETH?
We post every algo signal's REAL result openly and the full live track record + a free preview channel are in our bio/profile. #CryptoEducation #Volume
Ever wondered why a tiny price bump can signal a bigger move? 📈
Ethereum is up +0.7% in the last 24 hours, trading at $2267.99 with a 24 h volume of $175 M. That volume is a crucial clue: when price rises *and* volume spikes, it confirms that buyers are truly stepping in, not just a fleeting scalp. Low volume on a rise often fizzles, but here the $175 M surge shows strong participation, increasing the odds of a sustained uptrend.
If volume had stayed flat, the move could've been a false breakout, but the heavy buying pressure validates the price action.
What volume pattern do you expect next for $ETH ?
We post every algo signal's REAL result openly and the full live track record + a free preview channel are in our bio/profile. #CryptoEducation #Volume
Ethereum is up +0.7% in the last 24 hours, trading at $2267.99 with a 24 h volume of $175 M. That volume is a crucial clue: when price rises *and* volume spikes, it confirms that buyers are truly stepping in, not just a fleeting scalp. Low volume on a rise often fizzles, but here the $175 M surge shows strong participation, increasing the odds of a sustained uptrend.
If volume had stayed flat, the move could've been a false breakout, but the heavy buying pressure validates the price action.
What volume pattern do you expect next for $ETH ?
We post every algo signal's REAL result openly and the full live track record + a free preview channel are in our bio/profile. #CryptoEducation #Volume
31
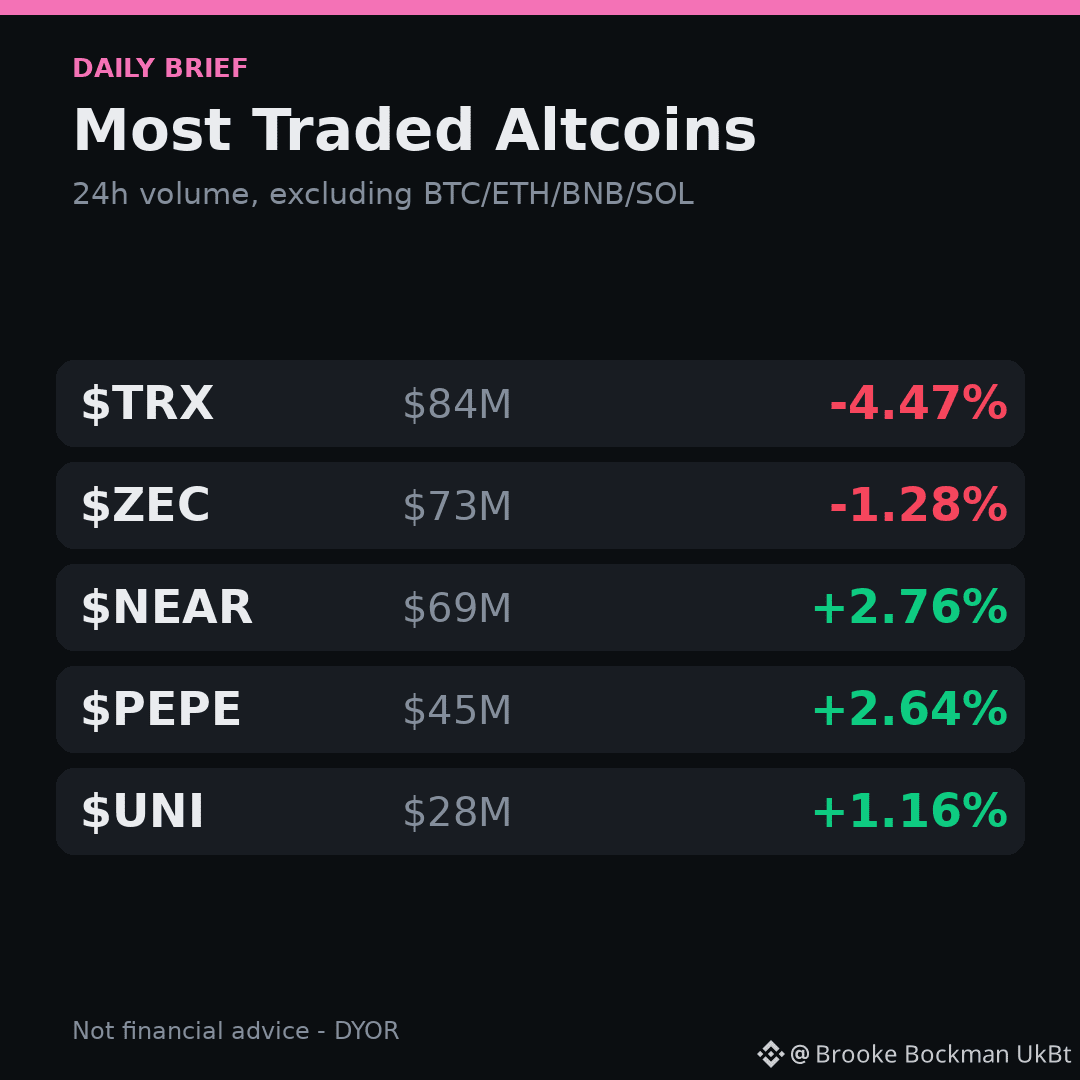
...noticed the altcoin hustle over the past day. Ignoring the usual BTC/ETH/BNB/SOL, the five most-traded tokens are pulling decent volume.
$TRX, vol $84M -4.47%
$ZEC, vol $73M -1.28%
$NEAR, vol $69M +2.76%
PEPE, vol $45M +2.64%
UNI, vol $28M +1.16%
Big numbers usually mean eyes are on them, maybe accumulation, maybe distribution, who knows. I'm just watching the flow, not making any moves. nfa, dyor. Any of these catching your eye?
#Altcoins #Volume
...noticed the altcoin hustle over the past day. Ignoring the usual BTC/ETH/BNB/SOL, the five most-traded tokens are pulling decent volume.
$TRX , vol $84M -4.47%
$ZEC , vol $73M -1.28%
$NEAR , vol $69M +2.76%
PEPE, vol $45M +2.64%
UNI, vol $28M +1.16%
Big numbers usually mean eyes are on them, maybe accumulation, maybe distribution, who knows. I'm just watching the flow, not making any moves. nfa, dyor. Any of these catching your eye?
#Altcoins #Volume
$TRX , vol $84M -4.47%
$ZEC , vol $73M -1.28%
$NEAR , vol $69M +2.76%
PEPE, vol $45M +2.64%
UNI, vol $28M +1.16%
Big numbers usually mean eyes are on them, maybe accumulation, maybe distribution, who knows. I'm just watching the flow, not making any moves. nfa, dyor. Any of these catching your eye?
#Altcoins #Volume
530


·
--
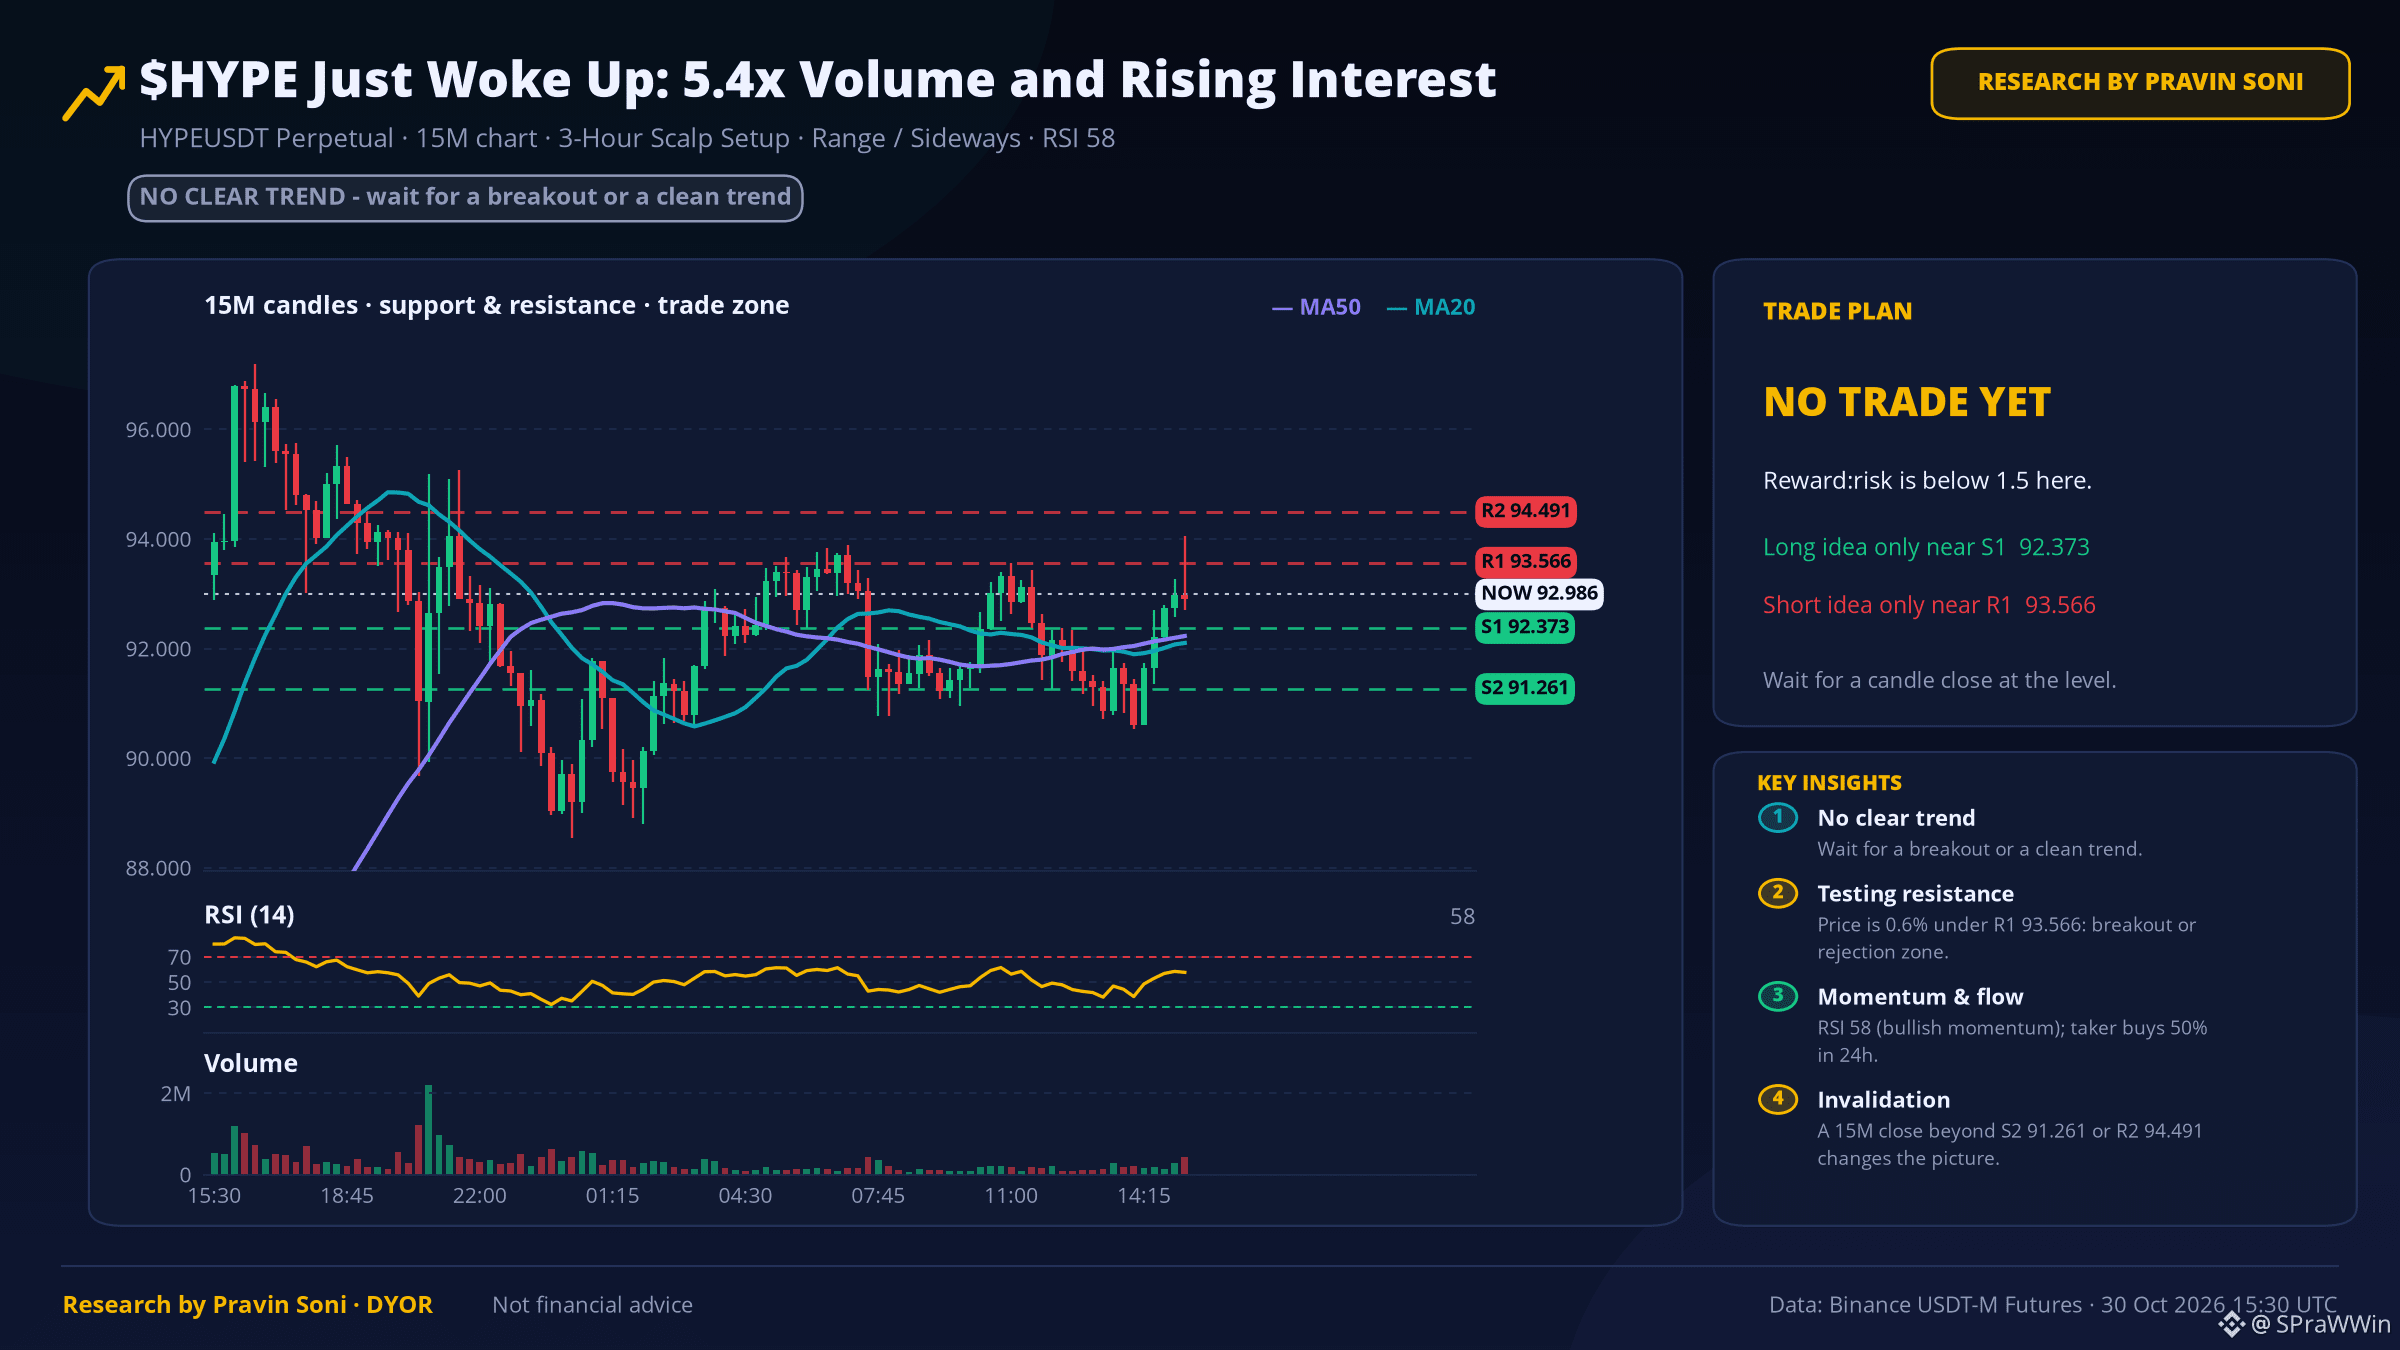
$HYPE Just Woke Up: 5.4x Volume and Rising Interest 📊
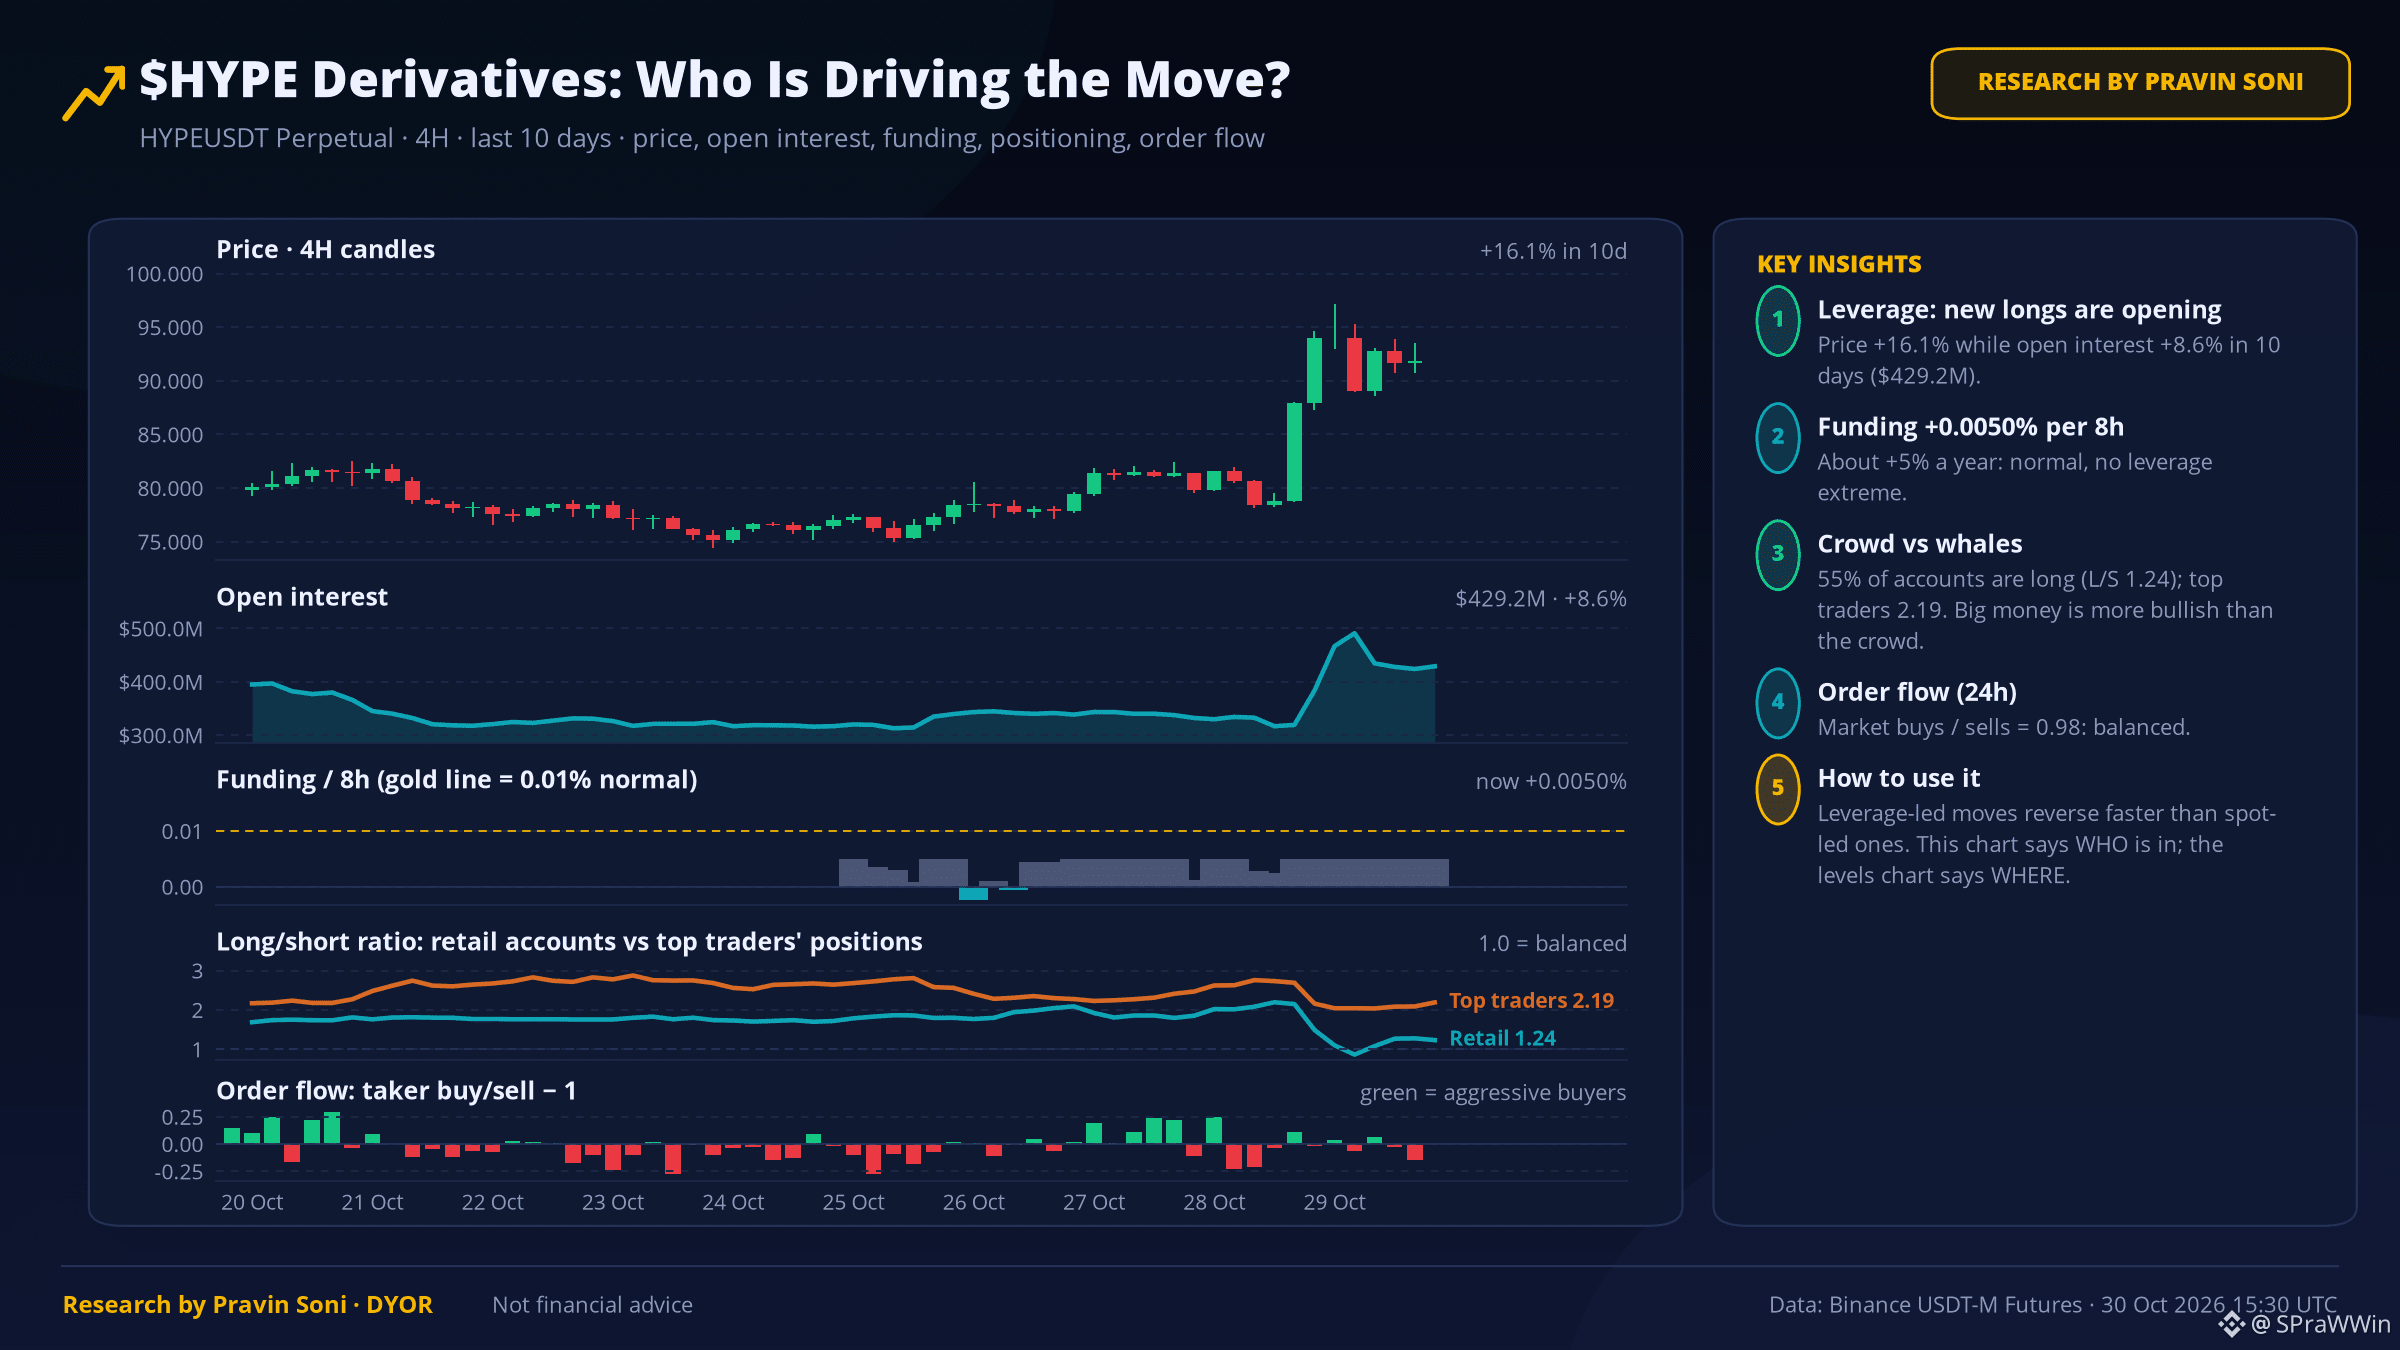
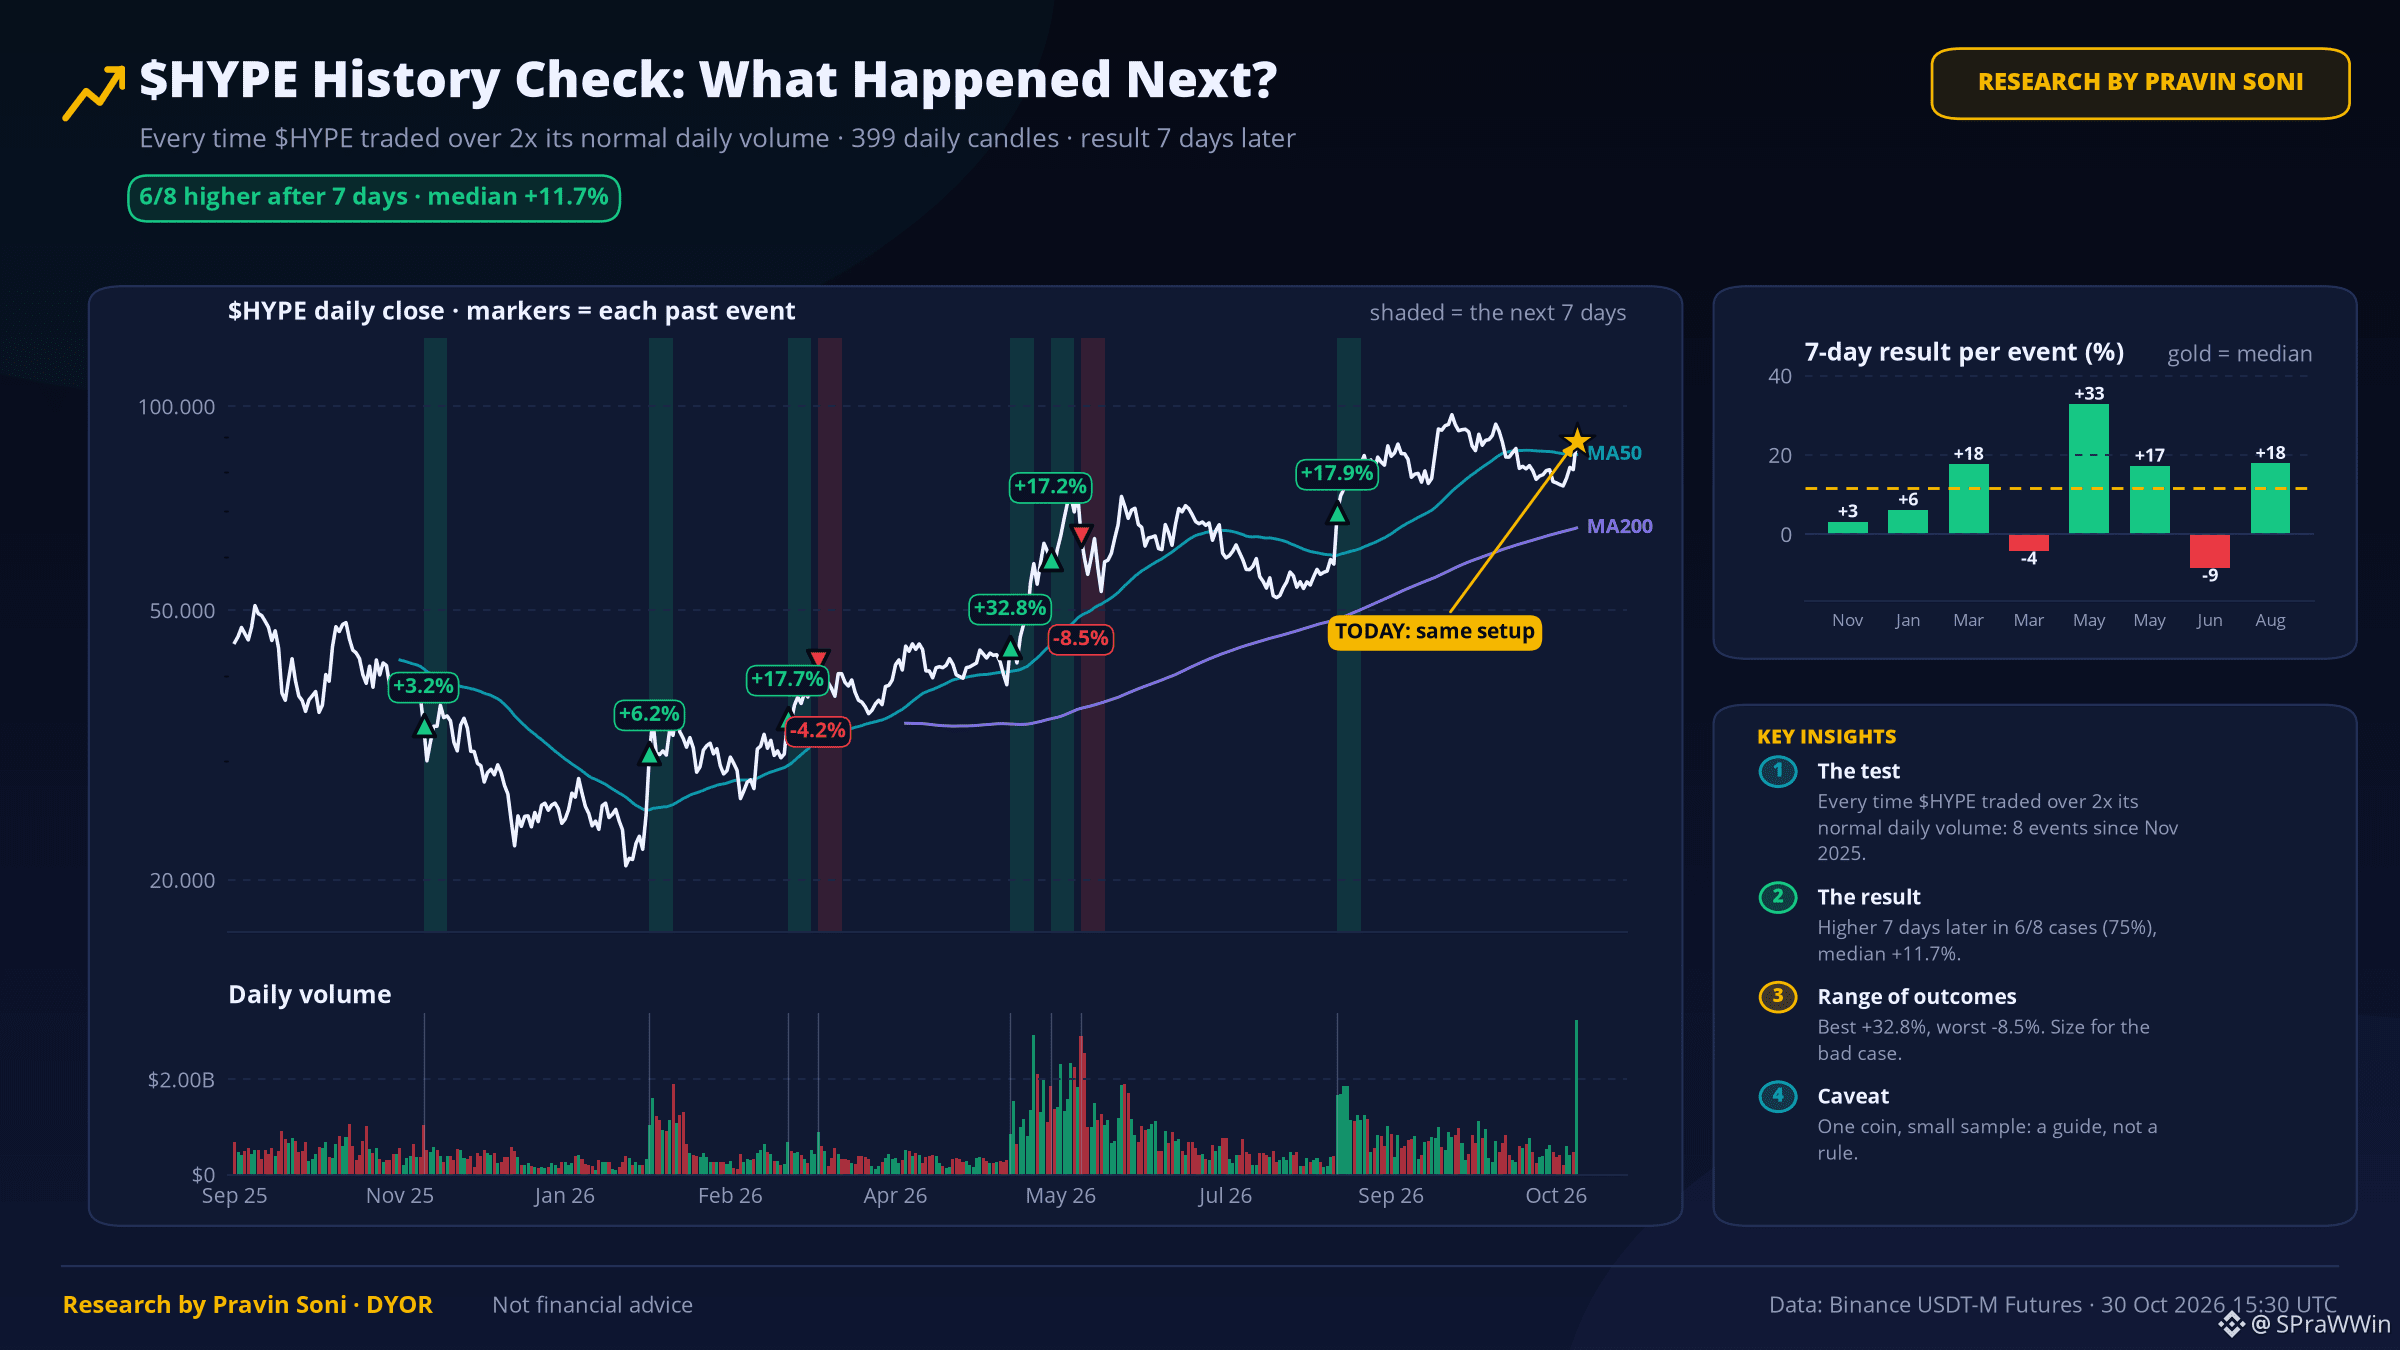
TL;DR: Volume 5.4x its 30-day average; top traders more bullish than the crowd. History leans up (6/8). Price 93.032, daily RSI 63.
🧩 The setup in 3 points
1️⃣ 24h volume is 5.4x the 30-day average — unusual attention on this coin.
2️⃣ Top traders' position ratio is 2.24 vs their account ratio 1.23 — big money is leaning long.
3️⃣ Over 30 days it is beating $BTC by 15.3 points (7D: +24.8).
📜 What history says
The last 8 times $HYPE traded over 2x its normal daily volume, it was higher 7 days later in 6 of 8 cases (median +11.7%). Small sample, so a guide, not a rule.
📐 How far could it move?
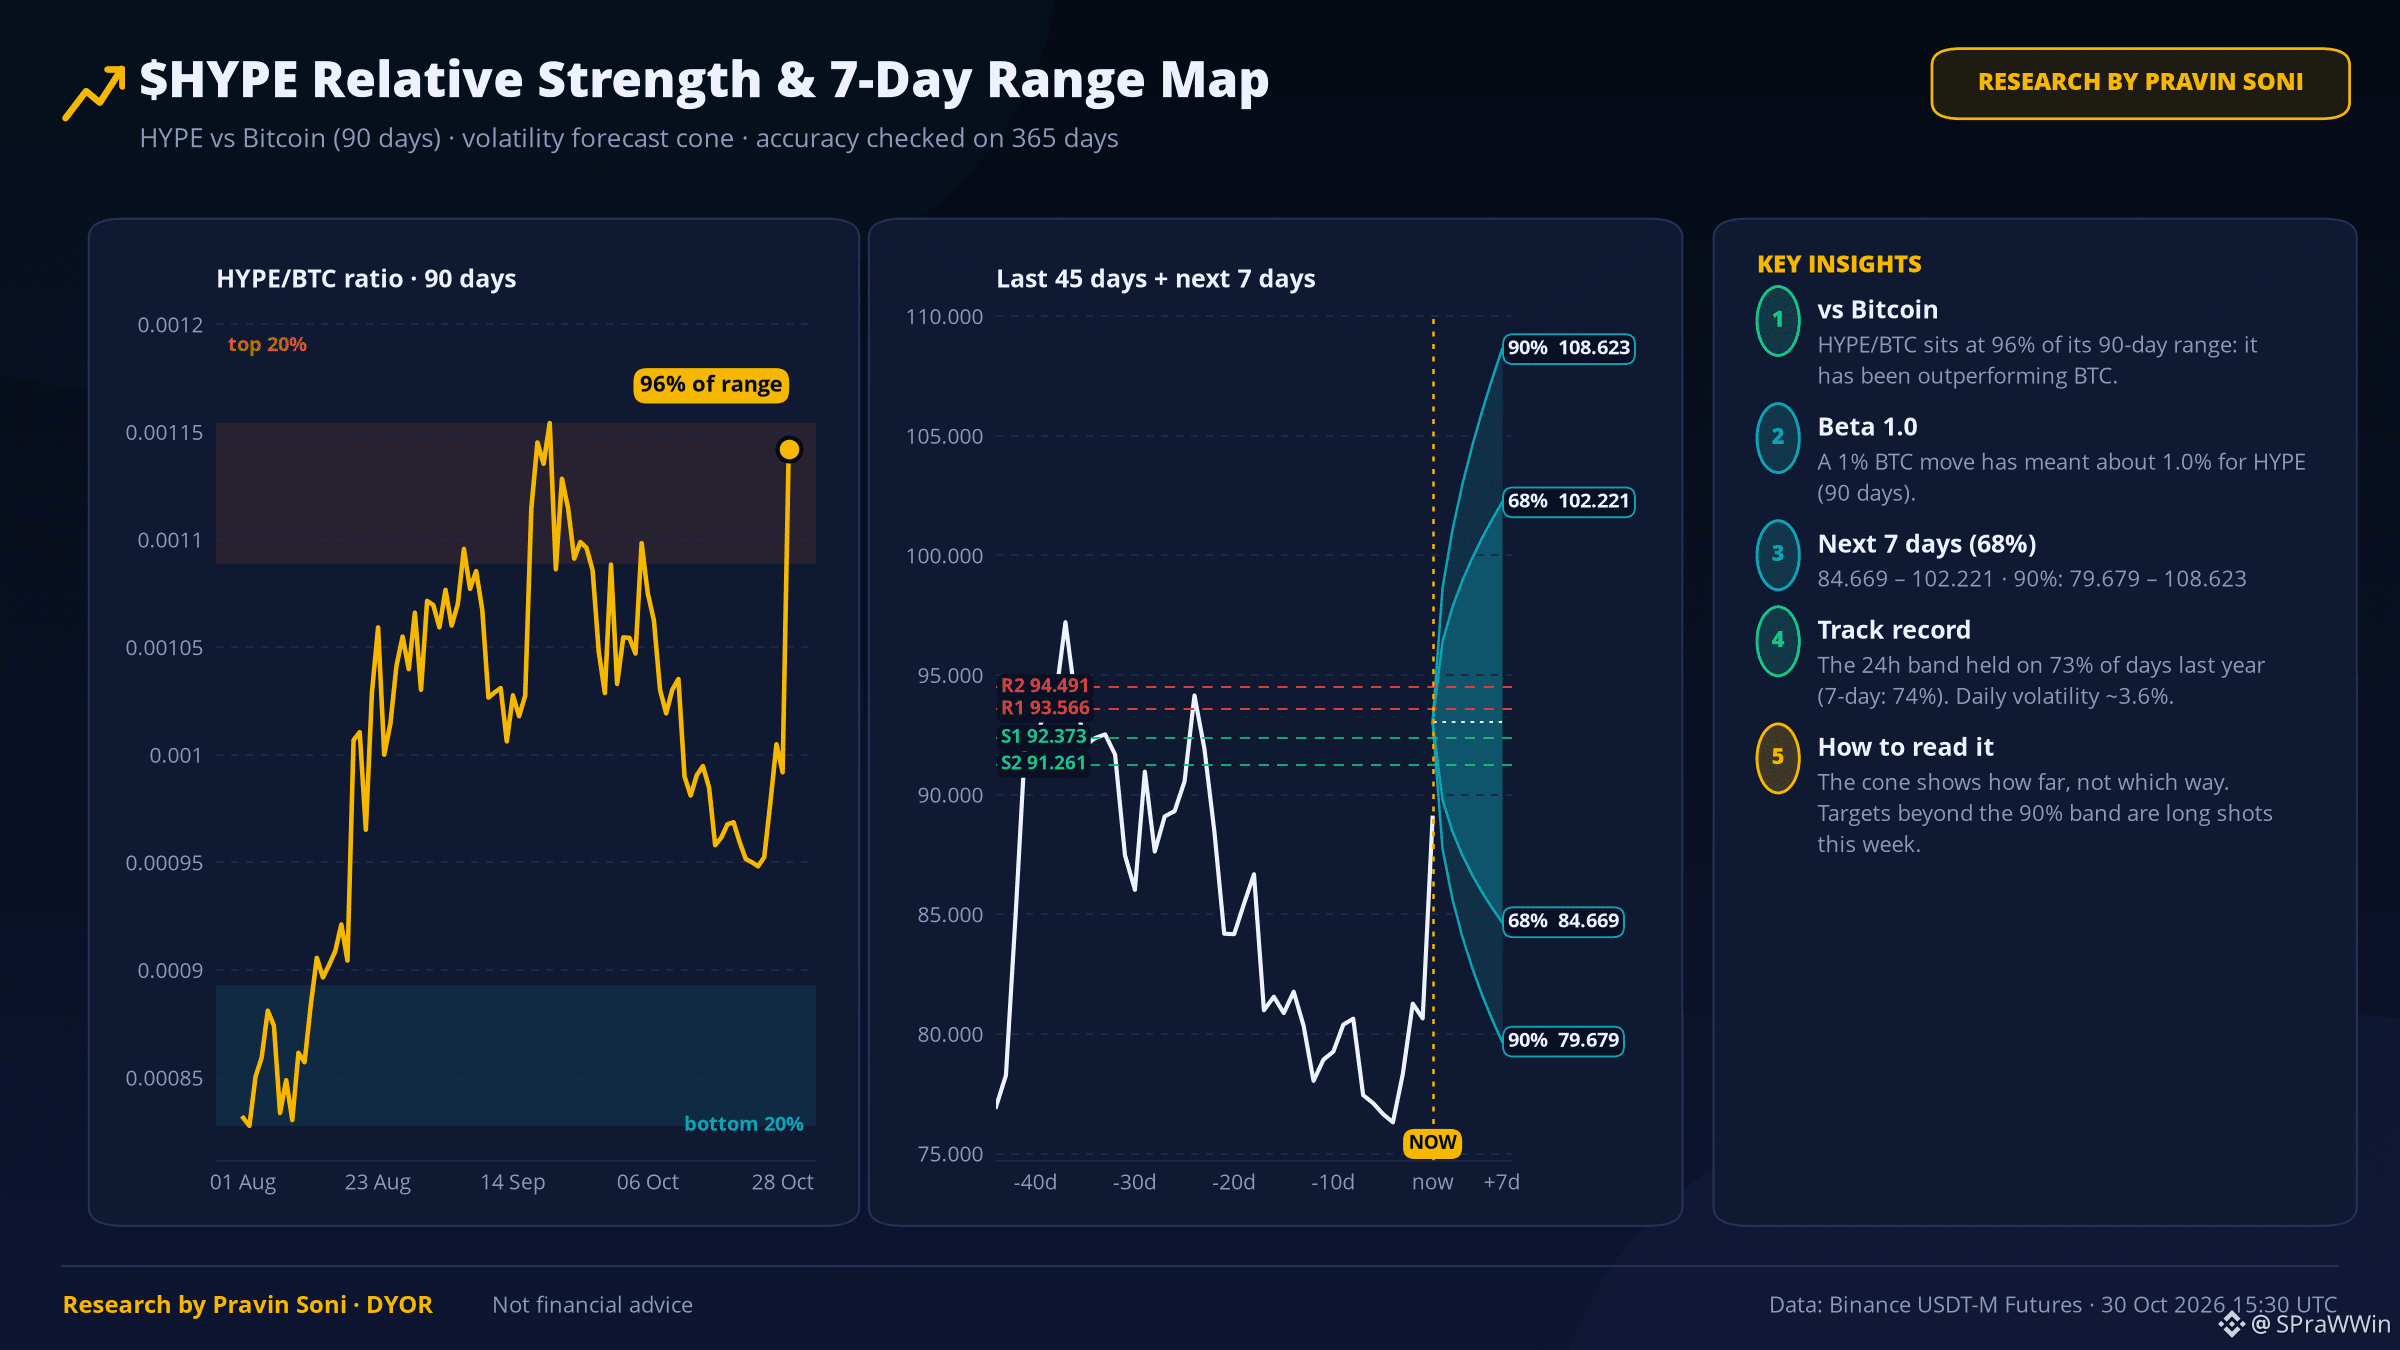
68% band: 84.669 – 102.221 · 90% band: 79.679 – 108.623
This band held on 73% of days last year. It shows how far, not which way.
vs $BTC: HYPE/BTC sits at 96% of its 90-day range, beta 1.0.
🚦 The lines in the sand
🟢 Bull case: daily close above 93.566 → 94.491
🔴 Bear case: daily close below 92.373 → 91.261
✍️ Bottom line: Buyers have the edge on paper. Above 93.566 it gets interesting; below 92.373 I'm wrong.
📰 Wu Blockchain, 24h ago: Legendary Wall Street Investor Stanley Druckenmiller Invests in Trade xyz; Musk Retweets as HYPE Surges 17.64% Legendary Wall Street investor Stan Dru…
💬 Which level breaks first? Tell me below.
Not financial advice · Data: Binance Futures
$HYPE #HYPE #Volume #CryptoAnalysis
⚠️ Research by Pravin Soni - DYOR
$HYPE Just Woke Up: 5.4x Volume and Rising Interest 📊
TL;DR: Volume 5.4x its 30-day average; top traders more bullish than the crowd. History leans up (6/8). Price 93.032, daily RSI 63.
🧩 The setup in 3 points
1️⃣ 24h volume is 5.4x the 30-day average — unusual attention on this coin.
2️⃣ Top traders' position ratio is 2.24 vs their account ratio 1.23 — big money is leaning long.
3️⃣ Over 30 days it is beating $BTC by 15.3 points (7D: +24.8).
📜 What history says
The last 8 times $HYPE traded over 2x its normal daily volume, it was higher 7 days later in 6 of 8 cases (median +11.7%). Small sample, so a guide, not a rule.
📐 How far could it move?
68% band: 84.669 – 102.221 · 90% band: 79.679 – 108.623
This band held on 73% of days last year. It shows how far, not which way.
vs $BTC : HYPE/BTC sits at 96% of its 90-day range, beta 1.0.
🚦 The lines in the sand
🟢 Bull case: daily close above 93.566 → 94.491
🔴 Bear case: daily close below 92.373 → 91.261
✍️ Bottom line: Buyers have the edge on paper. Above 93.566 it gets interesting; below 92.373 I'm wrong.
📰 Wu Blockchain, 24h ago: Legendary Wall Street Investor Stanley Druckenmiller Invests in Trade xyz; Musk Retweets as HYPE Surges 17.64% Legendary Wall Street investor Stan Dru…
💬 Which level breaks first? Tell me below.
Not financial advice · Data: Binance Futures
$HYPE #HYPE #Volume #CryptoAnalysis
⚠️ Research by Pravin Soni - DYOR
TL;DR: Volume 5.4x its 30-day average; top traders more bullish than the crowd. History leans up (6/8). Price 93.032, daily RSI 63.
🧩 The setup in 3 points
1️⃣ 24h volume is 5.4x the 30-day average — unusual attention on this coin.
2️⃣ Top traders' position ratio is 2.24 vs their account ratio 1.23 — big money is leaning long.
3️⃣ Over 30 days it is beating $BTC by 15.3 points (7D: +24.8).
📜 What history says
The last 8 times $HYPE traded over 2x its normal daily volume, it was higher 7 days later in 6 of 8 cases (median +11.7%). Small sample, so a guide, not a rule.
📐 How far could it move?
68% band: 84.669 – 102.221 · 90% band: 79.679 – 108.623
This band held on 73% of days last year. It shows how far, not which way.
vs $BTC : HYPE/BTC sits at 96% of its 90-day range, beta 1.0.
🚦 The lines in the sand
🟢 Bull case: daily close above 93.566 → 94.491
🔴 Bear case: daily close below 92.373 → 91.261
✍️ Bottom line: Buyers have the edge on paper. Above 93.566 it gets interesting; below 92.373 I'm wrong.
📰 Wu Blockchain, 24h ago: Legendary Wall Street Investor Stanley Druckenmiller Invests in Trade xyz; Musk Retweets as HYPE Surges 17.64% Legendary Wall Street investor Stan Dru…
💬 Which level breaks first? Tell me below.
Not financial advice · Data: Binance Futures
$HYPE #HYPE #Volume #CryptoAnalysis
⚠️ Research by Pravin Soni - DYOR
132
Log in to explore more content
Join global crypto users on Binance Square
⚡️ Get latest and useful information about crypto.
💬 Trusted by the world’s largest crypto exchange.
👍 Discover real insights from verified creators.
Email / Phone number
Trending Topics
1
#BinanceReopensWithdrawalsForHYPE&APT
86,330 views
984 Discussing
2
#SouthKoreaDraftLawTargets15To20%ShareholderCap
87,445 views
650 Discussing
3
#TradFiForBeginners
182,538 views
1,849 Discussing
4
#KeplrAdvisesSocialLoginUsersToTransferAssets
46,489 views
520 Discussing
5
#TetherPlans€28.8MForJuventusCapitalIncrease
33,478 views
402 Discussing
6
#JobsReportRaisesHikeOdds
866,954 views
4,454 Discussing
7
#CPITestsDecemberRateOutlook
353,392 views
1,894 Discussing
8
#US Data Center Rules May Constrain AI Expansion
130,644 views
259 Discussing
9
#ARKPlans14ThematicETFsCoveringAIAndTokenizedMarkets
9,562 views
90 Discussing
10
#WillAnthropicListOnTime
273,346 views
1,884 Discussing