
#bitcoinactivesupplyinprofitdropsbelow45
bitcoinactivesupplyinprofitdropsbelow45
1,685 views
52 Discussing
Hot
Latest

·
--
Over half of $BTC's active supply is underwater — under 45% in profit, per Darkfost. Sub-40% has marked correction lows before. $BTC $64.6K, -1.8%. Hold $64K and the flush is spent; lose it, $62K returns. Bottom signal or more pain? #BitcoinActiveSupplyInProfitDropsBelow45% #Bitcoin #CryptoContent
Over half of $BTC 's active supply is underwater — under 45% in profit, per Darkfost. Sub-40% has marked correction lows before. $BTC $64.6K, -1.8%. Hold $64K and the flush is spent; lose it, $62K returns. Bottom signal or more pain? #BitcoinActiveSupplyInProfitDropsBelow45% #Bitcoin #CryptoContent
1


The percentage of Bitcoin's active supply held by investors in profit has fallen below 45%. This significant drop suggests a potential shift in market sentiment, with fewer holders currently seeing unrealized gains. Historically, such levels can precede periods of accumulation or increased selling pressure as those holding at a loss may become more inclined to exit, while those still in profit might be hesitant to sell, anticipating a rebound. This metric is crucial for understanding the underlying health of the $BTC market and can offer insights into potential price movements. Traders should closely monitor this indicator for signs of capitulation or the early stages of a recovery.
Disclaimer: This is not investment advice. Always do your own research.
#BitcoinActiveSupplyInProfitDropsBelow45% $BTC
The percentage of Bitcoin's active supply held by investors in profit has fallen below 45%. This significant drop suggests a potential shift in market sentiment, with fewer holders currently seeing unrealized gains. Historically, such levels can precede periods of accumulation or increased selling pressure as those holding at a loss may become more inclined to exit, while those still in profit might be hesitant to sell, anticipating a rebound. This metric is crucial for understanding the underlying health of the $BTC market and can offer insights into potential price movements. Traders should closely monitor this indicator for signs of capitulation or the early stages of a recovery.
Disclaimer: This is not investment advice. Always do your own research.
#BitcoinActiveSupplyInProfitDropsBelow45% $BTC
Disclaimer: This is not investment advice. Always do your own research.
#BitcoinActiveSupplyInProfitDropsBelow45% $BTC
48

#BitcoinActiveSupplyInProfitDropsBelow45% $BTC 64,478
Bitcoin crashed to a 3-month low below $63,000 as on-chain data shows active supply profit dropping below 45%.
The metric excludes coins untouched for 10 years, focusing on active holders now underwater.
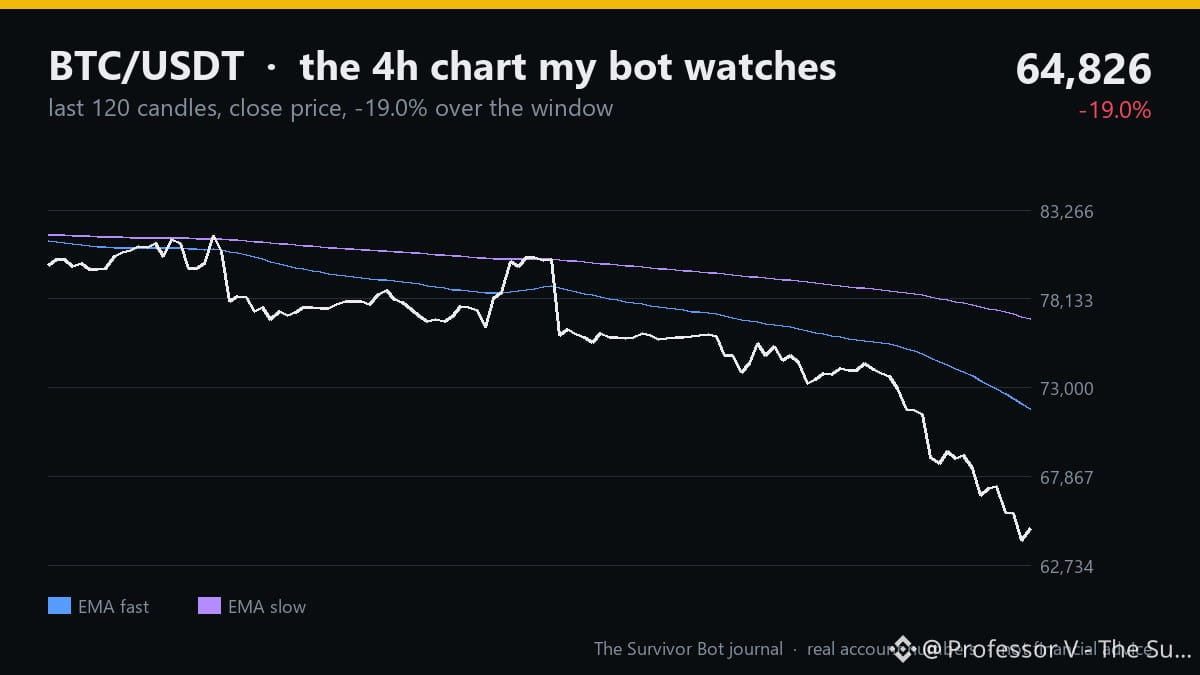
BTC price sits at 64,478 USDT on the 4-hour chart, marked by a downtrend and a daily bias that is down.
News mood is risk-off (-0.39) with mixed negative sentiment but no systemic shock.
My bot holds 1.0 USDT equity and has no open positions.
Given the down bias and risk-off mood, the rules would pause new long entries today and keep stop-loss orders ready on the exchange.
Levels I'm watching on BTC: 64,478 entry, $63,000 support.
Daily numbers, no cherry-picking. Follow if you want the losses too.
#BitcoinActiveSupplyInProfitDropsBelow45% #TheSurvivorBot
#BitcoinActiveSupplyInProfitDropsBelow45% $BTC 64,478
Bitcoin crashed to a 3-month low below $63,000 as on-chain data shows active supply profit dropping below 45%.
The metric excludes coins untouched for 10 years, focusing on active holders now underwater.
BTC price sits at 64,478 USDT on the 4-hour chart, marked by a downtrend and a daily bias that is down.
News mood is risk-off (-0.39) with mixed negative sentiment but no systemic shock.
My bot holds 1.0 USDT equity and has no open positions.
Given the down bias and risk-off mood, the rules would pause new long entries today and keep stop-loss orders ready on the exchange.
Levels I'm watching on BTC: 64,478 entry, $63,000 support.
Daily numbers, no cherry-picking. Follow if you want the losses too.
#BitcoinActiveSupplyInProfitDropsBelow45% #TheSurvivorBot
Bitcoin crashed to a 3-month low below $63,000 as on-chain data shows active supply profit dropping below 45%.
The metric excludes coins untouched for 10 years, focusing on active holders now underwater.
BTC price sits at 64,478 USDT on the 4-hour chart, marked by a downtrend and a daily bias that is down.
News mood is risk-off (-0.39) with mixed negative sentiment but no systemic shock.
My bot holds 1.0 USDT equity and has no open positions.
Given the down bias and risk-off mood, the rules would pause new long entries today and keep stop-loss orders ready on the exchange.
Levels I'm watching on BTC: 64,478 entry, $63,000 support.
Daily numbers, no cherry-picking. Follow if you want the losses too.
#BitcoinActiveSupplyInProfitDropsBelow45% #TheSurvivorBot
75

·
--
$BTC carries two "supply in profit" readings about 15 points apart, and $2B of leverage left the market. One says most active coins are underwater, the other that the market is only cooling. Both can be right.
Short answer: a denominator problem, not a data error. One series drops coins unmoved for a decade, the other counts every coin. The first is harsher, and it tracks the people who trade.
Three numbers:
- Analyst Darkfost put less than 45% of BTC supply in profit on Nov 14, excluding coins unmoved for over 10 years, and flagged readings under 40% as the zone that has often coincided with correction lows (TokenPost).
- Glassnode's Nov 9 pulse had percent supply in profit at 60.6%, from 62.9% a week earlier, still above its low band and read as cooling rather than capitulation.
- CoinGlass via BlockBeats, Nov 15: $2.058B liquidated in 24 hours, $1.922B of it longs, about 93%, across 329,339 accounts. Largest order: $16.17M ETH on Binance.
Why the gap is the point:
- Dormant coins cannot be sold, so removing them leaves holders who transact: a better read on mood, a worse one for dates.
- Almost all liquidation was one-sided. Forced selling of that shape means leverage left; not that a two-sided argument got settled.
Three checks for next sessions:
- Whether the adjusted reading prints below 40%, Darkfost's marker, or stalls above it while price steadies.
- Whether CoinGlass 24-hour totals drop under $500M, which would say leverage is gone rather than paused.
- BTC against its $62,006 low from the Binance spot snapshot at 08:32 Kyiv, and whether a lower low brings a smaller liquidation total.
The rule I keep coming back to: when two versions of the same metric disagree, the disagreement is the story, not the headline.
#BitcoinActiveSupplyInProfitDropsBelow45% #Write2Earn
If you track these metrics, do you use the adjusted series or the raw one, and why?
$BTC carries two "supply in profit" readings about 15 points apart, and $2B of leverage left the market. One says most active coins are underwater, the other that the market is only cooling. Both can be right.
Short answer: a denominator problem, not a data error. One series drops coins unmoved for a decade, the other counts every coin. The first is harsher, and it tracks the people who trade.
Three numbers:
- Analyst Darkfost put less than 45% of BTC supply in profit on Nov 14, excluding coins unmoved for over 10 years, and flagged readings under 40% as the zone that has often coincided with correction lows (TokenPost).
- Glassnode's Nov 9 pulse had percent supply in profit at 60.6%, from 62.9% a week earlier, still above its low band and read as cooling rather than capitulation.
- CoinGlass via BlockBeats, Nov 15: $2.058B liquidated in 24 hours, $1.922B of it longs, about 93%, across 329,339 accounts. Largest order: $16.17M ETH on Binance.
Why the gap is the point:
- Dormant coins cannot be sold, so removing them leaves holders who transact: a better read on mood, a worse one for dates.
- Almost all liquidation was one-sided. Forced selling of that shape means leverage left; not that a two-sided argument got settled.
Three checks for next sessions:
- Whether the adjusted reading prints below 40%, Darkfost's marker, or stalls above it while price steadies.
- Whether CoinGlass 24-hour totals drop under $500M, which would say leverage is gone rather than paused.
- BTC against its $62,006 low from the Binance spot snapshot at 08:32 Kyiv, and whether a lower low brings a smaller liquidation total.
The rule I keep coming back to: when two versions of the same metric disagree, the disagreement is the story, not the headline.
#BitcoinActiveSupplyInProfitDropsBelow45% #Write2Earn
If you track these metrics, do you use the adjusted series or the raw one, and why?
Short answer: a denominator problem, not a data error. One series drops coins unmoved for a decade, the other counts every coin. The first is harsher, and it tracks the people who trade.
Three numbers:
- Analyst Darkfost put less than 45% of BTC supply in profit on Nov 14, excluding coins unmoved for over 10 years, and flagged readings under 40% as the zone that has often coincided with correction lows (TokenPost).
- Glassnode's Nov 9 pulse had percent supply in profit at 60.6%, from 62.9% a week earlier, still above its low band and read as cooling rather than capitulation.
- CoinGlass via BlockBeats, Nov 15: $2.058B liquidated in 24 hours, $1.922B of it longs, about 93%, across 329,339 accounts. Largest order: $16.17M ETH on Binance.
Why the gap is the point:
- Dormant coins cannot be sold, so removing them leaves holders who transact: a better read on mood, a worse one for dates.
- Almost all liquidation was one-sided. Forced selling of that shape means leverage left; not that a two-sided argument got settled.
Three checks for next sessions:
- Whether the adjusted reading prints below 40%, Darkfost's marker, or stalls above it while price steadies.
- Whether CoinGlass 24-hour totals drop under $500M, which would say leverage is gone rather than paused.
- BTC against its $62,006 low from the Binance spot snapshot at 08:32 Kyiv, and whether a lower low brings a smaller liquidation total.
The rule I keep coming back to: when two versions of the same metric disagree, the disagreement is the story, not the headline.
#BitcoinActiveSupplyInProfitDropsBelow45% #Write2Earn
If you track these metrics, do you use the adjusted series or the raw one, and why?
86


Article
Bitcoin Below 45%₿ Bitcoin Active Supply in Profit Drops Below 45% — Is More Pain Coming?
A major shift is happening in the Bitcoin market!
When less than 45% of Bitcoin's active supply is in profit, it signals that a large portion of holders may be facing unrealized losses.
But what does this mean for the market?
🔸 Is this a sign of growing bearish pressure?
🔸 Could panic selling push BTC even lower?
🔸 Or are long-term investors getting closer to a potential accumulation opportunity?
Historically, periods of widespread unrealized losses have sometimes created opportunities for patient investors.
However, market confirmation is always important.
What's your view? Is Bitcoin preparing for another drop, or are we getting closer to a strong recovery?
#BitcoinActiveSupplyInProfitDropsBelow45
Bitcoin Below 45%
₿ Bitcoin Active Supply in Profit Drops Below 45% — Is More Pain Coming?
A major shift is happening in the Bitcoin market!
When less than 45% of Bitcoin's active supply is in profit, it signals that a large portion of holders may be facing unrealized losses.
But what does this mean for the market?
🔸 Is this a sign of growing bearish pressure?
🔸 Could panic selling push BTC even lower?
🔸 Or are long-term investors getting closer to a potential accumulation opportunity?
Historically, periods of widespread unrealized losses have sometimes created opportunities for patient investors.
However, market confirmation is always important.
What's your view? Is Bitcoin preparing for another drop, or are we getting closer to a strong recovery?
#BitcoinActiveSupplyInProfitDropsBelow45
A major shift is happening in the Bitcoin market!
When less than 45% of Bitcoin's active supply is in profit, it signals that a large portion of holders may be facing unrealized losses.
But what does this mean for the market?
🔸 Is this a sign of growing bearish pressure?
🔸 Could panic selling push BTC even lower?
🔸 Or are long-term investors getting closer to a potential accumulation opportunity?
Historically, periods of widespread unrealized losses have sometimes created opportunities for patient investors.
However, market confirmation is always important.
What's your view? Is Bitcoin preparing for another drop, or are we getting closer to a strong recovery?
#BitcoinActiveSupplyInProfitDropsBelow45
96

·
--
More than half of Bitcoin's active supply is underwater right now. CryptoQuant analyst Darkfost flagged it today: less than 45% of the active supply is in profit once you exclude coins that haven't moved in ten years, so most of the coins actually trading are sitting on losses. Historically this metric dipping under 40% has lined up with correction bottoms, and we're not far from that zone. Meanwhile BTC is hovering around $67,400 after briefly dipping under $67,000, Strategy is now sitting on a $6.85 billion unrealized loss on its 850,364 BTC, and the fear index is at 16, deep in extreme fear. Everyone is hurting, which is usually when bottoms start forming, or when things get worse before they get better. Are you buying into this pain, or waiting for that sub-40% print first? #BitcoinActiveSupplyInProfitDropsBelow45% $BTC
More than half of Bitcoin's active supply is underwater right now. CryptoQuant analyst Darkfost flagged it today: less than 45% of the active supply is in profit once you exclude coins that haven't moved in ten years, so most of the coins actually trading are sitting on losses. Historically this metric dipping under 40% has lined up with correction bottoms, and we're not far from that zone. Meanwhile BTC is hovering around $67,400 after briefly dipping under $67,000, Strategy is now sitting on a $6.85 billion unrealized loss on its 850,364 BTC, and the fear index is at 16, deep in extreme fear. Everyone is hurting, which is usually when bottoms start forming, or when things get worse before they get better. Are you buying into this pain, or waiting for that sub-40% print first? #BitcoinActiveSupplyInProfitDropsBelow45% $BTC

32
Bitcoin's active supply held by profitable addresses has fallen below the 45% threshold, a significant indicator often watched by traders. This metric suggests that a smaller portion of circulating BTC is currently in profit, which could signal a shift in market sentiment or potential accumulation phases. Historically, such drops have preceded periods of recovery or consolidation, as holders who are underwater might be less inclined to sell, while those still in profit might be cautious. The current market dynamics warrant close observation to see if this trend continues and what impact it has on future price movements for $BTC.
Disclaimer: This is not investment advice.
#BitcoinActiveSupplyInProfitDropsBelow45% $BTC
Bitcoin's active supply held by profitable addresses has fallen below the 45% threshold, a significant indicator often watched by traders. This metric suggests that a smaller portion of circulating BTC is currently in profit, which could signal a shift in market sentiment or potential accumulation phases. Historically, such drops have preceded periods of recovery or consolidation, as holders who are underwater might be less inclined to sell, while those still in profit might be cautious. The current market dynamics warrant close observation to see if this trend continues and what impact it has on future price movements for $BTC .
Disclaimer: This is not investment advice.
#BitcoinActiveSupplyInProfitDropsBelow45% $BTC
Disclaimer: This is not investment advice.
#BitcoinActiveSupplyInProfitDropsBelow45% $BTC
41

·
--
#BitcoinActiveSupplyInProfitDropsBelow45%
🧊 Under 45% in Profit. History Says Watch 40%
More active BTC now sits at a loss than in profit, a stress sign seen late in sell-offs.
📊 Under 45% of active supply in profit (Darkfost, ex 10Y+ dormant coins)
📈 Full supply: 56.56% in profit Nov 12 vs 69.39% a month earlier
📉 BTC ~$66,070, down ~4.5% in 24h and ~13% since Nov 7 close
⚠️ Readings under 40% have often lined up with pullback lows
My read: a stress gauge, not a bottom signal on its own.
Will active supply in profit hit 40% before Dec 31, or climb back above 50% first? 👇
$BTC
#BitcoinActiveSupplyInProfitDropsBelow45% #BTC #OnChain
#BitcoinActiveSupplyInProfitDropsBelow45%
🧊 Under 45% in Profit. History Says Watch 40%
More active BTC now sits at a loss than in profit, a stress sign seen late in sell-offs.
📊 Under 45% of active supply in profit (Darkfost, ex 10Y+ dormant coins)
📈 Full supply: 56.56% in profit Nov 12 vs 69.39% a month earlier
📉 BTC ~$66,070, down ~4.5% in 24h and ~13% since Nov 7 close
⚠️ Readings under 40% have often lined up with pullback lows
My read: a stress gauge, not a bottom signal on its own.
Will active supply in profit hit 40% before Dec 31, or climb back above 50% first? 👇
$BTC
#BitcoinActiveSupplyInProfitDropsBelow45% #BTC #OnChain
🧊 Under 45% in Profit. History Says Watch 40%
More active BTC now sits at a loss than in profit, a stress sign seen late in sell-offs.
📊 Under 45% of active supply in profit (Darkfost, ex 10Y+ dormant coins)
📈 Full supply: 56.56% in profit Nov 12 vs 69.39% a month earlier
📉 BTC ~$66,070, down ~4.5% in 24h and ~13% since Nov 7 close
⚠️ Readings under 40% have often lined up with pullback lows
My read: a stress gauge, not a bottom signal on its own.
Will active supply in profit hit 40% before Dec 31, or climb back above 50% first? 👇
$BTC
#BitcoinActiveSupplyInProfitDropsBelow45% #BTC #OnChain

3

·
--
BTC profit-taking supply draws attention | Active supply in profit below 45% is an analyst’s estimate | Wait for BTC to hold above $66,000 before discussing a rebound
My stance is to stay defensive for now; I’m not treating “few coins in profit” as permission to buy the dip. The hashtag #BitcoinActiveSupplyInProfitDropsBelow45% has appeared on Binance Square’s trending list, with more than a thousand discussions. The topic cites an estimate by CryptoQuant analyst Darkfost: excluding coins that have not moved for more than ten years, less than 45% of the active supply is in unrealized profit. This is an on-chain analysis with specific screening criteria; it does not mean that only 45% of all BTC holders are in profit. On-chain cost estimates also cannot identify each investor’s actual purchase price. I disagree with people on Square who present this directly as “confirmation that the bull-market bottom is in.”
This indicator matters because a rising share of coins at a loss suggests that recent participants are under greater psychological pressure. One possibility is that panic selling continues to weigh on prices; another is that selling pressure is gradually being exhausted. Both scenarios need to be validated by subsequent trading activity, price action, and capital flows. A single threshold cannot provide a buy signal. The analyst noted that periods below 40% have sometimes been close to correction lows, but the current discussion is about a level below 45%—a different threshold—and historical examples are no guarantee of a repeat. For me, the key things to watch are whether selling volume continues to surge if BTC breaks support, and whether it can hold new support after a rebound.
Institutional flows have not provided clear confirmation today either. According to Farside, on the last U.S. spot BTC ETF trading day, November 13, total net outflows were $185.4 million: $143.5 million from IBIT and $41.9 million from FBTC. Today is the weekend, so the table has no new Sunday creations or redemptions. We cannot turn an increase in on-chain unrealized losses into a claim that ETFs have shifted to buying. The most recent BTC purchase listed in the news section of Strategy’s website was an addition of 250 BTC on October 12. If a Saylor image or speculation surfaces, I’ll describe it only as an expectation and wait for formal disclosure from the company or the SEC.
The market’s reaction so far has not been a one-way recovery. BTC/USDT was around $65,450 on Binance, still down about 2.56% over the rolling 24-hour period, with a range of $62,006 to $67,323. The price has rebounded from the low end of the range but has not broken above the high, suggesting there is support at lower levels while the quality of the rebound remains to be tested. $66,000 is my confirmation level, and the area around $67,300 is overhead supply. If BTC falls below $64,000 again and fails to reclaim it, the rebound thesis weakens; a break below $62,000 would completely invalidate the assumption that this round of lows will hold as support. By market reaction, I mean observable prices and historical ETF data; I am not claiming that the on-chain indicator caused prices to rise.
If I were trading, I would stay out for now and consider only a small spot long, with no leverage. I would use 1.5% of my account’s net asset value to open a test position only if BTC closes two consecutive one-hour candles above $66,000, holds that level on a retest, and ETF flows are no longer significantly negative on the next U.S. trading day. My first target is $67,300, where I would sell half; my second target is $69,000, where I would exit the remaining position in batches. I would set the initial stop at $63,900 and close the entire position if it is hit. If, after buying, BTC falls back below $66,000 for two consecutive hours, I would reduce the position even if the stop has not been hit. If these conditions are never met, I will remain out of the market and won’t describe the plan as a trade already made.
#BitcoinActiveSupplyInProfitDropsBelow45% #BTC
The above is solely my personal market observation and does not constitute investment advice.
BTC profit-taking supply draws attention | Active supply in profit below 45% is an analyst’s estimate | Wait for BTC to hold above $66,000 before discussing a rebound
My stance is to stay defensive for now; I’m not treating “few coins in profit” as permission to buy the dip. The hashtag #BitcoinActiveSupplyInProfitDropsBelow45% has appeared on Binance Square’s trending list, with more than a thousand discussions. The topic cites an estimate by CryptoQuant analyst Darkfost: excluding coins that have not moved for more than ten years, less than 45% of the active supply is in unrealized profit. This is an on-chain analysis with specific screening criteria; it does not mean that only 45% of all BTC holders are in profit. On-chain cost estimates also cannot identify each investor’s actual purchase price. I disagree with people on Square who present this directly as “confirmation that the bull-market bottom is in.”
This indicator matters because a rising share of coins at a loss suggests that recent participants are under greater psychological pressure. One possibility is that panic selling continues to weigh on prices; another is that selling pressure is gradually being exhausted. Both scenarios need to be validated by subsequent trading activity, price action, and capital flows. A single threshold cannot provide a buy signal. The analyst noted that periods below 40% have sometimes been close to correction lows, but the current discussion is about a level below 45%—a different threshold—and historical examples are no guarantee of a repeat. For me, the key things to watch are whether selling volume continues to surge if BTC breaks support, and whether it can hold new support after a rebound.
Institutional flows have not provided clear confirmation today either. According to Farside, on the last U.S. spot BTC ETF trading day, November 13, total net outflows were $185.4 million: $143.5 million from IBIT and $41.9 million from FBTC. Today is the weekend, so the table has no new Sunday creations or redemptions. We cannot turn an increase in on-chain unrealized losses into a claim that ETFs have shifted to buying. The most recent BTC purchase listed in the news section of Strategy’s website was an addition of 250 BTC on October 12. If a Saylor image or speculation surfaces, I’ll describe it only as an expectation and wait for formal disclosure from the company or the SEC.
The market’s reaction so far has not been a one-way recovery. BTC/USDT was around $65,450 on Binance, still down about 2.56% over the rolling 24-hour period, with a range of $62,006 to $67,323. The price has rebounded from the low end of the range but has not broken above the high, suggesting there is support at lower levels while the quality of the rebound remains to be tested. $66,000 is my confirmation level, and the area around $67,300 is overhead supply. If BTC falls below $64,000 again and fails to reclaim it, the rebound thesis weakens; a break below $62,000 would completely invalidate the assumption that this round of lows will hold as support. By market reaction, I mean observable prices and historical ETF data; I am not claiming that the on-chain indicator caused prices to rise.
If I were trading, I would stay out for now and consider only a small spot long, with no leverage. I would use 1.5% of my account’s net asset value to open a test position only if BTC closes two consecutive one-hour candles above $66,000, holds that level on a retest, and ETF flows are no longer significantly negative on the next U.S. trading day. My first target is $67,300, where I would sell half; my second target is $69,000, where I would exit the remaining position in batches. I would set the initial stop at $63,900 and close the entire position if it is hit. If, after buying, BTC falls back below $66,000 for two consecutive hours, I would reduce the position even if the stop has not been hit. If these conditions are never met, I will remain out of the market and won’t describe the plan as a trade already made.
#BitcoinActiveSupplyInProfitDropsBelow45% #BTC
The above is solely my personal market observation and does not constitute investment advice.
My stance is to stay defensive for now; I’m not treating “few coins in profit” as permission to buy the dip. The hashtag #BitcoinActiveSupplyInProfitDropsBelow45% has appeared on Binance Square’s trending list, with more than a thousand discussions. The topic cites an estimate by CryptoQuant analyst Darkfost: excluding coins that have not moved for more than ten years, less than 45% of the active supply is in unrealized profit. This is an on-chain analysis with specific screening criteria; it does not mean that only 45% of all BTC holders are in profit. On-chain cost estimates also cannot identify each investor’s actual purchase price. I disagree with people on Square who present this directly as “confirmation that the bull-market bottom is in.”
This indicator matters because a rising share of coins at a loss suggests that recent participants are under greater psychological pressure. One possibility is that panic selling continues to weigh on prices; another is that selling pressure is gradually being exhausted. Both scenarios need to be validated by subsequent trading activity, price action, and capital flows. A single threshold cannot provide a buy signal. The analyst noted that periods below 40% have sometimes been close to correction lows, but the current discussion is about a level below 45%—a different threshold—and historical examples are no guarantee of a repeat. For me, the key things to watch are whether selling volume continues to surge if BTC breaks support, and whether it can hold new support after a rebound.
Institutional flows have not provided clear confirmation today either. According to Farside, on the last U.S. spot BTC ETF trading day, November 13, total net outflows were $185.4 million: $143.5 million from IBIT and $41.9 million from FBTC. Today is the weekend, so the table has no new Sunday creations or redemptions. We cannot turn an increase in on-chain unrealized losses into a claim that ETFs have shifted to buying. The most recent BTC purchase listed in the news section of Strategy’s website was an addition of 250 BTC on October 12. If a Saylor image or speculation surfaces, I’ll describe it only as an expectation and wait for formal disclosure from the company or the SEC.
The market’s reaction so far has not been a one-way recovery. BTC/USDT was around $65,450 on Binance, still down about 2.56% over the rolling 24-hour period, with a range of $62,006 to $67,323. The price has rebounded from the low end of the range but has not broken above the high, suggesting there is support at lower levels while the quality of the rebound remains to be tested. $66,000 is my confirmation level, and the area around $67,300 is overhead supply. If BTC falls below $64,000 again and fails to reclaim it, the rebound thesis weakens; a break below $62,000 would completely invalidate the assumption that this round of lows will hold as support. By market reaction, I mean observable prices and historical ETF data; I am not claiming that the on-chain indicator caused prices to rise.
If I were trading, I would stay out for now and consider only a small spot long, with no leverage. I would use 1.5% of my account’s net asset value to open a test position only if BTC closes two consecutive one-hour candles above $66,000, holds that level on a retest, and ETF flows are no longer significantly negative on the next U.S. trading day. My first target is $67,300, where I would sell half; my second target is $69,000, where I would exit the remaining position in batches. I would set the initial stop at $63,900 and close the entire position if it is hit. If, after buying, BTC falls back below $66,000 for two consecutive hours, I would reduce the position even if the stop has not been hit. If these conditions are never met, I will remain out of the market and won’t describe the plan as a trade already made.
#BitcoinActiveSupplyInProfitDropsBelow45% #BTC
The above is solely my personal market observation and does not constitute investment advice.

3

·
--
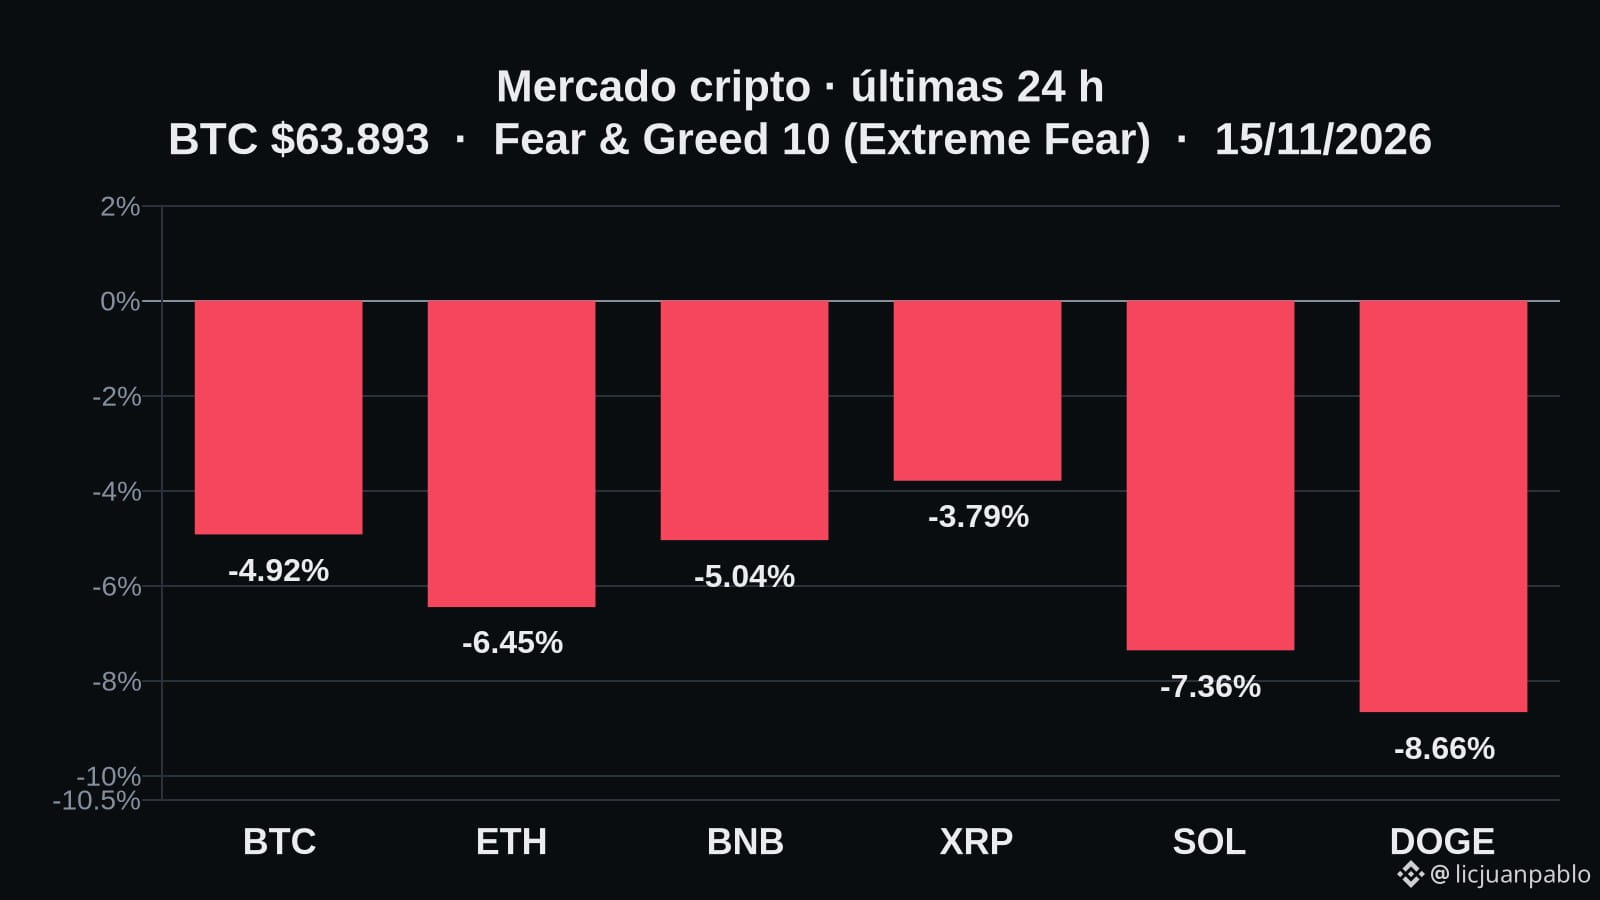
Did it catch your attention that the proportion of $BTC in active supply in profit has fallen below 45 %? This means fewer coins are “in the hands” of those who had already sold them at a profit, while the price hovers around 63 893 USD and the Fear & Greed Index indicates extreme fear (10). In this context, other assets are also seeing significant declines. How do you think this scenario will evolve over the next few days?
#BitcoinActiveSupplyInProfitDropsBelow45% #Bitcoin
Did it catch your attention that the proportion of $BTC in active supply in profit has fallen below 45 %? This means fewer coins are “in the hands” of those who had already sold them at a profit, while the price hovers around 63 893 USD and the Fear & Greed Index indicates extreme fear (10). In this context, other assets are also seeing significant declines. How do you think this scenario will evolve over the next few days?
#BitcoinActiveSupplyInProfitDropsBelow45% #Bitcoin
#BitcoinActiveSupplyInProfitDropsBelow45% #Bitcoin
1
238

·
--
Bearish
#BitcoinActiveSupplyInProfitDropsBelow45
🚨 On-chain alert: Less than 45% of Bitcoin’s active supply is now in profit! 🚨
New on-chain data from CryptoQuant, shared by analyst Darkfost, reveals a significant pain threshold across the market, as BTC remains near the $66,000–$67,000 range:
📉 More than 55% of the active supply is at a loss: Excluding coins that have been inactive for more than 10 years (lost or illiquid BTC), less than 45% of Bitcoin currently in active circulation is in profit; in other words, losing positions now outnumber winning ones.
🔍 Nuance between active supply and total supply: Although around 54% of the total BTC supply remains in profit, the active supply perspective shows that short- and medium-term holders who bought during recent rallies are suffering heavy losses.
🎯 Historical bottom zone (<40%): Previous cycles show that when the share of the active supply in profit falls below 40%, it often coincides with the late-stage lows of a market correction and with contrarian accumulation zones.
🏦 Macroeconomic and Fed pressure: With more than $2 billion in recent liquidations and markets preparing for Wednesday’s FOMC minutes, amid the possibility of a hawkish Fed rate hike in December, weaker investors are being shaken out while long-term capital quietly watches support levels.
$BTC
{future}(BTCUSDT)
#BitcoinActiveSupplyInProfitDropsBelow45
🚨 On-chain alert: Less than 45% of Bitcoin’s active supply is now in profit! 🚨
New on-chain data from CryptoQuant, shared by analyst Darkfost, reveals a significant pain threshold across the market, as BTC remains near the $66,000–$67,000 range:
📉 More than 55% of the active supply is at a loss: Excluding coins that have been inactive for more than 10 years (lost or illiquid BTC), less than 45% of Bitcoin currently in active circulation is in profit; in other words, losing positions now outnumber winning ones.
🔍 Nuance between active supply and total supply: Although around 54% of the total BTC supply remains in profit, the active supply perspective shows that short- and medium-term holders who bought during recent rallies are suffering heavy losses.
🎯 Historical bottom zone (<40%): Previous cycles show that when the share of the active supply in profit falls below 40%, it often coincides with the late-stage lows of a market correction and with contrarian accumulation zones.
🏦 Macroeconomic and Fed pressure: With more than $2 billion in recent liquidations and markets preparing for Wednesday’s FOMC minutes, amid the possibility of a hawkish Fed rate hike in December, weaker investors are being shaken out while long-term capital quietly watches support levels.
$BTC
🚨 On-chain alert: Less than 45% of Bitcoin’s active supply is now in profit! 🚨
New on-chain data from CryptoQuant, shared by analyst Darkfost, reveals a significant pain threshold across the market, as BTC remains near the $66,000–$67,000 range:
📉 More than 55% of the active supply is at a loss: Excluding coins that have been inactive for more than 10 years (lost or illiquid BTC), less than 45% of Bitcoin currently in active circulation is in profit; in other words, losing positions now outnumber winning ones.
🔍 Nuance between active supply and total supply: Although around 54% of the total BTC supply remains in profit, the active supply perspective shows that short- and medium-term holders who bought during recent rallies are suffering heavy losses.
🎯 Historical bottom zone (<40%): Previous cycles show that when the share of the active supply in profit falls below 40%, it often coincides with the late-stage lows of a market correction and with contrarian accumulation zones.
🏦 Macroeconomic and Fed pressure: With more than $2 billion in recent liquidations and markets preparing for Wednesday’s FOMC minutes, amid the possibility of a hawkish Fed rate hike in December, weaker investors are being shaken out while long-term capital quietly watches support levels.
$BTC

155

#BitcoinActiveSupplyInProfitDropsBelow45% 📉 Less than 45% of Bitcoin’s supply is in profit! Is capitulation next? 😱
🪙 Fewer active coins $BTC are in profit 💰, pointing to mounting market pressure 🌡️🔻.
🔹 Less than 45%: More holders are facing unrealized losses 😰📉.
🔹 Positive: Historically, intense pressure can create accumulation opportunities 🛒🌱.
🔹 Negative: Panic selling could accelerate the downturn 😨⬇️.
📊 My take: A potential opportunity 🎯, not a confirmed bottom ⚠️. I’ll wait for stronger buying demand 🕰️💪.
💬 Will BTC recover 🚀 or see a deeper crash? 🤔🔥
#bitcoinactivesupplyinprofitdropsbelow45 #BinanceSquareTalks #BTC $BTC
{spot}(BTCUSDT)
#BitcoinActiveSupplyInProfitDropsBelow45% 📉 Less than 45% of Bitcoin’s supply is in profit! Is capitulation next? 😱
🪙 Fewer active coins $BTC are in profit 💰, pointing to mounting market pressure 🌡️🔻.
🔹 Less than 45%: More holders are facing unrealized losses 😰📉.
🔹 Positive: Historically, intense pressure can create accumulation opportunities 🛒🌱.
🔹 Negative: Panic selling could accelerate the downturn 😨⬇️.
📊 My take: A potential opportunity 🎯, not a confirmed bottom ⚠️. I’ll wait for stronger buying demand 🕰️💪.
💬 Will BTC recover 🚀 or see a deeper crash? 🤔🔥
#bitcoinactivesupplyinprofitdropsbelow45 #BinanceSquareTalks #BTC $BTC
🪙 Fewer active coins $BTC are in profit 💰, pointing to mounting market pressure 🌡️🔻.
🔹 Less than 45%: More holders are facing unrealized losses 😰📉.
🔹 Positive: Historically, intense pressure can create accumulation opportunities 🛒🌱.
🔹 Negative: Panic selling could accelerate the downturn 😨⬇️.
📊 My take: A potential opportunity 🎯, not a confirmed bottom ⚠️. I’ll wait for stronger buying demand 🕰️💪.
💬 Will BTC recover 🚀 or see a deeper crash? 🤔🔥
#bitcoinactivesupplyinprofitdropsbelow45 #BinanceSquareTalks #BTC $BTC

96

·
--
Article
BTC Active Supply Falls Below 45%: Most Active Coins Are at an Unrealized Loss, but One Ratio Alone Cannot Signal a BottomBTC Active Supply Falls Below 45%: Most Active Coins Are at an Unrealized Loss, but One Ratio Alone Cannot Signal a Bottom
Ranked third on Binance Square’s trending list, `#BitcoinActiveSupplyInProfitDropsBelow45%` put a signal that is easy to misread in the spotlight: after excluding coins that have not moved for a long time, fewer than 45% of the active supply is in profit, meaning most coins that have shown signs of recent movement are at an unrealized loss. This indicates market pressure, but it does not mean “the price has fallen enough.”
First, a note on methodology. Binance News cited on-chain analysis saying that, after excluding coins that have not moved for a long time, the share of the active supply in profit fell below 45%; a public data page currently shows a reading of about 46%. Different platforms do not define “active supply,” long-dormant coins, or the measurement time in exactly the same way. So it is more appropriate to describe this as “the danger zone around below 45%” rather than treating any single decimal point as a precise bottom signal.
BTC Active Supply Falls Below 45%: Most Active Coins Are at an Unrealized Loss, but One Ratio Alone Cannot Signal a Bottom
BTC Active Supply Falls Below 45%: Most Active Coins Are at an Unrealized Loss, but One Ratio Alone Cannot Signal a Bottom
Ranked third on Binance Square’s trending list, `#BitcoinActiveSupplyInProfitDropsBelow45%` put a signal that is easy to misread in the spotlight: after excluding coins that have not moved for a long time, fewer than 45% of the active supply is in profit, meaning most coins that have shown signs of recent movement are at an unrealized loss. This indicates market pressure, but it does not mean “the price has fallen enough.”
First, a note on methodology. Binance News cited on-chain analysis saying that, after excluding coins that have not moved for a long time, the share of the active supply in profit fell below 45%; a public data page currently shows a reading of about 46%. Different platforms do not define “active supply,” long-dormant coins, or the measurement time in exactly the same way. So it is more appropriate to describe this as “the danger zone around below 45%” rather than treating any single decimal point as a precise bottom signal.
Ranked third on Binance Square’s trending list, `#BitcoinActiveSupplyInProfitDropsBelow45%` put a signal that is easy to misread in the spotlight: after excluding coins that have not moved for a long time, fewer than 45% of the active supply is in profit, meaning most coins that have shown signs of recent movement are at an unrealized loss. This indicates market pressure, but it does not mean “the price has fallen enough.”
First, a note on methodology. Binance News cited on-chain analysis saying that, after excluding coins that have not moved for a long time, the share of the active supply in profit fell below 45%; a public data page currently shows a reading of about 46%. Different platforms do not define “active supply,” long-dormant coins, or the measurement time in exactly the same way. So it is more appropriate to describe this as “the danger zone around below 45%” rather than treating any single decimal point as a precise bottom signal.
266
·
--
Share of Active BTC Supply in Profit Falls Below 45% | Don’t Confuse Different Supply Metrics | I’m Waiting for Confirmation That the Decline Has Stopped
My stance is cautious. People on Binance Square are discussing the claim that “less than 45% of the active BTC supply is in profit.” It’s worth watching, but it shouldn’t be directly translated into “55% of all BTC holders are at a loss,” much less treated as a signal to buy the dip. Statistics cited by Binance News on November 14 excluded coins that had not moved for more than 10 years. The original data provider and details of the real-time calculation were not fully specified in that post. So I treat 45% as a reported figure with limitations in its methodology, not as an independently verified on-chain fact.
Looking at another dataset, CoinGlass put the “supply in profit” at about 10.92 million BTC as of November 13, down around 4.04% from the previous day. Using its total circulating supply methodology, the share of supply in profit was about 54.28%. The 45% and 54.28% figures aren’t necessarily contradictory: different denominators, approaches to dormant coins, and snapshot times can produce different results. The key is to first clarify what is being measured. A declining share in profit means more coins are estimated to be at an unrealized loss based on their last on-chain movement price. But a price decline alone can change that classification, without any concentrated selling having taken place; internal transfers can also alter cost-basis records. There isn’t enough evidence to extrapolate this into proof that “selling pressure has been exhausted.”
The market reaction is not particularly strong. When I checked BTC/USDT on Binance, it was around $64,882, down about 3.50% over 24 hours, with a low of $62,006 and a high of $67,523. The Fear & Greed Index shown on Binance Square was 12. Sentiment is very cold, but that doesn’t prove a bottom is in. The levels I’m watching are the intraday low area around $62,000 and a reclaim-confirmation level above $65,500. If the price breaks below $62,000 and remains unable to recover it, the bearish view strengthens. If it regains and holds above $65,500 with volume, there would be reason to revise my cautious stance upward. These price levels are trading rules, not forecasts from a news organization.
If I were trading this myself, I wouldn’t chase shorts now, nor buy the dip based on “45%” alone. I’d only consider a small spot long, initially using 2% of total capital, and only if BTC gets back above $65,500 and holds that level on a one-hour retest. If that condition isn’t met, I’d stay out and wait. My first target would be $67,500, where I’d take half off; the second target would be $69,000, with the protection level raised for the remaining position as the price moves up. If the price falls back to $64,200 after entry, I’d exit at a loss. If it breaks below $62,000, or subsequent data shows the methodology was misinterpreted, I’d close immediately and cancel the plan. I’d keep the maximum loss on a single trade to around 0.5% of total capital and avoid high leverage. This is only a conditional plan; I’m not claiming that any trade has been executed.
#BitcoinActiveSupplyInProfitDropsBelow45% #BTC
The above is solely my personal market observation and does not constitute investment advice.
Share of Active BTC Supply in Profit Falls Below 45% | Don’t Confuse Different Supply Metrics | I’m Waiting for Confirmation That the Decline Has Stopped
My stance is cautious. People on Binance Square are discussing the claim that “less than 45% of the active BTC supply is in profit.” It’s worth watching, but it shouldn’t be directly translated into “55% of all BTC holders are at a loss,” much less treated as a signal to buy the dip. Statistics cited by Binance News on November 14 excluded coins that had not moved for more than 10 years. The original data provider and details of the real-time calculation were not fully specified in that post. So I treat 45% as a reported figure with limitations in its methodology, not as an independently verified on-chain fact.
Looking at another dataset, CoinGlass put the “supply in profit” at about 10.92 million BTC as of November 13, down around 4.04% from the previous day. Using its total circulating supply methodology, the share of supply in profit was about 54.28%. The 45% and 54.28% figures aren’t necessarily contradictory: different denominators, approaches to dormant coins, and snapshot times can produce different results. The key is to first clarify what is being measured. A declining share in profit means more coins are estimated to be at an unrealized loss based on their last on-chain movement price. But a price decline alone can change that classification, without any concentrated selling having taken place; internal transfers can also alter cost-basis records. There isn’t enough evidence to extrapolate this into proof that “selling pressure has been exhausted.”
The market reaction is not particularly strong. When I checked BTC/USDT on Binance, it was around $64,882, down about 3.50% over 24 hours, with a low of $62,006 and a high of $67,523. The Fear & Greed Index shown on Binance Square was 12. Sentiment is very cold, but that doesn’t prove a bottom is in. The levels I’m watching are the intraday low area around $62,000 and a reclaim-confirmation level above $65,500. If the price breaks below $62,000 and remains unable to recover it, the bearish view strengthens. If it regains and holds above $65,500 with volume, there would be reason to revise my cautious stance upward. These price levels are trading rules, not forecasts from a news organization.
If I were trading this myself, I wouldn’t chase shorts now, nor buy the dip based on “45%” alone. I’d only consider a small spot long, initially using 2% of total capital, and only if BTC gets back above $65,500 and holds that level on a one-hour retest. If that condition isn’t met, I’d stay out and wait. My first target would be $67,500, where I’d take half off; the second target would be $69,000, with the protection level raised for the remaining position as the price moves up. If the price falls back to $64,200 after entry, I’d exit at a loss. If it breaks below $62,000, or subsequent data shows the methodology was misinterpreted, I’d close immediately and cancel the plan. I’d keep the maximum loss on a single trade to around 0.5% of total capital and avoid high leverage. This is only a conditional plan; I’m not claiming that any trade has been executed.
#BitcoinActiveSupplyInProfitDropsBelow45% #BTC
The above is solely my personal market observation and does not constitute investment advice.
My stance is cautious. People on Binance Square are discussing the claim that “less than 45% of the active BTC supply is in profit.” It’s worth watching, but it shouldn’t be directly translated into “55% of all BTC holders are at a loss,” much less treated as a signal to buy the dip. Statistics cited by Binance News on November 14 excluded coins that had not moved for more than 10 years. The original data provider and details of the real-time calculation were not fully specified in that post. So I treat 45% as a reported figure with limitations in its methodology, not as an independently verified on-chain fact.
Looking at another dataset, CoinGlass put the “supply in profit” at about 10.92 million BTC as of November 13, down around 4.04% from the previous day. Using its total circulating supply methodology, the share of supply in profit was about 54.28%. The 45% and 54.28% figures aren’t necessarily contradictory: different denominators, approaches to dormant coins, and snapshot times can produce different results. The key is to first clarify what is being measured. A declining share in profit means more coins are estimated to be at an unrealized loss based on their last on-chain movement price. But a price decline alone can change that classification, without any concentrated selling having taken place; internal transfers can also alter cost-basis records. There isn’t enough evidence to extrapolate this into proof that “selling pressure has been exhausted.”
The market reaction is not particularly strong. When I checked BTC/USDT on Binance, it was around $64,882, down about 3.50% over 24 hours, with a low of $62,006 and a high of $67,523. The Fear & Greed Index shown on Binance Square was 12. Sentiment is very cold, but that doesn’t prove a bottom is in. The levels I’m watching are the intraday low area around $62,000 and a reclaim-confirmation level above $65,500. If the price breaks below $62,000 and remains unable to recover it, the bearish view strengthens. If it regains and holds above $65,500 with volume, there would be reason to revise my cautious stance upward. These price levels are trading rules, not forecasts from a news organization.
If I were trading this myself, I wouldn’t chase shorts now, nor buy the dip based on “45%” alone. I’d only consider a small spot long, initially using 2% of total capital, and only if BTC gets back above $65,500 and holds that level on a one-hour retest. If that condition isn’t met, I’d stay out and wait. My first target would be $67,500, where I’d take half off; the second target would be $69,000, with the protection level raised for the remaining position as the price moves up. If the price falls back to $64,200 after entry, I’d exit at a loss. If it breaks below $62,000, or subsequent data shows the methodology was misinterpreted, I’d close immediately and cancel the plan. I’d keep the maximum loss on a single trade to around 0.5% of total capital and avoid high leverage. This is only a conditional plan; I’m not claiming that any trade has been executed.
#BitcoinActiveSupplyInProfitDropsBelow45% #BTC
The above is solely my personal market observation and does not constitute investment advice.

1

·
--
Bitcoin’s active supply in profit has fallen below 45%, indicating that most holders are facing losses. According to the latest data from CoinMetrics, this metric has continued to decline over the past few weeks, reflecting pessimistic market sentiment. I’m concerned: a 45% profit ratio is a critical threshold for market health, and falling below it could signal deeper selling pressure. Bitcoin’s status as a safe-haven asset is being challenged, and investors should be wary of potential downside risks. This trend affects not only Bitcoin but also has ripple effects across the entire crypto market. #BitcoinActiveSupplyInProfitDropsBelow45%
$BTC
Bitcoin’s active supply in profit has fallen below 45%, indicating that most holders are facing losses. According to the latest data from CoinMetrics, this metric has continued to decline over the past few weeks, reflecting pessimistic market sentiment. I’m concerned: a 45% profit ratio is a critical threshold for market health, and falling below it could signal deeper selling pressure. Bitcoin’s status as a safe-haven asset is being challenged, and investors should be wary of potential downside risks. This trend affects not only Bitcoin but also has ripple effects across the entire crypto market. #BitcoinActiveSupplyInProfitDropsBelow45%
$BTC
$BTC
165

·
--
“It fell $BTC below $66,000… Should I sell before I lose more?”
The Fear and Greed Index is at 16 (extreme fear). Less than 45% of the active supply is in profit, meaning most new buyers are at a loss.
Selling out of fear turns a paper loss into a real loss.
Will you sell now or hold on?
#BitcoinActiveSupplyInProfitDropsBelow45% #Bitcoin
“It fell $BTC below $66,000… Should I sell before I lose more?”
The Fear and Greed Index is at 16 (extreme fear). Less than 45% of the active supply is in profit, meaning most new buyers are at a loss.
Selling out of fear turns a paper loss into a real loss.
Will you sell now or hold on?
#BitcoinActiveSupplyInProfitDropsBelow45% #Bitcoin
The Fear and Greed Index is at 16 (extreme fear). Less than 45% of the active supply is in profit, meaning most new buyers are at a loss.
Selling out of fear turns a paper loss into a real loss.
Will you sell now or hold on?
#BitcoinActiveSupplyInProfitDropsBelow45% #Bitcoin

108
·
--
BTC Active Supply in Loss Gains Attention | 45% and 54% Use Different Metrics | I’ll Manage Risk Before Considering a Rebound
My stance is defensive. Binance Square is discussing the claim that “the share of active BTC supply in profit has fallen below 45%.” That figure is worth watching, but it should not be presented as meaning that only 45% of all BTC is in profit. The Binance News post explicitly says that coins unmoved for more than ten years were excluded from the calculation. I also checked Glassnode’s public “Percent of Bitcoin Supply in Profit” page, which shows approximately 54.277% based on a broader definition of supply. The two figures cover different sets of coins, so the difference alone is not enough to say which one is wrong, nor should 45% be described as a confirmed on-chain figure for all BTC. The original report did not provide an active-supply data series that I could independently verify, so I treat 45% as that report’s estimate, not as a precise trading signal.
Why does this matter for BTC? A falling share of supply in profit means more participants have a cost basis above the current price, which could lead to selling pressure from holders looking to break even during a rebound. At the same time, a concentration of unrealized losses may draw contrarian investors’ attention to the potential for mean reversion. But the indicator cannot tell us when selling pressure will end, and whether coins that have been unmoved for ten years are included can significantly change the denominator. Glassnode defines the share of total supply in profit by comparing the price of each Bitcoin UTXO when it was created with the current price. It measures unrealized profit and loss; it is not exchange deposits or a prediction of how much BTC will inevitably be sold. Calling a bottom based on a single threshold risks mistaking a statistical description for an entry trigger.
The market reaction is more immediate than the headline. Binance’s public BTC/USDT 24-hour market data shows a latest price of around $65,114, down approximately 4.8% over 24 hours, with an intraday low near $65,067. That is another step down from the roughly $66,662 I recorded last time. Price data and on-chain indicators reflect different points in time, so we cannot conclude that this drop was caused entirely by this data point. My near-term areas to watch are $65,000 and the intraday-low zone. If prices remain below them, my short-term stabilization thesis is invalidated. To the upside, I’ll look first at $66,000, then $66,800. Only if price reclaims and holds above that area would it make sense to turn the idea of “a large share of supply in loss” into a rebound plan.
If I were trading this myself, I would stay out for now and consider only a small spot long after confirmation—not try to catch a sharp drop. If price reclaims and holds above $66,000, then retests and holds that level, I would use no more than 2% of my total capital to test an entry. The first target would be $66,800, where I’d take half off; I’d hold the rest for $68,000. I’d set the initial stop below $64,900, with predefined risk on the trade capped at 0.4% of my account. If price falls back below $65,000 after entry, or if the rebound lacks sustained volume and reverses after a brief rise, I’d close the remaining position. If price breaks below $65,000 first, I’d cancel the entry plan and reassess after a new low. If no trigger occurs, I’ll stay in cash; a plan is not a trade.
Sources: Binance Square trending topics and the original Binance News post, Glassnode’s public indicator definition, and Binance’s public BTC/USDT market data. #BitcoinActiveSupplyInProfitDropsBelow45% #BTC
The above is solely my personal market observation and does not constitute investment advice.
BTC Active Supply in Loss Gains Attention | 45% and 54% Use Different Metrics | I’ll Manage Risk Before Considering a Rebound
My stance is defensive. Binance Square is discussing the claim that “the share of active BTC supply in profit has fallen below 45%.” That figure is worth watching, but it should not be presented as meaning that only 45% of all BTC is in profit. The Binance News post explicitly says that coins unmoved for more than ten years were excluded from the calculation. I also checked Glassnode’s public “Percent of Bitcoin Supply in Profit” page, which shows approximately 54.277% based on a broader definition of supply. The two figures cover different sets of coins, so the difference alone is not enough to say which one is wrong, nor should 45% be described as a confirmed on-chain figure for all BTC. The original report did not provide an active-supply data series that I could independently verify, so I treat 45% as that report’s estimate, not as a precise trading signal.
Why does this matter for BTC? A falling share of supply in profit means more participants have a cost basis above the current price, which could lead to selling pressure from holders looking to break even during a rebound. At the same time, a concentration of unrealized losses may draw contrarian investors’ attention to the potential for mean reversion. But the indicator cannot tell us when selling pressure will end, and whether coins that have been unmoved for ten years are included can significantly change the denominator. Glassnode defines the share of total supply in profit by comparing the price of each Bitcoin UTXO when it was created with the current price. It measures unrealized profit and loss; it is not exchange deposits or a prediction of how much BTC will inevitably be sold. Calling a bottom based on a single threshold risks mistaking a statistical description for an entry trigger.
The market reaction is more immediate than the headline. Binance’s public BTC/USDT 24-hour market data shows a latest price of around $65,114, down approximately 4.8% over 24 hours, with an intraday low near $65,067. That is another step down from the roughly $66,662 I recorded last time. Price data and on-chain indicators reflect different points in time, so we cannot conclude that this drop was caused entirely by this data point. My near-term areas to watch are $65,000 and the intraday-low zone. If prices remain below them, my short-term stabilization thesis is invalidated. To the upside, I’ll look first at $66,000, then $66,800. Only if price reclaims and holds above that area would it make sense to turn the idea of “a large share of supply in loss” into a rebound plan.
If I were trading this myself, I would stay out for now and consider only a small spot long after confirmation—not try to catch a sharp drop. If price reclaims and holds above $66,000, then retests and holds that level, I would use no more than 2% of my total capital to test an entry. The first target would be $66,800, where I’d take half off; I’d hold the rest for $68,000. I’d set the initial stop below $64,900, with predefined risk on the trade capped at 0.4% of my account. If price falls back below $65,000 after entry, or if the rebound lacks sustained volume and reverses after a brief rise, I’d close the remaining position. If price breaks below $65,000 first, I’d cancel the entry plan and reassess after a new low. If no trigger occurs, I’ll stay in cash; a plan is not a trade.
Sources: Binance Square trending topics and the original Binance News post, Glassnode’s public indicator definition, and Binance’s public BTC/USDT market data. #BitcoinActiveSupplyInProfitDropsBelow45% #BTC
The above is solely my personal market observation and does not constitute investment advice.
My stance is defensive. Binance Square is discussing the claim that “the share of active BTC supply in profit has fallen below 45%.” That figure is worth watching, but it should not be presented as meaning that only 45% of all BTC is in profit. The Binance News post explicitly says that coins unmoved for more than ten years were excluded from the calculation. I also checked Glassnode’s public “Percent of Bitcoin Supply in Profit” page, which shows approximately 54.277% based on a broader definition of supply. The two figures cover different sets of coins, so the difference alone is not enough to say which one is wrong, nor should 45% be described as a confirmed on-chain figure for all BTC. The original report did not provide an active-supply data series that I could independently verify, so I treat 45% as that report’s estimate, not as a precise trading signal.
Why does this matter for BTC? A falling share of supply in profit means more participants have a cost basis above the current price, which could lead to selling pressure from holders looking to break even during a rebound. At the same time, a concentration of unrealized losses may draw contrarian investors’ attention to the potential for mean reversion. But the indicator cannot tell us when selling pressure will end, and whether coins that have been unmoved for ten years are included can significantly change the denominator. Glassnode defines the share of total supply in profit by comparing the price of each Bitcoin UTXO when it was created with the current price. It measures unrealized profit and loss; it is not exchange deposits or a prediction of how much BTC will inevitably be sold. Calling a bottom based on a single threshold risks mistaking a statistical description for an entry trigger.
The market reaction is more immediate than the headline. Binance’s public BTC/USDT 24-hour market data shows a latest price of around $65,114, down approximately 4.8% over 24 hours, with an intraday low near $65,067. That is another step down from the roughly $66,662 I recorded last time. Price data and on-chain indicators reflect different points in time, so we cannot conclude that this drop was caused entirely by this data point. My near-term areas to watch are $65,000 and the intraday-low zone. If prices remain below them, my short-term stabilization thesis is invalidated. To the upside, I’ll look first at $66,000, then $66,800. Only if price reclaims and holds above that area would it make sense to turn the idea of “a large share of supply in loss” into a rebound plan.
If I were trading this myself, I would stay out for now and consider only a small spot long after confirmation—not try to catch a sharp drop. If price reclaims and holds above $66,000, then retests and holds that level, I would use no more than 2% of my total capital to test an entry. The first target would be $66,800, where I’d take half off; I’d hold the rest for $68,000. I’d set the initial stop below $64,900, with predefined risk on the trade capped at 0.4% of my account. If price falls back below $65,000 after entry, or if the rebound lacks sustained volume and reverses after a brief rise, I’d close the remaining position. If price breaks below $65,000 first, I’d cancel the entry plan and reassess after a new low. If no trigger occurs, I’ll stay in cash; a plan is not a trade.
Sources: Binance Square trending topics and the original Binance News post, Glassnode’s public indicator definition, and Binance’s public BTC/USDT market data. #BitcoinActiveSupplyInProfitDropsBelow45% #BTC
The above is solely my personal market observation and does not constitute investment advice.

14
·
--
#BitcoinActiveSupplyInProfitDropsBelow45%
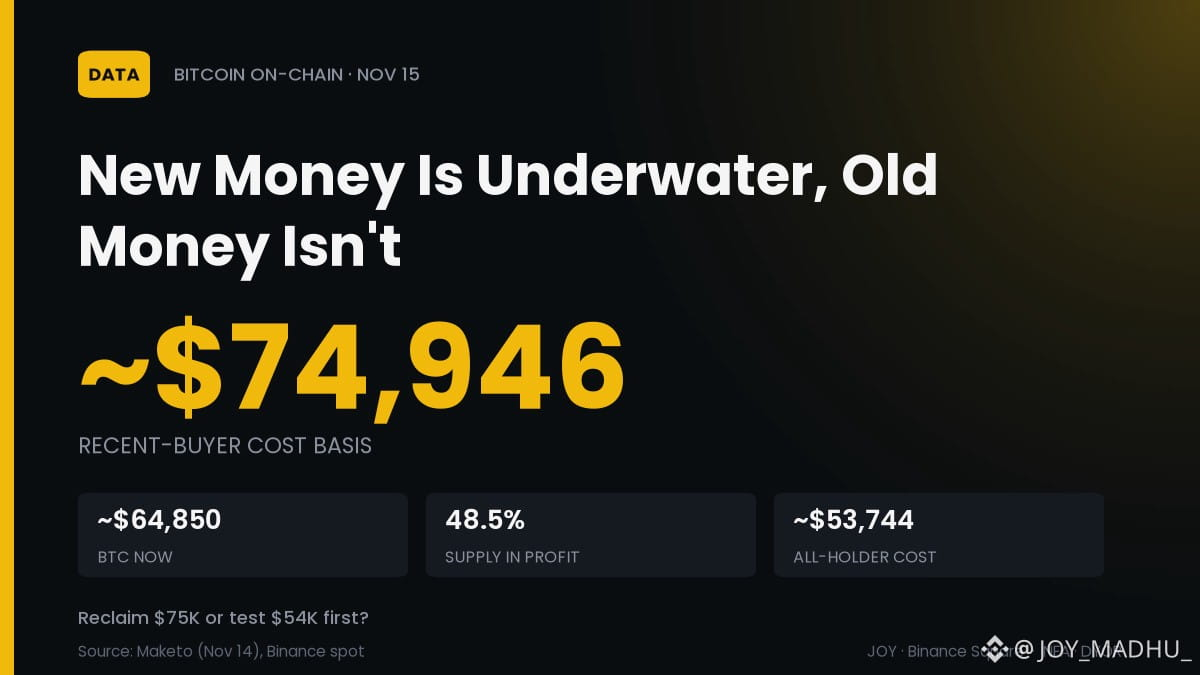
🧱 Recent Buyers Paid ~$75K. BTC Trades Near $65K
The profit squeeze is now a cost-basis story: coins bought in the last ~5 months sit about 13% underwater.
📊 Recent-buyer cost basis ~$74,946 vs BTC ~$64,850
📉 Supply in profit: 48.5% on Nov 14, down from 68.5% on Oct 15
🏦 All-holder cost basis ~$53,744; long-term holders ~$48,721
⚠️ BTC touched ~$62,006 in the last 24h
Zoom out: the pain sits with new money; older holders are still in the green.
Does BTC reclaim $75K before Dec 31, or test the ~$54K all-holder cost basis first? 👇
$BTC
#BitcoinActiveSupplyInProfitDropsBelow45% #BTC #OnChain
#BitcoinActiveSupplyInProfitDropsBelow45%
🧱 Recent Buyers Paid ~$75K. BTC Trades Near $65K
The profit squeeze is now a cost-basis story: coins bought in the last ~5 months sit about 13% underwater.
📊 Recent-buyer cost basis ~$74,946 vs BTC ~$64,850
📉 Supply in profit: 48.5% on Nov 14, down from 68.5% on Oct 15
🏦 All-holder cost basis ~$53,744; long-term holders ~$48,721
⚠️ BTC touched ~$62,006 in the last 24h
Zoom out: the pain sits with new money; older holders are still in the green.
Does BTC reclaim $75K before Dec 31, or test the ~$54K all-holder cost basis first? 👇
$BTC
#BitcoinActiveSupplyInProfitDropsBelow45% #BTC #OnChain
🧱 Recent Buyers Paid ~$75K. BTC Trades Near $65K
The profit squeeze is now a cost-basis story: coins bought in the last ~5 months sit about 13% underwater.
📊 Recent-buyer cost basis ~$74,946 vs BTC ~$64,850
📉 Supply in profit: 48.5% on Nov 14, down from 68.5% on Oct 15
🏦 All-holder cost basis ~$53,744; long-term holders ~$48,721
⚠️ BTC touched ~$62,006 in the last 24h
Zoom out: the pain sits with new money; older holders are still in the green.
Does BTC reclaim $75K before Dec 31, or test the ~$54K all-holder cost basis first? 👇
$BTC
#BitcoinActiveSupplyInProfitDropsBelow45% #BTC #OnChain
30

·
--
The market was already thin on Sunday morning, and today's drop is even more pronounced. $BTC is hovering around 63525, down 7.1% in 24 hours after sliding all the way from 68377 and dipping as low as 63320. It doesn't take much to push the price down when liquidity is thin. $BNB is also down 8.57% to 576.94, with trading quiet and volume concentrated on the way down. The market sentiment index has fallen to Extreme Fear at 12, and the trend charts are also discussing Bitcoin's supply in profit dropping below 45%. Don't get lured in by a fake rebound at a time like this; we won't know the direction until volume returns on Monday. If you're not holding a position, take it easy. Which level will you be watching first when the market opens on Monday? #BitcoinActiveSupplyInProfitDropsBelow45%
The market was already thin on Sunday morning, and today's drop is even more pronounced. $BTC is hovering around 63525, down 7.1% in 24 hours after sliding all the way from 68377 and dipping as low as 63320. It doesn't take much to push the price down when liquidity is thin. $BNB is also down 8.57% to 576.94, with trading quiet and volume concentrated on the way down. The market sentiment index has fallen to Extreme Fear at 12, and the trend charts are also discussing Bitcoin's supply in profit dropping below 45%. Don't get lured in by a fake rebound at a time like this; we won't know the direction until volume returns on Monday. If you're not holding a position, take it easy. Which level will you be watching first when the market opens on Monday? #BitcoinActiveSupplyInProfitDropsBelow45%
76
·
--
US spot $BTC ETFs lost $1.07B last week, the second week in a row above $1B.
Redemptions send coins back to market: distribution.
IBIT holds $53.99B in BTC vs $64.19B paid in. Its buyers sit underwater.
Capitulation or patience: which comes first?
#BitcoinActiveSupplyInProfitDropsBelow45% #Bitcoin
US spot $BTC ETFs lost $1.07B last week, the second week in a row above $1B.
Redemptions send coins back to market: distribution.
IBIT holds $53.99B in BTC vs $64.19B paid in. Its buyers sit underwater.
Capitulation or patience: which comes first?
#BitcoinActiveSupplyInProfitDropsBelow45% #Bitcoin
Redemptions send coins back to market: distribution.
IBIT holds $53.99B in BTC vs $64.19B paid in. Its buyers sit underwater.
Capitulation or patience: which comes first?
#BitcoinActiveSupplyInProfitDropsBelow45% #Bitcoin

BTC+1.04%
IBITETF-4.42%
77
Log in to explore more content
Join global crypto users on Binance Square
⚡️ Get latest and useful information about crypto.
💬 Trusted by the world’s largest crypto exchange.
👍 Discover real insights from verified creators.
Email / Phone number
Trending Topics
1
#CryptoSelloffTriggersMultipleWhaleLiquidations
174,835 views
1,764 Discussing
2
#USSpotXRPETFsSeeLargestWeeklyOutflowIn8Months
156,573 views
1,541 Discussing
3
#WillFOMCMinutesReinforceRateHikeExpectations?
45,618 views
733 Discussing
4
#BitcoinActiveSupplyInProfitDropsBelow45%
232,581 views
1,796 Discussing
5
#TONStrategyReports$23.97MQ3NetLoss
20,313 views
149 Discussing
6
#KavaSaysAbnormalActivityLimitedToKavaLend
154,661 views
1,019 Discussing
7
#WORPTLetsTouristsConvertCryptoToThaiBaht
55,723 views
411 Discussing
8
#WhoWillSucceedJensenHuangatNvidia?
356,841 views
2,157 Discussing
9
#WhatWillDriveCryptoandStocks’NextRebound?
884,370 views
3,969 Discussing
10
#TradFiForBeginners
850,405 views
4,981 Discussing