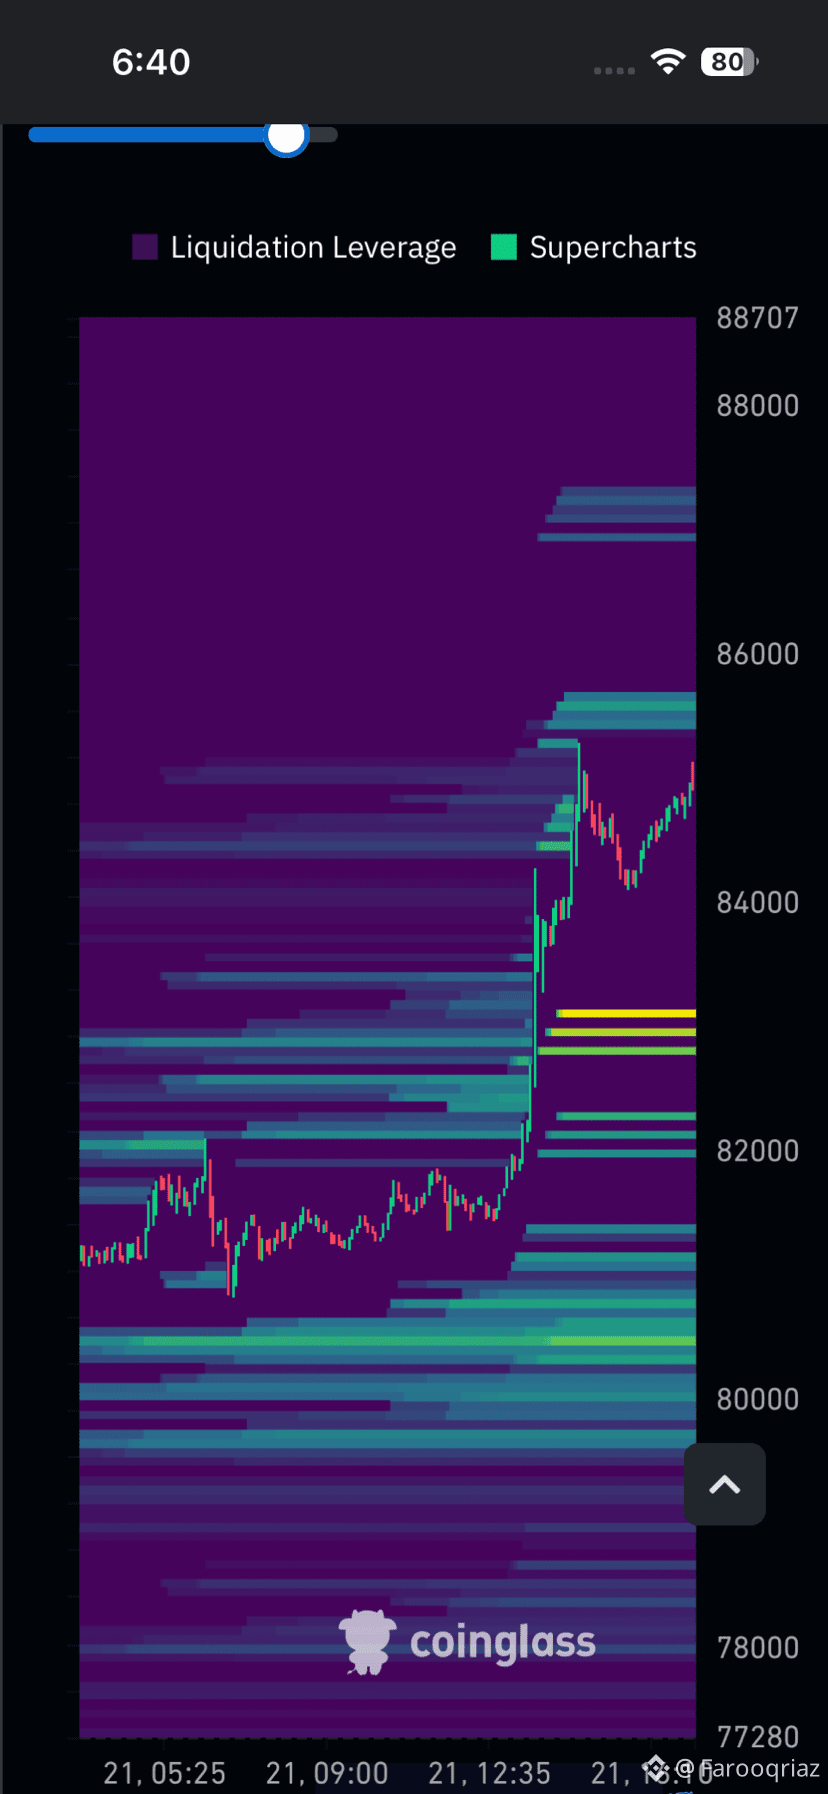
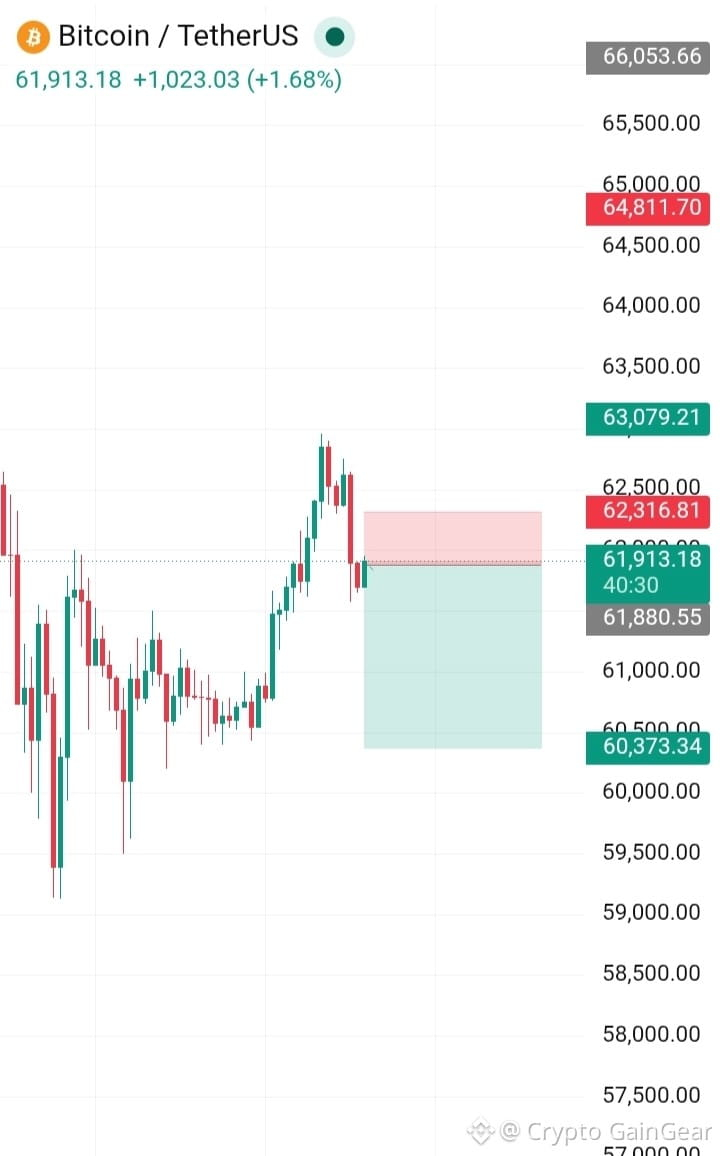
#BTCUSDTUPDATE 💥💥 Short Analysis 📉👇👇
#BinanceReopensWithdrawalsForMoreAssets #CanUSStocksReboundAfterNonfarmPayrolls? Bearish Trend
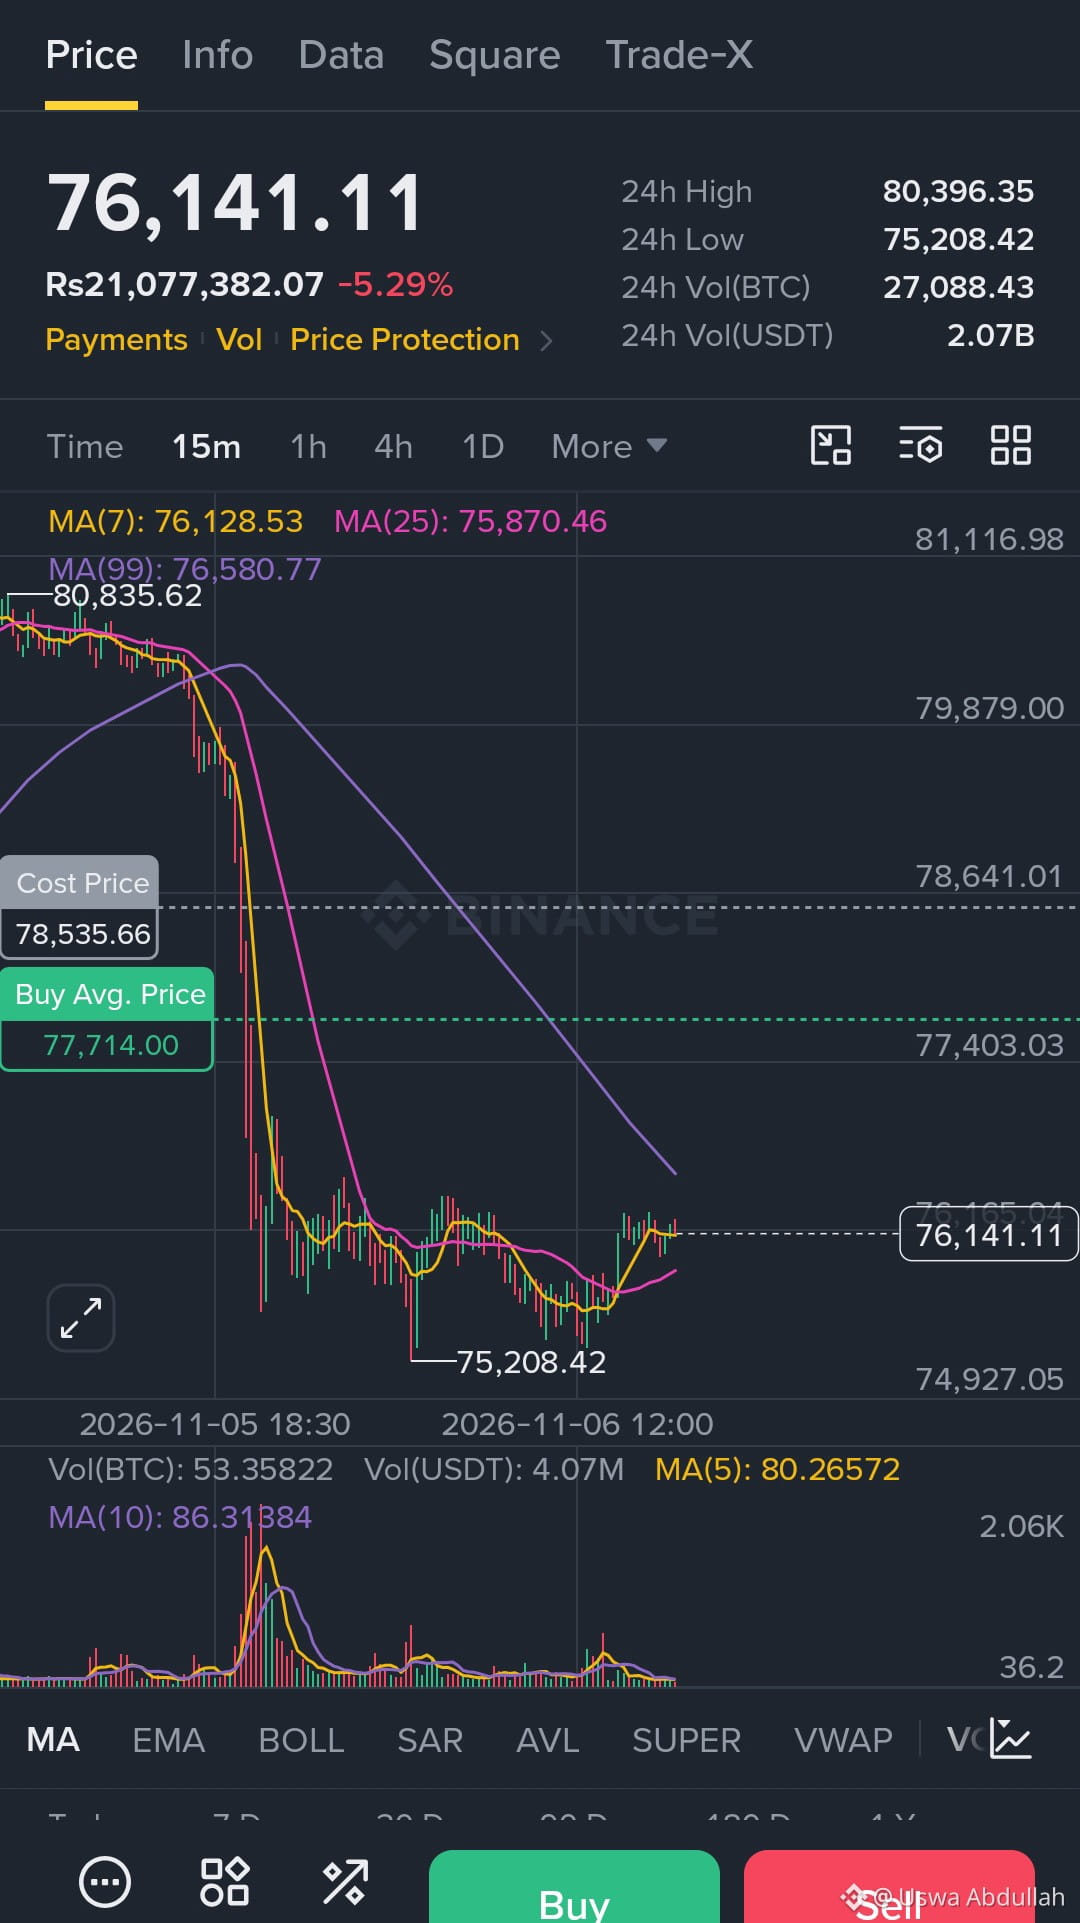
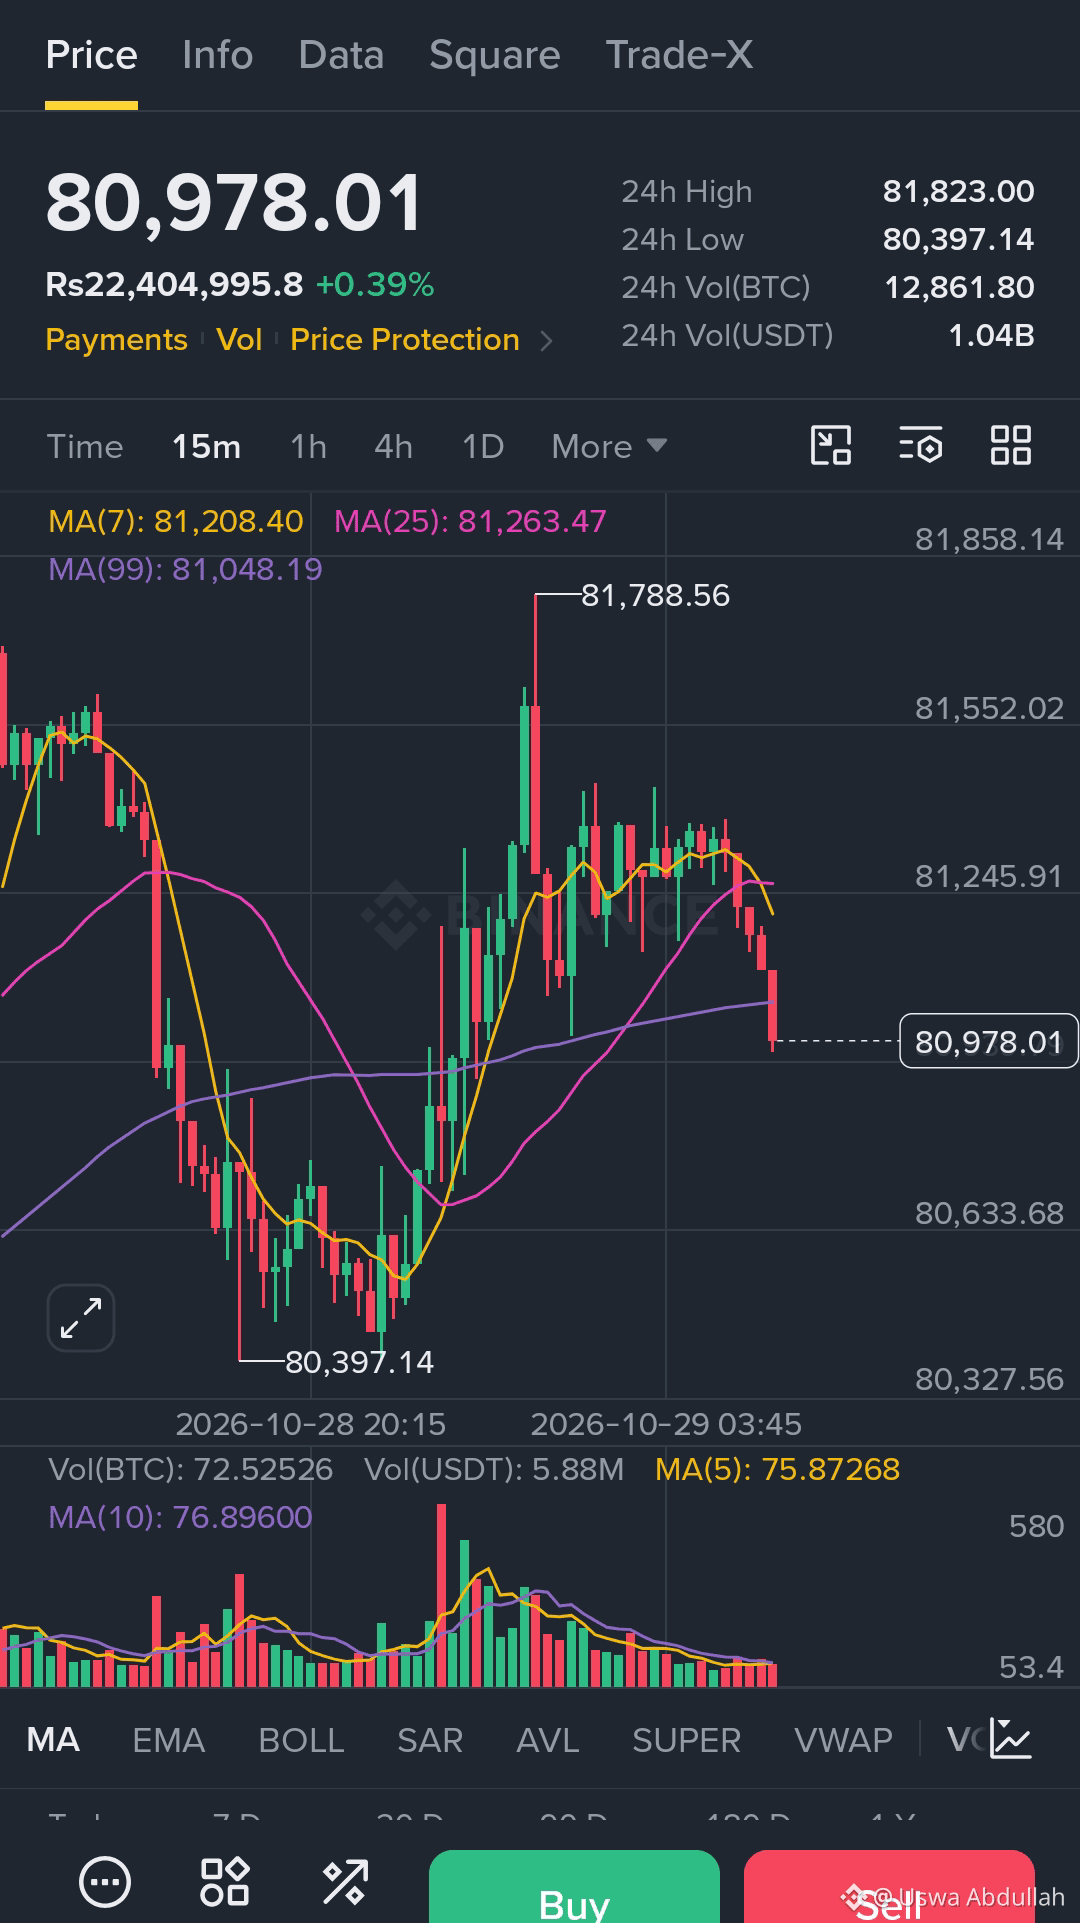
Based on your Binance 15-minute chart,
#BTC is trading around $76,141, down 5.29% in 24 hours.
Technical Analysis
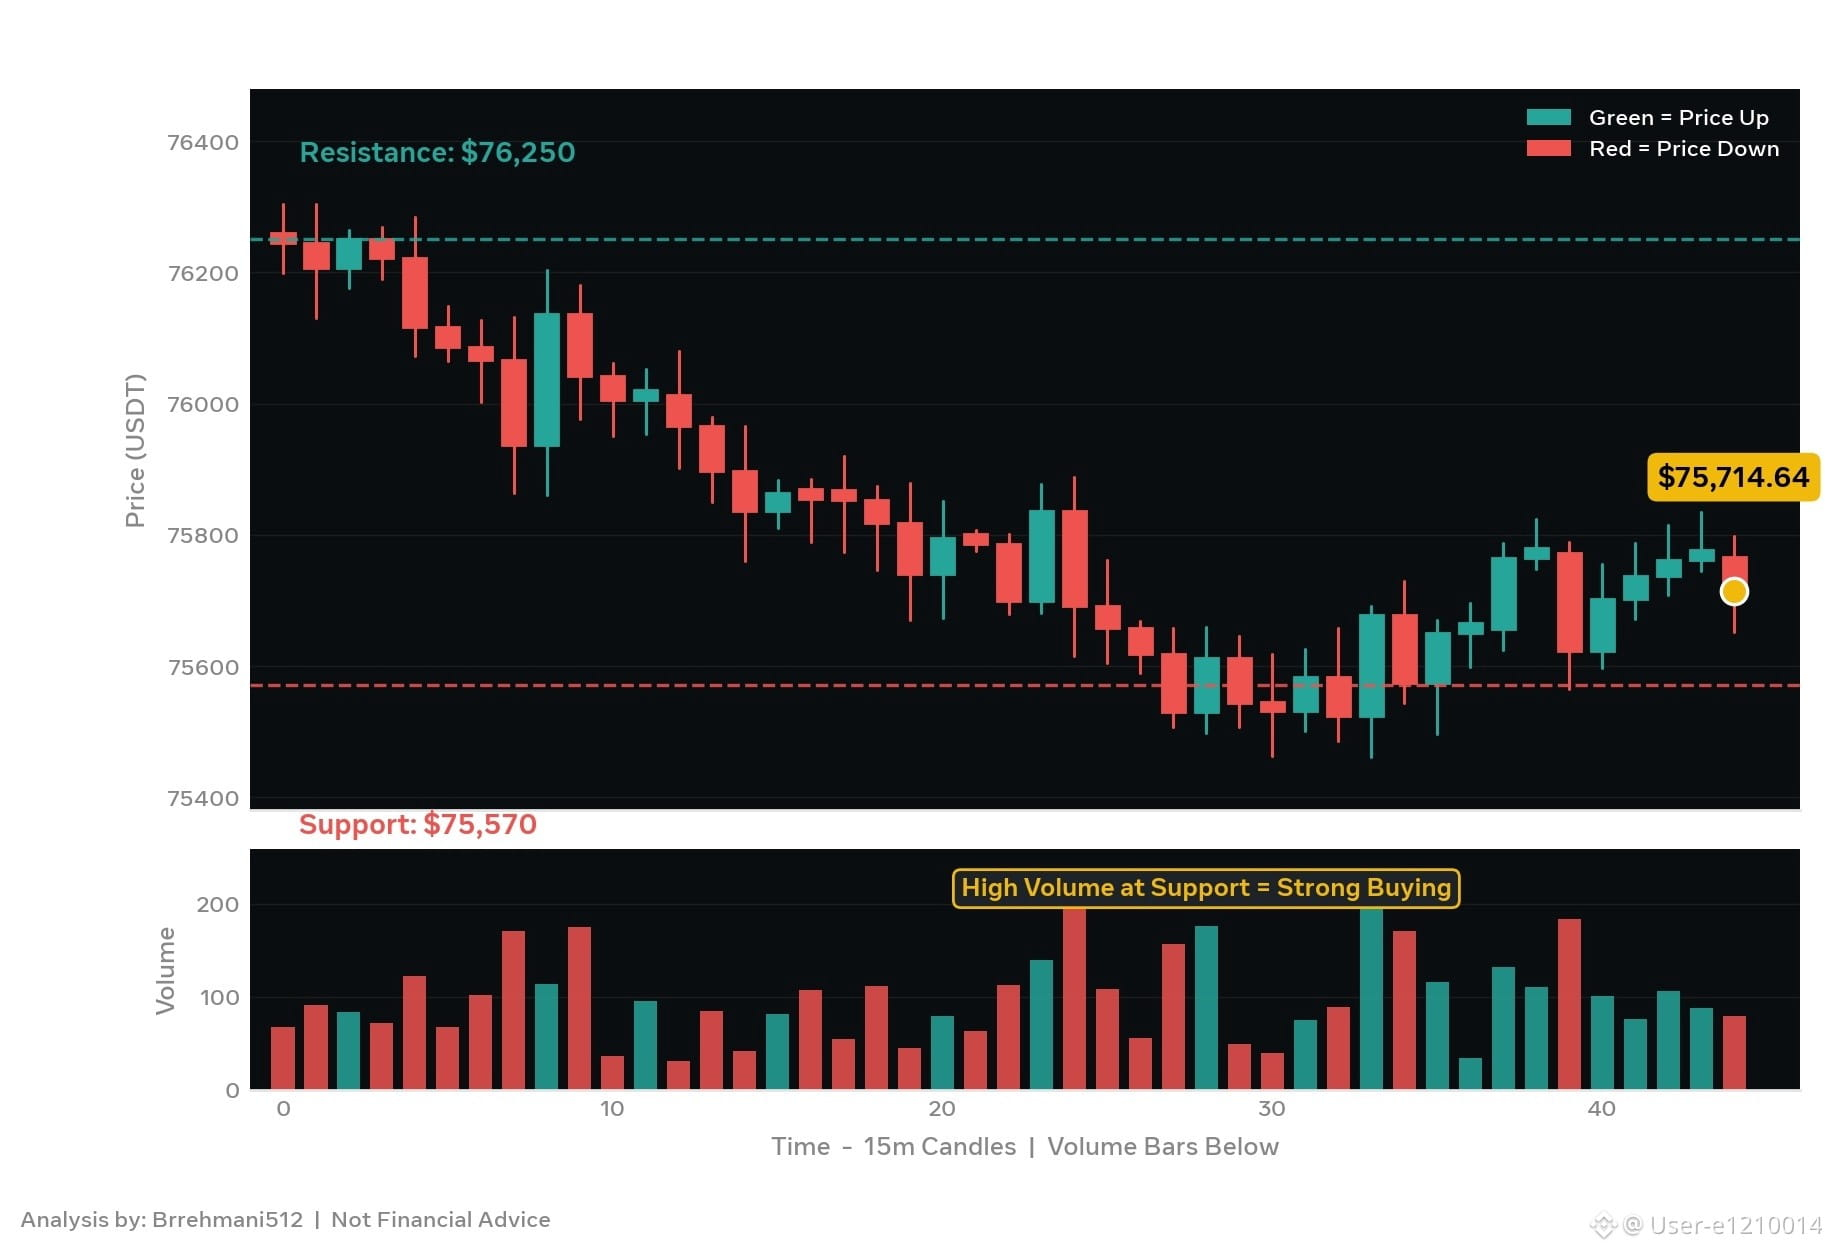
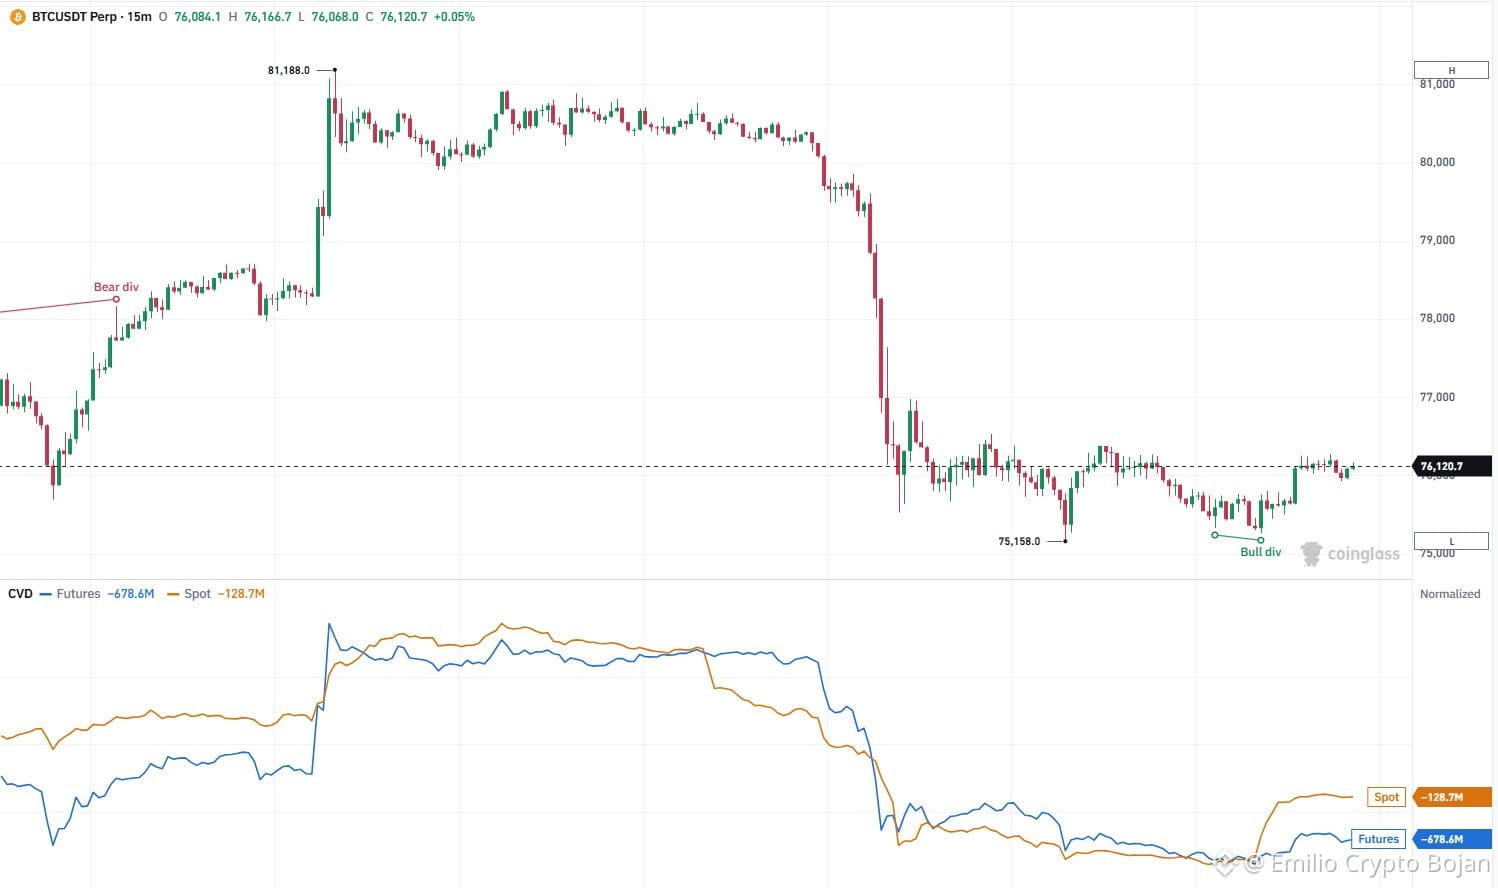
* Trend: Strong bearish momentum after a sharp sell-off.
* Support: $75,208 — recent low.
* Resistance: $76,500–$76,600.
* MA(7): $76,128 — short-term recovery.
* MA(25): $75,870 — price is slightly above this average.
* MA(99): $76,580 — overhead resistance.
$BTC is showing a small recovery, but the overall trend remains bearish. A rejection near $76,500 could trigger another downward move.
Price Prediction & Trading Setup
| Level | Price |
| ------------- | --------------- |
| Entry (Short) | $76,300–$76,550 |
| Stop Loss | $76,850 |
| TP1 | $75,800 |
| TP2 | $75,500 |
| TP3 | $75,208 |
Bullish Scenario
If
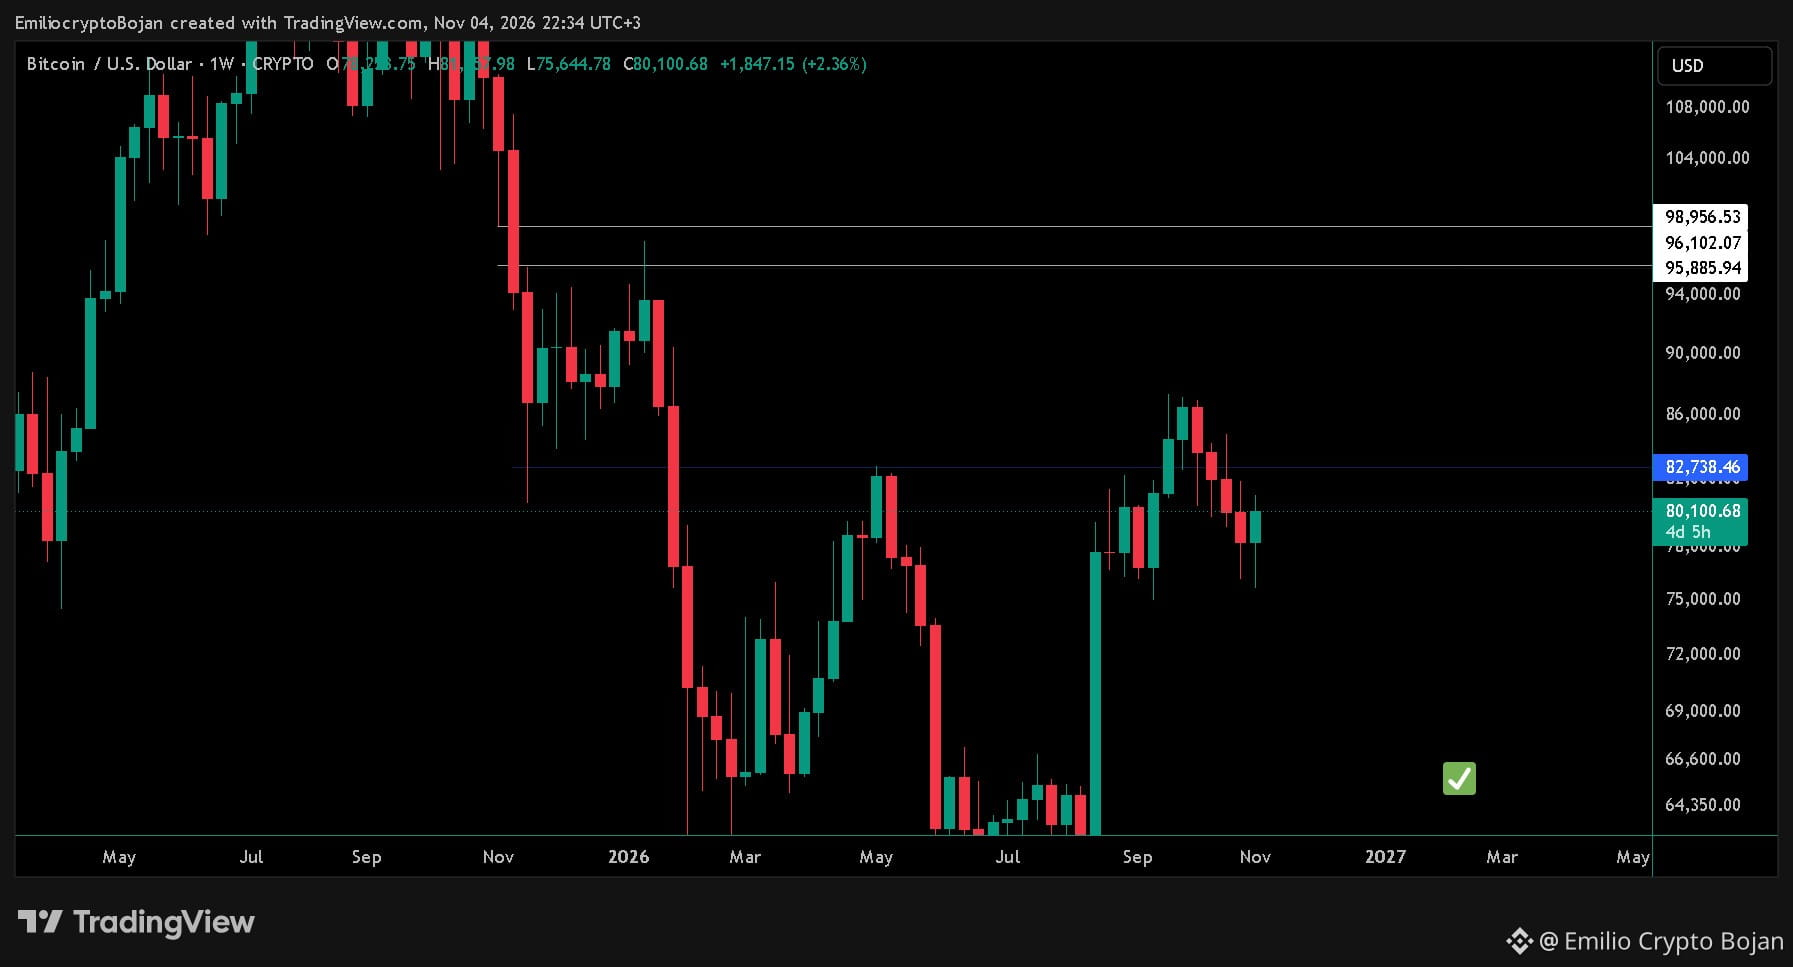
$BTC breaks and holds above $76,600, the next possible targets are $77,000 and $77,400.
Market Outlook
$BTC remains bearish below $76,600. Watch the $75,200 support closely. A breakdown below this level could extend the decline.