
量化员-小姐姐
2.9k Posts

量化员-小姐姐
Report
Block User
我有一个梦想,达到1万粉丝要多久?每天自动分享一些区块链项目知识。
Open Trade

JCT Holder
High-Frequency Trader
8.5 Years
34 Following
35 Followers
31 Liked
Posts
Portfolio
All
Quotes
·
--
See translation
$NKE / 代币化股票·溢价监控
代币: NKEon | 底层: NKE | 系数: 1.02658
链上价格: $39.53(24h +1.83%)
美股底层: $38.51
溢价 / 折价: +0.01%(vs 底层公允价值)
52周区间: $31.97 - $69.14
持仓地址数: 813
底层状态: premarket
为什么盯溢价:代币 24/7 可交易,底层美股只在美东时间开市报价。
休市时段溢价最容易走阔——要么链上抢筹,要么赎回/停牌预期在发酵。
溢价异常跳动,往往比价格本身更早暴露情绪与套利缺口。
你觉得溢价监控更实用,还是只看价格就够了?👇
(以上为公开数据科普,非投资建议,DYOR)
#NKE
$NKE / 代币化股票·溢价监控
代币: NKEon | 底层: NKE | 系数: 1.02658
链上价格: $39.53(24h +1.83%)
美股底层: $38.51
溢价 / 折价: +0.01%(vs 底层公允价值)
52周区间: $31.97 - $69.14
持仓地址数: 813
底层状态: premarket
为什么盯溢价:代币 24/7 可交易,底层美股只在美东时间开市报价。
休市时段溢价最容易走阔——要么链上抢筹,要么赎回/停牌预期在发酵。
溢价异常跳动,往往比价格本身更早暴露情绪与套利缺口。
你觉得溢价监控更实用,还是只看价格就够了?👇
(以上为公开数据科普,非投资建议,DYOR)
#NKE
代币: NKEon | 底层: NKE | 系数: 1.02658
链上价格: $39.53(24h +1.83%)
美股底层: $38.51
溢价 / 折价: +0.01%(vs 底层公允价值)
52周区间: $31.97 - $69.14
持仓地址数: 813
底层状态: premarket
为什么盯溢价:代币 24/7 可交易,底层美股只在美东时间开市报价。
休市时段溢价最容易走阔——要么链上抢筹,要么赎回/停牌预期在发酵。
溢价异常跳动,往往比价格本身更早暴露情绪与套利缺口。
你觉得溢价监控更实用,还是只看价格就够了?👇
(以上为公开数据科普,非投资建议,DYOR)
#NKE
2
·
--
$ONDS / Tokenized Stock · Premium Monitor
Token: ONDSon | Underlying: ONDS | Ratio: 1
On-chain price: $5.09 (24h +0.00%)
Underlying U.S. stock: $5.09
Premium / Discount: +0.00% (vs. underlying fair value)
52-week range: $4.38 - $15.28
Number of holder addresses: 432
Underlying status: overnight
Why monitor the premium? Tokens trade 24/7, while the underlying U.S. stock is quoted only during U.S. market hours.
Premiums are most likely to widen when markets are closed—either as buyers rush in on-chain or expectations of redemptions/trading halts build.
Unusual premium swings often reveal sentiment and arbitrage gaps earlier than the price itself.
Do you find premium monitoring more useful, or is simply watching the price enough? 👇
(For educational purposes based on public data only; not investment advice. DYOR)
#ONDS
$ONDS / Tokenized Stock · Premium Monitor
Token: ONDSon | Underlying: ONDS | Ratio: 1
On-chain price: $5.09 (24h +0.00%)
Underlying U.S. stock: $5.09
Premium / Discount: +0.00% (vs. underlying fair value)
52-week range: $4.38 - $15.28
Number of holder addresses: 432
Underlying status: overnight
Why monitor the premium? Tokens trade 24/7, while the underlying U.S. stock is quoted only during U.S. market hours.
Premiums are most likely to widen when markets are closed—either as buyers rush in on-chain or expectations of redemptions/trading halts build.
Unusual premium swings often reveal sentiment and arbitrage gaps earlier than the price itself.
Do you find premium monitoring more useful, or is simply watching the price enough? 👇
(For educational purposes based on public data only; not investment advice. DYOR)
#ONDS
Token: ONDSon | Underlying: ONDS | Ratio: 1
On-chain price: $5.09 (24h +0.00%)
Underlying U.S. stock: $5.09
Premium / Discount: +0.00% (vs. underlying fair value)
52-week range: $4.38 - $15.28
Number of holder addresses: 432
Underlying status: overnight
Why monitor the premium? Tokens trade 24/7, while the underlying U.S. stock is quoted only during U.S. market hours.
Premiums are most likely to widen when markets are closed—either as buyers rush in on-chain or expectations of redemptions/trading halts build.
Unusual premium swings often reveal sentiment and arbitrage gaps earlier than the price itself.
Do you find premium monitoring more useful, or is simply watching the price enough? 👇
(For educational purposes based on public data only; not investment advice. DYOR)
#ONDS
6
·
--
$AXP / Tokenized Stock · Premium Monitoring
Token: AXPon | Underlying: AXP | Ratio: 1.00962
On-chain price: $322.77 (24h +0.00%)
Underlying U.S. stock: $319.69
Premium / Discount: +0.00% (vs. underlying fair value)
52-week range: $290.97 - $387.49
Holder addresses: 318
Underlying status: overnight
Why monitor the premium: The token trades 24/7, while the underlying U.S. stock is quoted only during U.S. market hours.
Premiums are most likely to widen when markets are closed—either buyers are rushing in on-chain, or expectations of redemptions / trading halts are building.
Unusual premium swings often reveal sentiment and arbitrage gaps before the price itself does.
Do you find premium monitoring more useful, or is watching the price enough? 👇
(The above is for public-data education only, not investment advice. DYOR)
#AXP
$AXP / Tokenized Stock · Premium Monitoring
Token: AXPon | Underlying: AXP | Ratio: 1.00962
On-chain price: $322.77 (24h +0.00%)
Underlying U.S. stock: $319.69
Premium / Discount: +0.00% (vs. underlying fair value)
52-week range: $290.97 - $387.49
Holder addresses: 318
Underlying status: overnight
Why monitor the premium: The token trades 24/7, while the underlying U.S. stock is quoted only during U.S. market hours.
Premiums are most likely to widen when markets are closed—either buyers are rushing in on-chain, or expectations of redemptions / trading halts are building.
Unusual premium swings often reveal sentiment and arbitrage gaps before the price itself does.
Do you find premium monitoring more useful, or is watching the price enough? 👇
(The above is for public-data education only, not investment advice. DYOR)
#AXP
Token: AXPon | Underlying: AXP | Ratio: 1.00962
On-chain price: $322.77 (24h +0.00%)
Underlying U.S. stock: $319.69
Premium / Discount: +0.00% (vs. underlying fair value)
52-week range: $290.97 - $387.49
Holder addresses: 318
Underlying status: overnight
Why monitor the premium: The token trades 24/7, while the underlying U.S. stock is quoted only during U.S. market hours.
Premiums are most likely to widen when markets are closed—either buyers are rushing in on-chain, or expectations of redemptions / trading halts are building.
Unusual premium swings often reveal sentiment and arbitrage gaps before the price itself does.
Do you find premium monitoring more useful, or is watching the price enough? 👇
(The above is for public-data education only, not investment advice. DYOR)
#AXP
AXPUS+0.10%
·
--
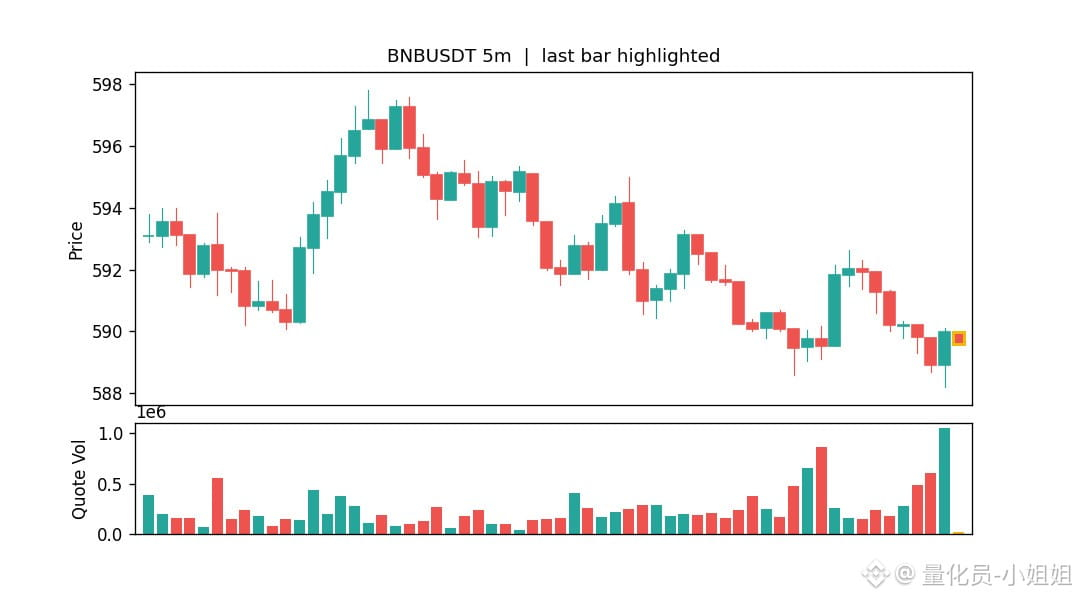
$BNB just saw its volume surge to 13.4× its usual 5-minute level—this isn’t random fluctuation.
Let me break down what’s moving.
5m volume: $37,350 (≈13.4× normal)
5m change: -0.06% ▼
Price: $589.86
Time: 2026-11-16 06:00 UTC
My take: This kind of volume often shows up before a real move—or it could just be a quick liquidity sweep that fades just as fast. I’ll watch the closing price to see whether it can hold above the breakout level.
Have you seen $BNB make a move early before, or was it a false breakout shakeout? Share your thoughts 👇
#BNB #BinanceCoin
$BNB just saw its volume surge to 13.4× its usual 5-minute level—this isn’t random fluctuation.
Let me break down what’s moving.
5m volume: $37,350 (≈13.4× normal)
5m change: -0.06% ▼
Price: $589.86
Time: 2026-11-16 06:00 UTC
My take: This kind of volume often shows up before a real move—or it could just be a quick liquidity sweep that fades just as fast. I’ll watch the closing price to see whether it can hold above the breakout level.
Have you seen $BNB make a move early before, or was it a false breakout shakeout? Share your thoughts 👇
#BNB #BinanceCoin
Let me break down what’s moving.
5m volume: $37,350 (≈13.4× normal)
5m change: -0.06% ▼
Price: $589.86
Time: 2026-11-16 06:00 UTC
My take: This kind of volume often shows up before a real move—or it could just be a quick liquidity sweep that fades just as fast. I’ll watch the closing price to see whether it can hold above the breakout level.
Have you seen $BNB make a move early before, or was it a false breakout shakeout? Share your thoughts 👇
#BNB #BinanceCoin
3
·
--
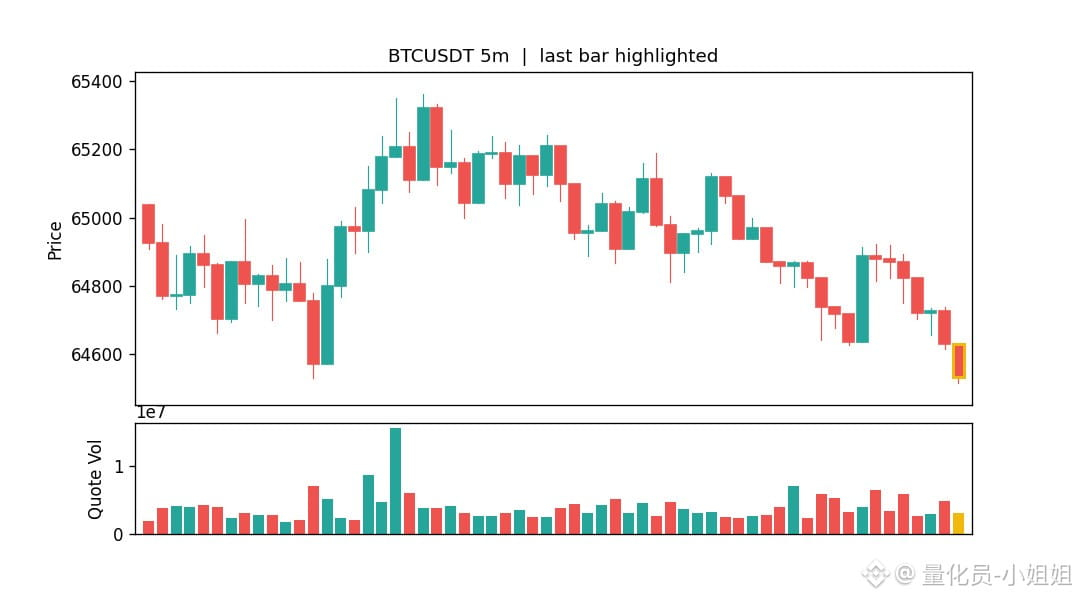
$BTC just saw its volume surge to 13.9x its usual 5-minute volume—this isn't random fluctuation.
Let me explain what's really moving.
5m volume: $62,201,431 (≈13.9x normal)
5m change: -0.10% ▼
Price: $64526.1
Time: 2026-11-16 05:50 UTC
My take: This kind of volume often shows up before a genuine move—or it's just a liquidity sweep that quickly fizzles out. I'll watch to see whether the price can hold above the breakout level after the candle closes.
Have you seen $BTC make an early move before, or was it a fakeout shakeout? Share your thoughts 👇
#BTC #Bitcoin
$BTC just saw its volume surge to 13.9x its usual 5-minute volume—this isn't random fluctuation.
Let me explain what's really moving.
5m volume: $62,201,431 (≈13.9x normal)
5m change: -0.10% ▼
Price: $64526.1
Time: 2026-11-16 05:50 UTC
My take: This kind of volume often shows up before a genuine move—or it's just a liquidity sweep that quickly fizzles out. I'll watch to see whether the price can hold above the breakout level after the candle closes.
Have you seen $BTC make an early move before, or was it a fakeout shakeout? Share your thoughts 👇
#BTC #Bitcoin
Let me explain what's really moving.
5m volume: $62,201,431 (≈13.9x normal)
5m change: -0.10% ▼
Price: $64526.1
Time: 2026-11-16 05:50 UTC
My take: This kind of volume often shows up before a genuine move—or it's just a liquidity sweep that quickly fizzles out. I'll watch to see whether the price can hold above the breakout level after the candle closes.
Have you seen $BTC make an early move before, or was it a fakeout shakeout? Share your thoughts 👇
#BTC #Bitcoin
1
·
--
$CLOI / Tokenized Stock · Premium Monitor
Token: CLOIon | Underlying: CLOI | Ratio: 1.02908
On-chain price: $54.40 (24h -0.00%)
Underlying US stock: $52.86
Premium / Discount: +0.00% (vs. underlying fair value)
52-week range: $52.36 - $53.07
Number of holder addresses: 34
Underlying status: overnight
Why monitor the premium? The token trades 24/7, while the underlying US stock is quoted only during US Eastern Time market hours.
Premiums are most likely to widen outside market hours—either due to on-chain buying pressure or growing expectations of redemptions / trading halts.
Unusual premium swings often reveal sentiment and arbitrage gaps earlier than the price itself.
Do you find premium monitoring more useful, or is just watching the price enough? 👇
(The above is educational information based on public data, not investment advice. DYOR)
#CLOI
$CLOI / Tokenized Stock · Premium Monitor
Token: CLOIon | Underlying: CLOI | Ratio: 1.02908
On-chain price: $54.40 (24h -0.00%)
Underlying US stock: $52.86
Premium / Discount: +0.00% (vs. underlying fair value)
52-week range: $52.36 - $53.07
Number of holder addresses: 34
Underlying status: overnight
Why monitor the premium? The token trades 24/7, while the underlying US stock is quoted only during US Eastern Time market hours.
Premiums are most likely to widen outside market hours—either due to on-chain buying pressure or growing expectations of redemptions / trading halts.
Unusual premium swings often reveal sentiment and arbitrage gaps earlier than the price itself.
Do you find premium monitoring more useful, or is just watching the price enough? 👇
(The above is educational information based on public data, not investment advice. DYOR)
#CLOI
Token: CLOIon | Underlying: CLOI | Ratio: 1.02908
On-chain price: $54.40 (24h -0.00%)
Underlying US stock: $52.86
Premium / Discount: +0.00% (vs. underlying fair value)
52-week range: $52.36 - $53.07
Number of holder addresses: 34
Underlying status: overnight
Why monitor the premium? The token trades 24/7, while the underlying US stock is quoted only during US Eastern Time market hours.
Premiums are most likely to widen outside market hours—either due to on-chain buying pressure or growing expectations of redemptions / trading halts.
Unusual premium swings often reveal sentiment and arbitrage gaps earlier than the price itself.
Do you find premium monitoring more useful, or is just watching the price enough? 👇
(The above is educational information based on public data, not investment advice. DYOR)
#CLOI
1
·
--
$META / Tokenized Stock · Premium Monitoring
Token: METAon | Underlying: META | Multiplier: 1.00283
On-chain price: $640.16 (24h +1.12%)
Underlying U.S. stock: $638.33
Premium / Discount: +0.00% (vs. underlying fair value)
52-week range: $520.26 - $779.82
Number of holder addresses: 2529
Underlying status: overnight
Why monitor the premium? The token can be traded 24/7, while the underlying U.S. stock is quoted only during U.S. market hours.
Premiums are most likely to widen when the market is closed—either due to on-chain buying pressure or growing expectations of redemptions or a trading halt.
Unusual swings in the premium often reveal sentiment and arbitrage gaps before the price itself does.
Do you find premium monitoring more useful, or is looking at the price alone enough? 👇
(The above is for educational purposes and based on public data. Not investment advice. DYOR.)
#META
$META / Tokenized Stock · Premium Monitoring
Token: METAon | Underlying: META | Multiplier: 1.00283
On-chain price: $640.16 (24h +1.12%)
Underlying U.S. stock: $638.33
Premium / Discount: +0.00% (vs. underlying fair value)
52-week range: $520.26 - $779.82
Number of holder addresses: 2529
Underlying status: overnight
Why monitor the premium? The token can be traded 24/7, while the underlying U.S. stock is quoted only during U.S. market hours.
Premiums are most likely to widen when the market is closed—either due to on-chain buying pressure or growing expectations of redemptions or a trading halt.
Unusual swings in the premium often reveal sentiment and arbitrage gaps before the price itself does.
Do you find premium monitoring more useful, or is looking at the price alone enough? 👇
(The above is for educational purposes and based on public data. Not investment advice. DYOR.)
#META
Token: METAon | Underlying: META | Multiplier: 1.00283
On-chain price: $640.16 (24h +1.12%)
Underlying U.S. stock: $638.33
Premium / Discount: +0.00% (vs. underlying fair value)
52-week range: $520.26 - $779.82
Number of holder addresses: 2529
Underlying status: overnight
Why monitor the premium? The token can be traded 24/7, while the underlying U.S. stock is quoted only during U.S. market hours.
Premiums are most likely to widen when the market is closed—either due to on-chain buying pressure or growing expectations of redemptions or a trading halt.
Unusual swings in the premium often reveal sentiment and arbitrage gaps before the price itself does.
Do you find premium monitoring more useful, or is looking at the price alone enough? 👇
(The above is for educational purposes and based on public data. Not investment advice. DYOR.)
#META
·
--
🔍 $HBAR Price Decline Breakdown
5 min: +0.15%
1h: -0.54%
4h: -1.16%
24h: +6.34%
Current price: 0.05866, 24h trading volume: $6.78 million
The decline was mainly concentrated over 4h, indicating a sudden sell-off.
Do you think this is a sentiment-driven exit or a weakening trend? 👇
(Data breakdown, not investment advice. DYOR)
#HBAR
🔍 $HBAR Price Decline Breakdown
5 min: +0.15%
1h: -0.54%
4h: -1.16%
24h: +6.34%
Current price: 0.05866, 24h trading volume: $6.78 million
The decline was mainly concentrated over 4h, indicating a sudden sell-off.
Do you think this is a sentiment-driven exit or a weakening trend? 👇
(Data breakdown, not investment advice. DYOR)
#HBAR
5 min: +0.15%
1h: -0.54%
4h: -1.16%
24h: +6.34%
Current price: 0.05866, 24h trading volume: $6.78 million
The decline was mainly concentrated over 4h, indicating a sudden sell-off.
Do you think this is a sentiment-driven exit or a weakening trend? 👇
(Data breakdown, not investment advice. DYOR)
#HBAR
·
--
🔍 $SUI Price Drop Breakdown
5 min: -0.03%
1h: -1.18%
4h: -2.39%
24h: +6.41%
Current price: 0.72, 24h trading volume: $27.7 million
The decline was mainly concentrated in the 4h period, indicating a sudden sell-off.
Do you think this is a sentiment-driven exit or a trend reversal? 👇
(Data analysis, not investment advice. DYOR)
#SUI #Sui
🔍 $SUI Price Drop Breakdown
5 min: -0.03%
1h: -1.18%
4h: -2.39%
24h: +6.41%
Current price: 0.72, 24h trading volume: $27.7 million
The decline was mainly concentrated in the 4h period, indicating a sudden sell-off.
Do you think this is a sentiment-driven exit or a trend reversal? 👇
(Data analysis, not investment advice. DYOR)
#SUI #Sui
5 min: -0.03%
1h: -1.18%
4h: -2.39%
24h: +6.41%
Current price: 0.72, 24h trading volume: $27.7 million
The decline was mainly concentrated in the 4h period, indicating a sudden sell-off.
Do you think this is a sentiment-driven exit or a trend reversal? 👇
(Data analysis, not investment advice. DYOR)
#SUI #Sui
·
--
🔍 $NEAR Price Drop Breakdown
5 min: +0.03%
1h: -0.63%
4h: -2.08%
24h: +5.99%
Current price: 3.15, 24h trading volume: $61.32 million
The price drop was mainly concentrated in the 4h period—a sudden sell-off.
Do you think this is an emotional exodus or a trend reversal? 👇
(Data analysis, not investment advice. DYOR)
#NEAR #Near
🔍 $NEAR Price Drop Breakdown
5 min: +0.03%
1h: -0.63%
4h: -2.08%
24h: +5.99%
Current price: 3.15, 24h trading volume: $61.32 million
The price drop was mainly concentrated in the 4h period—a sudden sell-off.
Do you think this is an emotional exodus or a trend reversal? 👇
(Data analysis, not investment advice. DYOR)
#NEAR #Near
5 min: +0.03%
1h: -0.63%
4h: -2.08%
24h: +5.99%
Current price: 3.15, 24h trading volume: $61.32 million
The price drop was mainly concentrated in the 4h period—a sudden sell-off.
Do you think this is an emotional exodus or a trend reversal? 👇
(Data analysis, not investment advice. DYOR)
#NEAR #Near
·
--
🔍 $INIT Price Drop Breakdown
5 minutes: +0.44%
1h: -0.88%
4h: -1.47%
24h: +5.61%
Current price: 0.10651, 24h trading volume: $20.66 million
The decline was mainly concentrated over 4h, suggesting a sudden sell-off.
Do you think this is a sentiment-driven exit or a trend breakdown? 👇
(Data analysis, not investment advice. DYOR)
#INIT
🔍 $INIT Price Drop Breakdown
5 minutes: +0.44%
1h: -0.88%
4h: -1.47%
24h: +5.61%
Current price: 0.10651, 24h trading volume: $20.66 million
The decline was mainly concentrated over 4h, suggesting a sudden sell-off.
Do you think this is a sentiment-driven exit or a trend breakdown? 👇
(Data analysis, not investment advice. DYOR)
#INIT
5 minutes: +0.44%
1h: -0.88%
4h: -1.47%
24h: +5.61%
Current price: 0.10651, 24h trading volume: $20.66 million
The decline was mainly concentrated over 4h, suggesting a sudden sell-off.
Do you think this is a sentiment-driven exit or a trend breakdown? 👇
(Data analysis, not investment advice. DYOR)
#INIT
·
--
🔍 $ONE Price Gain Breakdown
5 minutes: -0.08%
1h: -0.37%
4h: +0.68%
24h: +5.98%
Current price: 0.001329, 24h trading volume: $7.48 million
Most of the gains came in the 4h period, suggesting a sudden pump.
Do you think this is a genuine breakout or a pump-and-dump? 👇
(Data analysis, not investment advice. DYOR)
#ONE
🔍 $ONE Price Gain Breakdown
5 minutes: -0.08%
1h: -0.37%
4h: +0.68%
24h: +5.98%
Current price: 0.001329, 24h trading volume: $7.48 million
Most of the gains came in the 4h period, suggesting a sudden pump.
Do you think this is a genuine breakout or a pump-and-dump? 👇
(Data analysis, not investment advice. DYOR)
#ONE
5 minutes: -0.08%
1h: -0.37%
4h: +0.68%
24h: +5.98%
Current price: 0.001329, 24h trading volume: $7.48 million
Most of the gains came in the 4h period, suggesting a sudden pump.
Do you think this is a genuine breakout or a pump-and-dump? 👇
(Data analysis, not investment advice. DYOR)
#ONE
·
--
🔍 $CRCLB Gain Breakdown
5 minutes: +0.19%
1h: +0.43%
4h: +0.34%
24h: +5.92%
Current price: 58.54, 24h trading volume: $13.23 million
Up +5.92% in a single day, with gains not concentrated in any one short-term period—more like a steady climb throughout the day.
Do you think this is a genuine breakout or a pump-and-dump? 👇
(Data breakdown, not investment advice. DYOR.)
#CRCLB
🔍 $CRCLB Gain Breakdown
5 minutes: +0.19%
1h: +0.43%
4h: +0.34%
24h: +5.92%
Current price: 58.54, 24h trading volume: $13.23 million
Up +5.92% in a single day, with gains not concentrated in any one short-term period—more like a steady climb throughout the day.
Do you think this is a genuine breakout or a pump-and-dump? 👇
(Data breakdown, not investment advice. DYOR.)
#CRCLB
5 minutes: +0.19%
1h: +0.43%
4h: +0.34%
24h: +5.92%
Current price: 58.54, 24h trading volume: $13.23 million
Up +5.92% in a single day, with gains not concentrated in any one short-term period—more like a steady climb throughout the day.
Do you think this is a genuine breakout or a pump-and-dump? 👇
(Data breakdown, not investment advice. DYOR.)
#CRCLB
10
·
--
🔍 $ARB Price Gain Breakdown
5 min: +0.07%
1h: +0.07%
4h: -0.74%
24h: +5.77%
Current price: 0.1338, 24h trading volume: $6.84 million
Up +5.77% in a single day, with gains not concentrated in any one short-term period—more like a steady, gradual rise throughout the day.
Do you think this is a genuine breakout or a pump-and-dump? 👇
(Data breakdown, not investment advice. DYOR)
#ARB #Arbitrum
🔍 $ARB Price Gain Breakdown
5 min: +0.07%
1h: +0.07%
4h: -0.74%
24h: +5.77%
Current price: 0.1338, 24h trading volume: $6.84 million
Up +5.77% in a single day, with gains not concentrated in any one short-term period—more like a steady, gradual rise throughout the day.
Do you think this is a genuine breakout or a pump-and-dump? 👇
(Data breakdown, not investment advice. DYOR)
#ARB #Arbitrum
5 min: +0.07%
1h: +0.07%
4h: -0.74%
24h: +5.77%
Current price: 0.1338, 24h trading volume: $6.84 million
Up +5.77% in a single day, with gains not concentrated in any one short-term period—more like a steady, gradual rise throughout the day.
Do you think this is a genuine breakout or a pump-and-dump? 👇
(Data breakdown, not investment advice. DYOR)
#ARB #Arbitrum
·
--
🔍 $MSTRB Price Gain Breakdown
5 minutes: +0.13%
1h: +1.25%
4h: +1.56%
24h: +6.39%
Current price: 103.06, 24h trading volume: $15.02 million
Most of the gain occurred over 4h, suggesting a sudden pump.
Do you think this is a genuine breakout or a pump-and-dump? 👇
(Data analysis, not investment advice. DYOR)
#MSTRB
🔍 $MSTRB Price Gain Breakdown
5 minutes: +0.13%
1h: +1.25%
4h: +1.56%
24h: +6.39%
Current price: 103.06, 24h trading volume: $15.02 million
Most of the gain occurred over 4h, suggesting a sudden pump.
Do you think this is a genuine breakout or a pump-and-dump? 👇
(Data analysis, not investment advice. DYOR)
#MSTRB
5 minutes: +0.13%
1h: +1.25%
4h: +1.56%
24h: +6.39%
Current price: 103.06, 24h trading volume: $15.02 million
Most of the gain occurred over 4h, suggesting a sudden pump.
Do you think this is a genuine breakout or a pump-and-dump? 👇
(Data analysis, not investment advice. DYOR)
#MSTRB
·
--
🔍 $TAO Price Drop Breakdown
5 min: +0.10%
1h: -1.13%
4h: -1.13%
24h: +5.42%
Current price: 192.7, 24h trading volume: $14.39 million
The drop is mainly concentrated in the 1h period—a sudden sell-off.
Do you think this is panic selling or a trend breakdown? 👇
(Data analysis, not investment advice. DYOR)
#TAO
🔍 $TAO Price Drop Breakdown
5 min: +0.10%
1h: -1.13%
4h: -1.13%
24h: +5.42%
Current price: 192.7, 24h trading volume: $14.39 million
The drop is mainly concentrated in the 1h period—a sudden sell-off.
Do you think this is panic selling or a trend breakdown? 👇
(Data analysis, not investment advice. DYOR)
#TAO
5 min: +0.10%
1h: -1.13%
4h: -1.13%
24h: +5.42%
Current price: 192.7, 24h trading volume: $14.39 million
The drop is mainly concentrated in the 1h period—a sudden sell-off.
Do you think this is panic selling or a trend breakdown? 👇
(Data analysis, not investment advice. DYOR)
#TAO
1
·
--
🔍 $NIGHT Price Drop Breakdown
5 min: -0.24%
1h: -1.11%
4h: -1.11%
24h: +5.61%
Current price: 0.04898, 24h trading volume: $7.55 million
The decline was concentrated in the 1h period—a sudden sell-off.
Do you think this is an emotional exit or a trend reversal? 👇
(Data analysis, not investment advice. DYOR)
#NIGHT
🔍 $NIGHT Price Drop Breakdown
5 min: -0.24%
1h: -1.11%
4h: -1.11%
24h: +5.61%
Current price: 0.04898, 24h trading volume: $7.55 million
The decline was concentrated in the 1h period—a sudden sell-off.
Do you think this is an emotional exit or a trend reversal? 👇
(Data analysis, not investment advice. DYOR)
#NIGHT
5 min: -0.24%
1h: -1.11%
4h: -1.11%
24h: +5.61%
Current price: 0.04898, 24h trading volume: $7.55 million
The decline was concentrated in the 1h period—a sudden sell-off.
Do you think this is an emotional exit or a trend reversal? 👇
(Data analysis, not investment advice. DYOR)
#NIGHT
·
--
🔍 $UNI Price Drop Breakdown
5 min: -0.14%
1h: -1.35%
4h: -1.35%
24h: +6.90%
Current price: 5.115, 24h trading volume: $39.56 million
The decline was mainly concentrated in the 1h period, indicating a sudden sell-off.
Do you think this is panic selling or a weakening trend? 👇
(Data breakdown, not investment advice. DYOR)
#UNI #Uniswap
🔍 $UNI Price Drop Breakdown
5 min: -0.14%
1h: -1.35%
4h: -1.35%
24h: +6.90%
Current price: 5.115, 24h trading volume: $39.56 million
The decline was mainly concentrated in the 1h period, indicating a sudden sell-off.
Do you think this is panic selling or a weakening trend? 👇
(Data breakdown, not investment advice. DYOR)
#UNI #Uniswap
5 min: -0.14%
1h: -1.35%
4h: -1.35%
24h: +6.90%
Current price: 5.115, 24h trading volume: $39.56 million
The decline was mainly concentrated in the 1h period, indicating a sudden sell-off.
Do you think this is panic selling or a weakening trend? 👇
(Data breakdown, not investment advice. DYOR)
#UNI #Uniswap
·
--
🔍 $SOXLB Price Gain Breakdown
5 minutes: +0.59%
1h: +0.00%
4h: +0.09%
24h: +8.03%
Current price: 58.28, 24h trading volume: $21.87 million
Most of the gains happened in the last 5 minutes—a sudden pump.
Do you think this is a real breakout or a pump and dump? 👇
(Data breakdown, not investment advice. DYOR)
#SOXLB
🔍 $SOXLB Price Gain Breakdown
5 minutes: +0.59%
1h: +0.00%
4h: +0.09%
24h: +8.03%
Current price: 58.28, 24h trading volume: $21.87 million
Most of the gains happened in the last 5 minutes—a sudden pump.
Do you think this is a real breakout or a pump and dump? 👇
(Data breakdown, not investment advice. DYOR)
#SOXLB
5 minutes: +0.59%
1h: +0.00%
4h: +0.09%
24h: +8.03%
Current price: 58.28, 24h trading volume: $21.87 million
Most of the gains happened in the last 5 minutes—a sudden pump.
Do you think this is a real breakout or a pump and dump? 👇
(Data breakdown, not investment advice. DYOR)
#SOXLB
·
--
🔍 $MEGA price drop breakdown
5 minutes: +0.22%
1h: -1.68%
4h: -1.68%
24h: +8.55%
Current price: 0.04902, 24h trading volume: $6.56 million
The decline was mainly concentrated in the 1h period—a sudden selloff.
Do you think this is panic selling or a trend reversal? 👇
(Data analysis, not investment advice. DYOR)
#MEGA
🔍 $MEGA price drop breakdown
5 minutes: +0.22%
1h: -1.68%
4h: -1.68%
24h: +8.55%
Current price: 0.04902, 24h trading volume: $6.56 million
The decline was mainly concentrated in the 1h period—a sudden selloff.
Do you think this is panic selling or a trend reversal? 👇
(Data analysis, not investment advice. DYOR)
#MEGA
5 minutes: +0.22%
1h: -1.68%
4h: -1.68%
24h: +8.55%
Current price: 0.04902, 24h trading volume: $6.56 million
The decline was mainly concentrated in the 1h period—a sudden selloff.
Do you think this is panic selling or a trend reversal? 👇
(Data analysis, not investment advice. DYOR)
#MEGA
2
Log in to explore more content
Join global crypto users on Binance Square
⚡️ Get latest and useful information about crypto.
💬 Trusted by the world’s largest crypto exchange.
👍 Discover real insights from verified creators.
Email / Phone number
Trending Topics
A Packed Week of Earnings and Data Tests Markets
24,666 views
188 Discussing
🚨🇺🇸 BIG WEEK AHEAD FOR THE MARKETS!
Markets are pricing in a Fed rate hike in December and $BTC could see some big moves next week.
Here's what's coming:
• Monday: Fed Chair Warsh speaks
• Tuesday: US Retail Sales + $NVDA earnings
• Wednesday: FOMC Minutes
• Thursday: Jobless Claims + Philly Fed Index
• Friday: Consumer Sentiment + Fed speeches
All eyes on $BTC as another important week begins.
#bitcoin
Mookie
·8 Likes
·4.3k views
AnthropicIPOTestsInvestorAppetiteForAI
23,613 views
462 Discussing
HuangReportedlyConsidersReturnToNvidia
48,271 views
616 Discussing