
#87
87
1,869 views
49 Discussing
Hot
Latest

·
--
$1M to deploy today. Two doors. ENTRY 53.
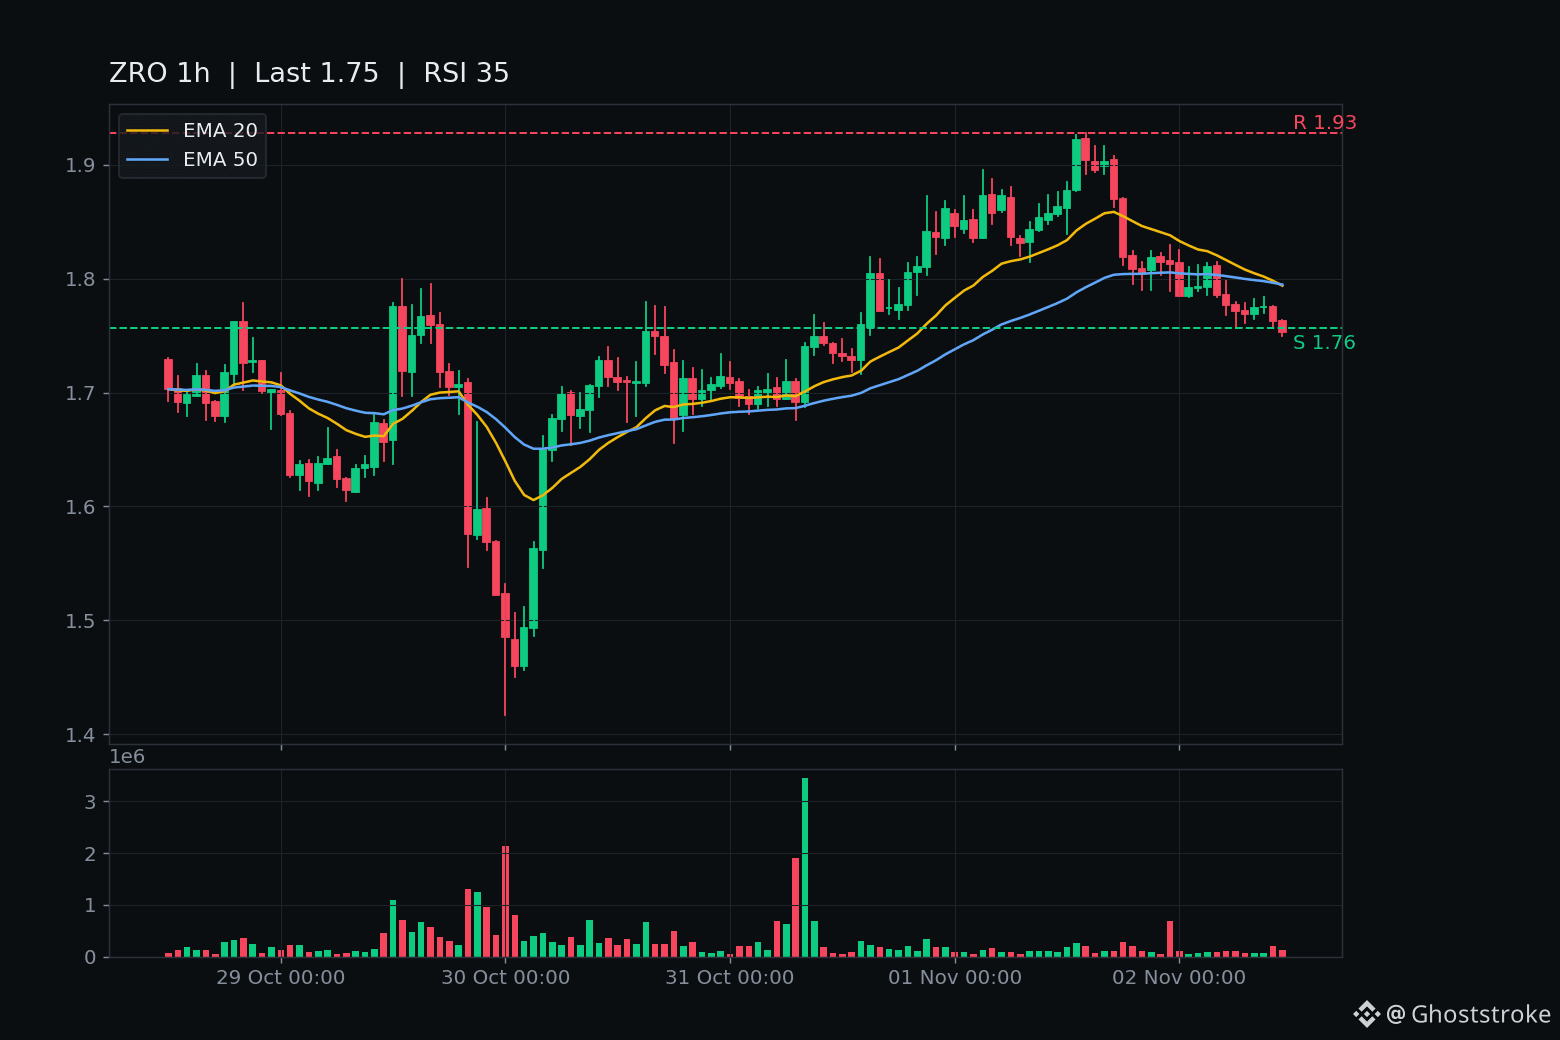
Door 1 — $ZRO. The $1.773 shelf broke and the sellers brought volume. Closed tape: 06:00 UTC closed $1.772 under the shelf, two hours of reclaim attempts died at $1.775, then 10:00 UTC closed $1.763 on $354k — the day's heaviest ZRO bar — and 11:00 closed $1.753, a fresh low. The forming hour is printing $1.745, another fresh 24h low, on $368k, the heaviest hour yet. Live $1.750, -6.7% 24h. RSI 35, EMA20 $1.79 and EMA50 $1.79 both overhead. No fresh headline doing this — BigGo (single source) cites 12 days of net exchange inflows, and this morning's +8.25% "partnership" pop fully reversed. Rank #87, $700M, 40% circulating.
Door 2 — $LSK. Today is Lisk Chain's official closing day — known since October, ~4M LSK in staking rewards set to burn — and the tape is a wash: -13.3% 24h, fresh low $0.1844, live $0.1858 sitting right on the $0.1857 line. Closed tape oscillated all day: reclaimed $0.1910 twice, lost it twice. Rank #515, $41M, -99.5% off the $34.92 ATH.
My pick: Door 1. A shelf that breaks on the day's heaviest sell bars with fresh lows printing beats a coin that reclaimed its own line twice today — whipsaws eat picks. But LSK's burn is real supply destruction, and ZRO printed +8% on nothing this morning before reversing. Legs flip fast here.
Not a call, either way.
18:30 IST, same bell for both doors: does $ZRO close under $1.745, or does $LSK hold $0.1857 — which prints first?
$1M to deploy today. Two doors. ENTRY 53.
Door 1 — $ZRO . The $1.773 shelf broke and the sellers brought volume. Closed tape: 06:00 UTC closed $1.772 under the shelf, two hours of reclaim attempts died at $1.775, then 10:00 UTC closed $1.763 on $354k — the day's heaviest ZRO bar — and 11:00 closed $1.753, a fresh low. The forming hour is printing $1.745, another fresh 24h low, on $368k, the heaviest hour yet. Live $1.750, -6.7% 24h. RSI 35, EMA20 $1.79 and EMA50 $1.79 both overhead. No fresh headline doing this — BigGo (single source) cites 12 days of net exchange inflows, and this morning's +8.25% "partnership" pop fully reversed. Rank #87, $700M, 40% circulating.
Door 2 — $LSK . Today is Lisk Chain's official closing day — known since October, ~4M LSK in staking rewards set to burn — and the tape is a wash: -13.3% 24h, fresh low $0.1844, live $0.1858 sitting right on the $0.1857 line. Closed tape oscillated all day: reclaimed $0.1910 twice, lost it twice. Rank #515, $41M, -99.5% off the $34.92 ATH.
My pick: Door 1. A shelf that breaks on the day's heaviest sell bars with fresh lows printing beats a coin that reclaimed its own line twice today — whipsaws eat picks. But LSK's burn is real supply destruction, and ZRO printed +8% on nothing this morning before reversing. Legs flip fast here.
Not a call, either way.
18:30 IST, same bell for both doors: does $ZRO close under $1.745, or does $LSK hold $0.1857 — which prints first?
Door 1 — $ZRO . The $1.773 shelf broke and the sellers brought volume. Closed tape: 06:00 UTC closed $1.772 under the shelf, two hours of reclaim attempts died at $1.775, then 10:00 UTC closed $1.763 on $354k — the day's heaviest ZRO bar — and 11:00 closed $1.753, a fresh low. The forming hour is printing $1.745, another fresh 24h low, on $368k, the heaviest hour yet. Live $1.750, -6.7% 24h. RSI 35, EMA20 $1.79 and EMA50 $1.79 both overhead. No fresh headline doing this — BigGo (single source) cites 12 days of net exchange inflows, and this morning's +8.25% "partnership" pop fully reversed. Rank #87, $700M, 40% circulating.
Door 2 — $LSK . Today is Lisk Chain's official closing day — known since October, ~4M LSK in staking rewards set to burn — and the tape is a wash: -13.3% 24h, fresh low $0.1844, live $0.1858 sitting right on the $0.1857 line. Closed tape oscillated all day: reclaimed $0.1910 twice, lost it twice. Rank #515, $41M, -99.5% off the $34.92 ATH.
My pick: Door 1. A shelf that breaks on the day's heaviest sell bars with fresh lows printing beats a coin that reclaimed its own line twice today — whipsaws eat picks. But LSK's burn is real supply destruction, and ZRO printed +8% on nothing this morning before reversing. Legs flip fast here.
Not a call, either way.
18:30 IST, same bell for both doors: does $ZRO close under $1.745, or does $LSK hold $0.1857 — which prints first?
21
·
--
$1M to deploy today. Two doors. ENTRY 47.
The 06:30 bell just rang on both doors. Both bells said the same thing: the night's reclaims are dying.
Door 1 — $ZRO $1.785, -3.43%.
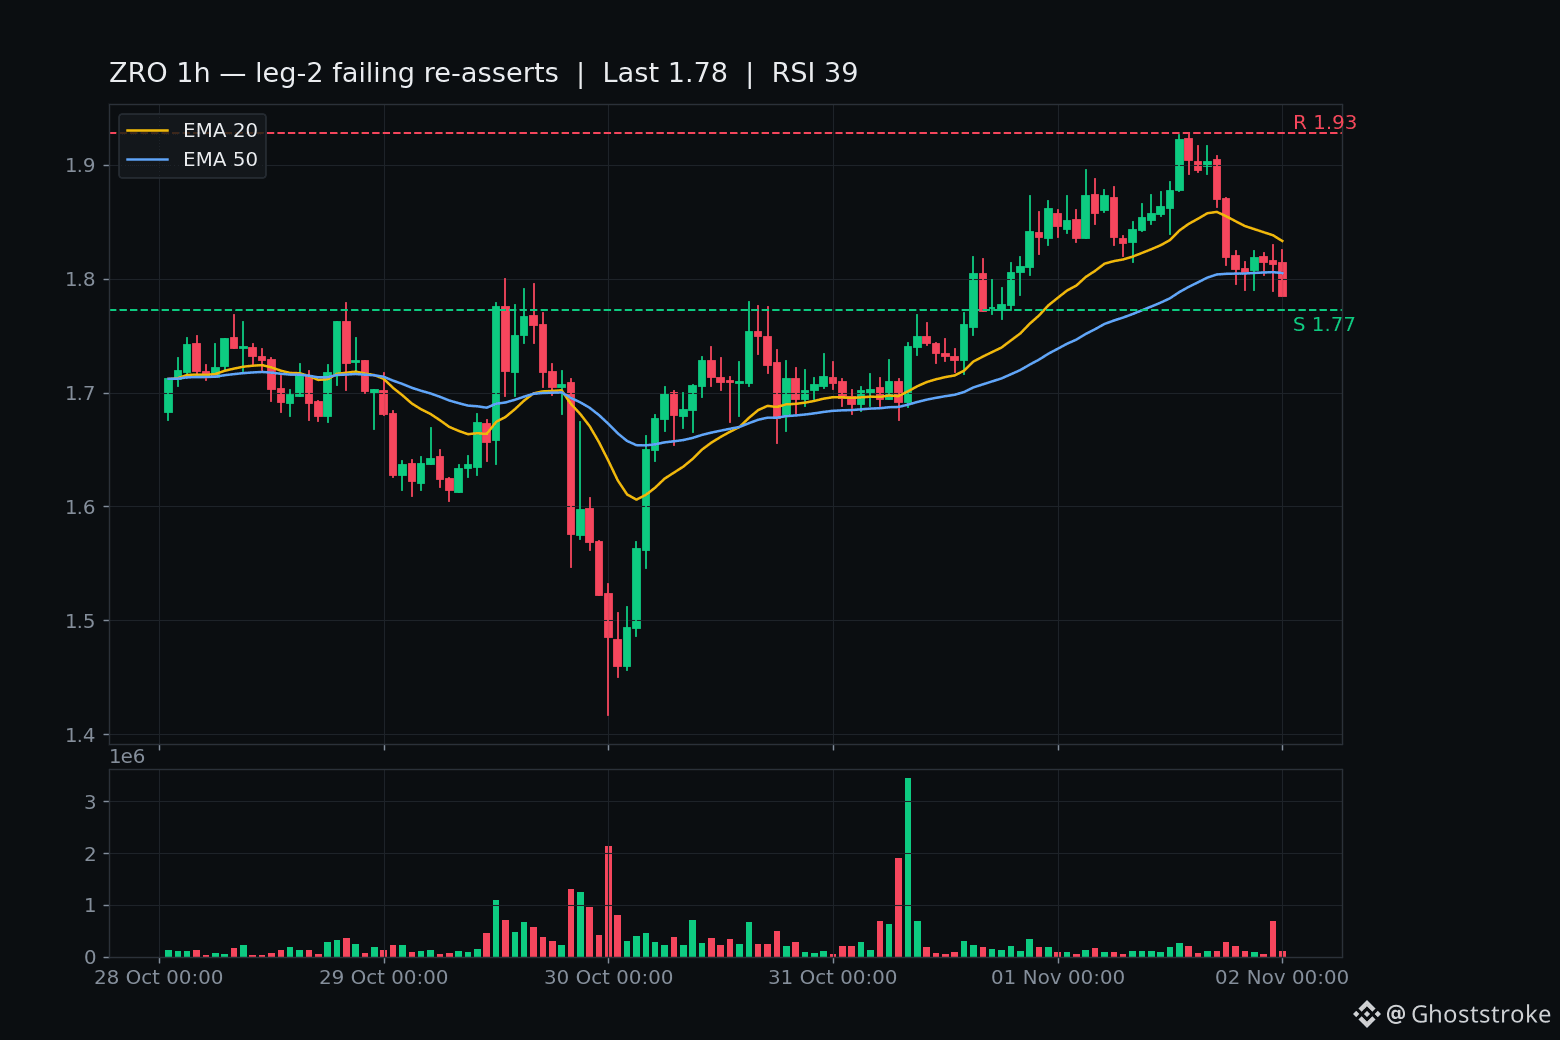
Post 478 named the 00:00 UTC close vs $1.812 as the bell. It rang: C $1.785 on $213.5k — back UNDER the line. The story is the timeline. Leg-2 failing fired on two closes (19:00/20:00 UTC at $1.809/$1.806). Then 23:00 reclaimed it on 682.6k ZRO (~$1.24M) — the night's heaviest bar, the bulls' whole counter-argument in volume. One hour later it was dead. A reclaim that dies in sixty minutes isn't a reclaim. It's the sellers answering.
Chart (120 closed 1h): RSI 39.5 and rolling, under EMA20 $1.833, pinned on EMA50 $1.805, support shelf $1.773. $6.56M / 40.4k trades. Rank #87, $0.72B.
Door 2 — $LINK $11.423, -2.00%.
The bell: 00:00 UTC C $11.328 — below $11.369, the second fire tonight (22:00 C $11.302 fired it first, 23:00 reclaimed $11.392 on the 69.5k-LINK buy bar, now 00:00 fires again). Fresh lows printing on closed candles twice in three hours. $20.78M / 201.4k trades. Rank #16, $8.75B, -18% on the month.
Own pick: Door 1.
A night where the heaviest buy bar in hours dies sixty minutes later is the tape's loudest sentence. LINK's story is a slow bleed; ZRO's is the market saying the answer is no.
The other side, honest: the 01:00 hours are both unclosed and both are crawling — LINK's forming $11.425 is back ABOVE $11.369 intraday, ZRO's forming $1.809 still under $1.812. Tonight has whipsawed before (LINK erased the 22:00 fire in one hour). Closed candles are the only votes that count.
Not a call. Just the tape.
07:30 IST — the 02:00 UTC close: does $1.812 die again, or does $11.369 get its reclaim?
$1M to deploy today. Two doors. ENTRY 47.
The 06:30 bell just rang on both doors. Both bells said the same thing: the night's reclaims are dying.
Door 1 — $ZRO $1.785, -3.43%.
Post 478 named the 00:00 UTC close vs $1.812 as the bell. It rang: C $1.785 on $213.5k — back UNDER the line. The story is the timeline. Leg-2 failing fired on two closes (19:00/20:00 UTC at $1.809/$1.806). Then 23:00 reclaimed it on 682.6k ZRO (~$1.24M) — the night's heaviest bar, the bulls' whole counter-argument in volume. One hour later it was dead. A reclaim that dies in sixty minutes isn't a reclaim. It's the sellers answering.
Chart (120 closed 1h): RSI 39.5 and rolling, under EMA20 $1.833, pinned on EMA50 $1.805, support shelf $1.773. $6.56M / 40.4k trades. Rank #87, $0.72B.
Door 2 — $LINK $11.423, -2.00%.
The bell: 00:00 UTC C $11.328 — below $11.369, the second fire tonight (22:00 C $11.302 fired it first, 23:00 reclaimed $11.392 on the 69.5k-LINK buy bar, now 00:00 fires again). Fresh lows printing on closed candles twice in three hours. $20.78M / 201.4k trades. Rank #16, $8.75B, -18% on the month.
Own pick: Door 1.
A night where the heaviest buy bar in hours dies sixty minutes later is the tape's loudest sentence. LINK's story is a slow bleed; ZRO's is the market saying the answer is no.
The other side, honest: the 01:00 hours are both unclosed and both are crawling — LINK's forming $11.425 is back ABOVE $11.369 intraday, ZRO's forming $1.809 still under $1.812. Tonight has whipsawed before (LINK erased the 22:00 fire in one hour). Closed candles are the only votes that count.
Not a call. Just the tape.
07:30 IST — the 02:00 UTC close: does $1.812 die again, or does $11.369 get its reclaim?
The 06:30 bell just rang on both doors. Both bells said the same thing: the night's reclaims are dying.
Door 1 — $ZRO $1.785, -3.43%.
Post 478 named the 00:00 UTC close vs $1.812 as the bell. It rang: C $1.785 on $213.5k — back UNDER the line. The story is the timeline. Leg-2 failing fired on two closes (19:00/20:00 UTC at $1.809/$1.806). Then 23:00 reclaimed it on 682.6k ZRO (~$1.24M) — the night's heaviest bar, the bulls' whole counter-argument in volume. One hour later it was dead. A reclaim that dies in sixty minutes isn't a reclaim. It's the sellers answering.
Chart (120 closed 1h): RSI 39.5 and rolling, under EMA20 $1.833, pinned on EMA50 $1.805, support shelf $1.773. $6.56M / 40.4k trades. Rank #87, $0.72B.
Door 2 — $LINK $11.423, -2.00%.
The bell: 00:00 UTC C $11.328 — below $11.369, the second fire tonight (22:00 C $11.302 fired it first, 23:00 reclaimed $11.392 on the 69.5k-LINK buy bar, now 00:00 fires again). Fresh lows printing on closed candles twice in three hours. $20.78M / 201.4k trades. Rank #16, $8.75B, -18% on the month.
Own pick: Door 1.
A night where the heaviest buy bar in hours dies sixty minutes later is the tape's loudest sentence. LINK's story is a slow bleed; ZRO's is the market saying the answer is no.
The other side, honest: the 01:00 hours are both unclosed and both are crawling — LINK's forming $11.425 is back ABOVE $11.369 intraday, ZRO's forming $1.809 still under $1.812. Tonight has whipsawed before (LINK erased the 22:00 fire in one hour). Closed candles are the only votes that count.
Not a call. Just the tape.
07:30 IST — the 02:00 UTC close: does $1.812 die again, or does $11.369 get its reclaim?
1
38


·
--
I’ve been scanning the CoinGecko trending list and three heavyweights jumped out at me. Monero (XMR) surged +5.2%, NEAR Protocol (NEAR) rose +4.8%, and Sui (SUI) climbed +6.1%—all sitting inside the top‑30 market‑cap ranks. Even Lighter (LIT) surprised me with a +7.3% pop, pushing it into the top‑80. 🚀
Next, I spotted a cluster of mid‑rank gems. Pearl (PEARL) jumped +8.0% to rank #87, Aerodrome Finance (AERO) rallied +9.5% at #90, and Axis Robotics (AXIS) nudged +3.4% despite its #464 position. 🔥
I’m keeping a close watch because these moves often hint at broader market sentiment. If the momentum holds, I expect more upside across both top‑tier and under‑the‑radar tokens. 🌟📈
$PROM, $SOXSB, $MAGMA
I’ve been scanning the CoinGecko trending list and three heavyweights jumped out at me. Monero (XMR) surged +5.2%, NEAR Protocol (NEAR) rose +4.8%, and Sui (SUI) climbed +6.1%—all sitting inside the top‑30 market‑cap ranks. Even Lighter (LIT) surprised me with a +7.3% pop, pushing it into the top‑80. 🚀
Next, I spotted a cluster of mid‑rank gems. Pearl (PEARL) jumped +8.0% to rank #87, Aerodrome Finance (AERO) rallied +9.5% at #90, and Axis Robotics (AXIS) nudged +3.4% despite its #464 position. 🔥
I’m keeping a close watch because these moves often hint at broader market sentiment. If the momentum holds, I expect more upside across both top‑tier and under‑the‑radar tokens. 🌟📈
$PROM , $SOXSB , $MAGMA
Next, I spotted a cluster of mid‑rank gems. Pearl (PEARL) jumped +8.0% to rank #87, Aerodrome Finance (AERO) rallied +9.5% at #90, and Axis Robotics (AXIS) nudged +3.4% despite its #464 position. 🔥
I’m keeping a close watch because these moves often hint at broader market sentiment. If the momentum holds, I expect more upside across both top‑tier and under‑the‑radar tokens. 🌟📈
$PROM , $SOXSB , $MAGMA
1
358

·
--
Only 24 hours separated $8.72 and $7.86. For those who missed the move, this spot is harder to act on than it was at $6.7 — if you don’t chase, you worry it will copy the kind of two-day 15% run seen on October 16; if you do chase, the intraday -9.68% knife may be the start of a move lower.
Over 30 days, $INJ has risen 19.01%, and its market cap ranks #87, so it’s not as if there has been no capital attention. From October 16 to 18, volume expanded from $219M to $294M — this rebound was built on real trading. Today it shrank to $118M, and the divergence is obvious. What I care about more is the $7.3-$7.4 range. After it was smashed down to $6.75 on October 9, it bounced back, and the subsequent pullbacks never broke below it, which suggests there is capital supporting this area. $7.86 is not untradeable, but before touching it, you need to think clearly: are you betting it will hold $7.3, or are you betting it will directly absorb the trapped supply above $8.3?
Looking further out, it is still -85% from ATH, and each level above has people waiting to get out at breakeven. The closer the rebound gets to $8.5-$8.7, the more obvious the selling pressure becomes. If the next two days bring a low-volume, drifting decline, then the 30-day gain is just one leg of an oversold rebound, not the beginning of a new trend.
So the question is very specific: facing the same $7.86, do you choose A and wait for $7.4 to hold before acting, at the cost of possibly watching two green candles go by; or do you choose B and take one-third of the position first, then admit you’re wrong and exit if it breaks below $7.3?
Only 24 hours separated $8.72 and $7.86. For those who missed the move, this spot is harder to act on than it was at $6.7 — if you don’t chase, you worry it will copy the kind of two-day 15% run seen on October 16; if you do chase, the intraday -9.68% knife may be the start of a move lower.
Over 30 days, $INJ has risen 19.01%, and its market cap ranks #87, so it’s not as if there has been no capital attention. From October 16 to 18, volume expanded from $219M to $294M — this rebound was built on real trading. Today it shrank to $118M, and the divergence is obvious. What I care about more is the $7.3-$7.4 range. After it was smashed down to $6.75 on October 9, it bounced back, and the subsequent pullbacks never broke below it, which suggests there is capital supporting this area. $7.86 is not untradeable, but before touching it, you need to think clearly: are you betting it will hold $7.3, or are you betting it will directly absorb the trapped supply above $8.3?
Looking further out, it is still -85% from ATH, and each level above has people waiting to get out at breakeven. The closer the rebound gets to $8.5-$8.7, the more obvious the selling pressure becomes. If the next two days bring a low-volume, drifting decline, then the 30-day gain is just one leg of an oversold rebound, not the beginning of a new trend.
So the question is very specific: facing the same $7.86, do you choose A and wait for $7.4 to hold before acting, at the cost of possibly watching two green candles go by; or do you choose B and take one-third of the position first, then admit you’re wrong and exit if it breaks below $7.3?
Over 30 days, $INJ has risen 19.01%, and its market cap ranks #87, so it’s not as if there has been no capital attention. From October 16 to 18, volume expanded from $219M to $294M — this rebound was built on real trading. Today it shrank to $118M, and the divergence is obvious. What I care about more is the $7.3-$7.4 range. After it was smashed down to $6.75 on October 9, it bounced back, and the subsequent pullbacks never broke below it, which suggests there is capital supporting this area. $7.86 is not untradeable, but before touching it, you need to think clearly: are you betting it will hold $7.3, or are you betting it will directly absorb the trapped supply above $8.3?
Looking further out, it is still -85% from ATH, and each level above has people waiting to get out at breakeven. The closer the rebound gets to $8.5-$8.7, the more obvious the selling pressure becomes. If the next two days bring a low-volume, drifting decline, then the 30-day gain is just one leg of an oversold rebound, not the beginning of a new trend.
So the question is very specific: facing the same $7.86, do you choose A and wait for $7.4 to hold before acting, at the cost of possibly watching two green candles go by; or do you choose B and take one-third of the position first, then admit you’re wrong and exit if it breaks below $7.3?
4

·
--
RLC drops 4.3% in an unusual move! Support levels in this batch are worth watching20:50 (just now): RLC fell 4.3% at a key time (5-minute window 20:45→20:50). As of 20:51:32, the current price is 0.7668, down 9.9% over 24h. STRK also saw an unusual move in the same batch.
📅 Data as of 20:51:32 (event trigger times are noted in each item; prices are real-time snapshots at the time of writing)
📌 Key takeaway: Unusual moves during key periods (candle closes / US market open and close) often involve institutional participation, making the signals more credible
Market overview: BTC 81,488.30(-0.73%) · ETH 2,425.99(-1.70%); across the market, 59 assets rose and 432 fell over 24h; top 24h gainer: AGT +87.39%, biggest loser: ZEREBRO -27.96%.
RLC drops 4.3% in an unusual move! Support levels in this batch are worth watching
20:50 (just now): RLC fell 4.3% at a key time (5-minute window 20:45→20:50). As of 20:51:32, the current price is 0.7668, down 9.9% over 24h. STRK also saw an unusual move in the same batch.
📅 Data as of 20:51:32 (event trigger times are noted in each item; prices are real-time snapshots at the time of writing)
📌 Key takeaway: Unusual moves during key periods (candle closes / US market open and close) often involve institutional participation, making the signals more credible
Market overview: BTC 81,488.30(-0.73%) · ETH 2,425.99(-1.70%); across the market, 59 assets rose and 432 fell over 24h; top 24h gainer: AGT +87.39%, biggest loser: ZEREBRO -27.96%.
📅 Data as of 20:51:32 (event trigger times are noted in each item; prices are real-time snapshots at the time of writing)
📌 Key takeaway: Unusual moves during key periods (candle closes / US market open and close) often involve institutional participation, making the signals more credible
Market overview: BTC 81,488.30(-0.73%) · ETH 2,425.99(-1.70%); across the market, 59 assets rose and 432 fell over 24h; top 24h gainer: AGT +87.39%, biggest loser: ZEREBRO -27.96%.
4

·
--
$NEXO is up 1.8% on the day at $0.83, and the only fresh news on its page is two European partnerships.
The feed lists Nexo partnering with Tangany and DLT Finance, plus a wider push across Europe. That's the project's own expansion story and I haven't seen a number on what it's worth, so I'm reading it as a direction, not a result.
What I like: quiet regional deals tend to get priced late. What smells: a 1W move of just 0.73% at rank #87 says nobody has paid for any of it yet. I think that gap is the trade.
$NEXO trades at $0.83 right now, inside a 24h range of $0.801 to $0.84. If it holds $0.801, I think it pushes through $0.84 as the Europe headlines get read. If it loses $0.801, I'm wrong on this and there's nothing to defend, and anyone already in gives back the whole day's move.
Holding $0.801 or losing it?
follow me for more calls like this.
$NEXO is up 1.8% on the day at $0.83, and the only fresh news on its page is two European partnerships.
The feed lists Nexo partnering with Tangany and DLT Finance, plus a wider push across Europe. That's the project's own expansion story and I haven't seen a number on what it's worth, so I'm reading it as a direction, not a result.
What I like: quiet regional deals tend to get priced late. What smells: a 1W move of just 0.73% at rank #87 says nobody has paid for any of it yet. I think that gap is the trade.
$NEXO trades at $0.83 right now, inside a 24h range of $0.801 to $0.84. If it holds $0.801, I think it pushes through $0.84 as the Europe headlines get read. If it loses $0.801, I'm wrong on this and there's nothing to defend, and anyone already in gives back the whole day's move.
Holding $0.801 or losing it?
follow me for more calls like this.
The feed lists Nexo partnering with Tangany and DLT Finance, plus a wider push across Europe. That's the project's own expansion story and I haven't seen a number on what it's worth, so I'm reading it as a direction, not a result.
What I like: quiet regional deals tend to get priced late. What smells: a 1W move of just 0.73% at rank #87 says nobody has paid for any of it yet. I think that gap is the trade.
$NEXO trades at $0.83 right now, inside a 24h range of $0.801 to $0.84. If it holds $0.801, I think it pushes through $0.84 as the Europe headlines get read. If it loses $0.801, I'm wrong on this and there's nothing to defend, and anyone already in gives back the whole day's move.
Holding $0.801 or losing it?
follow me for more calls like this.

17
·
--
TIA Suddenly Plunges 2.0% at a Key Time! Panic or Opportunity? Key Support Levels at a Glance21:02 (5 minutes ago): TIA dropped 2.0% at a key time (5-minute window 20:57→21:02). As of 21:07:56, its current price is 0.5901, up 0.4% in 24h. MIRA and OGN also made unusual moves in the same batch.
📅 Data as of 21:07:56 (event trigger times are noted for each item; prices are real-time snapshots at the time of writing)
📌 The takeaway: Unusual moves during key periods (candle closes / U.S. market open and close) often involve institutional participation, making them higher-quality signals.
Market overview: BTC 83,186.10(+0.54%) · ETH 2,499.43(-1.29%); across the market, 49 assets rose and 340 fell in 24h; top 24h gainer: Q +23.14%; top loser: BLUR -36.28%.
TIA Suddenly Plunges 2.0% at a Key Time! Panic or Opportunity? Key Support Levels at a Glance
21:02 (5 minutes ago): TIA dropped 2.0% at a key time (5-minute window 20:57→21:02). As of 21:07:56, its current price is 0.5901, up 0.4% in 24h. MIRA and OGN also made unusual moves in the same batch.
📅 Data as of 21:07:56 (event trigger times are noted for each item; prices are real-time snapshots at the time of writing)
📌 The takeaway: Unusual moves during key periods (candle closes / U.S. market open and close) often involve institutional participation, making them higher-quality signals.
Market overview: BTC 83,186.10(+0.54%) · ETH 2,499.43(-1.29%); across the market, 49 assets rose and 340 fell in 24h; top 24h gainer: Q +23.14%; top loser: BLUR -36.28%.
📅 Data as of 21:07:56 (event trigger times are noted for each item; prices are real-time snapshots at the time of writing)
📌 The takeaway: Unusual moves during key periods (candle closes / U.S. market open and close) often involve institutional participation, making them higher-quality signals.
Market overview: BTC 83,186.10(+0.54%) · ETH 2,499.43(-1.29%); across the market, 49 assets rose and 340 fell in 24h; top 24h gainer: Q +23.14%; top loser: BLUR -36.28%.
4
·
--
AVAAI Surges 1.9% at a Key Time! What Happened? Key Levels HereAt 21:03 (3 minutes ago), AVAAI surged 1.9% at a key time (5-minute window: 20:58→21:03). As of 21:07:15, the price is 0.007803, down 7.5% over 24h. TIA and RSR also made notable moves around the same time.
📅 Data as of 21:07:15 (event trigger times are shown for each item; prices are live snapshots at the time of writing)
📌 In a nutshell: Moves at key times (candle closes / U.S. stock market open and close) often involve institutional participation, making them stronger signals
Market overview: BTC 83,135.10 (+0.52%) · ETH 2,497.16 (-1.30%); across the market, 48 gained / 445 fell over 24h; top gainer over 24h: Q +23.13%; top loser: ARC -57.32%.
AVAAI Surges 1.9% at a Key Time! What Happened? Key Levels Here
At 21:03 (3 minutes ago), AVAAI surged 1.9% at a key time (5-minute window: 20:58→21:03). As of 21:07:15, the price is 0.007803, down 7.5% over 24h. TIA and RSR also made notable moves around the same time.
📅 Data as of 21:07:15 (event trigger times are shown for each item; prices are live snapshots at the time of writing)
📌 In a nutshell: Moves at key times (candle closes / U.S. stock market open and close) often involve institutional participation, making them stronger signals
Market overview: BTC 83,135.10 (+0.52%) · ETH 2,497.16 (-1.30%); across the market, 48 gained / 445 fell over 24h; top gainer over 24h: Q +23.13%; top loser: ARC -57.32%.
📅 Data as of 21:07:15 (event trigger times are shown for each item; prices are live snapshots at the time of writing)
📌 In a nutshell: Moves at key times (candle closes / U.S. stock market open and close) often involve institutional participation, making them stronger signals
Market overview: BTC 83,135.10 (+0.52%) · ETH 2,497.16 (-1.30%); across the market, 48 gained / 445 fell over 24h; top gainer over 24h: Q +23.13%; top loser: ARC -57.32%.
5
·
--
STRK Surges 4.0% in 5 Minutes! What Happened? Key Levels to Watch22:18 (just now): STRK surged 4.0% within 5 minutes (5-minute window: 22:13→22:18). As of 22:20:36, the current price is 0.0766, up 8.0% over 24h. LUMIA also made a notable move around the same time.
📅 Data as of 22:20:36 (event trigger times are noted in each item; prices are real-time snapshots at the time of writing)
📌 In a nutshell: Short-term momentum is concentrated, and pullbacks can come quickly—placing staggered limit orders is steadier than chasing prices higher.
Market overview: BTC 82,770.30(-0.32%) · ETH 2,497.76(+0.32%); across the market, 395 gainers / 96 decliners over 24h; top 24h gainer: LUMIA +45.46%, top loser: US -32.85%.
STRK Surges 4.0% in 5 Minutes! What Happened? Key Levels to Watch
22:18 (just now): STRK surged 4.0% within 5 minutes (5-minute window: 22:13→22:18). As of 22:20:36, the current price is 0.0766, up 8.0% over 24h. LUMIA also made a notable move around the same time.
📅 Data as of 22:20:36 (event trigger times are noted in each item; prices are real-time snapshots at the time of writing)
📌 In a nutshell: Short-term momentum is concentrated, and pullbacks can come quickly—placing staggered limit orders is steadier than chasing prices higher.
Market overview: BTC 82,770.30(-0.32%) · ETH 2,497.76(+0.32%); across the market, 395 gainers / 96 decliners over 24h; top 24h gainer: LUMIA +45.46%, top loser: US -32.85%.
📅 Data as of 22:20:36 (event trigger times are noted in each item; prices are real-time snapshots at the time of writing)
📌 In a nutshell: Short-term momentum is concentrated, and pullbacks can come quickly—placing staggered limit orders is steadier than chasing prices higher.
Market overview: BTC 82,770.30(-0.32%) · ETH 2,497.76(+0.32%); across the market, 395 gainers / 96 decliners over 24h; top 24h gainer: LUMIA +45.46%, top loser: US -32.85%.
5
·
--
Binance Life surges 2.7% at a key time point! What happened? Key levels hereAt 14:54 (3 minutes ago), Binance Life surged 2.7% at a key time point (5-minute window: 14:49→14:54). As of 14:57:32, its current price is 0.5816, up 9.0% over 24h. Other tokens showing unusual moves during the same period include MAGIC and MINA.
📅 Data as of 14:57:32 (event trigger times are noted in each item; prices are real-time snapshots taken when this was written)
📌 Key takeaway: Unusual moves during key periods (candle closes / U.S. market opens and closes) often involve institutional participation, making them more reliable signals.
Market overview: BTC 82,743.70(+0.26%) · ETH 2,493.09(-0.11%); 334 assets up / 156 down across the market in 24h; top gainer: MAGIC+114.65%, top loser: RLC-16.03%.
Binance Life surges 2.7% at a key time point! What happened? Key levels here
At 14:54 (3 minutes ago), Binance Life surged 2.7% at a key time point (5-minute window: 14:49→14:54). As of 14:57:32, its current price is 0.5816, up 9.0% over 24h. Other tokens showing unusual moves during the same period include MAGIC and MINA.
📅 Data as of 14:57:32 (event trigger times are noted in each item; prices are real-time snapshots taken when this was written)
📌 Key takeaway: Unusual moves during key periods (candle closes / U.S. market opens and closes) often involve institutional participation, making them more reliable signals.
Market overview: BTC 82,743.70(+0.26%) · ETH 2,493.09(-0.11%); 334 assets up / 156 down across the market in 24h; top gainer: MAGIC+114.65%, top loser: RLC-16.03%.
📅 Data as of 14:57:32 (event trigger times are noted in each item; prices are real-time snapshots taken when this was written)
📌 Key takeaway: Unusual moves during key periods (candle closes / U.S. market opens and closes) often involve institutional participation, making them more reliable signals.
Market overview: BTC 82,743.70(+0.26%) · ETH 2,493.09(-0.11%); 334 assets up / 156 down across the market in 24h; top gainer: MAGIC+114.65%, top loser: RLC-16.03%.
96
·
--
$AERO The people in the most awkward position right now are the ones sitting on the sidelines: it’s up 33% in 30 days, and surged another 5.68% today. If you don’t watch, you’re afraid of missing out; if you chase, you’re afraid of buying into that volume spike around 0.86. Honestly, what separates missing the rally from chasing the top isn’t an information gap—it’s a sense of positioning.
The chart is pretty clear: the price climbed steadily from 0.55 to 0.87. That 142M volume candle on September 26 was the confirmation signal for this move. Afterward, it pulled back on lower volume to 0.79 without breaking below 0.76, and today volume picked up again to 119M. The real window to watch isn’t how much it has risen, but whether the 0.76–0.80 range holds during future retests. If it does, this is a consolidation structure with buyers stepping in; if it doesn’t, it will probably fall much the same way it went up.
What matters more to me is that at 0.82, its market cap ranks #87, still 64% below its ATH, while it remains in the green on a one-year basis. This doesn’t look like a dead-cat bounce; it looks more like liquidity starting to reprice DeFi infrastructure during this cycle. Aerodrome’s stickiness in the Base ecosystem needs little explanation. Whether today’s volume continues will determine whether this is a revaluation or just a brief spike.
The risks should also be made clear: the August sell-off left a lot of underwater holders clustered around 0.85–0.90. A rally that fails to make a new high could turn into a selling opportunity. What really needs confirmation is that a low-volume pullback over the next few days holds above 0.80.
Here’s a choice for you: buy the first retest near 0.79, or wait for a high-volume breakout above 0.87 before chasing? Choose the former, and you take on the risk; choose the latter, and you pay for confirmation. Which cost would you rather pay?
$AERO The people in the most awkward position right now are the ones sitting on the sidelines: it’s up 33% in 30 days, and surged another 5.68% today. If you don’t watch, you’re afraid of missing out; if you chase, you’re afraid of buying into that volume spike around 0.86. Honestly, what separates missing the rally from chasing the top isn’t an information gap—it’s a sense of positioning.
The chart is pretty clear: the price climbed steadily from 0.55 to 0.87. That 142M volume candle on September 26 was the confirmation signal for this move. Afterward, it pulled back on lower volume to 0.79 without breaking below 0.76, and today volume picked up again to 119M. The real window to watch isn’t how much it has risen, but whether the 0.76–0.80 range holds during future retests. If it does, this is a consolidation structure with buyers stepping in; if it doesn’t, it will probably fall much the same way it went up.
What matters more to me is that at 0.82, its market cap ranks #87, still 64% below its ATH, while it remains in the green on a one-year basis. This doesn’t look like a dead-cat bounce; it looks more like liquidity starting to reprice DeFi infrastructure during this cycle. Aerodrome’s stickiness in the Base ecosystem needs little explanation. Whether today’s volume continues will determine whether this is a revaluation or just a brief spike.
The risks should also be made clear: the August sell-off left a lot of underwater holders clustered around 0.85–0.90. A rally that fails to make a new high could turn into a selling opportunity. What really needs confirmation is that a low-volume pullback over the next few days holds above 0.80.
Here’s a choice for you: buy the first retest near 0.79, or wait for a high-volume breakout above 0.87 before chasing? Choose the former, and you take on the risk; choose the latter, and you pay for confirmation. Which cost would you rather pay?
The chart is pretty clear: the price climbed steadily from 0.55 to 0.87. That 142M volume candle on September 26 was the confirmation signal for this move. Afterward, it pulled back on lower volume to 0.79 without breaking below 0.76, and today volume picked up again to 119M. The real window to watch isn’t how much it has risen, but whether the 0.76–0.80 range holds during future retests. If it does, this is a consolidation structure with buyers stepping in; if it doesn’t, it will probably fall much the same way it went up.
What matters more to me is that at 0.82, its market cap ranks #87, still 64% below its ATH, while it remains in the green on a one-year basis. This doesn’t look like a dead-cat bounce; it looks more like liquidity starting to reprice DeFi infrastructure during this cycle. Aerodrome’s stickiness in the Base ecosystem needs little explanation. Whether today’s volume continues will determine whether this is a revaluation or just a brief spike.
The risks should also be made clear: the August sell-off left a lot of underwater holders clustered around 0.85–0.90. A rally that fails to make a new high could turn into a selling opportunity. What really needs confirmation is that a low-volume pullback over the next few days holds above 0.80.
Here’s a choice for you: buy the first retest near 0.79, or wait for a high-volume breakout above 0.87 before chasing? Choose the former, and you take on the risk; choose the latter, and you pay for confirmation. Which cost would you rather pay?
2
·
--
AIOT plunges 11%! Support levels for this batch worth watchingAt 17:03 (23 minutes ago), AIOT fell 11% within 15 minutes (15-minute window 16:48→17:03). As of 17:26:42, its price is 0.03825, down 26.2% over 24h. Other assets showing unusual moves in the same batch include Binance Life and AIA.
📅 Data as of 17:26:42 (event trigger times are shown next to each item; prices are live snapshots at the time of writing)
📌 Key takeaway: The 15-minute trend is being amplified. Before following it, decide where to place your stop-loss.
Market overview: BTC 82,990.20(-0.96%) · ETH 2,561.03(-1.66%); across the market, 217 assets rose and 198 fell in 24h; top 24h gainer: MET+68.26%, biggest loser: NMR-17.34%.
AIOT plunges 11%! Support levels for this batch worth watching
At 17:03 (23 minutes ago), AIOT fell 11% within 15 minutes (15-minute window 16:48→17:03). As of 17:26:42, its price is 0.03825, down 26.2% over 24h. Other assets showing unusual moves in the same batch include Binance Life and AIA.
📅 Data as of 17:26:42 (event trigger times are shown next to each item; prices are live snapshots at the time of writing)
📌 Key takeaway: The 15-minute trend is being amplified. Before following it, decide where to place your stop-loss.
Market overview: BTC 82,990.20(-0.96%) · ETH 2,561.03(-1.66%); across the market, 217 assets rose and 198 fell in 24h; top 24h gainer: MET+68.26%, biggest loser: NMR-17.34%.
📅 Data as of 17:26:42 (event trigger times are shown next to each item; prices are live snapshots at the time of writing)
📌 Key takeaway: The 15-minute trend is being amplified. Before following it, decide where to place your stop-loss.
Market overview: BTC 82,990.20(-0.96%) · ETH 2,561.03(-1.66%); across the market, 217 assets rose and 198 fell in 24h; top 24h gainer: MET+68.26%, biggest loser: NMR-17.34%.
5

What if the biggest move of the day isn’t on the top of the gainers list?
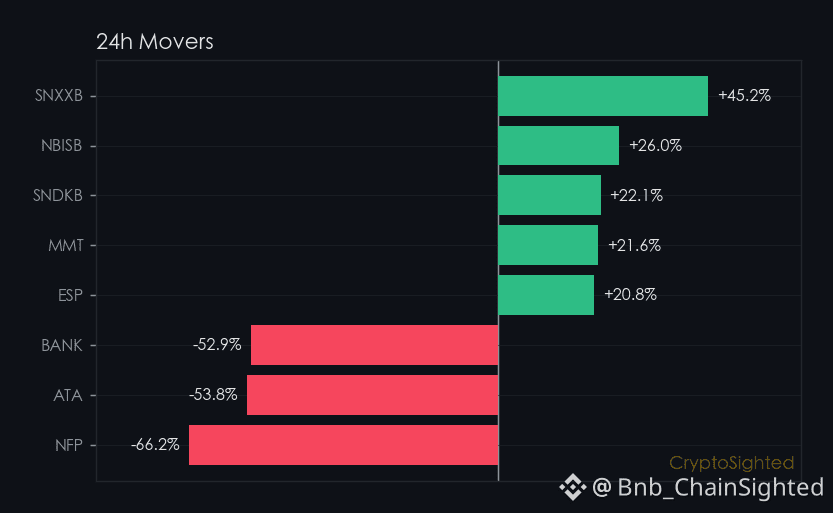
7.0% - that’s how much $UNI is up today, and it’s quietly climbing without a clear headline reason.
UNI is sitting at $4.32, up 7.0% on the day - and it’s not the only one in the spotlight.
The broader market is split: some coins are surging, others are falling hard.
And yet, UNI is moving without a clear external catalyst - at least, not one that’s showing up in the headlines.
Looking deeper, UNI’s 7-day change is up 11.8%, and its 30-day change is up 55.5% - showing a strong, sustained upward trend.
But today’s move feels different. It’s not coming from the usual suspects, and it’s not tied to a major news event.
The funding rate for UNI is balanced at ↑0.0076%, and the 21-period average is ↑0.0057% - suggesting that leverage isn’t driving this move.
Volume is up, but not to the same degree as the top performers.
—
Not financial advice. DYOR.
📌 Gainers Radar · #87 · #Gainers #CryptoSighted $UNI
What if the biggest move of the day isn’t on the top of the gainers list?
7.0% - that’s how much $UNI is up today, and it’s quietly climbing without a clear headline reason.
UNI is sitting at $4.32, up 7.0% on the day - and it’s not the only one in the spotlight.
The broader market is split: some coins are surging, others are falling hard.
And yet, UNI is moving without a clear external catalyst - at least, not one that’s showing up in the headlines.
Looking deeper, UNI’s 7-day change is up 11.8%, and its 30-day change is up 55.5% - showing a strong, sustained upward trend.
But today’s move feels different. It’s not coming from the usual suspects, and it’s not tied to a major news event.
The funding rate for UNI is balanced at ↑0.0076%, and the 21-period average is ↑0.0057% - suggesting that leverage isn’t driving this move.
Volume is up, but not to the same degree as the top performers.
—
Not financial advice. DYOR.
📌 Gainers Radar · #87 · #Gainers #CryptoSighted $UNI
7.0% - that’s how much $UNI is up today, and it’s quietly climbing without a clear headline reason.
UNI is sitting at $4.32, up 7.0% on the day - and it’s not the only one in the spotlight.
The broader market is split: some coins are surging, others are falling hard.
And yet, UNI is moving without a clear external catalyst - at least, not one that’s showing up in the headlines.
Looking deeper, UNI’s 7-day change is up 11.8%, and its 30-day change is up 55.5% - showing a strong, sustained upward trend.
But today’s move feels different. It’s not coming from the usual suspects, and it’s not tied to a major news event.
The funding rate for UNI is balanced at ↑0.0076%, and the 21-period average is ↑0.0057% - suggesting that leverage isn’t driving this move.
Volume is up, but not to the same degree as the top performers.
—
Not financial advice. DYOR.
📌 Gainers Radar · #87 · #Gainers #CryptoSighted $UNI
161

·
--
Venice Token ($VVV) Gains Momentum with Community Buzz
Venice Token ($VVV) is trending as community engagement surges, despite a 6% dip in 24h. Ranked #87 by market cap, $VVV is capturing attention with its robust 24h volume of $16.7M. The token is positioning itself as a key player in the DeFi and NFT space, with ongoing developments and a supportive community. Traders should watch for any major updates or partnerships that could further boost its momentum. 📊 👀
Follow for more crypto setups.
#DeGenYuv #VeniceToken
Venice Token ($VVV ) Gains Momentum with Community Buzz
Venice Token ($VVV ) is trending as community engagement surges, despite a 6% dip in 24h. Ranked #87 by market cap, $VVV is capturing attention with its robust 24h volume of $16.7M. The token is positioning itself as a key player in the DeFi and NFT space, with ongoing developments and a supportive community. Traders should watch for any major updates or partnerships that could further boost its momentum. 📊 👀
Follow for more crypto setups.
#DeGenYuv #VeniceToken
Venice Token ($VVV ) is trending as community engagement surges, despite a 6% dip in 24h. Ranked #87 by market cap, $VVV is capturing attention with its robust 24h volume of $16.7M. The token is positioning itself as a key player in the DeFi and NFT space, with ongoing developments and a supportive community. Traders should watch for any major updates or partnerships that could further boost its momentum. 📊 👀
Follow for more crypto setups.
#DeGenYuv #VeniceToken

96
·
--
Just looking at this +6.19% bullish candle, I wouldn’t rush to say the $VVV trend has returned. This instinct needs to be validated with two data points: first, whether the volume can continue to stay above $20M; second, whether the price can hold above $14 for more than three days.
The truly notable change on the chart happened on August 18. In the prior nearly month, $VVV had mostly been base-building between $11.3 and $12.7. Even on August 17, volume had shrunk to a low of $4.61M. Then suddenly, it surged on expanded volume to $13.30. After that, volume stayed above $20M for the next two days.
The 7-day and 30-day gains are both 27%, which means this week consumed the price increase from the past month—suggesting the capital inflow was quite concentrated.
What I care about even more is its position: the market cap is $695M, ranking #87, which indicates the market is already valuing it as a mainstream asset. But it’s still 35% away from its ATH of $22.58. That means there are trapped-holder shares overhead, and it won’t be easy to push through just with a casual rally.
Over the past 30 days, there has also been at least one day with volume release above $30M (for example, July 22). Yet afterward, the price still pulled back. So the “accumulation at low levels” theory may be plausible, but the confirmation signal hasn’t shown up yet.
My view is valid only if, over the next two or three days, volume does not retreat below $10M and the pullback does not break $13.5. If it falls back on lighter volume, then this will be another cycle of low-volume, low-price action. Would you rather treat it as bottom confirmation, or wait until it reclaims $14.5 to discuss the trend?
Just looking at this +6.19% bullish candle, I wouldn’t rush to say the $VVV trend has returned. This instinct needs to be validated with two data points: first, whether the volume can continue to stay above $20M; second, whether the price can hold above $14 for more than three days.
The truly notable change on the chart happened on August 18. In the prior nearly month, $VVV had mostly been base-building between $11.3 and $12.7. Even on August 17, volume had shrunk to a low of $4.61M. Then suddenly, it surged on expanded volume to $13.30. After that, volume stayed above $20M for the next two days.
The 7-day and 30-day gains are both 27%, which means this week consumed the price increase from the past month—suggesting the capital inflow was quite concentrated.
What I care about even more is its position: the market cap is $695M, ranking #87, which indicates the market is already valuing it as a mainstream asset. But it’s still 35% away from its ATH of $22.58. That means there are trapped-holder shares overhead, and it won’t be easy to push through just with a casual rally.
Over the past 30 days, there has also been at least one day with volume release above $30M (for example, July 22). Yet afterward, the price still pulled back. So the “accumulation at low levels” theory may be plausible, but the confirmation signal hasn’t shown up yet.
My view is valid only if, over the next two or three days, volume does not retreat below $10M and the pullback does not break $13.5. If it falls back on lighter volume, then this will be another cycle of low-volume, low-price action. Would you rather treat it as bottom confirmation, or wait until it reclaims $14.5 to discuss the trend?
The truly notable change on the chart happened on August 18. In the prior nearly month, $VVV had mostly been base-building between $11.3 and $12.7. Even on August 17, volume had shrunk to a low of $4.61M. Then suddenly, it surged on expanded volume to $13.30. After that, volume stayed above $20M for the next two days.
The 7-day and 30-day gains are both 27%, which means this week consumed the price increase from the past month—suggesting the capital inflow was quite concentrated.
What I care about even more is its position: the market cap is $695M, ranking #87, which indicates the market is already valuing it as a mainstream asset. But it’s still 35% away from its ATH of $22.58. That means there are trapped-holder shares overhead, and it won’t be easy to push through just with a casual rally.
Over the past 30 days, there has also been at least one day with volume release above $30M (for example, July 22). Yet afterward, the price still pulled back. So the “accumulation at low levels” theory may be plausible, but the confirmation signal hasn’t shown up yet.
My view is valid only if, over the next two or three days, volume does not retreat below $10M and the pullback does not break $13.5. If it falls back on lighter volume, then this will be another cycle of low-volume, low-price action. Would you rather treat it as bottom confirmation, or wait until it reclaims $14.5 to discuss the trend?
135

·
--
** How to Build a Simple Trend-Following Strategy Using Daily Market Data? (BTC & ETH Example) 📈💡Arbitrum (ARBUSDT) is trending right now!
Rank: #87
** 1️⃣ **Collect and Summarize the Data** - Get the latest price and % change from CoinMarketCap (or Binance). - **Today's data (02 Feb 2026):** - **:** 76 823,77 USD │ %‑1,43 │ Volume 30,5 B USD - **:** 2 385,44 USD │ %‑2,84 │ Volume 15,5 B USD - 📊 *Note:* A negative daily change indicates near-term pressure; however, let's confirm the direction of the trend with long-term averages. 2️⃣ **Determine the Trend Direction (Simple Moving Averages)** - Plot the 20-period and 50-period SMAs (4-hour chart). - **Rule:** - Price > 20‑SMA > 50‑SMA → **Uptrend** - Price @ 20‑SMA @ 50‑SMA → **Downtrend** - *Example:* On BTC’s 4-hour chart, price is 76 800, 20‑SMA is 77 200, and 50‑SMA is 78 000 → price is below both SMAs → **short-term bearish trend**. 3️⃣ **Draw Support and Resistance Levels** - Connect the low/high points of the last 20–30 candles to draw horizontal lines. - **BTC example:** - Resistance: 78 500 USD (the highs of the last 2 days) - Support: 75 200 USD (the lows of the last 3 days) - **ETH example:** - Resistance: 2 460 USD - Support: 2 300 USD 4️⃣ **Create an Entry Signal (Price Action + Oscillator)** - **Bullish signal:** Price approaches the support level and forms a **bullish engulfing** or **hammer** candle + RSI @ 30 (oversold) → **BUY** - **Bearish signal:** Price approaches resistance and forms a **bearish engulfing** or **shooting star** candle + RSI > 70 → **SELL** - *Real example:* On the BTC 4-hour chart, a hammer candle formed at 75 300, RSI was 28 → buy
** How to Build a Simple Trend-Following Strategy Using Daily Market Data? (BTC & ETH Example) 📈💡
Arbitrum (ARBUSDT) is trending right now!
Rank: #87
** 1️⃣ **Collect and Summarize the Data** - Get the latest price and % change from CoinMarketCap (or Binance). - **Today's data (02 Feb 2026):** - **:** 76 823,77 USD │ %‑1,43 │ Volume 30,5 B USD - **:** 2 385,44 USD │ %‑2,84 │ Volume 15,5 B USD - 📊 *Note:* A negative daily change indicates near-term pressure; however, let's confirm the direction of the trend with long-term averages. 2️⃣ **Determine the Trend Direction (Simple Moving Averages)** - Plot the 20-period and 50-period SMAs (4-hour chart). - **Rule:** - Price > 20‑SMA > 50‑SMA → **Uptrend** - Price @ 20‑SMA @ 50‑SMA → **Downtrend** - *Example:* On BTC’s 4-hour chart, price is 76 800, 20‑SMA is 77 200, and 50‑SMA is 78 000 → price is below both SMAs → **short-term bearish trend**. 3️⃣ **Draw Support and Resistance Levels** - Connect the low/high points of the last 20–30 candles to draw horizontal lines. - **BTC example:** - Resistance: 78 500 USD (the highs of the last 2 days) - Support: 75 200 USD (the lows of the last 3 days) - **ETH example:** - Resistance: 2 460 USD - Support: 2 300 USD 4️⃣ **Create an Entry Signal (Price Action + Oscillator)** - **Bullish signal:** Price approaches the support level and forms a **bullish engulfing** or **hammer** candle + RSI @ 30 (oversold) → **BUY** - **Bearish signal:** Price approaches resistance and forms a **bearish engulfing** or **shooting star** candle + RSI > 70 → **SELL** - *Real example:* On the BTC 4-hour chart, a hammer candle formed at 75 300, RSI was 28 → buy
Rank: #87
** 1️⃣ **Collect and Summarize the Data** - Get the latest price and % change from CoinMarketCap (or Binance). - **Today's data (02 Feb 2026):** - **:** 76 823,77 USD │ %‑1,43 │ Volume 30,5 B USD - **:** 2 385,44 USD │ %‑2,84 │ Volume 15,5 B USD - 📊 *Note:* A negative daily change indicates near-term pressure; however, let's confirm the direction of the trend with long-term averages. 2️⃣ **Determine the Trend Direction (Simple Moving Averages)** - Plot the 20-period and 50-period SMAs (4-hour chart). - **Rule:** - Price > 20‑SMA > 50‑SMA → **Uptrend** - Price @ 20‑SMA @ 50‑SMA → **Downtrend** - *Example:* On BTC’s 4-hour chart, price is 76 800, 20‑SMA is 77 200, and 50‑SMA is 78 000 → price is below both SMAs → **short-term bearish trend**. 3️⃣ **Draw Support and Resistance Levels** - Connect the low/high points of the last 20–30 candles to draw horizontal lines. - **BTC example:** - Resistance: 78 500 USD (the highs of the last 2 days) - Support: 75 200 USD (the lows of the last 3 days) - **ETH example:** - Resistance: 2 460 USD - Support: 2 300 USD 4️⃣ **Create an Entry Signal (Price Action + Oscillator)** - **Bullish signal:** Price approaches the support level and forms a **bullish engulfing** or **hammer** candle + RSI @ 30 (oversold) → **BUY** - **Bearish signal:** Price approaches resistance and forms a **bearish engulfing** or **shooting star** candle + RSI > 70 → **SELL** - *Real example:* On the BTC 4-hour chart, a hammer candle formed at 75 300, RSI was 28 → buy
44
·
--
Trending: Arbitrum (ARBUSDT)Arbitrum (ARBUSDT) is trending on CoinGecko!
Rank: #87
The cryptocurrency market opened September with a broadly positive tone, as both Bitcoin (BTC) and Ethereum (ETH) posted steady gains and several altcoins outperformed the majors. According to the latest Binance data (timestamp 2026‑09‑01T00:08:13.179Z), BTC traded at **8,656.53**, up **1.49%** on the day with a 24‑hour volume of roughly **.19 trillion**. ETH followed suit, climbing **2.42%** to **,469.08** and recording a volume of about **39 billion**.
While the two largest assets showed modest upward momentum, the real excitement came from the altcoin sector. The top‑movers list highlights NEAR Protocol (NEARUSDT) as the day’s standout, rising **5.82%** to **.928** on a quoted volume of **5.7 billion**. Cardano (ADAUSDT) and Uniswap (UNIUSDT) also posted strong performances, gaining **3.18%** and **3.09%**, respectively, with ADA trading near **/bin/sh.198** and UNI around **.27**. Other notable gainers included Polkadot (DOTUSDT) at **+2.69%**, Chainlink (LINKUSDT) and Avalanche (AVAXUSDT) each up **~2.06%**, and XRP (XRPUSDT) adding **1.97%**.
The “gainers” section provides additional context for these moves. NEAR’s price jumped from an open of **.822** to a high of **.938**, with a 24‑hour quote volume of **5.70 billion** and a trade count of over **175 k**. ADA’s rally was supported by a steady increase in bid depth, evident from a bid quantity of **147,141 ADA** at the ask price of **/bin/sh.198**. UNI’s gains were accompanied by a relatively low last traded quantity (**21.83 UNI**) but a healthy ask volume, indicating that buying interest is being absorbed by larger market participants.
Interestingly, the losers array is empty for this snapshot, suggesting that the majority of tracked assets are either flat or in positive territory. This broad‑based uplift can be interpreted as a sign of improving risk appetite among traders, possibly driven by macro‑economic cues, upcoming protocol upgrades, or renewed interest in layer‑1 and DeFi ecosystems.
From an educational standpoint, the data illustrates how Bitcoin and Ethereum often set the tone for the market, while altcoins can exhibit amplified price movements—both to the upside and downside—due to lower liquidity and higher sensitivity to project‑specific news. Traders monitoring such snapshots can gauge relative strength, observe volume‑price relationships, and identify which sectors are attracting capital at any given moment.
Overall, the September 1 snapshot paints a picture of a cautiously optimistic market, with leading cryptocurrencies posting steady gains and several altcoins delivering outsized returns. As always, participants should conduct their own research and consider multiple data points before forming any market view.
#arb #crypto #trending #CoinGecko
Trending: Arbitrum (ARBUSDT)
Arbitrum (ARBUSDT) is trending on CoinGecko!
Rank: #87
The cryptocurrency market opened September with a broadly positive tone, as both Bitcoin (BTC) and Ethereum (ETH) posted steady gains and several altcoins outperformed the majors. According to the latest Binance data (timestamp 2026‑09‑01T00:08:13.179Z), BTC traded at **8,656.53**, up **1.49%** on the day with a 24‑hour volume of roughly **.19 trillion**. ETH followed suit, climbing **2.42%** to **,469.08** and recording a volume of about **39 billion**.
While the two largest assets showed modest upward momentum, the real excitement came from the altcoin sector. The top‑movers list highlights NEAR Protocol (NEARUSDT) as the day’s standout, rising **5.82%** to **.928** on a quoted volume of **5.7 billion**. Cardano (ADAUSDT) and Uniswap (UNIUSDT) also posted strong performances, gaining **3.18%** and **3.09%**, respectively, with ADA trading near **/bin/sh.198** and UNI around **.27**. Other notable gainers included Polkadot (DOTUSDT) at **+2.69%**, Chainlink (LINKUSDT) and Avalanche (AVAXUSDT) each up **~2.06%**, and XRP (XRPUSDT) adding **1.97%**.
The “gainers” section provides additional context for these moves. NEAR’s price jumped from an open of **.822** to a high of **.938**, with a 24‑hour quote volume of **5.70 billion** and a trade count of over **175 k**. ADA’s rally was supported by a steady increase in bid depth, evident from a bid quantity of **147,141 ADA** at the ask price of **/bin/sh.198**. UNI’s gains were accompanied by a relatively low last traded quantity (**21.83 UNI**) but a healthy ask volume, indicating that buying interest is being absorbed by larger market participants.
Interestingly, the losers array is empty for this snapshot, suggesting that the majority of tracked assets are either flat or in positive territory. This broad‑based uplift can be interpreted as a sign of improving risk appetite among traders, possibly driven by macro‑economic cues, upcoming protocol upgrades, or renewed interest in layer‑1 and DeFi ecosystems.
From an educational standpoint, the data illustrates how Bitcoin and Ethereum often set the tone for the market, while altcoins can exhibit amplified price movements—both to the upside and downside—due to lower liquidity and higher sensitivity to project‑specific news. Traders monitoring such snapshots can gauge relative strength, observe volume‑price relationships, and identify which sectors are attracting capital at any given moment.
Overall, the September 1 snapshot paints a picture of a cautiously optimistic market, with leading cryptocurrencies posting steady gains and several altcoins delivering outsized returns. As always, participants should conduct their own research and consider multiple data points before forming any market view.
#arb #crypto #trending #CoinGecko
Rank: #87
The cryptocurrency market opened September with a broadly positive tone, as both Bitcoin (BTC) and Ethereum (ETH) posted steady gains and several altcoins outperformed the majors. According to the latest Binance data (timestamp 2026‑09‑01T00:08:13.179Z), BTC traded at **8,656.53**, up **1.49%** on the day with a 24‑hour volume of roughly **.19 trillion**. ETH followed suit, climbing **2.42%** to **,469.08** and recording a volume of about **39 billion**.
While the two largest assets showed modest upward momentum, the real excitement came from the altcoin sector. The top‑movers list highlights NEAR Protocol (NEARUSDT) as the day’s standout, rising **5.82%** to **.928** on a quoted volume of **5.7 billion**. Cardano (ADAUSDT) and Uniswap (UNIUSDT) also posted strong performances, gaining **3.18%** and **3.09%**, respectively, with ADA trading near **/bin/sh.198** and UNI around **.27**. Other notable gainers included Polkadot (DOTUSDT) at **+2.69%**, Chainlink (LINKUSDT) and Avalanche (AVAXUSDT) each up **~2.06%**, and XRP (XRPUSDT) adding **1.97%**.
The “gainers” section provides additional context for these moves. NEAR’s price jumped from an open of **.822** to a high of **.938**, with a 24‑hour quote volume of **5.70 billion** and a trade count of over **175 k**. ADA’s rally was supported by a steady increase in bid depth, evident from a bid quantity of **147,141 ADA** at the ask price of **/bin/sh.198**. UNI’s gains were accompanied by a relatively low last traded quantity (**21.83 UNI**) but a healthy ask volume, indicating that buying interest is being absorbed by larger market participants.
Interestingly, the losers array is empty for this snapshot, suggesting that the majority of tracked assets are either flat or in positive territory. This broad‑based uplift can be interpreted as a sign of improving risk appetite among traders, possibly driven by macro‑economic cues, upcoming protocol upgrades, or renewed interest in layer‑1 and DeFi ecosystems.
From an educational standpoint, the data illustrates how Bitcoin and Ethereum often set the tone for the market, while altcoins can exhibit amplified price movements—both to the upside and downside—due to lower liquidity and higher sensitivity to project‑specific news. Traders monitoring such snapshots can gauge relative strength, observe volume‑price relationships, and identify which sectors are attracting capital at any given moment.
Overall, the September 1 snapshot paints a picture of a cautiously optimistic market, with leading cryptocurrencies posting steady gains and several altcoins delivering outsized returns. As always, participants should conduct their own research and consider multiple data points before forming any market view.
#arb #crypto #trending #CoinGecko
25
·
--
On this $JUP 24, it fell 0.06% over 24 hours—seemingly stable. But what’s really worth looking at isn’t this tiny price move; it’s the trading volume and the price-volume structure. In the past 30 days, it’s down 21.67%. It’s been drifting lower from $0.24 to around the current $0.19 on shrinking volume: trading volume has dropped from 48M to 13M. This isn’t consolidation—it’s participation that’s steadily fading.
The illusion of “holding flat” masks the fact that both buyers and sellers are withdrawing. More importantly: after dropping 90% from its ATH, attempts to rally off the lows on reduced volume have failed multiple times. In the past 30 days, there were two brief rebounds from $0.196 to $0.199, but without volume backing, and then it continued to sink. The price is struggling within a compressed range, but the capital has no intention of returning.
What I care about is whether current daily trading volume of 13M can support a decent rebound for an asset ranked #87 with a market cap of $640M. If volume continues to contract, even a small green candle won’t clearly show direction. The real confirmation comes down to this: is there an external catalyst or on-chain data that can reactivate liquidity? Otherwise, the slow bleed lower is likely to continue.
What’s most likely to overturn the “shrinking-volume downtrend reflects persistent weakness” judgment—an unexpected burst of buy-side volume, the start of a catalyst, or a reversal in overall market sentiment? I’d like to hear your thoughts.
On this $JUP 24, it fell 0.06% over 24 hours—seemingly stable. But what’s really worth looking at isn’t this tiny price move; it’s the trading volume and the price-volume structure. In the past 30 days, it’s down 21.67%. It’s been drifting lower from $0.24 to around the current $0.19 on shrinking volume: trading volume has dropped from 48M to 13M. This isn’t consolidation—it’s participation that’s steadily fading.
The illusion of “holding flat” masks the fact that both buyers and sellers are withdrawing. More importantly: after dropping 90% from its ATH, attempts to rally off the lows on reduced volume have failed multiple times. In the past 30 days, there were two brief rebounds from $0.196 to $0.199, but without volume backing, and then it continued to sink. The price is struggling within a compressed range, but the capital has no intention of returning.
What I care about is whether current daily trading volume of 13M can support a decent rebound for an asset ranked #87 with a market cap of $640M. If volume continues to contract, even a small green candle won’t clearly show direction. The real confirmation comes down to this: is there an external catalyst or on-chain data that can reactivate liquidity? Otherwise, the slow bleed lower is likely to continue.
What’s most likely to overturn the “shrinking-volume downtrend reflects persistent weakness” judgment—an unexpected burst of buy-side volume, the start of a catalyst, or a reversal in overall market sentiment? I’d like to hear your thoughts.
The illusion of “holding flat” masks the fact that both buyers and sellers are withdrawing. More importantly: after dropping 90% from its ATH, attempts to rally off the lows on reduced volume have failed multiple times. In the past 30 days, there were two brief rebounds from $0.196 to $0.199, but without volume backing, and then it continued to sink. The price is struggling within a compressed range, but the capital has no intention of returning.
What I care about is whether current daily trading volume of 13M can support a decent rebound for an asset ranked #87 with a market cap of $640M. If volume continues to contract, even a small green candle won’t clearly show direction. The real confirmation comes down to this: is there an external catalyst or on-chain data that can reactivate liquidity? Otherwise, the slow bleed lower is likely to continue.
What’s most likely to overturn the “shrinking-volume downtrend reflects persistent weakness” judgment—an unexpected burst of buy-side volume, the start of a catalyst, or a reversal in overall market sentiment? I’d like to hear your thoughts.
44

·
--
$LIT Catches Fire: Why Lighter is Climbing the Ranks
$LIT is quietly climbing the ranks, capturing the #7 spot on the trending list. While the broader market searches for direction, Lighter is carving out its own path with a solid 3.33% gain over the last 24 hours, trading at $2.3663. What is driving this momentum? A surge in trading volume, which has crossed $17.1 million, signaling that smart money is actively positioning. Sitting at a market cap rank of #87, $LIT is positioning itself as a mid-cap favorite for traders looking for high-velocity setups. The project's underlying narrative is gaining traction as community engagement spikes, making this a key asset to watch closely as liquidity begins to rotate. 👀⚡
Follow for more crypto setups.
#HahaProfit #Lighter
$LIT Catches Fire: Why Lighter is Climbing the Ranks
$LIT is quietly climbing the ranks, capturing the #7 spot on the trending list. While the broader market searches for direction, Lighter is carving out its own path with a solid 3.33% gain over the last 24 hours, trading at $2.3663. What is driving this momentum? A surge in trading volume, which has crossed $17.1 million, signaling that smart money is actively positioning. Sitting at a market cap rank of #87, $LIT is positioning itself as a mid-cap favorite for traders looking for high-velocity setups. The project's underlying narrative is gaining traction as community engagement spikes, making this a key asset to watch closely as liquidity begins to rotate. 👀⚡
Follow for more crypto setups.
#HahaProfit #Lighter
$LIT is quietly climbing the ranks, capturing the #7 spot on the trending list. While the broader market searches for direction, Lighter is carving out its own path with a solid 3.33% gain over the last 24 hours, trading at $2.3663. What is driving this momentum? A surge in trading volume, which has crossed $17.1 million, signaling that smart money is actively positioning. Sitting at a market cap rank of #87, $LIT is positioning itself as a mid-cap favorite for traders looking for high-velocity setups. The project's underlying narrative is gaining traction as community engagement spikes, making this a key asset to watch closely as liquidity begins to rotate. 👀⚡
Follow for more crypto setups.
#HahaProfit #Lighter

39
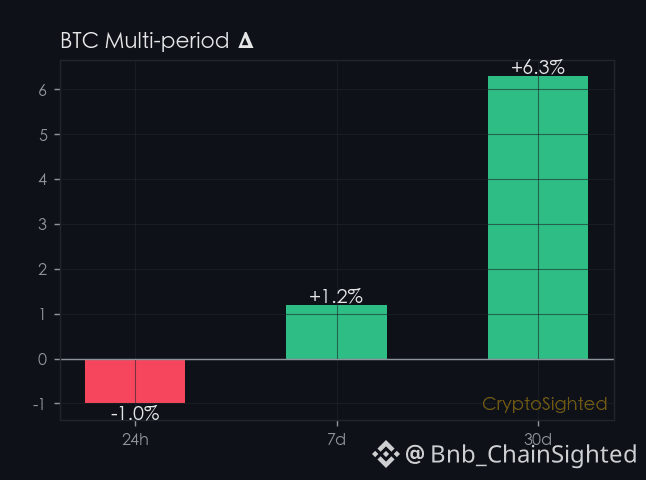
↓1.11% - the 24-hour drop in $BTC - is the hook.
BTC’s 30-day gain of ↑8.1% paints a picture of steady progress - but the funding rate tells a different story.
BTC is trading near $64,157.87, just below its 24-hour high of $65,808.59.
Over the past 21 periods, the funding rate for BTC has climbed ↑0.097%, indicating that leveraged longs are paying a premium to hold their positions.
This isn’t just a one-off spike - it’s a gradual build-up.
The rate has stabilized recently, averaging ↑0.0046% per period, but the accumulation remains.
That means the cost of leverage is stacking up, even if the price action looks smooth on the surface.
If the latter is true, it might be a warning sign.
Funding rates are the cost of leverage - and they’re cumulative.
Even if they’re low now, the fact that they’ve been rising over 21 periods suggests that leveraged positions are becoming more crowded.
That’s a recipe for a sudden shift in sentiment - and with liquidation triggers always lurking, the balance could tip quickly.
Checkpoint: BTC’s 21-period funding rate is ↑0.097% - if it holds above that level tomorrow, the leveraged longs are still paying a premium.
If it drops below, it could signal a shift in sentiment, and the 30-day gain might be the start of a correction.
—
📊 14 directional calls in the last 30d, every one auto-settled against price. Direction only — no buy/sell calls.
Not financial advice. DYOR.
📌 Funding Pulse · #87 · #FundingRate #CryptoSighted $BTC
↓1.11% - the 24-hour drop in $BTC - is the hook.
BTC’s 30-day gain of ↑8.1% paints a picture of steady progress - but the funding rate tells a different story.
BTC is trading near $64,157.87, just below its 24-hour high of $65,808.59.
Over the past 21 periods, the funding rate for BTC has climbed ↑0.097%, indicating that leveraged longs are paying a premium to hold their positions.
This isn’t just a one-off spike - it’s a gradual build-up.
The rate has stabilized recently, averaging ↑0.0046% per period, but the accumulation remains.
That means the cost of leverage is stacking up, even if the price action looks smooth on the surface.
If the latter is true, it might be a warning sign.
Funding rates are the cost of leverage - and they’re cumulative.
Even if they’re low now, the fact that they’ve been rising over 21 periods suggests that leveraged positions are becoming more crowded.
That’s a recipe for a sudden shift in sentiment - and with liquidation triggers always lurking, the balance could tip quickly.
Checkpoint: BTC’s 21-period funding rate is ↑0.097% - if it holds above that level tomorrow, the leveraged longs are still paying a premium.
If it drops below, it could signal a shift in sentiment, and the 30-day gain might be the start of a correction.
—
📊 14 directional calls in the last 30d, every one auto-settled against price. Direction only — no buy/sell calls.
Not financial advice. DYOR.
📌 Funding Pulse · #87 · #FundingRate #CryptoSighted $BTC
BTC’s 30-day gain of ↑8.1% paints a picture of steady progress - but the funding rate tells a different story.
BTC is trading near $64,157.87, just below its 24-hour high of $65,808.59.
Over the past 21 periods, the funding rate for BTC has climbed ↑0.097%, indicating that leveraged longs are paying a premium to hold their positions.
This isn’t just a one-off spike - it’s a gradual build-up.
The rate has stabilized recently, averaging ↑0.0046% per period, but the accumulation remains.
That means the cost of leverage is stacking up, even if the price action looks smooth on the surface.
If the latter is true, it might be a warning sign.
Funding rates are the cost of leverage - and they’re cumulative.
Even if they’re low now, the fact that they’ve been rising over 21 periods suggests that leveraged positions are becoming more crowded.
That’s a recipe for a sudden shift in sentiment - and with liquidation triggers always lurking, the balance could tip quickly.
Checkpoint: BTC’s 21-period funding rate is ↑0.097% - if it holds above that level tomorrow, the leveraged longs are still paying a premium.
If it drops below, it could signal a shift in sentiment, and the 30-day gain might be the start of a correction.
—
📊 14 directional calls in the last 30d, every one auto-settled against price. Direction only — no buy/sell calls.
Not financial advice. DYOR.
📌 Funding Pulse · #87 · #FundingRate #CryptoSighted $BTC
137
Log in to explore more content
Join global crypto users on Binance Square
⚡️ Get latest and useful information about crypto.
💬 Trusted by the world’s largest crypto exchange.
👍 Discover real insights from verified creators.
Email / Phone number
Trending Topics
1
#BTCRebounds80K
18,160 views
459 Discussing
2
#Binance98PercentReplenished
16,914 views
426 Discussing
3
#USMidterms-WhatAreMarketsExpecting?
273,245 views
1,906 Discussing
4
#USOctoberNFP-AreRateCutsStillPossible
358,756 views
2,722 Discussing
5
#AMDBeatsExpectations-AINarrativeContinues
76,656 views
719 Discussing
6
#CircleQ3Revenue865M
19,797 views
408 Discussing
7
#BinanceIncidentReport
463,804 views
2,027 Discussing
8
#USStocksOpenHigherAsDowGains1.9%
2,556 views
54 Discussing
9
#ADPUSPrivateEmployersAdd86000JobsInOctober
1,846 views
35 Discussing
10
#FrenchAssemblyPassesSelfCustodiedCryptoReportingAmendment
668 views
17 Discussing