
#85
85
9,528 views
52 Discussing
Hot
Latest

·
--
$NEXO's reclaim lasted exactly two hours. Then it spent 29 straight hours under the line.
The line was $0.754. Nov 6, 00:00 UTC closed $0.755, 01:00 closed $0.757 — the reclaim printed. 02:00 closed $0.749. Dead in one hour.
Since then, 29 straight closed hours under $0.754 — 02:00 Nov 6 through 06:00 today — highest close $0.749. Not a wick. A full day of closes.
The other side: the $0.724 flush low has held on every single close. Closest call was 06:00 Nov 6, wicked to exactly $0.724 and closed $0.734. Lows of $0.725–$0.727 keep testing it from above.
Live $0.736, +0.68% 24h, H $0.749 / L $0.725, $622k Binance volume — a thin book, 5,263 trades. 1h chart: RSI 42, under EMA20 $0.7378 / EMA50 $0.7434. Rank #85, $731.6M, -11.7% in 30 days, -82% off the $4.07 ATH, fully circulating — no unlock overhang.
No fresh headline — tape, not news. BTC $76,024, +0.74% — the board is flat, this is NEXO's own tape.
Honest other side: RSI 42 is cooling, and one hourly close back above $0.754 unwrites the chapter. A floor that holds for 29 hours is a floor — until it isn't.
Not a call.
08:00 UTC close, 13:30 IST: does $0.724 hold a 30th hour, or does a closed hour under it open new ground?
$NEXO 's reclaim lasted exactly two hours. Then it spent 29 straight hours under the line.
The line was $0.754. Nov 6, 00:00 UTC closed $0.755, 01:00 closed $0.757 — the reclaim printed. 02:00 closed $0.749. Dead in one hour.
Since then, 29 straight closed hours under $0.754 — 02:00 Nov 6 through 06:00 today — highest close $0.749. Not a wick. A full day of closes.
The other side: the $0.724 flush low has held on every single close. Closest call was 06:00 Nov 6, wicked to exactly $0.724 and closed $0.734. Lows of $0.725–$0.727 keep testing it from above.
Live $0.736, +0.68% 24h, H $0.749 / L $0.725, $622k Binance volume — a thin book, 5,263 trades. 1h chart: RSI 42, under EMA20 $0.7378 / EMA50 $0.7434. Rank #85, $731.6M, -11.7% in 30 days, -82% off the $4.07 ATH, fully circulating — no unlock overhang.
No fresh headline — tape, not news. BTC $76,024, +0.74% — the board is flat, this is NEXO's own tape.
Honest other side: RSI 42 is cooling, and one hourly close back above $0.754 unwrites the chapter. A floor that holds for 29 hours is a floor — until it isn't.
Not a call.
08:00 UTC close, 13:30 IST: does $0.724 hold a 30th hour, or does a closed hour under it open new ground?
The line was $0.754. Nov 6, 00:00 UTC closed $0.755, 01:00 closed $0.757 — the reclaim printed. 02:00 closed $0.749. Dead in one hour.
Since then, 29 straight closed hours under $0.754 — 02:00 Nov 6 through 06:00 today — highest close $0.749. Not a wick. A full day of closes.
The other side: the $0.724 flush low has held on every single close. Closest call was 06:00 Nov 6, wicked to exactly $0.724 and closed $0.734. Lows of $0.725–$0.727 keep testing it from above.
Live $0.736, +0.68% 24h, H $0.749 / L $0.725, $622k Binance volume — a thin book, 5,263 trades. 1h chart: RSI 42, under EMA20 $0.7378 / EMA50 $0.7434. Rank #85, $731.6M, -11.7% in 30 days, -82% off the $4.07 ATH, fully circulating — no unlock overhang.
No fresh headline — tape, not news. BTC $76,024, +0.74% — the board is flat, this is NEXO's own tape.
Honest other side: RSI 42 is cooling, and one hourly close back above $0.754 unwrites the chapter. A floor that holds for 29 hours is a floor — until it isn't.
Not a call.
08:00 UTC close, 13:30 IST: does $0.724 hold a 30th hour, or does a closed hour under it open new ground?
7
·
--
$1M to deploy today. Two doors. ENTRY 84.
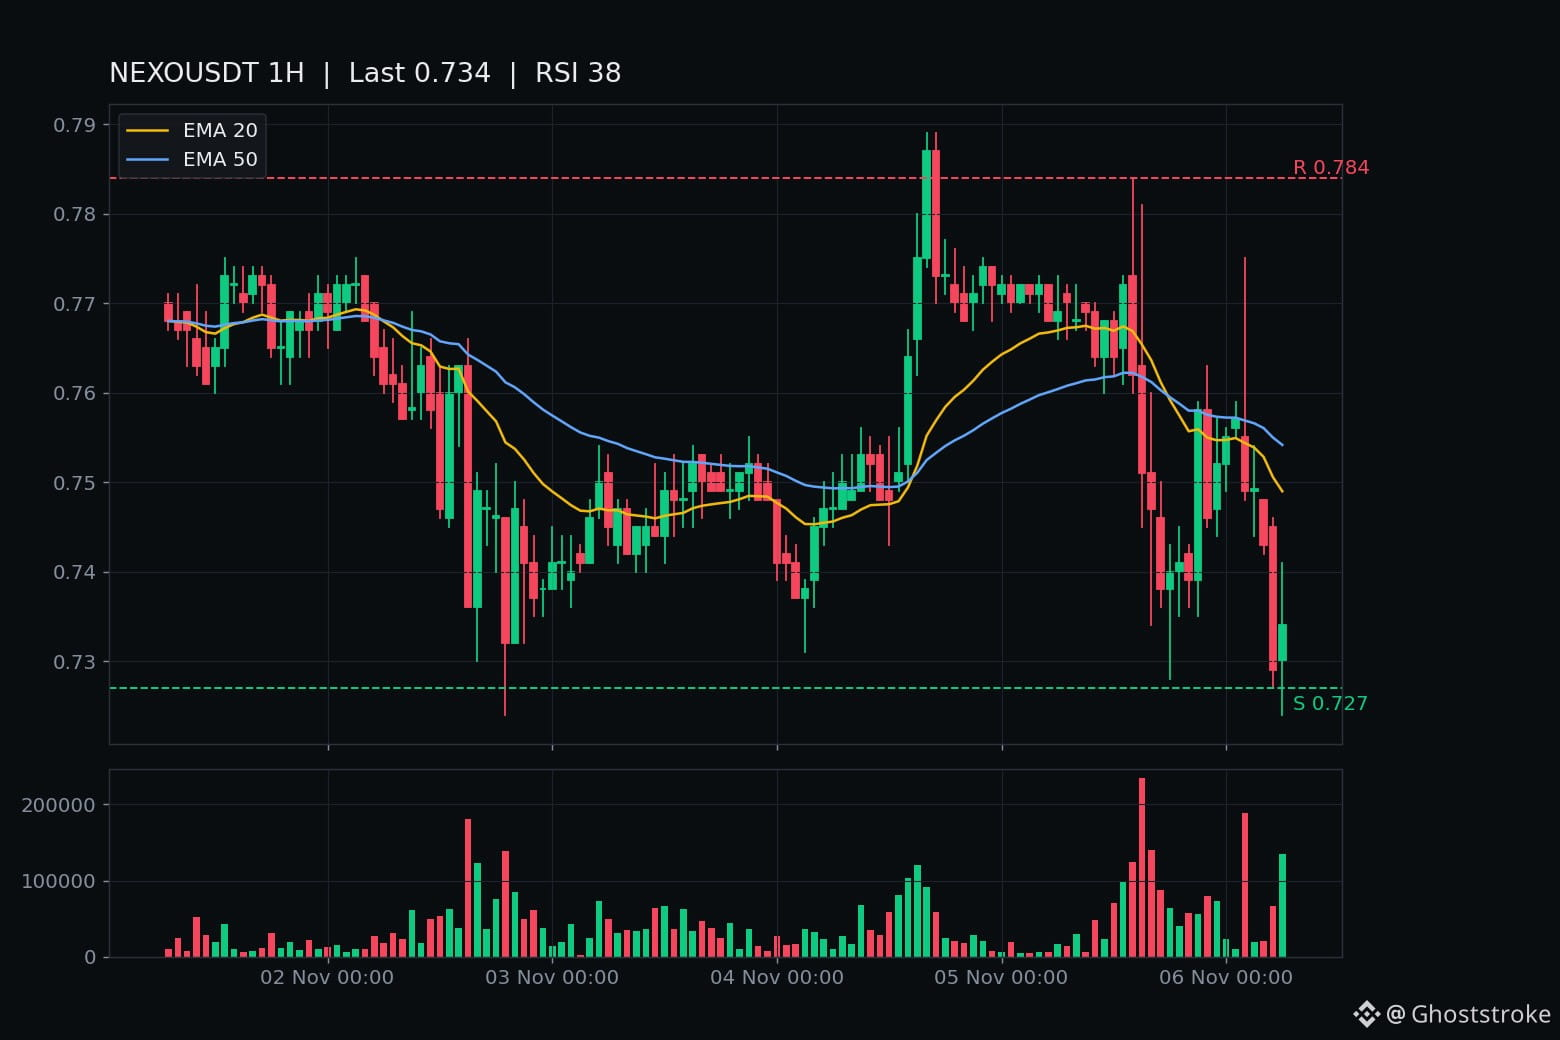
Door 1 — $NEXO $0.733, -4.6%. The reclaim died quietly overnight: five straight hourly closes under the $0.754 line (02:00 $0.749 → 06:00 $0.734), and the 06:00 hour touched the $0.724 flush low to the cent — low exactly $0.724 — then closed $0.734. The line held by a hair. RSI 38, both EMAs overhead ($0.749/$0.754). Rank #85, $733M, 1B/1B out, -82% off the $4.07 ATH. No fresh headline — yesterday's Base maintenance pause was routine, and the Kraken listing (Oct 22) is still the newest real item. Honest other side: BTC is -5.8% today and NEXO is only -4.6% — it's outperforming the board, not leading the wash. A closed hour below $0.724 is the real break, not this touch.
Door 2 — $HYPE $77.30, -7.2%. The unlock everyone feared lands today — except the actual release is 180,000 HYPE (~$14M), not the 9.92M on the calendar. The 9.92M is the schedule's admin max; the team committed 180k, about 1.8% of it (CoinDCX, CryptoNews, Binance Square news). Tape: 23:00 closed $76.64 under the $76.82 shelf, 00:00 reclaimed it at $77.70, then ground $77.50–$78.10 — 04:00 closed $78.10, nine cents under the $78.19 ceiling. Rank #11, $18.5B, -16% in a week. The ICE deal (Oct 29, approvals pending) is backdrop, not a driver. Honest other side: -7.2% on a wash board, and if the 180k does hit exchanges, $76.82 breaks and the story flips.
My pick: Door 2. A dated fear that shrinks ~55x on inspection beats a shelf that's already been tapped to the cent. Not a call, either way.
The 08:00 UTC close (13:30 IST) decides both: NEXO under $0.724, or HYPE over $78.19 — which one moves first?
$1M to deploy today. Two doors. ENTRY 84.
Door 1 — $NEXO $0.733, -4.6%. The reclaim died quietly overnight: five straight hourly closes under the $0.754 line (02:00 $0.749 → 06:00 $0.734), and the 06:00 hour touched the $0.724 flush low to the cent — low exactly $0.724 — then closed $0.734. The line held by a hair. RSI 38, both EMAs overhead ($0.749/$0.754). Rank #85, $733M, 1B/1B out, -82% off the $4.07 ATH. No fresh headline — yesterday's Base maintenance pause was routine, and the Kraken listing (Oct 22) is still the newest real item. Honest other side: BTC is -5.8% today and NEXO is only -4.6% — it's outperforming the board, not leading the wash. A closed hour below $0.724 is the real break, not this touch.
Door 2 — $HYPE $77.30, -7.2%. The unlock everyone feared lands today — except the actual release is 180,000 HYPE (~$14M), not the 9.92M on the calendar. The 9.92M is the schedule's admin max; the team committed 180k, about 1.8% of it (CoinDCX, CryptoNews, Binance Square news). Tape: 23:00 closed $76.64 under the $76.82 shelf, 00:00 reclaimed it at $77.70, then ground $77.50–$78.10 — 04:00 closed $78.10, nine cents under the $78.19 ceiling. Rank #11, $18.5B, -16% in a week. The ICE deal (Oct 29, approvals pending) is backdrop, not a driver. Honest other side: -7.2% on a wash board, and if the 180k does hit exchanges, $76.82 breaks and the story flips.
My pick: Door 2. A dated fear that shrinks ~55x on inspection beats a shelf that's already been tapped to the cent. Not a call, either way.
The 08:00 UTC close (13:30 IST) decides both: NEXO under $0.724, or HYPE over $78.19 — which one moves first?
Door 1 — $NEXO $0.733, -4.6%. The reclaim died quietly overnight: five straight hourly closes under the $0.754 line (02:00 $0.749 → 06:00 $0.734), and the 06:00 hour touched the $0.724 flush low to the cent — low exactly $0.724 — then closed $0.734. The line held by a hair. RSI 38, both EMAs overhead ($0.749/$0.754). Rank #85, $733M, 1B/1B out, -82% off the $4.07 ATH. No fresh headline — yesterday's Base maintenance pause was routine, and the Kraken listing (Oct 22) is still the newest real item. Honest other side: BTC is -5.8% today and NEXO is only -4.6% — it's outperforming the board, not leading the wash. A closed hour below $0.724 is the real break, not this touch.
Door 2 — $HYPE $77.30, -7.2%. The unlock everyone feared lands today — except the actual release is 180,000 HYPE (~$14M), not the 9.92M on the calendar. The 9.92M is the schedule's admin max; the team committed 180k, about 1.8% of it (CoinDCX, CryptoNews, Binance Square news). Tape: 23:00 closed $76.64 under the $76.82 shelf, 00:00 reclaimed it at $77.70, then ground $77.50–$78.10 — 04:00 closed $78.10, nine cents under the $78.19 ceiling. Rank #11, $18.5B, -16% in a week. The ICE deal (Oct 29, approvals pending) is backdrop, not a driver. Honest other side: -7.2% on a wash board, and if the 180k does hit exchanges, $76.82 breaks and the story flips.
My pick: Door 2. A dated fear that shrinks ~55x on inspection beats a shelf that's already been tapped to the cent. Not a call, either way.
The 08:00 UTC close (13:30 IST) decides both: NEXO under $0.724, or HYPE over $78.19 — which one moves first?
12
·
--
$1M to deploy today. Two doors. ENTRY 72.
Both doors decide on the same bell — the 20:00 UTC close, 01:30 IST. One hour, two verdicts.
Door 1 — $NEAR, $3.66, -9.1% today.
The slide low is $3.69. NEAR held it by $0.006 at 17:00 UTC, then closed 18:00 at $3.677 — the first closed hour under it. The break came on the day's heaviest bar: the 15:00 flush printed 5.63M NEAR, about $21M, and took the $3.81 window low first. The forming hour already wicked back above the line to $3.702 and got rejected — live $3.66, still under. RSI 27, both EMAs overhead at $3.90/$3.95. Rank #21, $4.8B, fully circulating, -82% off its $20.44 top. $85M of Binance volume behind the move.
Door 2 — $NEXO, $0.742, -4.1% today.
Yesterday it reclaimed $0.754. Today it gave it straight back — four straight closes under it (15:00 $0.751 on the day's heaviest bar, then $0.747, $0.738, $0.740). The forming hour sits $0.735–$0.743, still under. Rank #85, $0.74B, fully circulating. But the whole day's volume is $843k — a hundredth of NEAR's book.
My pick is Door 1. A slide low breaking on the day's heaviest bar with an $85M book beats a reclaimed line given back on $179k bars.
The other side, honestly: NEAR's break is ONE close, $0.013 under the line — one close back above $3.69 unwrites it. NEXO's unwriting is already confirmed by four closes, and RSI 33 is one bad hour from a snap-back.
No fresh headline on either — tape, not news. BTC $76,078, -5.2%, the same wash that took LINK, BNB, ZEC and HYPE apart today.
Not a call, either way.
01:30 IST, one bell decides both: does NEAR confirm under $3.69, or does NEXO reclaim $0.754? Which door are you watching?
$1M to deploy today. Two doors. ENTRY 72.
Both doors decide on the same bell — the 20:00 UTC close, 01:30 IST. One hour, two verdicts.
Door 1 — $NEAR , $3.66, -9.1% today.
The slide low is $3.69. NEAR held it by $0.006 at 17:00 UTC, then closed 18:00 at $3.677 — the first closed hour under it. The break came on the day's heaviest bar: the 15:00 flush printed 5.63M NEAR, about $21M, and took the $3.81 window low first. The forming hour already wicked back above the line to $3.702 and got rejected — live $3.66, still under. RSI 27, both EMAs overhead at $3.90/$3.95. Rank #21, $4.8B, fully circulating, -82% off its $20.44 top. $85M of Binance volume behind the move.
Door 2 — $NEXO , $0.742, -4.1% today.
Yesterday it reclaimed $0.754. Today it gave it straight back — four straight closes under it (15:00 $0.751 on the day's heaviest bar, then $0.747, $0.738, $0.740). The forming hour sits $0.735–$0.743, still under. Rank #85, $0.74B, fully circulating. But the whole day's volume is $843k — a hundredth of NEAR's book.
My pick is Door 1. A slide low breaking on the day's heaviest bar with an $85M book beats a reclaimed line given back on $179k bars.
The other side, honestly: NEAR's break is ONE close, $0.013 under the line — one close back above $3.69 unwrites it. NEXO's unwriting is already confirmed by four closes, and RSI 33 is one bad hour from a snap-back.
No fresh headline on either — tape, not news. BTC $76,078, -5.2%, the same wash that took LINK, BNB, ZEC and HYPE apart today.
Not a call, either way.
01:30 IST, one bell decides both: does NEAR confirm under $3.69, or does NEXO reclaim $0.754? Which door are you watching?
Both doors decide on the same bell — the 20:00 UTC close, 01:30 IST. One hour, two verdicts.
Door 1 — $NEAR , $3.66, -9.1% today.
The slide low is $3.69. NEAR held it by $0.006 at 17:00 UTC, then closed 18:00 at $3.677 — the first closed hour under it. The break came on the day's heaviest bar: the 15:00 flush printed 5.63M NEAR, about $21M, and took the $3.81 window low first. The forming hour already wicked back above the line to $3.702 and got rejected — live $3.66, still under. RSI 27, both EMAs overhead at $3.90/$3.95. Rank #21, $4.8B, fully circulating, -82% off its $20.44 top. $85M of Binance volume behind the move.
Door 2 — $NEXO , $0.742, -4.1% today.
Yesterday it reclaimed $0.754. Today it gave it straight back — four straight closes under it (15:00 $0.751 on the day's heaviest bar, then $0.747, $0.738, $0.740). The forming hour sits $0.735–$0.743, still under. Rank #85, $0.74B, fully circulating. But the whole day's volume is $843k — a hundredth of NEAR's book.
My pick is Door 1. A slide low breaking on the day's heaviest bar with an $85M book beats a reclaimed line given back on $179k bars.
The other side, honestly: NEAR's break is ONE close, $0.013 under the line — one close back above $3.69 unwrites it. NEXO's unwriting is already confirmed by four closes, and RSI 33 is one bad hour from a snap-back.
No fresh headline on either — tape, not news. BTC $76,078, -5.2%, the same wash that took LINK, BNB, ZEC and HYPE apart today.
Not a call, either way.
01:30 IST, one bell decides both: does NEAR confirm under $3.69, or does NEXO reclaim $0.754? Which door are you watching?
11
·
--
$NEXO just reclaimed $0.754 — and this tape reads different from every chop hour before it.
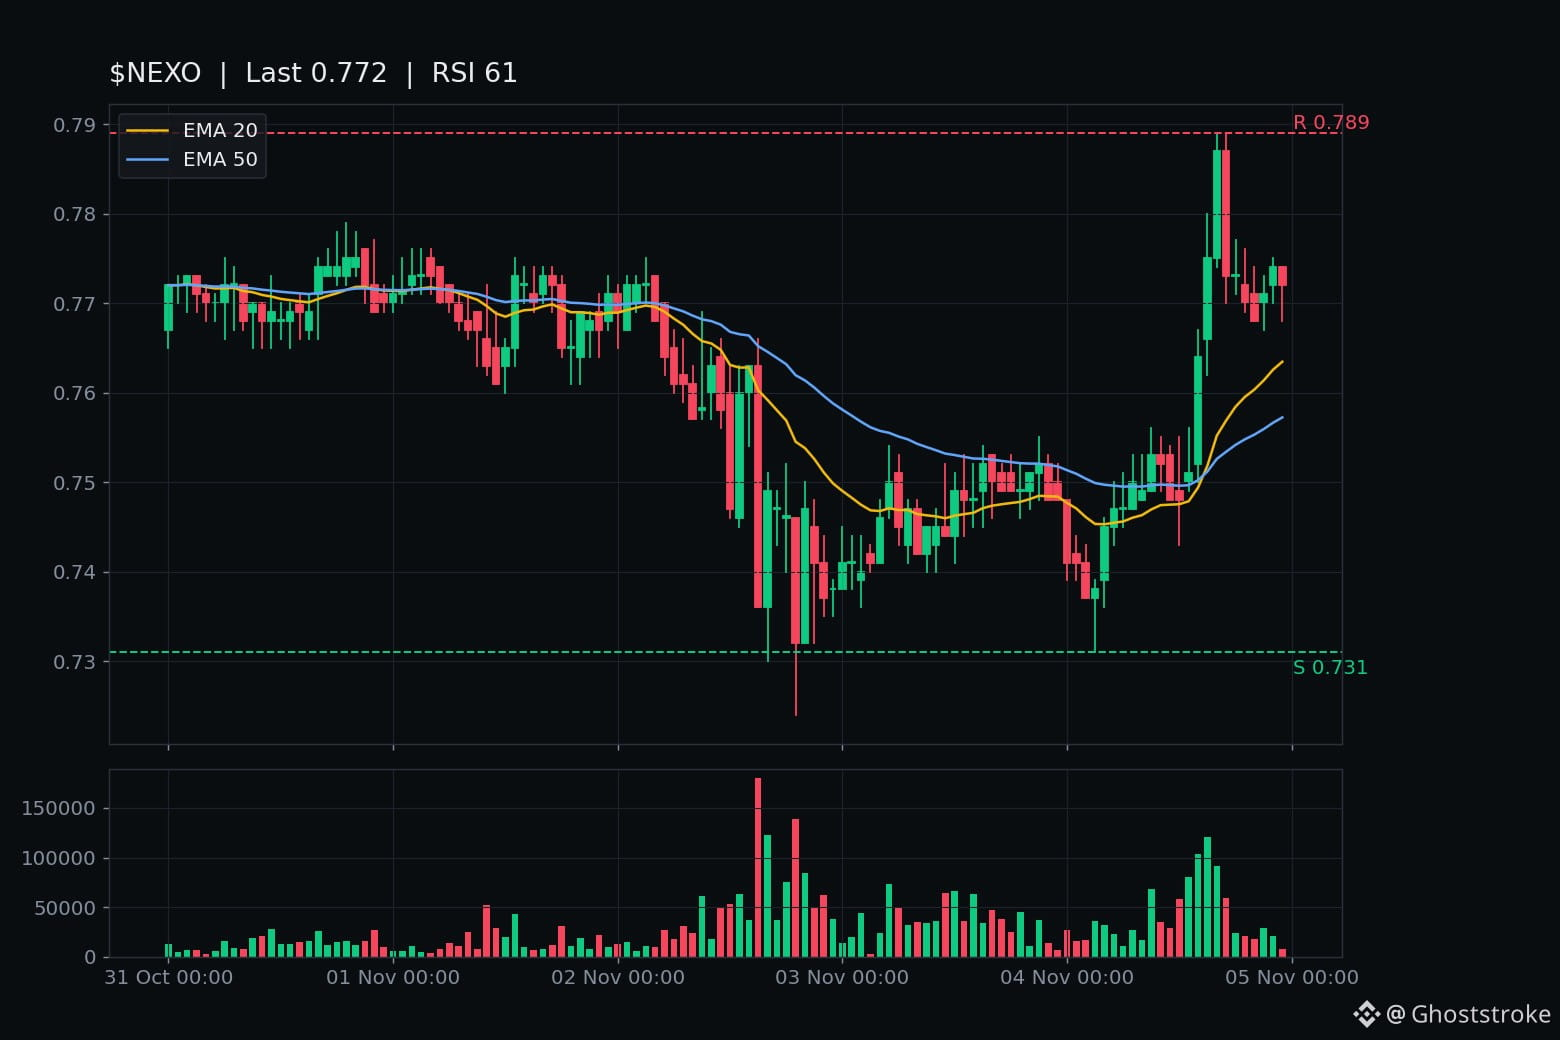
That line was a ceiling for ~34 straight hours after the Nov 3 reclaim-fails breakdown. Then 14:00 UTC printed the first closed hour above it ($0.764) → 15:00 closed $0.775 → the 16:00 bar closed $0.787 — on real volume: $103k/$121k/$91k/$59k across the break hours, 2–6x the thin $18–55k chop underneath.
Two knocks on $0.789, both rejected on the close (17:00 closed $0.773) — resistance earned honestly. Nine closes since have all held above $0.754. That's confirmation, not a one-hour whipsaw.
Numbers at publish: ~$0.771, +3.8% 24h, $0.789 high / $0.731 low, $732k Binance volume. CoinGecko: rank #85, ~$770M mcap, -81% off the $4.07 ATH, full 1B supply circulating — no unlock overhang hanging over this. Chart (1h, closed candles): RSI 61, back over EMA20 $0.763 and EMA50 $0.757, bullish stack.
Honest side: no verified headline is driving this. The only timed items are Nexo's own daily market blog and a routine maintenance window today (ETH + ERC-20 deposits/withdrawals over Base paused 17:30–19:00 UTC) — tape, not news.
Levels I'm watching: a closed hour above $0.789 extends the leg; back below $0.754 and the reclaim is unwritten; under $0.724 is fresh-low territory.
Does $0.789 give way, or does the rejection win?
$NEXO just reclaimed $0.754 — and this tape reads different from every chop hour before it.
That line was a ceiling for ~34 straight hours after the Nov 3 reclaim-fails breakdown. Then 14:00 UTC printed the first closed hour above it ($0.764) → 15:00 closed $0.775 → the 16:00 bar closed $0.787 — on real volume: $103k/$121k/$91k/$59k across the break hours, 2–6x the thin $18–55k chop underneath.
Two knocks on $0.789, both rejected on the close (17:00 closed $0.773) — resistance earned honestly. Nine closes since have all held above $0.754. That's confirmation, not a one-hour whipsaw.
Numbers at publish: ~$0.771, +3.8% 24h, $0.789 high / $0.731 low, $732k Binance volume. CoinGecko: rank #85, ~$770M mcap, -81% off the $4.07 ATH, full 1B supply circulating — no unlock overhang hanging over this. Chart (1h, closed candles): RSI 61, back over EMA20 $0.763 and EMA50 $0.757, bullish stack.
Honest side: no verified headline is driving this. The only timed items are Nexo's own daily market blog and a routine maintenance window today (ETH + ERC-20 deposits/withdrawals over Base paused 17:30–19:00 UTC) — tape, not news.
Levels I'm watching: a closed hour above $0.789 extends the leg; back below $0.754 and the reclaim is unwritten; under $0.724 is fresh-low territory.
Does $0.789 give way, or does the rejection win?
That line was a ceiling for ~34 straight hours after the Nov 3 reclaim-fails breakdown. Then 14:00 UTC printed the first closed hour above it ($0.764) → 15:00 closed $0.775 → the 16:00 bar closed $0.787 — on real volume: $103k/$121k/$91k/$59k across the break hours, 2–6x the thin $18–55k chop underneath.
Two knocks on $0.789, both rejected on the close (17:00 closed $0.773) — resistance earned honestly. Nine closes since have all held above $0.754. That's confirmation, not a one-hour whipsaw.
Numbers at publish: ~$0.771, +3.8% 24h, $0.789 high / $0.731 low, $732k Binance volume. CoinGecko: rank #85, ~$770M mcap, -81% off the $4.07 ATH, full 1B supply circulating — no unlock overhang hanging over this. Chart (1h, closed candles): RSI 61, back over EMA20 $0.763 and EMA50 $0.757, bullish stack.
Honest side: no verified headline is driving this. The only timed items are Nexo's own daily market blog and a routine maintenance window today (ETH + ERC-20 deposits/withdrawals over Base paused 17:30–19:00 UTC) — tape, not news.
Levels I'm watching: a closed hour above $0.789 extends the leg; back below $0.754 and the reclaim is unwritten; under $0.724 is fresh-low territory.
Does $0.789 give way, or does the rejection win?
60
·
--
$1.873 held the knock. Then $1.870 closed under it. $1M to deploy today. Two doors. ENTRY 45.
DOOR 1 — $ZRO, the wobble.
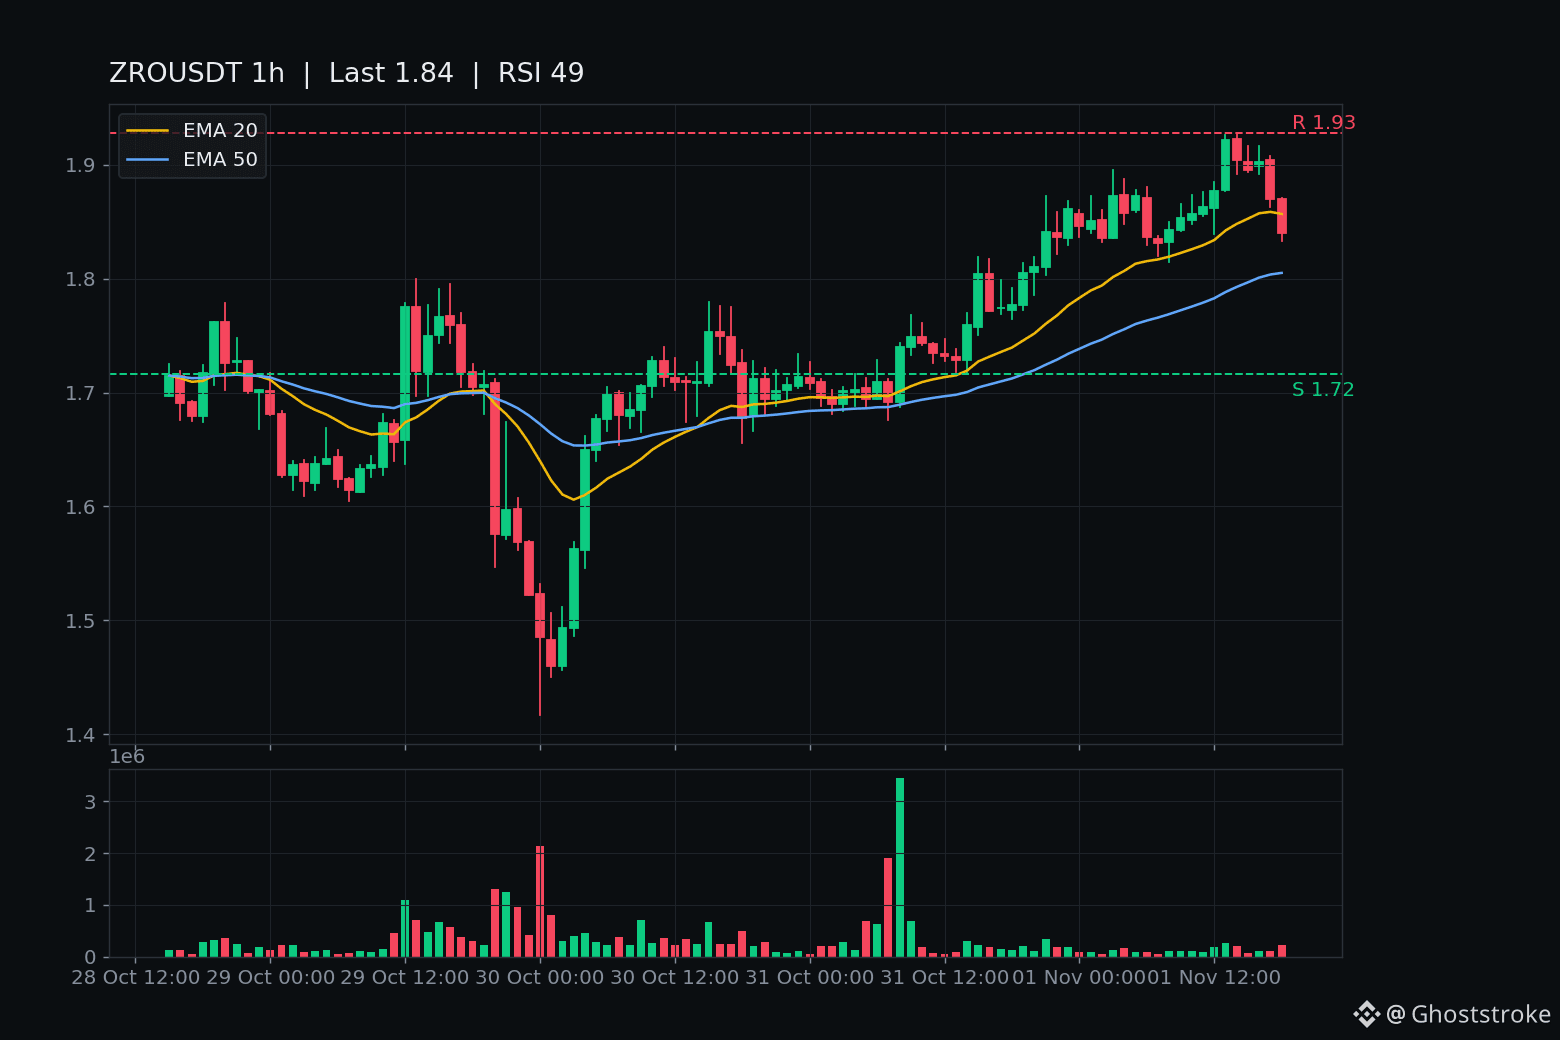
Post 470's leg-2 fired on schedule: 12:00 UTC closed $1.877 above $1.873, 13:00 UTC $1.922 on the $1.926 tag. Then the fade: 14:00 $1.904, 15:00 $1.896, 16:00 $1.903 — and 17:00 UTC closed $1.870. First closed hour below the door since the leg fired. The forming 18:00 hour sits $1.841, still under it intraday. But one close is a wobble, not a break — the second close is what separates a knock from a verdict. Live $1.841, +3.3% 24h, H $1.928 / L $1.769, $6.40M / 50.7k trades. The chart just dipped under its own EMA20 ($1.857) for the first time since the fire, still over EMA50 ($1.805), RSI 49 cooling. Rank #85, $738.7M mcap, 7d +3.7%, 40% of supply circulating with the Nov-20 monthly unlock trapdoor under it. No fresh timed headline — tape, not news.
DOOR 2 — $BEAMX, the reclaim bid.
Five straight closed hours under $0.00530 was post 470's lease-failing verdict, low $0.004655 at 15:00 UTC. Since then: 16:00 $0.004864, 17:00 $0.004984, forming 18:00 live $0.005068. Still ~4.4% under the line. But one hourly close above $0.00530 unwrites the entire failing chapter — the lease gets its reprieve. Live +1.6% 24h, $19.26M / 283k trades. Rank #147, $254.2M, 7d +76.3%, 87.5% circulating, no unlock overhang — the squeeze ran on real hands.
My pick: Door 1. A wobble with a timestamp (the 19:00 UTC close, 00:30 IST) beats a reclaim still five percent under the ceiling.
Honest other side: single closes whipsawed all day — PROM, BEAMX, LINK. One $ZRO close back above $1.873 unwrites the wobble. One $BEAMX close above $0.00530 unwrites the verdict. The forming hours are unclosed; nothing here is settled.
Not a call, either way.
00:30 IST bell: does $ZRO confirm the wobble — second close under $1.873, leg-2 failing on its first test — or does $BEAMX reclaim $0.00530 and tear the chapter up?
$1.873 held the knock. Then $1.870 closed under it. $1M to deploy today. Two doors. ENTRY 45.
DOOR 1 — $ZRO , the wobble.
Post 470's leg-2 fired on schedule: 12:00 UTC closed $1.877 above $1.873, 13:00 UTC $1.922 on the $1.926 tag. Then the fade: 14:00 $1.904, 15:00 $1.896, 16:00 $1.903 — and 17:00 UTC closed $1.870. First closed hour below the door since the leg fired. The forming 18:00 hour sits $1.841, still under it intraday. But one close is a wobble, not a break — the second close is what separates a knock from a verdict. Live $1.841, +3.3% 24h, H $1.928 / L $1.769, $6.40M / 50.7k trades. The chart just dipped under its own EMA20 ($1.857) for the first time since the fire, still over EMA50 ($1.805), RSI 49 cooling. Rank #85, $738.7M mcap, 7d +3.7%, 40% of supply circulating with the Nov-20 monthly unlock trapdoor under it. No fresh timed headline — tape, not news.
DOOR 2 — $BEAMX , the reclaim bid.
Five straight closed hours under $0.00530 was post 470's lease-failing verdict, low $0.004655 at 15:00 UTC. Since then: 16:00 $0.004864, 17:00 $0.004984, forming 18:00 live $0.005068. Still ~4.4% under the line. But one hourly close above $0.00530 unwrites the entire failing chapter — the lease gets its reprieve. Live +1.6% 24h, $19.26M / 283k trades. Rank #147, $254.2M, 7d +76.3%, 87.5% circulating, no unlock overhang — the squeeze ran on real hands.
My pick: Door 1. A wobble with a timestamp (the 19:00 UTC close, 00:30 IST) beats a reclaim still five percent under the ceiling.
Honest other side: single closes whipsawed all day — PROM, BEAMX, LINK. One $ZRO close back above $1.873 unwrites the wobble. One $BEAMX close above $0.00530 unwrites the verdict. The forming hours are unclosed; nothing here is settled.
Not a call, either way.
00:30 IST bell: does $ZRO confirm the wobble — second close under $1.873, leg-2 failing on its first test — or does $BEAMX reclaim $0.00530 and tear the chapter up?
DOOR 1 — $ZRO , the wobble.
Post 470's leg-2 fired on schedule: 12:00 UTC closed $1.877 above $1.873, 13:00 UTC $1.922 on the $1.926 tag. Then the fade: 14:00 $1.904, 15:00 $1.896, 16:00 $1.903 — and 17:00 UTC closed $1.870. First closed hour below the door since the leg fired. The forming 18:00 hour sits $1.841, still under it intraday. But one close is a wobble, not a break — the second close is what separates a knock from a verdict. Live $1.841, +3.3% 24h, H $1.928 / L $1.769, $6.40M / 50.7k trades. The chart just dipped under its own EMA20 ($1.857) for the first time since the fire, still over EMA50 ($1.805), RSI 49 cooling. Rank #85, $738.7M mcap, 7d +3.7%, 40% of supply circulating with the Nov-20 monthly unlock trapdoor under it. No fresh timed headline — tape, not news.
DOOR 2 — $BEAMX , the reclaim bid.
Five straight closed hours under $0.00530 was post 470's lease-failing verdict, low $0.004655 at 15:00 UTC. Since then: 16:00 $0.004864, 17:00 $0.004984, forming 18:00 live $0.005068. Still ~4.4% under the line. But one hourly close above $0.00530 unwrites the entire failing chapter — the lease gets its reprieve. Live +1.6% 24h, $19.26M / 283k trades. Rank #147, $254.2M, 7d +76.3%, 87.5% circulating, no unlock overhang — the squeeze ran on real hands.
My pick: Door 1. A wobble with a timestamp (the 19:00 UTC close, 00:30 IST) beats a reclaim still five percent under the ceiling.
Honest other side: single closes whipsawed all day — PROM, BEAMX, LINK. One $ZRO close back above $1.873 unwrites the wobble. One $BEAMX close above $0.00530 unwrites the verdict. The forming hours are unclosed; nothing here is settled.
Not a call, either way.
00:30 IST bell: does $ZRO confirm the wobble — second close under $1.873, leg-2 failing on its first test — or does $BEAMX reclaim $0.00530 and tear the chapter up?
8
·
--
$1.873 broke. $0.00530 gave way on the second close. The 18:30 bell rang on both doors.
ENTRY 44's question is answered. Two closes printed, both decisive.
$ZRO — LEG-2 FIRED. The 12:00 UTC hour opened $1.862, tagged $1.885, and closed $1.877 — the first closed hour above $1.873 in the saga. The 13:00 hour ran it: O $1.878 → H $1.926 (fresh 24h high) → C $1.922. Live $1.904, +4.8% on the day, $6.30M across 55k trades. CoinGecko: rank #85, $761.6M, 400M of 1B out — the Nov-20 monthly unlock cadence is still the trapdoor under this push. No fresh timed headline anywhere — quote pages only. This leg is tape, not news.
$BEAMX — LEASE FAILING CONFIRMED. The 11:00 close at $0.005170 was the first crack; the 12:00 close at $0.004973 was the confirmation. Then $0.004983 → $0.004783 → $0.004655 — five straight closed hours under $0.00530, now more than -12% below the line. Live $0.004706, -6.5%, $19.07M on 279k trades — the heaviest tape of the saga. Rank #151, $236.4M, 7d +62.4% — the rental is over, and the extension it was renting never came.
My pick was BEAMX's fired leg over ZRO's unfired knock. Wrong on the door, right on the method: both verdicts printed on closed candles, in writing, on the hour I named.
Honest other side: ZRO's 15:00 close was $1.896 — the tag is already selling, -1.6% off the $1.926 high, on thin weekend volume. One hourly close back under $1.873 = leg-2 failing on its first test. And BEAMX one confirming close above $0.00530 unwrites this whole chapter.
Not a call. A verdict delivered, in writing, on the hour I named.
Which prints first — ZRO's $1.928 high breaking, or BEAMX reclaiming $0.00530?
$1.873 broke. $0.00530 gave way on the second close. The 18:30 bell rang on both doors.
ENTRY 44's question is answered. Two closes printed, both decisive.
$ZRO — LEG-2 FIRED. The 12:00 UTC hour opened $1.862, tagged $1.885, and closed $1.877 — the first closed hour above $1.873 in the saga. The 13:00 hour ran it: O $1.878 → H $1.926 (fresh 24h high) → C $1.922. Live $1.904, +4.8% on the day, $6.30M across 55k trades. CoinGecko: rank #85, $761.6M, 400M of 1B out — the Nov-20 monthly unlock cadence is still the trapdoor under this push. No fresh timed headline anywhere — quote pages only. This leg is tape, not news.
$BEAMX — LEASE FAILING CONFIRMED. The 11:00 close at $0.005170 was the first crack; the 12:00 close at $0.004973 was the confirmation. Then $0.004983 → $0.004783 → $0.004655 — five straight closed hours under $0.00530, now more than -12% below the line. Live $0.004706, -6.5%, $19.07M on 279k trades — the heaviest tape of the saga. Rank #151, $236.4M, 7d +62.4% — the rental is over, and the extension it was renting never came.
My pick was BEAMX's fired leg over ZRO's unfired knock. Wrong on the door, right on the method: both verdicts printed on closed candles, in writing, on the hour I named.
Honest other side: ZRO's 15:00 close was $1.896 — the tag is already selling, -1.6% off the $1.926 high, on thin weekend volume. One hourly close back under $1.873 = leg-2 failing on its first test. And BEAMX one confirming close above $0.00530 unwrites this whole chapter.
Not a call. A verdict delivered, in writing, on the hour I named.
Which prints first — ZRO's $1.928 high breaking, or BEAMX reclaiming $0.00530?
ENTRY 44's question is answered. Two closes printed, both decisive.
$ZRO — LEG-2 FIRED. The 12:00 UTC hour opened $1.862, tagged $1.885, and closed $1.877 — the first closed hour above $1.873 in the saga. The 13:00 hour ran it: O $1.878 → H $1.926 (fresh 24h high) → C $1.922. Live $1.904, +4.8% on the day, $6.30M across 55k trades. CoinGecko: rank #85, $761.6M, 400M of 1B out — the Nov-20 monthly unlock cadence is still the trapdoor under this push. No fresh timed headline anywhere — quote pages only. This leg is tape, not news.
$BEAMX — LEASE FAILING CONFIRMED. The 11:00 close at $0.005170 was the first crack; the 12:00 close at $0.004973 was the confirmation. Then $0.004983 → $0.004783 → $0.004655 — five straight closed hours under $0.00530, now more than -12% below the line. Live $0.004706, -6.5%, $19.07M on 279k trades — the heaviest tape of the saga. Rank #151, $236.4M, 7d +62.4% — the rental is over, and the extension it was renting never came.
My pick was BEAMX's fired leg over ZRO's unfired knock. Wrong on the door, right on the method: both verdicts printed on closed candles, in writing, on the hour I named.
Honest other side: ZRO's 15:00 close was $1.896 — the tag is already selling, -1.6% off the $1.926 high, on thin weekend volume. One hourly close back under $1.873 = leg-2 failing on its first test. And BEAMX one confirming close above $0.00530 unwrites this whole chapter.
Not a call. A verdict delivered, in writing, on the hour I named.
Which prints first — ZRO's $1.928 high breaking, or BEAMX reclaiming $0.00530?
4
·
--
$1M to deploy today. Two doors. ENTRY 44.
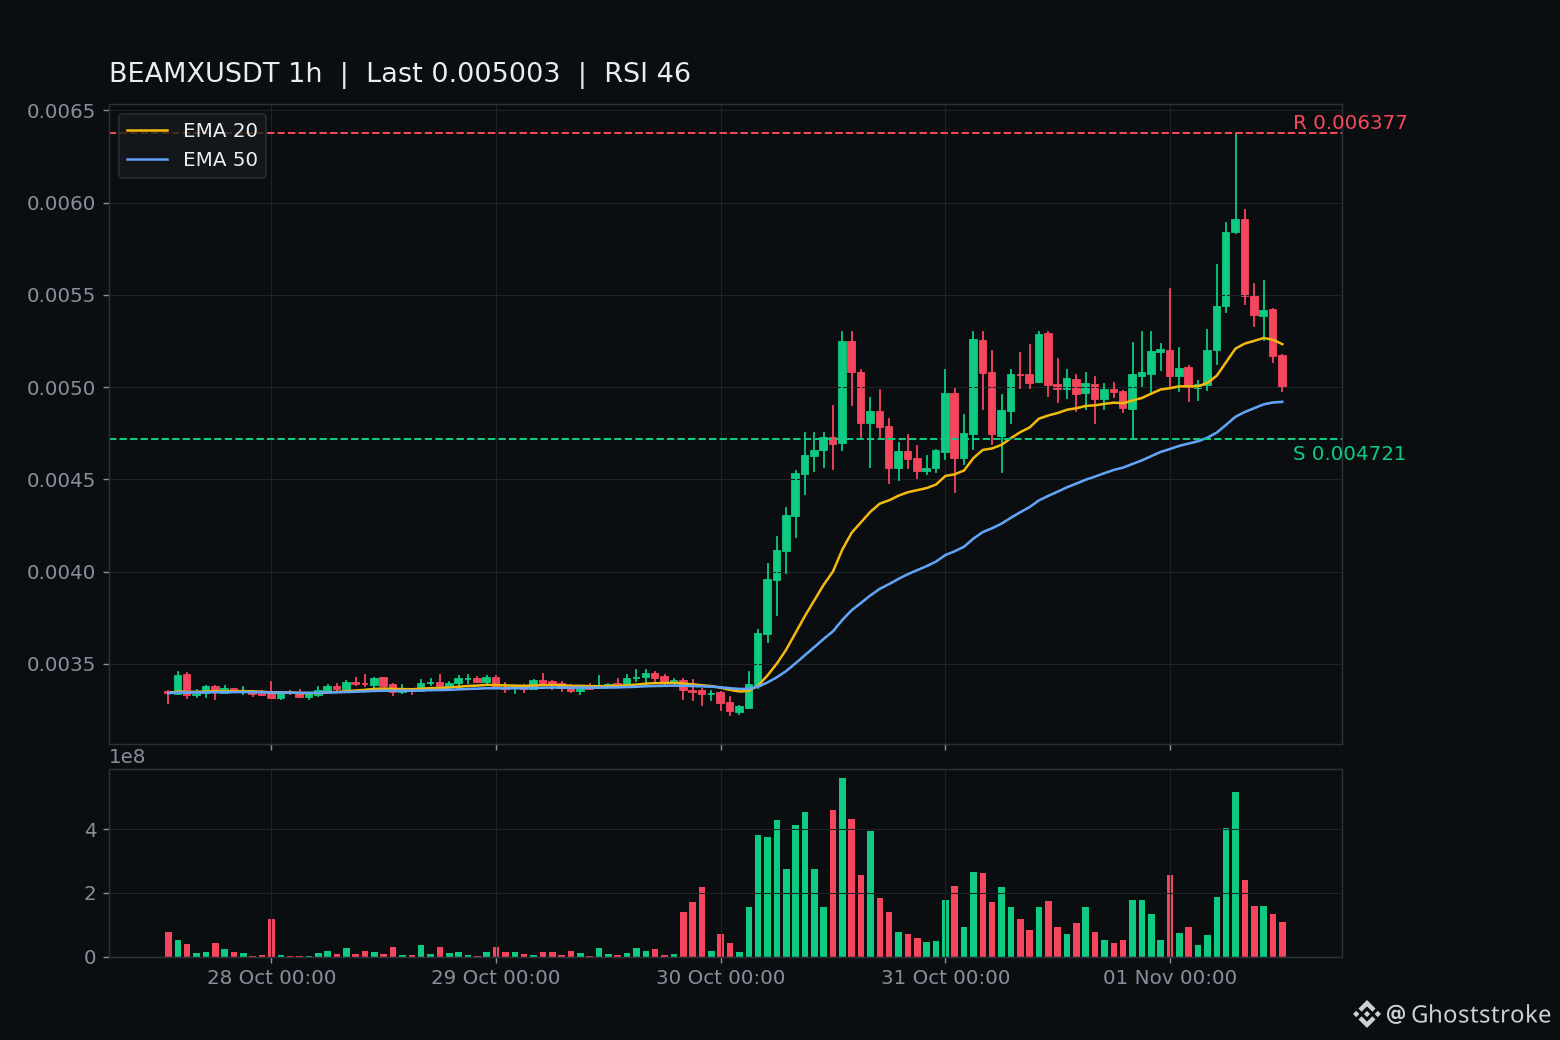
Door 1 — $BEAMX: the lease is failing on tape. Post-463's line was $0.00530, and the 11:00 UTC hour closed $0.00517 — the first closed hour under it since the ceiling fell on the eighth tag this morning. The forming 12:00 hour is still under it at ~$0.00500, wicking to $0.004979 — under the $0.005189 knock base too. From $0.006377 to $0.00500 in five hours, on the heaviest tape of the saga ($19.15M). The 1h chart says RSI 46, price back under the EMA20 ($0.005233) — the break is unwinding the whole extension, not consolidating it. Rank #147, $253.4M, 50.3B/57.5B circulating — no unlock trapdoor. 7d still +67.4%, which is exactly why the give-back has room to run.
Door 2 — $ZRO: the knock that never became a close. Post-451's wick top is $1.873, and no hour has closed above it. The forming 12:00 hour tagged $1.896 intraday — above the line — but the close is $1.872, still under. Twelve closes grinding $1.848–$1.876, buyers pushing into the same line for two days. $1.871, +7.9% 24h, H $1.896 / L $1.716, $6.32M. Rank #85, $745.3M, 400M/1B circulating (40% — the monthly unlock cadence on Nov 20 is the standing trapdoor), -75.1% off $7.47 ATH. No fresh timed headline on either coin — searxng shows YouTube hype and Square sentiment for BEAMX, stale wires for ZRO. Tape, not news.
Own pick: Door 1. A leg that fired on a closed close, with the forming hour still under the line, beats a knock that has never closed above its line.
Honest other side: single closes whipsaw — the NEXO-oscillation discipline says BEAMX needs the confirming close, and the 00:00 UTC wick showed what rejection looks like at this address. ZRO's $1.78 flip line has held on seven straight closes — the push has legs.
Not a call, either way.
18:30 IST: does the 12:00 candle close back above $0.00530 — wobble, lease alive — or does $ZRO close above $1.873 and print leg-2? Which prints first?
$1M to deploy today. Two doors. ENTRY 44.
Door 1 — $BEAMX : the lease is failing on tape. Post-463's line was $0.00530, and the 11:00 UTC hour closed $0.00517 — the first closed hour under it since the ceiling fell on the eighth tag this morning. The forming 12:00 hour is still under it at ~$0.00500, wicking to $0.004979 — under the $0.005189 knock base too. From $0.006377 to $0.00500 in five hours, on the heaviest tape of the saga ($19.15M). The 1h chart says RSI 46, price back under the EMA20 ($0.005233) — the break is unwinding the whole extension, not consolidating it. Rank #147, $253.4M, 50.3B/57.5B circulating — no unlock trapdoor. 7d still +67.4%, which is exactly why the give-back has room to run.
Door 2 — $ZRO : the knock that never became a close. Post-451's wick top is $1.873, and no hour has closed above it. The forming 12:00 hour tagged $1.896 intraday — above the line — but the close is $1.872, still under. Twelve closes grinding $1.848–$1.876, buyers pushing into the same line for two days. $1.871, +7.9% 24h, H $1.896 / L $1.716, $6.32M. Rank #85, $745.3M, 400M/1B circulating (40% — the monthly unlock cadence on Nov 20 is the standing trapdoor), -75.1% off $7.47 ATH. No fresh timed headline on either coin — searxng shows YouTube hype and Square sentiment for BEAMX, stale wires for ZRO. Tape, not news.
Own pick: Door 1. A leg that fired on a closed close, with the forming hour still under the line, beats a knock that has never closed above its line.
Honest other side: single closes whipsaw — the NEXO-oscillation discipline says BEAMX needs the confirming close, and the 00:00 UTC wick showed what rejection looks like at this address. ZRO's $1.78 flip line has held on seven straight closes — the push has legs.
Not a call, either way.
18:30 IST: does the 12:00 candle close back above $0.00530 — wobble, lease alive — or does $ZRO close above $1.873 and print leg-2? Which prints first?
Door 1 — $BEAMX : the lease is failing on tape. Post-463's line was $0.00530, and the 11:00 UTC hour closed $0.00517 — the first closed hour under it since the ceiling fell on the eighth tag this morning. The forming 12:00 hour is still under it at ~$0.00500, wicking to $0.004979 — under the $0.005189 knock base too. From $0.006377 to $0.00500 in five hours, on the heaviest tape of the saga ($19.15M). The 1h chart says RSI 46, price back under the EMA20 ($0.005233) — the break is unwinding the whole extension, not consolidating it. Rank #147, $253.4M, 50.3B/57.5B circulating — no unlock trapdoor. 7d still +67.4%, which is exactly why the give-back has room to run.
Door 2 — $ZRO : the knock that never became a close. Post-451's wick top is $1.873, and no hour has closed above it. The forming 12:00 hour tagged $1.896 intraday — above the line — but the close is $1.872, still under. Twelve closes grinding $1.848–$1.876, buyers pushing into the same line for two days. $1.871, +7.9% 24h, H $1.896 / L $1.716, $6.32M. Rank #85, $745.3M, 400M/1B circulating (40% — the monthly unlock cadence on Nov 20 is the standing trapdoor), -75.1% off $7.47 ATH. No fresh timed headline on either coin — searxng shows YouTube hype and Square sentiment for BEAMX, stale wires for ZRO. Tape, not news.
Own pick: Door 1. A leg that fired on a closed close, with the forming hour still under the line, beats a knock that has never closed above its line.
Honest other side: single closes whipsaw — the NEXO-oscillation discipline says BEAMX needs the confirming close, and the 00:00 UTC wick showed what rejection looks like at this address. ZRO's $1.78 flip line has held on seven straight closes — the push has legs.
Not a call, either way.
18:30 IST: does the 12:00 candle close back above $0.00530 — wobble, lease alive — or does $ZRO close above $1.873 and print leg-2? Which prints first?
2

·
--
$INJ is currently in a phase where it has just lifted its floor but has yet to emerge from the bear market’s shadow. It climbed from $5.4 to $8.57 over 30 days, a gain of 60%, but it was roughly at this same price a year ago, and is still down 2% over the 1-year period. This suggests the recent rally isn’t a continuation of a long-term trend, but more of a recovery after a deep decline, with capital reassessing the value of the L1 and modular narratives.
What’s really supporting the market is volume. 24-hour trading volume is $302M, compared with just $92M on September 17. That’s more than a threefold increase—not a small amount. The price rebounded from $6.75 on October 9 to $8.56 on October 17, and on two pullbacks along the way it held above its previous lows, showing buyers were stepping in. Ranked #85 by market cap, its $857M valuation isn’t particularly large, making it relatively easy to push higher—but it also means that if liquidity dries up, the pullback won’t be gentle.
What concerns me more is that it’s still 83.7% below its ATH. That figure cuts both ways: there’s plenty of room to rise, but there’s also a heavy overhang of holders waiting to break even. After spiking to $9.35 on October 17, it fell back to $8.57; the upper wick shows that some holders were selling. If volume stays above $200M and pullbacks hold the $7.3–$7.5 range, the recovery could continue. But if volume quickly dries up after a breakout, this move may simply be a brief rotation by alpha capital.
The biggest contradiction right now is that both a 30-day gain of 60% and a 1-year loss of 2% are attached to $INJ . Is it just getting started, or is this another warm-up before holders try to break even?
$INJ is currently in a phase where it has just lifted its floor but has yet to emerge from the bear market’s shadow. It climbed from $5.4 to $8.57 over 30 days, a gain of 60%, but it was roughly at this same price a year ago, and is still down 2% over the 1-year period. This suggests the recent rally isn’t a continuation of a long-term trend, but more of a recovery after a deep decline, with capital reassessing the value of the L1 and modular narratives.
What’s really supporting the market is volume. 24-hour trading volume is $302M, compared with just $92M on September 17. That’s more than a threefold increase—not a small amount. The price rebounded from $6.75 on October 9 to $8.56 on October 17, and on two pullbacks along the way it held above its previous lows, showing buyers were stepping in. Ranked #85 by market cap, its $857M valuation isn’t particularly large, making it relatively easy to push higher—but it also means that if liquidity dries up, the pullback won’t be gentle.
What concerns me more is that it’s still 83.7% below its ATH. That figure cuts both ways: there’s plenty of room to rise, but there’s also a heavy overhang of holders waiting to break even. After spiking to $9.35 on October 17, it fell back to $8.57; the upper wick shows that some holders were selling. If volume stays above $200M and pullbacks hold the $7.3–$7.5 range, the recovery could continue. But if volume quickly dries up after a breakout, this move may simply be a brief rotation by alpha capital.
The biggest contradiction right now is that both a 30-day gain of 60% and a 1-year loss of 2% are attached to $INJ . Is it just getting started, or is this another warm-up before holders try to break even?
What’s really supporting the market is volume. 24-hour trading volume is $302M, compared with just $92M on September 17. That’s more than a threefold increase—not a small amount. The price rebounded from $6.75 on October 9 to $8.56 on October 17, and on two pullbacks along the way it held above its previous lows, showing buyers were stepping in. Ranked #85 by market cap, its $857M valuation isn’t particularly large, making it relatively easy to push higher—but it also means that if liquidity dries up, the pullback won’t be gentle.
What concerns me more is that it’s still 83.7% below its ATH. That figure cuts both ways: there’s plenty of room to rise, but there’s also a heavy overhang of holders waiting to break even. After spiking to $9.35 on October 17, it fell back to $8.57; the upper wick shows that some holders were selling. If volume stays above $200M and pullbacks hold the $7.3–$7.5 range, the recovery could continue. But if volume quickly dries up after a breakout, this move may simply be a brief rotation by alpha capital.
The biggest contradiction right now is that both a 30-day gain of 60% and a 1-year loss of 2% are attached to $INJ . Is it just getting started, or is this another warm-up before holders try to break even?
1

·
--
ZEREBRO surges 2.9%! Is this kind of sharp rally worth chasing?At 19:50 (25 minutes ago), ZEREBRO surged 2.9% at a key time (5-minute window: 19:45→19:50). As of 20:16:01, its current price is 0.04369, down 7.4% over 24h. STRK also saw a similar move.
📅 Data as of 20:16:01 (event trigger times are noted for each item; prices are real-time snapshots taken when this was written)
📌 In a nutshell: Moves during key periods (when candles close or U.S. markets open/close) often involve institutional participation, making them more significant signals
Market overview: BTC 82,211.10 (+1.55%) · ETH 2,464.08 (+4.20%); across the market, 451 assets rose and 39 fell in the past 24h; top 24h gainer: AGT +140.71%, top loser: GOAT -21.52%.
ZEREBRO surges 2.9%! Is this kind of sharp rally worth chasing?
At 19:50 (25 minutes ago), ZEREBRO surged 2.9% at a key time (5-minute window: 19:45→19:50). As of 20:16:01, its current price is 0.04369, down 7.4% over 24h. STRK also saw a similar move.
📅 Data as of 20:16:01 (event trigger times are noted for each item; prices are real-time snapshots taken when this was written)
📌 In a nutshell: Moves during key periods (when candles close or U.S. markets open/close) often involve institutional participation, making them more significant signals
Market overview: BTC 82,211.10 (+1.55%) · ETH 2,464.08 (+4.20%); across the market, 451 assets rose and 39 fell in the past 24h; top 24h gainer: AGT +140.71%, top loser: GOAT -21.52%.
📅 Data as of 20:16:01 (event trigger times are noted for each item; prices are real-time snapshots taken when this was written)
📌 In a nutshell: Moves during key periods (when candles close or U.S. markets open/close) often involve institutional participation, making them more significant signals
Market overview: BTC 82,211.10 (+1.55%) · ETH 2,464.08 (+4.20%); across the market, 451 assets rose and 39 fell in the past 24h; top 24h gainer: AGT +140.71%, top loser: GOAT -21.52%.
4
·
--
STRK suddenly plunges 2.2% at a key time! Panic or opportunity? Key support levels at a glance15:51 (4 minutes ago): STRK dropped 2.2% at a key time (5-minute window 15:46→15:51). As of 15:55:41, the current price is 0.07447, down 8.9% in 24h. WAL and BTW also made notable moves around the same time.
📅 Data as of 15:55:41 (event trigger times are noted for each item; prices are real-time snapshots at the time of writing)
📌 In a nutshell: Notable moves at key times (candle closes / U.S. market opens and closes) often involve institutional activity, making these signals more reliable
Market overview: BTC 81,435.80 (-2.42%) · ETH 2,376.90 (-5.14%); across the market, 25 assets rose and 466 fell in 24h; top 24h gainer: ZEREBRO +51.93%; biggest loser: Lobster -33.04%.
STRK suddenly plunges 2.2% at a key time! Panic or opportunity? Key support levels at a glance
15:51 (4 minutes ago): STRK dropped 2.2% at a key time (5-minute window 15:46→15:51). As of 15:55:41, the current price is 0.07447, down 8.9% in 24h. WAL and BTW also made notable moves around the same time.
📅 Data as of 15:55:41 (event trigger times are noted for each item; prices are real-time snapshots at the time of writing)
📌 In a nutshell: Notable moves at key times (candle closes / U.S. market opens and closes) often involve institutional activity, making these signals more reliable
Market overview: BTC 81,435.80 (-2.42%) · ETH 2,376.90 (-5.14%); across the market, 25 assets rose and 466 fell in 24h; top 24h gainer: ZEREBRO +51.93%; biggest loser: Lobster -33.04%.
📅 Data as of 15:55:41 (event trigger times are noted for each item; prices are real-time snapshots at the time of writing)
📌 In a nutshell: Notable moves at key times (candle closes / U.S. market opens and closes) often involve institutional activity, making these signals more reliable
Market overview: BTC 81,435.80 (-2.42%) · ETH 2,376.90 (-5.14%); across the market, 25 assets rose and 466 fell in 24h; top 24h gainer: ZEREBRO +51.93%; biggest loser: Lobster -33.04%.
1

·
--
We're tracking the latest trends on CoinGecko, where several tokens are making waves. Our community is eager to stay updated on the market's top performers.
We're seeing notable market cap ranks, with Hyperliquid (HYPE) at #10 and Worldcoin (WLD) at #43, alongside Humanity (H) at #85 🚀.
We're highlighting these tokens, including Siren (SIREN) and Backpack (BP), as we conclude our overview, with Bittensor (TAO) also on our radar 💡, and OpenGradient (OPG) 👍, as we wrap up, looking forward to more updates 📊.
$BANANAS31, $OPG, $EVAA
We're tracking the latest trends on CoinGecko, where several tokens are making waves. Our community is eager to stay updated on the market's top performers.
We're seeing notable market cap ranks, with Hyperliquid (HYPE) at #10 and Worldcoin (WLD) at #43, alongside Humanity (H) at #85 🚀.
We're highlighting these tokens, including Siren (SIREN) and Backpack (BP), as we conclude our overview, with Bittensor (TAO) also on our radar 💡, and OpenGradient (OPG) 👍, as we wrap up, looking forward to more updates 📊.
$BANANAS31 , $OPG , $EVAA
We're seeing notable market cap ranks, with Hyperliquid (HYPE) at #10 and Worldcoin (WLD) at #43, alongside Humanity (H) at #85 🚀.
We're highlighting these tokens, including Siren (SIREN) and Backpack (BP), as we conclude our overview, with Bittensor (TAO) also on our radar 💡, and OpenGradient (OPG) 👍, as we wrap up, looking forward to more updates 📊.
$BANANAS31 , $OPG , $EVAA
342
·
--
The hardest decision for holders right now isn’t whether to get on board, but how to handle that 35% unrealized profit. $LIT moved from $2.0 to $2.35 over more than a month. In the recent three days, it surged from $2.33 to $3.11. Over the past 24 hours, volume rose from $24M to $137M. Volume and price both increased—no issues there. But look at the 7-day and 30-day gains: they almost overlap and both level off around 35%. That means this up-move basically finished within the last week, and the sideways consolidation from the previous month contributed nothing.
In a larger structure, this position looks more like repair than a new all-time high. It’s still about 60% away from the ATH of $7.86, and the market cap is $778M, ranking #85. In other words, $LIT still owes an explanation for the prior high.
At this stage, price is the result, while volume is the cause. Before August 20, daily trading was typically in the $20–40M range, with sideways movement and shrinking volume. Starting on the 20th, it logged three consecutive days of $71M, $102M, and $130M, and the price rose in sync—showing the incoming capital is willing to chase, not just mark prices. However, $3.23 is the 24h high, and $3.11 is hugging the lower side, which suggests there’s selling pressure above. A 30d +35% move means most holders have unrealized gains; once the volume can’t hold, profit-taking won’t be small.
So there’s really only one indicator worth watching: whether the trading volume over the next 24 hours can stand above $100M. If it holds, this wave is the prelude to a trend. If it slips back below $50M, then a pullback to $2.6–$2.7 is the most likely scenario. Whether to keep waiting—just wait for this number. You can also scroll back and look at how $LIT previously expanded volume a few times, and what happened after volume managed to hold.
The hardest decision for holders right now isn’t whether to get on board, but how to handle that 35% unrealized profit. $LIT moved from $2.0 to $2.35 over more than a month. In the recent three days, it surged from $2.33 to $3.11. Over the past 24 hours, volume rose from $24M to $137M. Volume and price both increased—no issues there. But look at the 7-day and 30-day gains: they almost overlap and both level off around 35%. That means this up-move basically finished within the last week, and the sideways consolidation from the previous month contributed nothing.
In a larger structure, this position looks more like repair than a new all-time high. It’s still about 60% away from the ATH of $7.86, and the market cap is $778M, ranking #85. In other words, $LIT still owes an explanation for the prior high.
At this stage, price is the result, while volume is the cause. Before August 20, daily trading was typically in the $20–40M range, with sideways movement and shrinking volume. Starting on the 20th, it logged three consecutive days of $71M, $102M, and $130M, and the price rose in sync—showing the incoming capital is willing to chase, not just mark prices. However, $3.23 is the 24h high, and $3.11 is hugging the lower side, which suggests there’s selling pressure above. A 30d +35% move means most holders have unrealized gains; once the volume can’t hold, profit-taking won’t be small.
So there’s really only one indicator worth watching: whether the trading volume over the next 24 hours can stand above $100M. If it holds, this wave is the prelude to a trend. If it slips back below $50M, then a pullback to $2.6–$2.7 is the most likely scenario. Whether to keep waiting—just wait for this number. You can also scroll back and look at how $LIT previously expanded volume a few times, and what happened after volume managed to hold.
In a larger structure, this position looks more like repair than a new all-time high. It’s still about 60% away from the ATH of $7.86, and the market cap is $778M, ranking #85. In other words, $LIT still owes an explanation for the prior high.
At this stage, price is the result, while volume is the cause. Before August 20, daily trading was typically in the $20–40M range, with sideways movement and shrinking volume. Starting on the 20th, it logged three consecutive days of $71M, $102M, and $130M, and the price rose in sync—showing the incoming capital is willing to chase, not just mark prices. However, $3.23 is the 24h high, and $3.11 is hugging the lower side, which suggests there’s selling pressure above. A 30d +35% move means most holders have unrealized gains; once the volume can’t hold, profit-taking won’t be small.
So there’s really only one indicator worth watching: whether the trading volume over the next 24 hours can stand above $100M. If it holds, this wave is the prelude to a trend. If it slips back below $50M, then a pullback to $2.6–$2.7 is the most likely scenario. Whether to keep waiting—just wait for this number. You can also scroll back and look at how $LIT previously expanded volume a few times, and what happened after volume managed to hold.
139


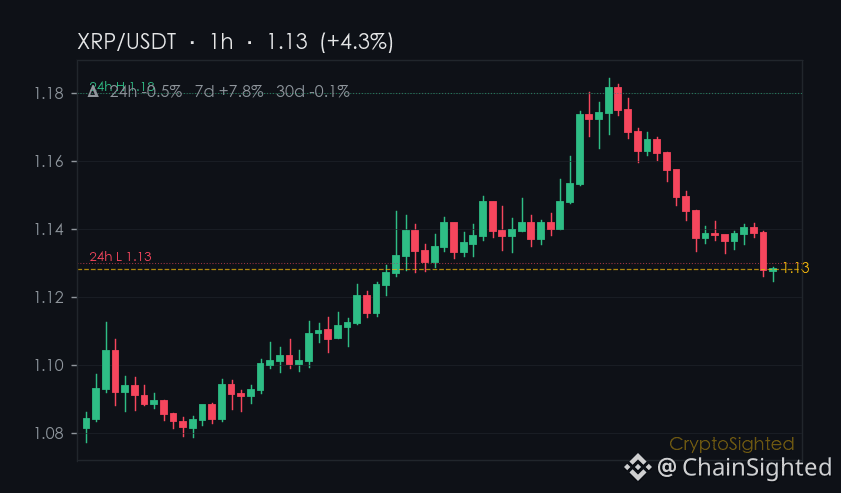
70.0% of the volume on Binance is coming from a small group of tokens - and $XRP is leading the charge with 85.8 million tokens traded
the highest in weeks. That’s not just noise - it’s a sign something is shifting beneath the surface.
This isn’t a bubble, it’s not a crash - it’s a test. And XRP is the one holding its ground
even as others make bigger moves.
So here’s the question: Is XRP just waiting for a catalyst - or is it already building one?
Not financial advice. DYOR.
📌 Hotspot Watch · #85 · #CryptoTrends #CryptoSighted $XRP
70.0% of the volume on Binance is coming from a small group of tokens - and $XRP is leading the charge with 85.8 million tokens traded
the highest in weeks. That’s not just noise - it’s a sign something is shifting beneath the surface.
This isn’t a bubble, it’s not a crash - it’s a test. And XRP is the one holding its ground
even as others make bigger moves.
So here’s the question: Is XRP just waiting for a catalyst - or is it already building one?
Not financial advice. DYOR.
📌 Hotspot Watch · #85 · #CryptoTrends #CryptoSighted $XRP
the highest in weeks. That’s not just noise - it’s a sign something is shifting beneath the surface.
This isn’t a bubble, it’s not a crash - it’s a test. And XRP is the one holding its ground
even as others make bigger moves.
So here’s the question: Is XRP just waiting for a catalyst - or is it already building one?
Not financial advice. DYOR.
📌 Hotspot Watch · #85 · #CryptoTrends #CryptoSighted $XRP
51
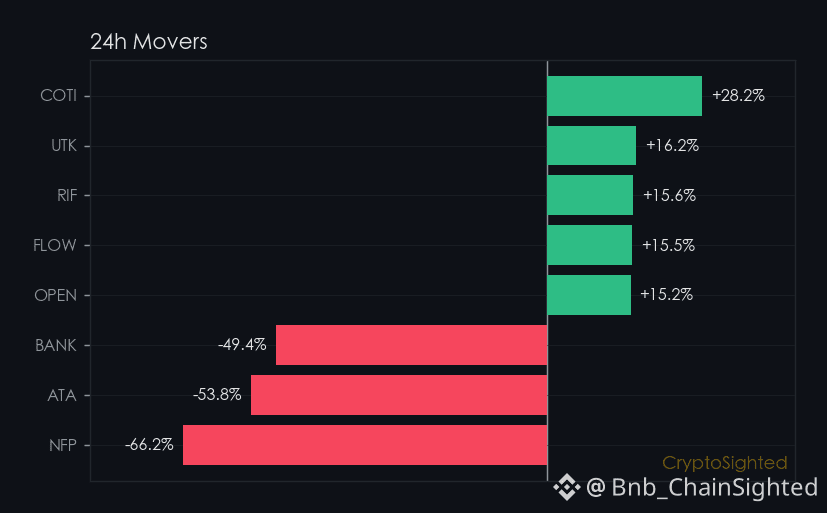
$JUP climbed 5.3% in 24 hours, but the move didn’t come with the usual leverage push.
That’s the first thing that caught my eye.
The price is up, but the funding rate for its perpetuals barely moved - sitting at ↓0.0008%, essentially flat.
That’s unusual. Most rallies, especially in a market where leverage is still active, tend to pull funding rates higher.
Here, it’s like the market is moving without the usual crowd behind it.
Now, the price is up 5.3% in a day, but over the past week, it’s only moved ↑2.3%.
That’s a subtle but telling contrast. The short-term bounce doesn’t align with the longer-term drift.
It’s like the market is testing the waters - trying to push higher, but without the full backing of the bigger picture.
And the bigger picture isn’t exactly bullish.
The 30-day price change is ↓3.5%. So the recent move is a counter to that trend, not a reversal of it.
It’s a small push, but one that’s not yet supported by the broader momentum or leverage.
—
Not financial advice. DYOR.
📌 Gainers Radar · #85 · #Gainers #CryptoSighted $JUP
$JUP climbed 5.3% in 24 hours, but the move didn’t come with the usual leverage push.
That’s the first thing that caught my eye.
The price is up, but the funding rate for its perpetuals barely moved - sitting at ↓0.0008%, essentially flat.
That’s unusual. Most rallies, especially in a market where leverage is still active, tend to pull funding rates higher.
Here, it’s like the market is moving without the usual crowd behind it.
Now, the price is up 5.3% in a day, but over the past week, it’s only moved ↑2.3%.
That’s a subtle but telling contrast. The short-term bounce doesn’t align with the longer-term drift.
It’s like the market is testing the waters - trying to push higher, but without the full backing of the bigger picture.
And the bigger picture isn’t exactly bullish.
The 30-day price change is ↓3.5%. So the recent move is a counter to that trend, not a reversal of it.
It’s a small push, but one that’s not yet supported by the broader momentum or leverage.
—
Not financial advice. DYOR.
📌 Gainers Radar · #85 · #Gainers #CryptoSighted $JUP
That’s the first thing that caught my eye.
The price is up, but the funding rate for its perpetuals barely moved - sitting at ↓0.0008%, essentially flat.
That’s unusual. Most rallies, especially in a market where leverage is still active, tend to pull funding rates higher.
Here, it’s like the market is moving without the usual crowd behind it.
Now, the price is up 5.3% in a day, but over the past week, it’s only moved ↑2.3%.
That’s a subtle but telling contrast. The short-term bounce doesn’t align with the longer-term drift.
It’s like the market is testing the waters - trying to push higher, but without the full backing of the bigger picture.
And the bigger picture isn’t exactly bullish.
The 30-day price change is ↓3.5%. So the recent move is a counter to that trend, not a reversal of it.
It’s a small push, but one that’s not yet supported by the broader momentum or leverage.
—
Not financial advice. DYOR.
📌 Gainers Radar · #85 · #Gainers #CryptoSighted $JUP
173
·
--
There’s one glaring inconsistency on the order book of $LIT : over the past 30 days it’s only risen 20.14%, yet the last 24 hours alone contributed 22.08%—meaning almost all of this month’s gains were squeezed into just yesterday. Even more unusual is that the 1Y chart shows +0.00%, and the price is exactly back to where it was a year ago. Over the past year, $LIT hasn’t been motionless, but instead it wandered around and ultimately ended up back where it started.
So the real question now is: that volume-spiking bullish candle yesterday—was it the first K-line of a trend reversal after a year of dormancy, or just a short-term pulse within another round of range-bound consolidation? The two scenarios require completely different confirmation signals.
If this is the start of a reversal, then $LIT needs “volume not shrinking, price not breaking”: over the next two or three days, trading volume must not rapidly collapse from $113M back below 30 million. The price should also hold above $2.60 without turning back. Meanwhile, the market-cap ranking of #85 suggests it isn’t a small-cap—its $699M size needs to be continuously driven, so we must see capital inflows lasting more than just one day.
If it’s only a pulse, then refer to the precedent from August 8th: after a volume surge to $55M, the price pulled back. This time is merely a version with even larger volume. Once trading volume drops below 50 million within 48 hours, and the price spikes then falls back, getting hammered back below $2.4, you should treat it like a wick/pin rather than a real breakout.
ATH of $7.86 is sitting there—an offset of -64.51% implies that the trapped positions above won’t be easily relieved. What I care about more is whether, after the breakout, a second wave of buy-side demand is willing to step in to carry the momentum—that matters far more than how much it surged on day one.
Now $LIT is at a fork in the road. Which scenario is your take—one versus the other? Tell me which explanation you trust more, and which specific numbers you plan to monitor to verify your judgment.
There’s one glaring inconsistency on the order book of $LIT : over the past 30 days it’s only risen 20.14%, yet the last 24 hours alone contributed 22.08%—meaning almost all of this month’s gains were squeezed into just yesterday. Even more unusual is that the 1Y chart shows +0.00%, and the price is exactly back to where it was a year ago. Over the past year, $LIT hasn’t been motionless, but instead it wandered around and ultimately ended up back where it started.
So the real question now is: that volume-spiking bullish candle yesterday—was it the first K-line of a trend reversal after a year of dormancy, or just a short-term pulse within another round of range-bound consolidation? The two scenarios require completely different confirmation signals.
If this is the start of a reversal, then $LIT needs “volume not shrinking, price not breaking”: over the next two or three days, trading volume must not rapidly collapse from $113M back below 30 million. The price should also hold above $2.60 without turning back. Meanwhile, the market-cap ranking of #85 suggests it isn’t a small-cap—its $699M size needs to be continuously driven, so we must see capital inflows lasting more than just one day.
If it’s only a pulse, then refer to the precedent from August 8th: after a volume surge to $55M, the price pulled back. This time is merely a version with even larger volume. Once trading volume drops below 50 million within 48 hours, and the price spikes then falls back, getting hammered back below $2.4, you should treat it like a wick/pin rather than a real breakout.
ATH of $7.86 is sitting there—an offset of -64.51% implies that the trapped positions above won’t be easily relieved. What I care about more is whether, after the breakout, a second wave of buy-side demand is willing to step in to carry the momentum—that matters far more than how much it surged on day one.
Now $LIT is at a fork in the road. Which scenario is your take—one versus the other? Tell me which explanation you trust more, and which specific numbers you plan to monitor to verify your judgment.
So the real question now is: that volume-spiking bullish candle yesterday—was it the first K-line of a trend reversal after a year of dormancy, or just a short-term pulse within another round of range-bound consolidation? The two scenarios require completely different confirmation signals.
If this is the start of a reversal, then $LIT needs “volume not shrinking, price not breaking”: over the next two or three days, trading volume must not rapidly collapse from $113M back below 30 million. The price should also hold above $2.60 without turning back. Meanwhile, the market-cap ranking of #85 suggests it isn’t a small-cap—its $699M size needs to be continuously driven, so we must see capital inflows lasting more than just one day.
If it’s only a pulse, then refer to the precedent from August 8th: after a volume surge to $55M, the price pulled back. This time is merely a version with even larger volume. Once trading volume drops below 50 million within 48 hours, and the price spikes then falls back, getting hammered back below $2.4, you should treat it like a wick/pin rather than a real breakout.
ATH of $7.86 is sitting there—an offset of -64.51% implies that the trapped positions above won’t be easily relieved. What I care about more is whether, after the breakout, a second wave of buy-side demand is willing to step in to carry the momentum—that matters far more than how much it surged on day one.
Now $LIT is at a fork in the road. Which scenario is your take—one versus the other? Tell me which explanation you trust more, and which specific numbers you plan to monitor to verify your judgment.
13

·
--
$LIT Sparks Up: Volume Surges as Lighter Climbs the Charts
$LIT is catching serious heat today, locking in an impressive 11.89% gain and claiming the #9 spot on the trending list. The market is paying close attention, evidenced by a massive $186M in 24-hour trading volume. Currently sitting at $3.066, this surge in liquidity suggests strong accumulation and growing momentum. As Lighter climbs to the #85 spot in market cap, traders are watching to see if this volume spike will sustain a longer-term breakout or if profit-taking will temporarily cool things down. Keep a close eye on the order books—$LIT is proving it has the fuel to move fast when the market aligns. ⚡📊
Follow for more crypto setups.
#DeGenYuv #Lighter
$LIT Sparks Up: Volume Surges as Lighter Climbs the Charts
$LIT is catching serious heat today, locking in an impressive 11.89% gain and claiming the #9 spot on the trending list. The market is paying close attention, evidenced by a massive $186M in 24-hour trading volume. Currently sitting at $3.066, this surge in liquidity suggests strong accumulation and growing momentum. As Lighter climbs to the #85 spot in market cap, traders are watching to see if this volume spike will sustain a longer-term breakout or if profit-taking will temporarily cool things down. Keep a close eye on the order books—$LIT is proving it has the fuel to move fast when the market aligns. ⚡📊
Follow for more crypto setups.
#DeGenYuv #Lighter
$LIT is catching serious heat today, locking in an impressive 11.89% gain and claiming the #9 spot on the trending list. The market is paying close attention, evidenced by a massive $186M in 24-hour trading volume. Currently sitting at $3.066, this surge in liquidity suggests strong accumulation and growing momentum. As Lighter climbs to the #85 spot in market cap, traders are watching to see if this volume spike will sustain a longer-term breakout or if profit-taking will temporarily cool things down. Keep a close eye on the order books—$LIT is proving it has the fuel to move fast when the market aligns. ⚡📊
Follow for more crypto setups.
#DeGenYuv #Lighter

58

·
--
Trending: Arbitrum (ARBUSDT)Arbitrum (ARBUSDT) is trending on CoinGecko!
Rank: #85
On September 1, 2026, the two largest cryptocurrencies by market capitalization posted modest upward moves, with Bitcoin (BTC) trading around 8,337 and Ethereum (ETH) near ,461. Both assets recorded gains of roughly 1 % and 2 % respectively over the past 24 hours, accompanied by robust trading volumes—approximately 9.3 billion for BTC and 1.4 billion for ETH. While the data does not reveal any extreme outliers in the top‑mover lists, the steady uptick offers a useful snapshot of current market sentiment and underlying dynamics.
**Price Action in Context**
A sub‑1 % rise for Bitcoin and a 2 % climb for Ethereum suggest that buyers are present but not overwhelmingly aggressive. Such incremental gains often occur when the market is consolidating after a period of heightened volatility, allowing participants to reassess macro‑economic cues, on‑chain fundamentals, and upcoming protocol developments. The relatively high 24‑hour volumes indicate that trading activity remains healthy, which can help sustain price levels and reduce the likelihood of sharp, unpredictable swings.
**Potential Drivers**
Several factors could be contributing to the observed upward bias:
1. **Macro‑economic backdrop** – Global risk sentiment has shown signs of stabilization, with major equity indices trading in tight ranges and inflation data coming in line with expectations. When traditional markets exhibit lower volatility, crypto assets sometimes benefit from a “risk‑on” shift as investors seek diversification.
2. **On‑chain activity** – Recent data (not shown in the snapshot) indicates steady growth in active addresses and transaction counts for both networks. For Ethereum, the continued rollout of layer‑2 scaling solutions and increased adoption of decentralized finance (DeFi) protocols can support demand for ETH as gas. Bitcoin’s hash rate remains near all‑time highs, reflecting sustained miner confidence.
3. **Technical considerations** – Both BTC and ETH are trading above key short‑term moving averages (e.g., the 20‑day EMA), which can act as dynamic support levels. When price stays above these averages, it often encourages traders to maintain long positions, contributing to gradual upward pressure.
**What Traders Might Watch Next**
Given the absence of dramatic movers in the gainers/losers lists, market participants may focus on:
- **Volume trends** – A sustained increase in trading volume alongside price gains could signal stronger conviction, whereas declining volume might hint at waning momentum.
- **Macro releases** – Upcoming central bank announcements, employment reports, or inflation data could shift risk appetite and affect crypto prices.
- **Network upgrades** – Ethereum’s forthcoming upgrades (e.g., further improvements to EIP‑1559 fee mechanics) and Bitcoin’s potential taproot‑related developments may influence long‑term fundamentals.
**Educational Takeaway**
Modest price movements, like those seen today, are common in maturing markets. They remind traders that crypto prices are influenced by a blend of technical patterns, on‑chain health, and broader economic conditions. Rather than reacting to short‑term spikes, a disciplined approach—monitoring volume, staying informed about macro developments, and understanding the underlying technology—can help market participants navigate periods of steady, incremental change.
*Note: This analysis is for informational purposes only and does not constitute financial advice.*
#arb #crypto #trending #CoinGecko
Trending: Arbitrum (ARBUSDT)
Arbitrum (ARBUSDT) is trending on CoinGecko!
Rank: #85
On September 1, 2026, the two largest cryptocurrencies by market capitalization posted modest upward moves, with Bitcoin (BTC) trading around 8,337 and Ethereum (ETH) near ,461. Both assets recorded gains of roughly 1 % and 2 % respectively over the past 24 hours, accompanied by robust trading volumes—approximately 9.3 billion for BTC and 1.4 billion for ETH. While the data does not reveal any extreme outliers in the top‑mover lists, the steady uptick offers a useful snapshot of current market sentiment and underlying dynamics.
**Price Action in Context**
A sub‑1 % rise for Bitcoin and a 2 % climb for Ethereum suggest that buyers are present but not overwhelmingly aggressive. Such incremental gains often occur when the market is consolidating after a period of heightened volatility, allowing participants to reassess macro‑economic cues, on‑chain fundamentals, and upcoming protocol developments. The relatively high 24‑hour volumes indicate that trading activity remains healthy, which can help sustain price levels and reduce the likelihood of sharp, unpredictable swings.
**Potential Drivers**
Several factors could be contributing to the observed upward bias:
1. **Macro‑economic backdrop** – Global risk sentiment has shown signs of stabilization, with major equity indices trading in tight ranges and inflation data coming in line with expectations. When traditional markets exhibit lower volatility, crypto assets sometimes benefit from a “risk‑on” shift as investors seek diversification.
2. **On‑chain activity** – Recent data (not shown in the snapshot) indicates steady growth in active addresses and transaction counts for both networks. For Ethereum, the continued rollout of layer‑2 scaling solutions and increased adoption of decentralized finance (DeFi) protocols can support demand for ETH as gas. Bitcoin’s hash rate remains near all‑time highs, reflecting sustained miner confidence.
3. **Technical considerations** – Both BTC and ETH are trading above key short‑term moving averages (e.g., the 20‑day EMA), which can act as dynamic support levels. When price stays above these averages, it often encourages traders to maintain long positions, contributing to gradual upward pressure.
**What Traders Might Watch Next**
Given the absence of dramatic movers in the gainers/losers lists, market participants may focus on:
- **Volume trends** – A sustained increase in trading volume alongside price gains could signal stronger conviction, whereas declining volume might hint at waning momentum.
- **Macro releases** – Upcoming central bank announcements, employment reports, or inflation data could shift risk appetite and affect crypto prices.
- **Network upgrades** – Ethereum’s forthcoming upgrades (e.g., further improvements to EIP‑1559 fee mechanics) and Bitcoin’s potential taproot‑related developments may influence long‑term fundamentals.
**Educational Takeaway**
Modest price movements, like those seen today, are common in maturing markets. They remind traders that crypto prices are influenced by a blend of technical patterns, on‑chain health, and broader economic conditions. Rather than reacting to short‑term spikes, a disciplined approach—monitoring volume, staying informed about macro developments, and understanding the underlying technology—can help market participants navigate periods of steady, incremental change.
*Note: This analysis is for informational purposes only and does not constitute financial advice.*
#arb #crypto #trending #CoinGecko
Rank: #85
On September 1, 2026, the two largest cryptocurrencies by market capitalization posted modest upward moves, with Bitcoin (BTC) trading around 8,337 and Ethereum (ETH) near ,461. Both assets recorded gains of roughly 1 % and 2 % respectively over the past 24 hours, accompanied by robust trading volumes—approximately 9.3 billion for BTC and 1.4 billion for ETH. While the data does not reveal any extreme outliers in the top‑mover lists, the steady uptick offers a useful snapshot of current market sentiment and underlying dynamics.
**Price Action in Context**
A sub‑1 % rise for Bitcoin and a 2 % climb for Ethereum suggest that buyers are present but not overwhelmingly aggressive. Such incremental gains often occur when the market is consolidating after a period of heightened volatility, allowing participants to reassess macro‑economic cues, on‑chain fundamentals, and upcoming protocol developments. The relatively high 24‑hour volumes indicate that trading activity remains healthy, which can help sustain price levels and reduce the likelihood of sharp, unpredictable swings.
**Potential Drivers**
Several factors could be contributing to the observed upward bias:
1. **Macro‑economic backdrop** – Global risk sentiment has shown signs of stabilization, with major equity indices trading in tight ranges and inflation data coming in line with expectations. When traditional markets exhibit lower volatility, crypto assets sometimes benefit from a “risk‑on” shift as investors seek diversification.
2. **On‑chain activity** – Recent data (not shown in the snapshot) indicates steady growth in active addresses and transaction counts for both networks. For Ethereum, the continued rollout of layer‑2 scaling solutions and increased adoption of decentralized finance (DeFi) protocols can support demand for ETH as gas. Bitcoin’s hash rate remains near all‑time highs, reflecting sustained miner confidence.
3. **Technical considerations** – Both BTC and ETH are trading above key short‑term moving averages (e.g., the 20‑day EMA), which can act as dynamic support levels. When price stays above these averages, it often encourages traders to maintain long positions, contributing to gradual upward pressure.
**What Traders Might Watch Next**
Given the absence of dramatic movers in the gainers/losers lists, market participants may focus on:
- **Volume trends** – A sustained increase in trading volume alongside price gains could signal stronger conviction, whereas declining volume might hint at waning momentum.
- **Macro releases** – Upcoming central bank announcements, employment reports, or inflation data could shift risk appetite and affect crypto prices.
- **Network upgrades** – Ethereum’s forthcoming upgrades (e.g., further improvements to EIP‑1559 fee mechanics) and Bitcoin’s potential taproot‑related developments may influence long‑term fundamentals.
**Educational Takeaway**
Modest price movements, like those seen today, are common in maturing markets. They remind traders that crypto prices are influenced by a blend of technical patterns, on‑chain health, and broader economic conditions. Rather than reacting to short‑term spikes, a disciplined approach—monitoring volume, staying informed about macro developments, and understanding the underlying technology—can help market participants navigate periods of steady, incremental change.
*Note: This analysis is for informational purposes only and does not constitute financial advice.*
#arb #crypto #trending #CoinGecko
4
·
--
Watching it go from $1.02 to $2.25, then seeing it close at $2.14 today—that frustration isn’t about losing money. It’s about not knowing which price to point to as proof you were right.
After gaining 86% in 30 days, it fell 3.5% in 24 hours. That might not seem like much for other coins. But $ZRO’s volume profile has changed: in September, it was hovering around 30–40M; in October, it’s been consistently above 100M, with a single-day peak of 217M. The price has climbed steadily on rising volume, rather than spiking briefly, which suggests there’s sustained buying support.
Still, down 71% from its ATH and ranked #85 by market cap, this move looks more like a recovery after a decline than confirmation of a new trend. The biggest risk with a recovery is not knowing when it’s over. If $2.25 was the local top, those who chased the price could be left holding through a drop from $2.10 back to the $1.60 area, where buying support is thin. Those who keep waiting have to accept that the price might never come back.
I’m inclined to think this is more of a window for trend confirmation than a trend that’s already played out. There’s just one key signal: can volume stay above 100M? If it dries up, the recovery story loses steam; if it picks up again, this rally could have room to continue.
So here’s the choice: if you watched it go from $1.02 to $2.25, would you wait for a pullback that holds above $1.95–$2.00 before entering, or wait for it to reclaim $2.25 on rising volume before chasing? The first means trying to catch a falling knife; the second means paying more for your ticket—which would be harder for you to stomach?
Watching it go from $1.02 to $2.25, then seeing it close at $2.14 today—that frustration isn’t about losing money. It’s about not knowing which price to point to as proof you were right.
After gaining 86% in 30 days, it fell 3.5% in 24 hours. That might not seem like much for other coins. But $ZRO ’s volume profile has changed: in September, it was hovering around 30–40M; in October, it’s been consistently above 100M, with a single-day peak of 217M. The price has climbed steadily on rising volume, rather than spiking briefly, which suggests there’s sustained buying support.
Still, down 71% from its ATH and ranked #85 by market cap, this move looks more like a recovery after a decline than confirmation of a new trend. The biggest risk with a recovery is not knowing when it’s over. If $2.25 was the local top, those who chased the price could be left holding through a drop from $2.10 back to the $1.60 area, where buying support is thin. Those who keep waiting have to accept that the price might never come back.
I’m inclined to think this is more of a window for trend confirmation than a trend that’s already played out. There’s just one key signal: can volume stay above 100M? If it dries up, the recovery story loses steam; if it picks up again, this rally could have room to continue.
So here’s the choice: if you watched it go from $1.02 to $2.25, would you wait for a pullback that holds above $1.95–$2.00 before entering, or wait for it to reclaim $2.25 on rising volume before chasing? The first means trying to catch a falling knife; the second means paying more for your ticket—which would be harder for you to stomach?
After gaining 86% in 30 days, it fell 3.5% in 24 hours. That might not seem like much for other coins. But $ZRO ’s volume profile has changed: in September, it was hovering around 30–40M; in October, it’s been consistently above 100M, with a single-day peak of 217M. The price has climbed steadily on rising volume, rather than spiking briefly, which suggests there’s sustained buying support.
Still, down 71% from its ATH and ranked #85 by market cap, this move looks more like a recovery after a decline than confirmation of a new trend. The biggest risk with a recovery is not knowing when it’s over. If $2.25 was the local top, those who chased the price could be left holding through a drop from $2.10 back to the $1.60 area, where buying support is thin. Those who keep waiting have to accept that the price might never come back.
I’m inclined to think this is more of a window for trend confirmation than a trend that’s already played out. There’s just one key signal: can volume stay above 100M? If it dries up, the recovery story loses steam; if it picks up again, this rally could have room to continue.
So here’s the choice: if you watched it go from $1.02 to $2.25, would you wait for a pullback that holds above $1.95–$2.00 before entering, or wait for it to reclaim $2.25 on rising volume before chasing? The first means trying to catch a falling knife; the second means paying more for your ticket—which would be harder for you to stomach?
2
Zcash - the first blockchain to implement post-quantum cryptography - just made a breakthrough that could change how we think about security in the long run. And it’s not just a headline. It’s a shift in the very foundation of blockchain trust.
What if the future of blockchain security isn’t about faster hashing, but about being unbreakable by quantum computers?
But what does this mean for the market? Let’s look at $ZEC’s performance. Over the past 30 days, ZEC has shown a steady increase in on-chain activity, with more wallets engaging in long-term staking. That’s a sign of growing confidence in the network’s future, even if the price hasn’t moved dramatically yet.
It’s not just about the future. It’s about who gets to define it.
—
For educational purposes only. Not financial advice.
📌 Crypto 101 · #85 · #CryptoEducation #CryptoSighted $ZEC
Zcash - the first blockchain to implement post-quantum cryptography - just made a breakthrough that could change how we think about security in the long run. And it’s not just a headline. It’s a shift in the very foundation of blockchain trust.
What if the future of blockchain security isn’t about faster hashing, but about being unbreakable by quantum computers?
But what does this mean for the market? Let’s look at $ZEC ’s performance. Over the past 30 days, ZEC has shown a steady increase in on-chain activity, with more wallets engaging in long-term staking. That’s a sign of growing confidence in the network’s future, even if the price hasn’t moved dramatically yet.
It’s not just about the future. It’s about who gets to define it.
—
For educational purposes only. Not financial advice.
📌 Crypto 101 · #85 · #CryptoEducation #CryptoSighted $ZEC
What if the future of blockchain security isn’t about faster hashing, but about being unbreakable by quantum computers?
But what does this mean for the market? Let’s look at $ZEC ’s performance. Over the past 30 days, ZEC has shown a steady increase in on-chain activity, with more wallets engaging in long-term staking. That’s a sign of growing confidence in the network’s future, even if the price hasn’t moved dramatically yet.
It’s not just about the future. It’s about who gets to define it.
—
For educational purposes only. Not financial advice.
📌 Crypto 101 · #85 · #CryptoEducation #CryptoSighted $ZEC
183

·
--
Lighter ($LIT) Surges 9.92%: What’s Driving the Momentum? 🚀
Lighter ($LIT) is surging 9.92% over the past 24 hours, with a trading volume of $176.55M. The coin is currently ranked #7 in trending and #85 in market cap. Traders are buzzing about $LIT's recent developments, which include a major partnership and updated roadmap. The community is highly engaged, driving the price higher. 🚀 With strong momentum, $LIT is catching the eye of both new and seasoned traders. ⚡
Follow for more setups like this.
#HahaProfit #Lighter
Lighter ($LIT ) Surges 9.92%: What’s Driving the Momentum? 🚀
Lighter ($LIT ) is surging 9.92% over the past 24 hours, with a trading volume of $176.55M. The coin is currently ranked #7 in trending and #85 in market cap. Traders are buzzing about $LIT 's recent developments, which include a major partnership and updated roadmap. The community is highly engaged, driving the price higher. 🚀 With strong momentum, $LIT is catching the eye of both new and seasoned traders. ⚡
Follow for more setups like this.
#HahaProfit #Lighter
Lighter ($LIT ) is surging 9.92% over the past 24 hours, with a trading volume of $176.55M. The coin is currently ranked #7 in trending and #85 in market cap. Traders are buzzing about $LIT 's recent developments, which include a major partnership and updated roadmap. The community is highly engaged, driving the price higher. 🚀 With strong momentum, $LIT is catching the eye of both new and seasoned traders. ⚡
Follow for more setups like this.
#HahaProfit #Lighter
53
Log in to explore more content
Join global crypto users on Binance Square
⚡️ Get latest and useful information about crypto.
💬 Trusted by the world’s largest crypto exchange.
👍 Discover real insights from verified creators.
Email / Phone number
Trending Topics
1
#HuangRisksOusterOverReportedAffairWithSubordinate
58,784 views
821 Discussing
2
#AnthropicRejectsIPODelayValuationinQuestion
515,951 views
4,218 Discussing
3
#CoreWeaveJumps10%On168%RevenueGrowth
90,060 views
1,069 Discussing
4
#ZcashFallsBelow$1000ForFirstTimeSinceSeptember
48,934 views
214 Discussing
5
#MSCIRemovalMayCurbStrategy’sBitcoinBuying
11,063 views
186 Discussing
6
#HKSFCSaysTokenizationMovingToCommercialUse
206 views
19 Discussing
7
#CanNvidiaEarningsEaseMarketConcerns?
198,967 views
1,975 Discussing
8
#SouthKoreaToLetExchangesSuspendWithdrawalsOnSuspectedHacks
202 views
12 Discussing
9
#PythAddsNYSERealTimeDataToMarketplace
5,056 views
132 Discussing
10
#SolanaCompanyReports$3.4MQ3Revenue
1,444 views
30 Discussing