

#50
50
54,483 views
106 Discussing
Hot
Latest

·
--
$MORPHO ’s 24-hour +14.20% “return” becomes invalid within 30 days: 30 days is only +12.80%, while 7 days is +32.79%. With 7 days overtaking 30 days, it means most of this month has been in decline. On September 16, it briefly came back to $2.08; the upside has only been repaired back within the last week.
The volume disparity is even more concrete. In mid-September, daily volume was only around $13M. Yesterday it returned to $66.5M—more than four times. Only after that liquidity came back did the price move from $2.08 to $2.87, pushing the market cap above $2.01B and bringing it up to #50. This is a rapid “re-pricing” repair, not a slow grind-up.
What needs to be confirmed is this: relative to the ATH of $4.17, it’s still down -31%. The real resistance is the de-risking/exit sell wall sitting above $3—not the bullish candle in front of you.
From a short-term perspective, $2.51 was yesterday’s low; if it breaks, treat it as a sentiment pulse. From a swing-trade perspective, whether $2.92 can stand above it with volume—and whether a daily trading value on the order of $60M can hold for three days—will determine whether that 32% move over 7 days was a “thin-liquidity” puff, or a genuine change in hands.
Are you holding for a short-term move or a swing trade? The answer is different, and the levels you should watch are completely different.
$MORPHO ’s 24-hour +14.20% “return” becomes invalid within 30 days: 30 days is only +12.80%, while 7 days is +32.79%. With 7 days overtaking 30 days, it means most of this month has been in decline. On September 16, it briefly came back to $2.08; the upside has only been repaired back within the last week.
The volume disparity is even more concrete. In mid-September, daily volume was only around $13M. Yesterday it returned to $66.5M—more than four times. Only after that liquidity came back did the price move from $2.08 to $2.87, pushing the market cap above $2.01B and bringing it up to #50. This is a rapid “re-pricing” repair, not a slow grind-up.
What needs to be confirmed is this: relative to the ATH of $4.17, it’s still down -31%. The real resistance is the de-risking/exit sell wall sitting above $3—not the bullish candle in front of you.
From a short-term perspective, $2.51 was yesterday’s low; if it breaks, treat it as a sentiment pulse. From a swing-trade perspective, whether $2.92 can stand above it with volume—and whether a daily trading value on the order of $60M can hold for three days—will determine whether that 32% move over 7 days was a “thin-liquidity” puff, or a genuine change in hands.
Are you holding for a short-term move or a swing trade? The answer is different, and the levels you should watch are completely different.
The volume disparity is even more concrete. In mid-September, daily volume was only around $13M. Yesterday it returned to $66.5M—more than four times. Only after that liquidity came back did the price move from $2.08 to $2.87, pushing the market cap above $2.01B and bringing it up to #50. This is a rapid “re-pricing” repair, not a slow grind-up.
What needs to be confirmed is this: relative to the ATH of $4.17, it’s still down -31%. The real resistance is the de-risking/exit sell wall sitting above $3—not the bullish candle in front of you.
From a short-term perspective, $2.51 was yesterday’s low; if it breaks, treat it as a sentiment pulse. From a swing-trade perspective, whether $2.92 can stand above it with volume—and whether a daily trading value on the order of $60M can hold for three days—will determine whether that 32% move over 7 days was a “thin-liquidity” puff, or a genuine change in hands.
Are you holding for a short-term move or a swing trade? The answer is different, and the levels you should watch are completely different.
77


·
--
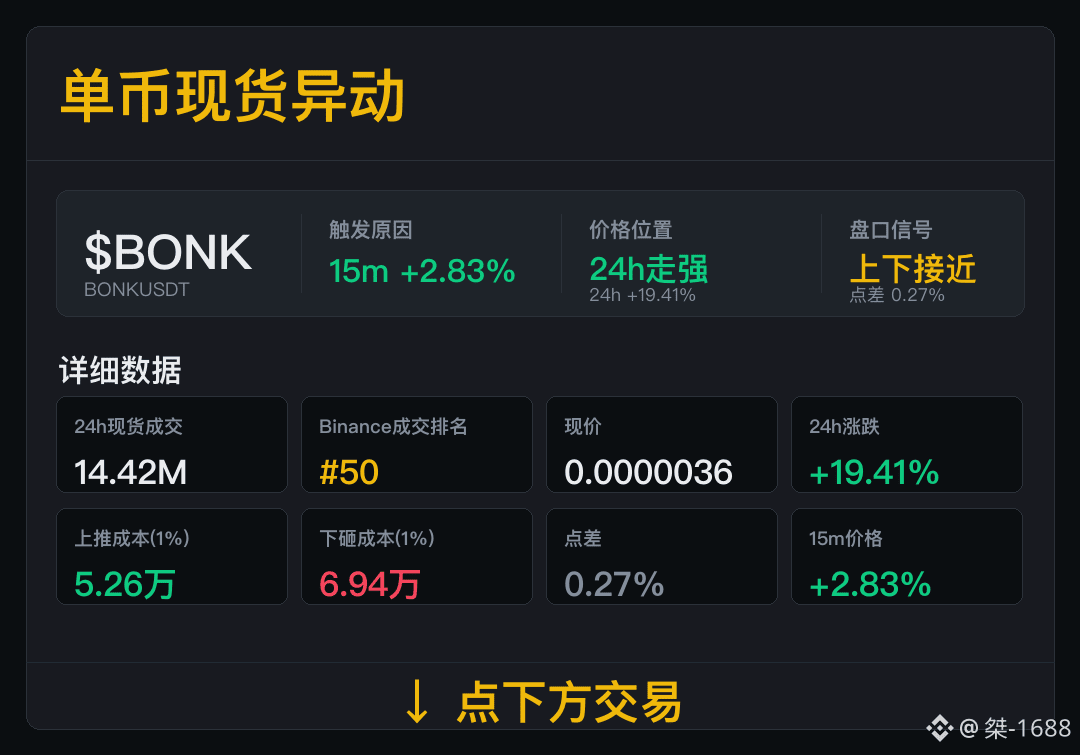
$BONK spot shows short-term abnormal movement; first check whether trading volume keeps up.
Spot trading volume is 14.42M, and Binance trading rank is #50. Spot trading volume is the main clue right now; continue to track participation going forward.
In the past 24h, the price change is +19.41%; the spread is 0.27%, with the pushed-up cost at 52.6k and the lowered cost at 69.4k. The first segment of the price has already appeared; the second segment’s trading volume can better indicate whether the move is sustained.
During the pullback phase, look for volume support/absorption; during the execution phase, watch how the spread changes.
$BONK spot shows short-term abnormal movement; first check whether trading volume keeps up.
Spot trading volume is 14.42M, and Binance trading rank is #50. Spot trading volume is the main clue right now; continue to track participation going forward.
In the past 24h, the price change is +19.41%; the spread is 0.27%, with the pushed-up cost at 52.6k and the lowered cost at 69.4k. The first segment of the price has already appeared; the second segment’s trading volume can better indicate whether the move is sustained.
During the pullback phase, look for volume support/absorption; during the execution phase, watch how the spread changes.
Spot trading volume is 14.42M, and Binance trading rank is #50. Spot trading volume is the main clue right now; continue to track participation going forward.
In the past 24h, the price change is +19.41%; the spread is 0.27%, with the pushed-up cost at 52.6k and the lowered cost at 69.4k. The first segment of the price has already appeared; the second segment’s trading volume can better indicate whether the move is sustained.
During the pullback phase, look for volume support/absorption; during the execution phase, watch how the spread changes.
55

·
--
COTI: This drop is quite sharp. The 15m chart directly broke below the lower line of the previous 20 or so 5m candles. Volume is 3.61x, and the aggressive buy-sell ratio is 0.45.
What’s interesting is that OI is falling. The 1h nominal value dropped 4%. It doesn’t look like short sellers just opened new positions to dump; it’s more like longs can’t hold and are deleveraging themselves. The pool’s anomaly percentile is 90.1%, but the nominal change ranks only #50. That suggests volume moved first, and the positions haven’t completely broken down yet.
For 35M, the 24h trading value isn’t that deep. Don’t rush to catch this kind of structure—watch whether OI stays stable before deciding. $COTI
COTI: This drop is quite sharp. The 15m chart directly broke below the lower line of the previous 20 or so 5m candles. Volume is 3.61x, and the aggressive buy-sell ratio is 0.45.
What’s interesting is that OI is falling. The 1h nominal value dropped 4%. It doesn’t look like short sellers just opened new positions to dump; it’s more like longs can’t hold and are deleveraging themselves. The pool’s anomaly percentile is 90.1%, but the nominal change ranks only #50. That suggests volume moved first, and the positions haven’t completely broken down yet.
For 35M, the 24h trading value isn’t that deep. Don’t rush to catch this kind of structure—watch whether OI stays stable before deciding. $COTI
What’s interesting is that OI is falling. The 1h nominal value dropped 4%. It doesn’t look like short sellers just opened new positions to dump; it’s more like longs can’t hold and are deleveraging themselves. The pool’s anomaly percentile is 90.1%, but the nominal change ranks only #50. That suggests volume moved first, and the positions haven’t completely broken down yet.
For 35M, the 24h trading value isn’t that deep. Don’t rush to catch this kind of structure—watch whether OI stays stable before deciding. $COTI
3

Article
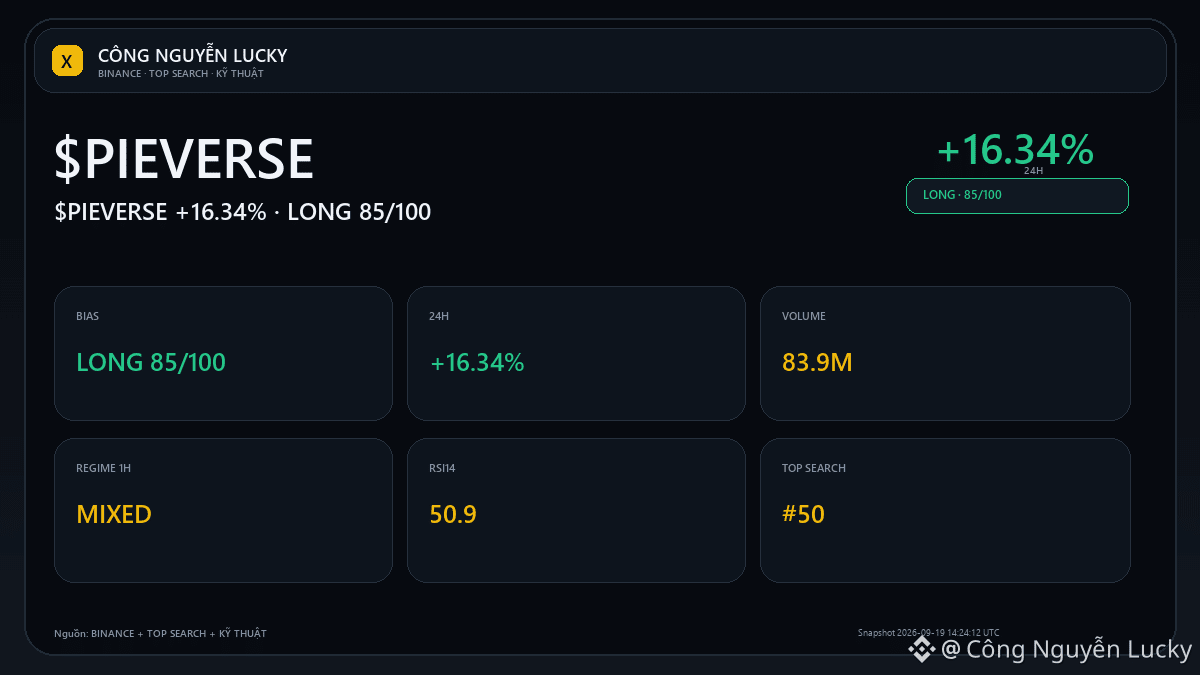
$PIEVERSE +16.34%: what other data confirms this strong run?🔥 $PIEVERSE <> is +16.34% — but the percentage increase/decrease isn’t enough to call this a good setup. 1️⃣ +16.34% — 24h volatility.
2️⃣ 83.9M USDT — 24h quote volume.
3️⃣ 45/100 — position in the day range. A large number doesn’t automatically turn into a setup. Need to confirm next:
• Breaking above 1,839 with expanded volume will make the continuation scenario more reliable.
• Failing to hold the higher zone and dropping back below the midpoint 1,568 will make the cooling scenario clearer. 🧭 Current outlook: **LONG · STRONG · 85/100**.
$PIEVERSE +16.34%: what other data confirms this strong run?
🔥 $PIEVERSE <> is +16.34% — but the percentage increase/decrease isn’t enough to call this a good setup. 1️⃣ +16.34% — 24h volatility.
2️⃣ 83.9M USDT — 24h quote volume.
3️⃣ 45/100 — position in the day range. A large number doesn’t automatically turn into a setup. Need to confirm next:
• Breaking above 1,839 with expanded volume will make the continuation scenario more reliable.
• Failing to hold the higher zone and dropping back below the midpoint 1,568 will make the cooling scenario clearer. 🧭 Current outlook: **LONG · STRONG · 85/100**.
2️⃣ 83.9M USDT — 24h quote volume.
3️⃣ 45/100 — position in the day range. A large number doesn’t automatically turn into a setup. Need to confirm next:
• Breaking above 1,839 with expanded volume will make the continuation scenario more reliable.
• Failing to hold the higher zone and dropping back below the midpoint 1,568 will make the cooling scenario clearer. 🧭 Current outlook: **LONG · STRONG · 85/100**.
225
$ZEC · TREND UP: real breakout or just a 24h fluctuation?🧠 Smart Money rhythm at $ZEC: 5 wallets/trader smart · BUY. Market: 1,352.75 · 24h +11.28% · volume ~4,482.1M USDT · 13,019,525 transactions.
Observed Smart Money net flow: ~-0.00M USD.
Maximum signal increase: +0.3% · exit rate 81.0%. Smart Money data is evidence for verification, not a copy-trading order.
Confirmation price if: Exceeding 1,396.00 with an expanded volume will make the continuation scenario more credible.
$ZEC · TREND UP: real breakout or just a 24h fluctuation?
🧠 Smart Money rhythm at $ZEC : 5 wallets/trader smart · BUY. Market: 1,352.75 · 24h +11.28% · volume ~4,482.1M USDT · 13,019,525 transactions.
Observed Smart Money net flow: ~-0.00M USD.
Maximum signal increase: +0.3% · exit rate 81.0%. Smart Money data is evidence for verification, not a copy-trading order.
Confirmation price if: Exceeding 1,396.00 with an expanded volume will make the continuation scenario more credible.
Observed Smart Money net flow: ~-0.00M USD.
Maximum signal increase: +0.3% · exit rate 81.0%. Smart Money data is evidence for verification, not a copy-trading order.
Confirmation price if: Exceeding 1,396.00 with an expanded volume will make the continuation scenario more credible.
259
$ZEC: is the price action hammer reliable?🕯️ $ZEC: the most recent candle formed a HAMMER pattern; only use the candle pattern as a confirmation layer within an UPTREND context. Market: 1,349.03 · 24h +10.85% · volume ~4,478.0M USDT · 13,017,161 trades.
Technical bias LONG 100/100 · support 1,344.00 · resistance 1,396.00. A candle pattern is only valid when it appears in the correct structural location and the next candle/volume confirms it; otherwise, ignore it. The technical levels being selected are based on the current regime:
$ZEC: is the price action hammer reliable?
🕯️ $ZEC : the most recent candle formed a HAMMER pattern; only use the candle pattern as a confirmation layer within an UPTREND context. Market: 1,349.03 · 24h +10.85% · volume ~4,478.0M USDT · 13,017,161 trades.
Technical bias LONG 100/100 · support 1,344.00 · resistance 1,396.00. A candle pattern is only valid when it appears in the correct structural location and the next candle/volume confirms it; otherwise, ignore it. The technical levels being selected are based on the current regime:
Technical bias LONG 100/100 · support 1,344.00 · resistance 1,396.00. A candle pattern is only valid when it appears in the correct structural location and the next candle/volume confirms it; otherwise, ignore it. The technical levels being selected are based on the current regime:
188

❗️ Why do you keep standing still
You’re no longer a beginner—you understand the market and sometimes you even make profits. But time passes and nothing changes.
Your capital moves in the same range. There’s no growth. This is the “ceiling” you’ve reached.
📌 The important thing to understand:
In 90% of cases, the problem isn’t the market. The problem is that you keep doing the same thing and expecting a different result.
You open trades the same way as before, you analyze with the same method, and you make the same mistakes.
Yes, maybe you write a trading journal, but…
❓ The problem is that you don’t ask yourself:
— Why did I mess up specifically here?
— Is this a systematic mistake or just a coincidence?
— What do I need to change so it doesn’t happen again?
💥 Without this, your journal becomes just a formality
Growth in trading starts with an honest review of yourself
When you start looking at trades as data—not emotions
When you calculate where you win and where you lose, remove what doesn’t work, and strengthen what does
That’s when a different stage begins
⚠️ And this is the core idea:
As long as you don’t change your approach—your results won’t change
The market won’t give you a new level while you’re still trading with the same old mindset
⚡️ Sometimes, to grow
you need more honesty with yourself 💭
👍PO | 📹YT | 🔵TG
❗️ Why do you keep standing still
You’re no longer a beginner—you understand the market and sometimes you even make profits. But time passes and nothing changes.
Your capital moves in the same range. There’s no growth. This is the “ceiling” you’ve reached.
📌 The important thing to understand:
In 90% of cases, the problem isn’t the market. The problem is that you keep doing the same thing and expecting a different result.
You open trades the same way as before, you analyze with the same method, and you make the same mistakes.
Yes, maybe you write a trading journal, but…
❓ The problem is that you don’t ask yourself:
— Why did I mess up specifically here?
— Is this a systematic mistake or just a coincidence?
— What do I need to change so it doesn’t happen again?
💥 Without this, your journal becomes just a formality
Growth in trading starts with an honest review of yourself
When you start looking at trades as data—not emotions
When you calculate where you win and where you lose, remove what doesn’t work, and strengthen what does
That’s when a different stage begins
⚠️ And this is the core idea:
As long as you don’t change your approach—your results won’t change
The market won’t give you a new level while you’re still trading with the same old mindset
⚡️ Sometimes, to grow
you need more honesty with yourself 💭
👍PO | 📹YT | 🔵TG
You’re no longer a beginner—you understand the market and sometimes you even make profits. But time passes and nothing changes.
Your capital moves in the same range. There’s no growth. This is the “ceiling” you’ve reached.
📌 The important thing to understand:
In 90% of cases, the problem isn’t the market. The problem is that you keep doing the same thing and expecting a different result.
You open trades the same way as before, you analyze with the same method, and you make the same mistakes.
Yes, maybe you write a trading journal, but…
❓ The problem is that you don’t ask yourself:
— Why did I mess up specifically here?
— Is this a systematic mistake or just a coincidence?
— What do I need to change so it doesn’t happen again?
💥 Without this, your journal becomes just a formality
Growth in trading starts with an honest review of yourself
When you start looking at trades as data—not emotions
When you calculate where you win and where you lose, remove what doesn’t work, and strengthen what does
That’s when a different stage begins
⚠️ And this is the core idea:
As long as you don’t change your approach—your results won’t change
The market won’t give you a new level while you’re still trading with the same old mindset
⚡️ Sometimes, to grow
you need more honesty with yourself 💭
👍PO | 📹YT | 🔵TG
46


Article
$BTW -7.1% over 24h — turned out to be the weakest in the top 100!🧊 $BTW <c-7.1%> over 24h — turned out to be the weakest in the top 100!
This doesn’t happen every day.
🧭 Result: the movement is going AGAINST the broader trend (7d/30d in the opposite direction) — it looks like a short-term rebound/correction rather than a trend change; volume is low — the movement may be unstable.
🌍 Market context: out of 65 major coins with notable movement over the last 24h — 🔼 53 increased, 🔽 12 fell
$BTW -7.1% over 24h — turned out to be the weakest in the top 100!
🧊 $BTW <c-7.1%> over 24h — turned out to be the weakest in the top 100!
This doesn’t happen every day.
🧭 Result: the movement is going AGAINST the broader trend (7d/30d in the opposite direction) — it looks like a short-term rebound/correction rather than a trend change; volume is low — the movement may be unstable.
🌍 Market context: out of 65 major coins with notable movement over the last 24h — 🔼 53 increased, 🔽 12 fell
This doesn’t happen every day.
🧭 Result: the movement is going AGAINST the broader trend (7d/30d in the opposite direction) — it looks like a short-term rebound/correction rather than a trend change; volume is low — the movement may be unstable.
🌍 Market context: out of 65 major coins with notable movement over the last 24h — 🔼 53 increased, 🔽 12 fell
17

·
--
Crypto Market UpdatePump.fun (PUMPUSDT) is trending right now!
Rank: #50
CRYPTO SLUMP: 🔥 BTC dropped **9486** today, a **0.59% decline**. Not a great start to the week. ETH also slipped to **491.59**, down **0.46%**. Volumes are still high, but momentum seems to be slowing. Personally, I think this is a buying opportunity, but I'm cautious - the market can turn quickly. Are we heading for a bigger correction or just a minor dip? 🤔
#bitcoin #ethereum #crypto
Crypto Market Update
Pump.fun (PUMPUSDT) is trending right now!
Rank: #50
CRYPTO SLUMP: 🔥 BTC dropped **9486** today, a **0.59% decline**. Not a great start to the week. ETH also slipped to **491.59**, down **0.46%**. Volumes are still high, but momentum seems to be slowing. Personally, I think this is a buying opportunity, but I'm cautious - the market can turn quickly. Are we heading for a bigger correction or just a minor dip? 🤔
#bitcoin #ethereum #crypto
Rank: #50
CRYPTO SLUMP: 🔥 BTC dropped **9486** today, a **0.59% decline**. Not a great start to the week. ETH also slipped to **491.59**, down **0.46%**. Volumes are still high, but momentum seems to be slowing. Personally, I think this is a buying opportunity, but I'm cautious - the market can turn quickly. Are we heading for a bigger correction or just a minor dip? 🤔
#bitcoin #ethereum #crypto
33
·
--
** How Can You Make Profits With Daily Top Movers? – Binance Square Practical GuidePump.fun (PUMPUSDT) is trending right now!
Rank: #50
** --- ### 📌 Step 1 – Identify “Hot” Coins **Why is it important?** The most active (top-movers) coins offer the best opportunities in terms of volatility and liquidity. | Symbol | 24h % Change | Price (USDT) | Daily Volume | |--------|---------------|--------------|--------------| | **** | **+7.87 %** | 58.67 | 25.41 M | | ****| **+7.10 %** | 13.27 | 71.38 M | | ****| **+5.16 %** | 1.67 | 1.81 M | | ****| **+4.41 %** | 8.04 | 26.55 M | | **** | **+3.99 %** | 1.02 | 11.99 M | **Practical tip:** On Binance Square’s “Market Overview” panel, open the **Top Movers** tab, select the “24h” filter, and choose two or three coins from the list. --- ### 📊 Step 2 – Quickly Recognize Chart Patterns **Why is it important?** Patterns provide a visual signal about which direction the price may move. | Coin | Visual Hint | Description | |------|--------------|----------| | | 📈 **Bullish Flag** (a tight consolidation after a strong upward move) | When price touches the flag’s lower line, a new uptrend usually starts. | | | 🔄 **Ascending Triangle** (horizontal resistance at the top, rising trend at the bottom) | A strong “breakout” is expected when the upper resistance breaks. | | | 🎯 **Cup-and-Handle** (a cup shape + short pause) | Completing the cup is a sign of a “full recovery.” | **How to look for it:** 1. Click the **Chart** tab on Binance Square. 2. Set the “Timeframe” to **1-hour** (1h), then add “Indicators” → **Trendlines**. 3. When you spot the pattern, click “Screensh
** How Can You Make Profits With Daily Top Movers? – Binance Square Practical Guide
Pump.fun (PUMPUSDT) is trending right now!
Rank: #50
** --- ### 📌 Step 1 – Identify “Hot” Coins **Why is it important?** The most active (top-movers) coins offer the best opportunities in terms of volatility and liquidity. | Symbol | 24h % Change | Price (USDT) | Daily Volume | |--------|---------------|--------------|--------------| | **** | **+7.87 %** | 58.67 | 25.41 M | | ****| **+7.10 %** | 13.27 | 71.38 M | | ****| **+5.16 %** | 1.67 | 1.81 M | | ****| **+4.41 %** | 8.04 | 26.55 M | | **** | **+3.99 %** | 1.02 | 11.99 M | **Practical tip:** On Binance Square’s “Market Overview” panel, open the **Top Movers** tab, select the “24h” filter, and choose two or three coins from the list. --- ### 📊 Step 2 – Quickly Recognize Chart Patterns **Why is it important?** Patterns provide a visual signal about which direction the price may move. | Coin | Visual Hint | Description | |------|--------------|----------| | | 📈 **Bullish Flag** (a tight consolidation after a strong upward move) | When price touches the flag’s lower line, a new uptrend usually starts. | | | 🔄 **Ascending Triangle** (horizontal resistance at the top, rising trend at the bottom) | A strong “breakout” is expected when the upper resistance breaks. | | | 🎯 **Cup-and-Handle** (a cup shape + short pause) | Completing the cup is a sign of a “full recovery.” | **How to look for it:** 1. Click the **Chart** tab on Binance Square. 2. Set the “Timeframe” to **1-hour** (1h), then add “Indicators” → **Trendlines**. 3. When you spot the pattern, click “Screensh
Rank: #50
** --- ### 📌 Step 1 – Identify “Hot” Coins **Why is it important?** The most active (top-movers) coins offer the best opportunities in terms of volatility and liquidity. | Symbol | 24h % Change | Price (USDT) | Daily Volume | |--------|---------------|--------------|--------------| | **** | **+7.87 %** | 58.67 | 25.41 M | | ****| **+7.10 %** | 13.27 | 71.38 M | | ****| **+5.16 %** | 1.67 | 1.81 M | | ****| **+4.41 %** | 8.04 | 26.55 M | | **** | **+3.99 %** | 1.02 | 11.99 M | **Practical tip:** On Binance Square’s “Market Overview” panel, open the **Top Movers** tab, select the “24h” filter, and choose two or three coins from the list. --- ### 📊 Step 2 – Quickly Recognize Chart Patterns **Why is it important?** Patterns provide a visual signal about which direction the price may move. | Coin | Visual Hint | Description | |------|--------------|----------| | | 📈 **Bullish Flag** (a tight consolidation after a strong upward move) | When price touches the flag’s lower line, a new uptrend usually starts. | | | 🔄 **Ascending Triangle** (horizontal resistance at the top, rising trend at the bottom) | A strong “breakout” is expected when the upper resistance breaks. | | | 🎯 **Cup-and-Handle** (a cup shape + short pause) | Completing the cup is a sign of a “full recovery.” | **How to look for it:** 1. Click the **Chart** tab on Binance Square. 2. Set the “Timeframe” to **1-hour** (1h), then add “Indicators” → **Trendlines**. 3. When you spot the pattern, click “Screensh
16

·
--
Bullish
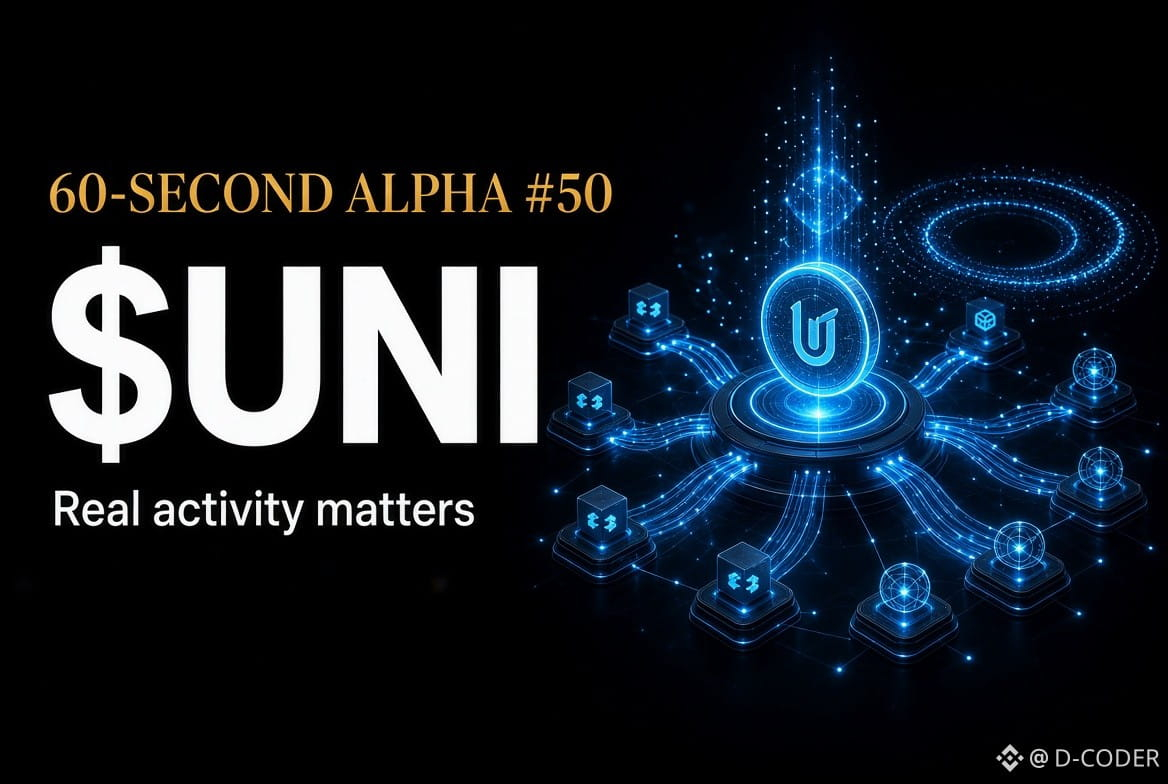
60-SECOND ALPHA #50 | $UNI
Uniswap is an interesting example of why crypto value isn't always about price action. Recent data discussed on Binance Square points to growing protocol revenue and increased UNI burns, although some of that revenue is currently concentrated in specific sources.
That creates a bigger question for investors: can protocol activity eventually translate into sustainable value for the token? A strong narrative is useful, but measurable usage and recurring revenue are much more meaningful.
The lesson: Real protocol activity can matter more than hype.
{future}(UNIUSDT)
60-SECOND ALPHA #50 | $UNI
Uniswap is an interesting example of why crypto value isn't always about price action. Recent data discussed on Binance Square points to growing protocol revenue and increased UNI burns, although some of that revenue is currently concentrated in specific sources.
That creates a bigger question for investors: can protocol activity eventually translate into sustainable value for the token? A strong narrative is useful, but measurable usage and recurring revenue are much more meaningful.
The lesson: Real protocol activity can matter more than hype.
Uniswap is an interesting example of why crypto value isn't always about price action. Recent data discussed on Binance Square points to growing protocol revenue and increased UNI burns, although some of that revenue is currently concentrated in specific sources.
That creates a bigger question for investors: can protocol activity eventually translate into sustainable value for the token? A strong narrative is useful, but measurable usage and recurring revenue are much more meaningful.
The lesson: Real protocol activity can matter more than hype.
71

·
--
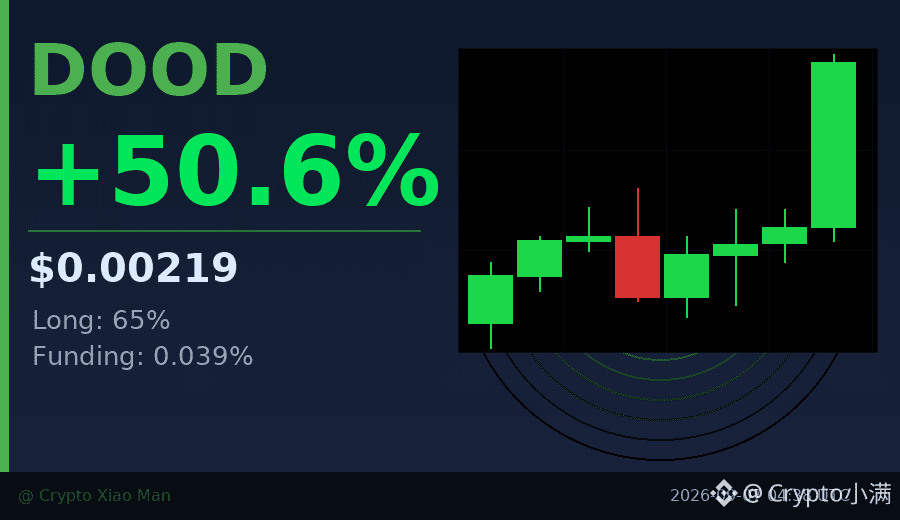
Behind the 50% rise, what really deserves attention is this sudden spike in volume.
In the past 7 hourly K lines, the last candle saw trading volume close to 5 billion, 2-3 times that of the earlier ones. Price was pushed from 0.0019 all the way to 0.0022, with bulls accounting for 65%.
This kind of volume-driven rally usually has two possibilities: either new funds are entering to chase the breakout, or shorts are being forced to close. The funding rate of 0.039% is not extreme, which suggests leverage is not overheated yet.
Next, we should see whether it can hold above 0.0022. If volume cannot be sustained, a pullback toward 0.0019 would not be surprising.
$DOOD #放量突破 #50%
Click the small card below to quickly view the market👇
Behind the 50% rise, what really deserves attention is this sudden spike in volume.
In the past 7 hourly K lines, the last candle saw trading volume close to 5 billion, 2-3 times that of the earlier ones. Price was pushed from 0.0019 all the way to 0.0022, with bulls accounting for 65%.
This kind of volume-driven rally usually has two possibilities: either new funds are entering to chase the breakout, or shorts are being forced to close. The funding rate of 0.039% is not extreme, which suggests leverage is not overheated yet.
Next, we should see whether it can hold above 0.0022. If volume cannot be sustained, a pullback toward 0.0019 would not be surprising.
$DOOD #放量突破 #50%
Click the small card below to quickly view the market👇
In the past 7 hourly K lines, the last candle saw trading volume close to 5 billion, 2-3 times that of the earlier ones. Price was pushed from 0.0019 all the way to 0.0022, with bulls accounting for 65%.
This kind of volume-driven rally usually has two possibilities: either new funds are entering to chase the breakout, or shorts are being forced to close. The funding rate of 0.039% is not extreme, which suggests leverage is not overheated yet.
Next, we should see whether it can hold above 0.0022. If volume cannot be sustained, a pullback toward 0.0019 would not be surprising.
$DOOD #放量突破 #50%
Click the small card below to quickly view the market👇
18
·
--
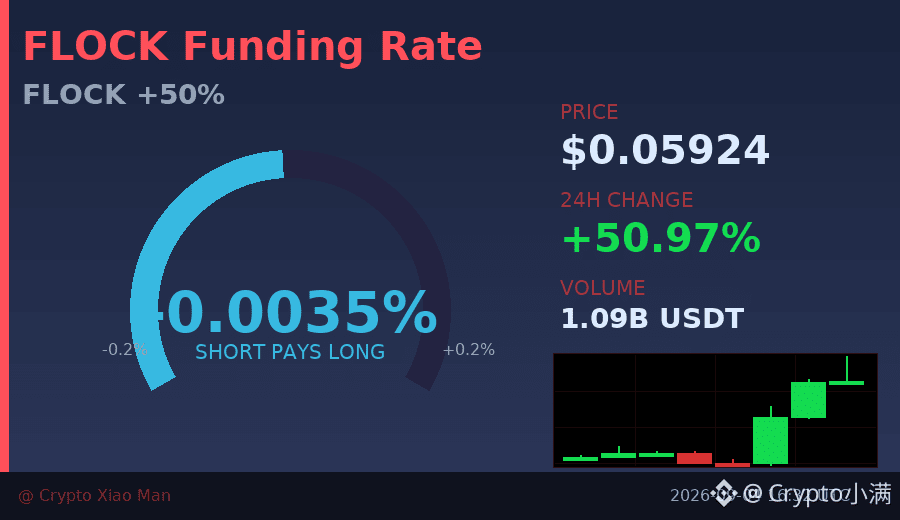
Behind the 50% surge, funds are quietly flowing out — FLOCK rose to 0.059 today, with trading volume surging to 108 million USDT, but the funding rate is negative at -0.0035%.
What does this mean? Although the longs are pushing the price higher (long positions account for 55%), the number of people actually willing to pay to hold positions is decreasing. The hourly candlesticks have closed higher in succession, looking strong, but divergence in the funding rate often suggests insufficient willingness to chase the move.
We just posted about FLOCK recently, and this time we’re looking at it from a different angle: this is not a buy-the-breakout signal, but a reminder — when price and volume rise together, pay even more attention to sentiment in the funding market.
$FLOCK #资金费率背离 #50%涨幅
Click the small card below to quickly view the market 👇
Behind the 50% surge, funds are quietly flowing out — FLOCK rose to 0.059 today, with trading volume surging to 108 million USDT, but the funding rate is negative at -0.0035%.
What does this mean? Although the longs are pushing the price higher (long positions account for 55%), the number of people actually willing to pay to hold positions is decreasing. The hourly candlesticks have closed higher in succession, looking strong, but divergence in the funding rate often suggests insufficient willingness to chase the move.
We just posted about FLOCK recently, and this time we’re looking at it from a different angle: this is not a buy-the-breakout signal, but a reminder — when price and volume rise together, pay even more attention to sentiment in the funding market.
$FLOCK #资金费率背离 #50%涨幅
Click the small card below to quickly view the market 👇
What does this mean? Although the longs are pushing the price higher (long positions account for 55%), the number of people actually willing to pay to hold positions is decreasing. The hourly candlesticks have closed higher in succession, looking strong, but divergence in the funding rate often suggests insufficient willingness to chase the move.
We just posted about FLOCK recently, and this time we’re looking at it from a different angle: this is not a buy-the-breakout signal, but a reminder — when price and volume rise together, pay even more attention to sentiment in the funding market.
$FLOCK #资金费率背离 #50%涨幅
Click the small card below to quickly view the market 👇
26
·
--
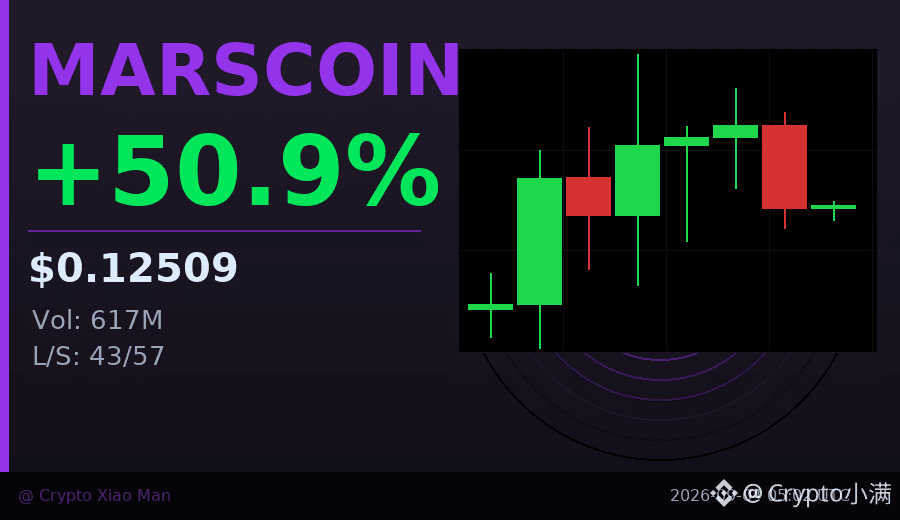
50% price increase, but shorts make up 57%—the market is doubting this rally.
MARSCOIN surged from 0.082 to 0.142, strengthening overall within 8 hours.
Trading volume is 617 million USDT, and the funding rate is only 0.005%, so it’s not overheated.
What’s interesting is: although the price is making new highs, the long/short ratio shows more people are betting on a decline.
This kind of divergence usually points to two possibilities: either the shorts get squeezed and the price accelerates upward,
or the main players use the rally to distribute/exit.
I’m inclined to wait and watch first, until the direction becomes clear. If it holds above 0.13,
then the bulls truly have the upper hand.
$MARSCOIN #多空分歧 #50%涨幅
Click the small card below to quickly view the行情👇
50% price increase, but shorts make up 57%—the market is doubting this rally.
MARSCOIN surged from 0.082 to 0.142, strengthening overall within 8 hours.
Trading volume is 617 million USDT, and the funding rate is only 0.005%, so it’s not overheated.
What’s interesting is: although the price is making new highs, the long/short ratio shows more people are betting on a decline.
This kind of divergence usually points to two possibilities: either the shorts get squeezed and the price accelerates upward,
or the main players use the rally to distribute/exit.
I’m inclined to wait and watch first, until the direction becomes clear. If it holds above 0.13,
then the bulls truly have the upper hand.
$MARSCOIN #多空分歧 #50%涨幅
Click the small card below to quickly view the行情👇
MARSCOIN surged from 0.082 to 0.142, strengthening overall within 8 hours.
Trading volume is 617 million USDT, and the funding rate is only 0.005%, so it’s not overheated.
What’s interesting is: although the price is making new highs, the long/short ratio shows more people are betting on a decline.
This kind of divergence usually points to two possibilities: either the shorts get squeezed and the price accelerates upward,
or the main players use the rally to distribute/exit.
I’m inclined to wait and watch first, until the direction becomes clear. If it holds above 0.13,
then the bulls truly have the upper hand.
$MARSCOIN #多空分歧 #50%涨幅
Click the small card below to quickly view the行情👇
15
·
--
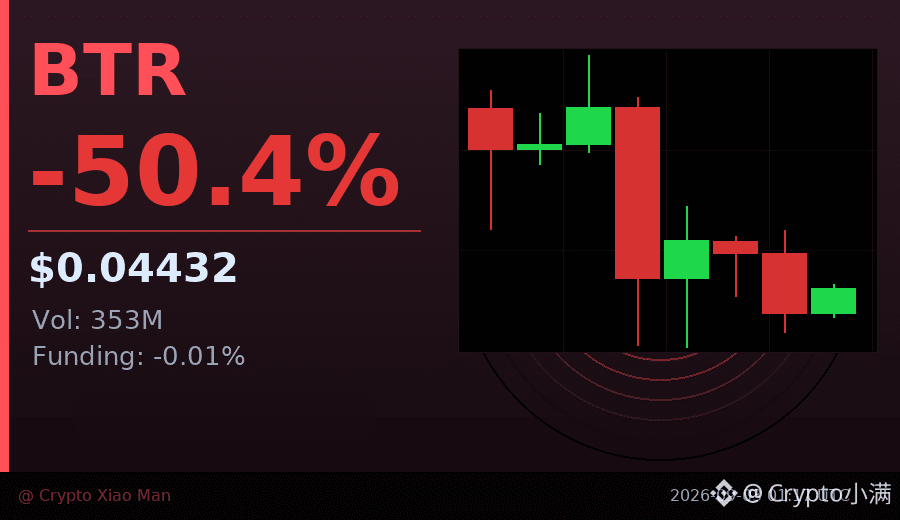
65% of people are going long, and the result is a 50% drop in 24 hours—this is the typical backlash of crowded trading.
Today, BTR was directly hammered from 0.099 to 0.044. Trading volume hit $350 million, and the 4th K-line in a single hour saw a sell-off of $147 million—clearly a long-sided panic liquidation.
The funding rate has already turned negative, indicating that shorts have started to take control. In this kind of extreme market, trying to bottom-fish against the trend is like catching a falling knife—wait for the handover of positions and then reassess.
$BTR #多头踩踏 #50%
Click the card below to quickly view the chart👇
65% of people are going long, and the result is a 50% drop in 24 hours—this is the typical backlash of crowded trading.
Today, BTR was directly hammered from 0.099 to 0.044. Trading volume hit $350 million, and the 4th K-line in a single hour saw a sell-off of $147 million—clearly a long-sided panic liquidation.
The funding rate has already turned negative, indicating that shorts have started to take control. In this kind of extreme market, trying to bottom-fish against the trend is like catching a falling knife—wait for the handover of positions and then reassess.
$BTR #多头踩踏 #50%
Click the card below to quickly view the chart👇
Today, BTR was directly hammered from 0.099 to 0.044. Trading volume hit $350 million, and the 4th K-line in a single hour saw a sell-off of $147 million—clearly a long-sided panic liquidation.
The funding rate has already turned negative, indicating that shorts have started to take control. In this kind of extreme market, trying to bottom-fish against the trend is like catching a falling knife—wait for the handover of positions and then reassess.
$BTR #多头踩踏 #50%
Click the card below to quickly view the chart👇
53

·
--
I’ve been tracking the latest CoinGecko buzz and Uniswap (UNI) jumped +8.2%, while Arbitrum (ARB) surged +12.5%—both cracking the top‑30 ranks. 🚀
Pond (PONS) rallied +5.4% at rank #132, Ramses (RAM) climbed +7.1% to #354, and up (UP) ticked up +3.9% around #704. 🌊
I also spotted Pump.fun (PUMP) gaining +9.0% at #50 and Pudgy Penguins (PENGU) up +4.6% near #101. I’m keeping an eye on these movers for my next trade. 🎯
$SC, $ARB, $USELESS
I’ve been tracking the latest CoinGecko buzz and Uniswap (UNI) jumped +8.2%, while Arbitrum (ARB) surged +12.5%—both cracking the top‑30 ranks. 🚀
Pond (PONS) rallied +5.4% at rank #132, Ramses (RAM) climbed +7.1% to #354, and up (UP) ticked up +3.9% around #704. 🌊
I also spotted Pump.fun (PUMP) gaining +9.0% at #50 and Pudgy Penguins (PENGU) up +4.6% near #101. I’m keeping an eye on these movers for my next trade. 🎯
$SC , $ARB , $USELESS
Pond (PONS) rallied +5.4% at rank #132, Ramses (RAM) climbed +7.1% to #354, and up (UP) ticked up +3.9% around #704. 🌊
I also spotted Pump.fun (PUMP) gaining +9.0% at #50 and Pudgy Penguins (PENGU) up +4.6% near #101. I’m keeping an eye on these movers for my next trade. 🎯
$SC , $ARB , $USELESS
340
·
--
Pump.fun (PUMPUSDT) is trending on CoinGecko!
Rank: #50
The altcoin market is displaying positive upward momentum, highlighted by impressive gains in decentralized finance (DeFi) and major Layer-1 protocols. Leading the charge is Uniswap (UNI), alongside solid performances from NEAR Protocol, Polkadot (DOT), and Ethereum (ETH).
DeFi Takes Center Stage: UNI Leads the Rally
Uniswap (UNI) has emerged as the standout performer of the day, rallying **12.33%** over the past 24 hours to reach **.81**. The token touched a 24-hour high of **.92**, starting from a low of .046.
Crucially, this price surge is backed by substantial volume, generating over **1.84 million** in quote volume across 300,000+ trades on Binance. High trading volume during a breakout often signals strong market conviction and active participation from both retail and institutional traders.
Layer-1 Networks Show Sustained Strength
Broad-market buying interest extends beyond DeFi into core smart-contract platforms:
* **NEAR Protocol (NEAR):** Up **5.15%**, trading at **.939** with 0.11M in trading volume. NEAR hit a daily peak of .995, showing resilience near key psychological resistance levels.
* **Polkadot (DOT):** Gained **4.45%** to reach **/bin/sh.869**, recovering steadily from its daily low of /bin/sh.820.
* **Cardano (ADA):** Advanced **2.25%** to **/bin/sh.2004**, backed by over 92 million ADA traded.
* **Chainlink (LINK):** Rose **1.78%** to **1.471**, maintaining its steady upward structure with over
Pump.fun (PUMPUSDT) is trending on CoinGecko!
Rank: #50
The altcoin market is displaying positive upward momentum, highlighted by impressive gains in decentralized finance (DeFi) and major Layer-1 protocols. Leading the charge is Uniswap (UNI), alongside solid performances from NEAR Protocol, Polkadot (DOT), and Ethereum (ETH).
DeFi Takes Center Stage: UNI Leads the Rally
Uniswap (UNI) has emerged as the standout performer of the day, rallying **12.33%** over the past 24 hours to reach **.81**. The token touched a 24-hour high of **.92**, starting from a low of .046.
Crucially, this price surge is backed by substantial volume, generating over **1.84 million** in quote volume across 300,000+ trades on Binance. High trading volume during a breakout often signals strong market conviction and active participation from both retail and institutional traders.
Layer-1 Networks Show Sustained Strength
Broad-market buying interest extends beyond DeFi into core smart-contract platforms:
* **NEAR Protocol (NEAR):** Up **5.15%**, trading at **.939** with 0.11M in trading volume. NEAR hit a daily peak of .995, showing resilience near key psychological resistance levels.
* **Polkadot (DOT):** Gained **4.45%** to reach **/bin/sh.869**, recovering steadily from its daily low of /bin/sh.820.
* **Cardano (ADA):** Advanced **2.25%** to **/bin/sh.2004**, backed by over 92 million ADA traded.
* **Chainlink (LINK):** Rose **1.78%** to **1.471**, maintaining its steady upward structure with over
Rank: #50
The altcoin market is displaying positive upward momentum, highlighted by impressive gains in decentralized finance (DeFi) and major Layer-1 protocols. Leading the charge is Uniswap (UNI), alongside solid performances from NEAR Protocol, Polkadot (DOT), and Ethereum (ETH).
DeFi Takes Center Stage: UNI Leads the Rally
Uniswap (UNI) has emerged as the standout performer of the day, rallying **12.33%** over the past 24 hours to reach **.81**. The token touched a 24-hour high of **.92**, starting from a low of .046.
Crucially, this price surge is backed by substantial volume, generating over **1.84 million** in quote volume across 300,000+ trades on Binance. High trading volume during a breakout often signals strong market conviction and active participation from both retail and institutional traders.
Layer-1 Networks Show Sustained Strength
Broad-market buying interest extends beyond DeFi into core smart-contract platforms:
* **NEAR Protocol (NEAR):** Up **5.15%**, trading at **.939** with 0.11M in trading volume. NEAR hit a daily peak of .995, showing resilience near key psychological resistance levels.
* **Polkadot (DOT):** Gained **4.45%** to reach **/bin/sh.869**, recovering steadily from its daily low of /bin/sh.820.
* **Cardano (ADA):** Advanced **2.25%** to **/bin/sh.2004**, backed by over 92 million ADA traded.
* **Chainlink (LINK):** Rose **1.78%** to **1.471**, maintaining its steady upward structure with over
35
·
--
Trending: Pump.fun (PUMPUSDT)🔥 Pump.fun (PUMPUSDT) is trending on CoinGecko!
Rank: #50
On August 31, 2026 at 13:32 UTC, the market data feed for Binance Square returned null values for Bitcoin (BTC) and Ethereum (ETH) and empty arrays for top movers, gainers, and losers. While this might look like a market anomaly, it’s more often a technical hiccup—such as a brief API delay, scheduled maintenance, or a temporary synchronization issue between exchanges and data aggregators.
**Why data can disappear momentarily**
1. **Feed synchronization:** Binance Square pulls price ticks from multiple liquidity providers. If one provider experiences latency, the aggregate view may show nulls until the missing stream catches up.
2. **System maintenance:** Periodic upgrades to the data pipeline can pause the feed for a few seconds to ensure accuracy and security.
3. **Network congestion:** Extreme volatility or high trading volume can temporarily overwhelm the ingestion pipelines, causing a brief gap in reported figures.
**What traders should do during a data gap**
- **Verify the source:** Check the raw ticker on the Binance spot market or a trusted third‑party charting platform (e.g., TradingView) to confirm whether prices are truly stalled or if the display is simply outdated.
- **Look at higher‑timeframe context:** Even if the latest tick is missing, the last known price and recent volume profile can still give clues about market sentiment. For instance, if BTC was trading steadily around 7,500 with moderate volume just before the gap, a sudden breakout would likely be accompanied by a noticeable volume spike—something you’d still see in the order book.
- **Use alternative indicators:** On‑chain metrics (e.g., Bitcoin hash rate, Ethereum gas fees), futures basis, and funding rates often continue to update even when spot price feeds lag. These can help gauge whether the market is leaning bullish or bearish.
- **Stay patient and avoid impulsive moves:** Acting on incomplete data increases the risk of entering a position based on stale or erroneous information. If you need to execute a trade immediately, consider using limit orders priced near the last reliable tick, which protects you from extreme slippage should the price jump once the feed resumes.
**Takeaway**
Temporary nulls in market data are usually a technical issue rather than a sign of a market crash or surge. By cross‑checking multiple sources, consulting on‑chain and derivatives data, and exercising caution with order placement, traders can navigate these brief blind spots without compromising their strategy. Remember, reliable analysis rests on a mosaic of information—not just a single price tick.
#pump #crypto #trending #CoinGecko
Trending: Pump.fun (PUMPUSDT)
🔥 Pump.fun (PUMPUSDT) is trending on CoinGecko!
Rank: #50
On August 31, 2026 at 13:32 UTC, the market data feed for Binance Square returned null values for Bitcoin (BTC) and Ethereum (ETH) and empty arrays for top movers, gainers, and losers. While this might look like a market anomaly, it’s more often a technical hiccup—such as a brief API delay, scheduled maintenance, or a temporary synchronization issue between exchanges and data aggregators.
**Why data can disappear momentarily**
1. **Feed synchronization:** Binance Square pulls price ticks from multiple liquidity providers. If one provider experiences latency, the aggregate view may show nulls until the missing stream catches up.
2. **System maintenance:** Periodic upgrades to the data pipeline can pause the feed for a few seconds to ensure accuracy and security.
3. **Network congestion:** Extreme volatility or high trading volume can temporarily overwhelm the ingestion pipelines, causing a brief gap in reported figures.
**What traders should do during a data gap**
- **Verify the source:** Check the raw ticker on the Binance spot market or a trusted third‑party charting platform (e.g., TradingView) to confirm whether prices are truly stalled or if the display is simply outdated.
- **Look at higher‑timeframe context:** Even if the latest tick is missing, the last known price and recent volume profile can still give clues about market sentiment. For instance, if BTC was trading steadily around 7,500 with moderate volume just before the gap, a sudden breakout would likely be accompanied by a noticeable volume spike—something you’d still see in the order book.
- **Use alternative indicators:** On‑chain metrics (e.g., Bitcoin hash rate, Ethereum gas fees), futures basis, and funding rates often continue to update even when spot price feeds lag. These can help gauge whether the market is leaning bullish or bearish.
- **Stay patient and avoid impulsive moves:** Acting on incomplete data increases the risk of entering a position based on stale or erroneous information. If you need to execute a trade immediately, consider using limit orders priced near the last reliable tick, which protects you from extreme slippage should the price jump once the feed resumes.
**Takeaway**
Temporary nulls in market data are usually a technical issue rather than a sign of a market crash or surge. By cross‑checking multiple sources, consulting on‑chain and derivatives data, and exercising caution with order placement, traders can navigate these brief blind spots without compromising their strategy. Remember, reliable analysis rests on a mosaic of information—not just a single price tick.
#pump #crypto #trending #CoinGecko
Rank: #50
On August 31, 2026 at 13:32 UTC, the market data feed for Binance Square returned null values for Bitcoin (BTC) and Ethereum (ETH) and empty arrays for top movers, gainers, and losers. While this might look like a market anomaly, it’s more often a technical hiccup—such as a brief API delay, scheduled maintenance, or a temporary synchronization issue between exchanges and data aggregators.
**Why data can disappear momentarily**
1. **Feed synchronization:** Binance Square pulls price ticks from multiple liquidity providers. If one provider experiences latency, the aggregate view may show nulls until the missing stream catches up.
2. **System maintenance:** Periodic upgrades to the data pipeline can pause the feed for a few seconds to ensure accuracy and security.
3. **Network congestion:** Extreme volatility or high trading volume can temporarily overwhelm the ingestion pipelines, causing a brief gap in reported figures.
**What traders should do during a data gap**
- **Verify the source:** Check the raw ticker on the Binance spot market or a trusted third‑party charting platform (e.g., TradingView) to confirm whether prices are truly stalled or if the display is simply outdated.
- **Look at higher‑timeframe context:** Even if the latest tick is missing, the last known price and recent volume profile can still give clues about market sentiment. For instance, if BTC was trading steadily around 7,500 with moderate volume just before the gap, a sudden breakout would likely be accompanied by a noticeable volume spike—something you’d still see in the order book.
- **Use alternative indicators:** On‑chain metrics (e.g., Bitcoin hash rate, Ethereum gas fees), futures basis, and funding rates often continue to update even when spot price feeds lag. These can help gauge whether the market is leaning bullish or bearish.
- **Stay patient and avoid impulsive moves:** Acting on incomplete data increases the risk of entering a position based on stale or erroneous information. If you need to execute a trade immediately, consider using limit orders priced near the last reliable tick, which protects you from extreme slippage should the price jump once the feed resumes.
**Takeaway**
Temporary nulls in market data are usually a technical issue rather than a sign of a market crash or surge. By cross‑checking multiple sources, consulting on‑chain and derivatives data, and exercising caution with order placement, traders can navigate these brief blind spots without compromising their strategy. Remember, reliable analysis rests on a mosaic of information—not just a single price tick.
#pump #crypto #trending #CoinGecko
43
·
--
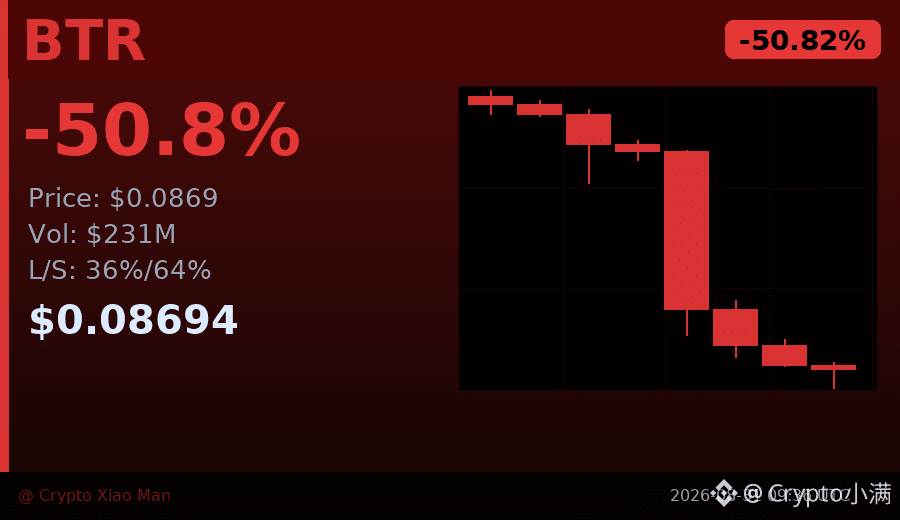
To be honest, $BTR —I had to look at today’s drop twice before I confirmed it. Within 24 hours, it was basically slashed in half: from the highest $0.183 down to the current $0.087, a drop of over 50%.
This volume spike is extremely abnormal. Look at the data: when the price was around $0.15, the trading volume on a single candlestick suddenly surged to 400 million USDT—several times higher than the previous average. This kind of "high-volume crash" usually indicates that large holders are dumping in a concentrated manner, not that retail traders are selling slowly over time.
Then check the long/short ratio: now 64% of people are betting on the drop, while only 36% are betting on the rise. This figure itself is a signal—when most participants in the market start shorting, you need to be careful about a "short squeeze trap" (i.e., the price suddenly rebounds and the people who had been shorting are forced to close at a loss). That process can temporarily push the price higher.
But based on the current chart, the candlesticks are still closing in the negative consecutively, and selling pressure hasn’t clearly weakened. If, going forward, you see trading volume noticeably contracting around $0.08, then that would be a sign that the downtrend might be slowing.
I’ll focus especially on whether the $0.082 low holds. If it breaks, this wave of panic may not be over yet.
$BTR #腰斩暴跌 #50% drop
Click the small card below to quickly check the market👇
To be honest, $BTR —I had to look at today’s drop twice before I confirmed it. Within 24 hours, it was basically slashed in half: from the highest $0.183 down to the current $0.087, a drop of over 50%.
This volume spike is extremely abnormal. Look at the data: when the price was around $0.15, the trading volume on a single candlestick suddenly surged to 400 million USDT—several times higher than the previous average. This kind of "high-volume crash" usually indicates that large holders are dumping in a concentrated manner, not that retail traders are selling slowly over time.
Then check the long/short ratio: now 64% of people are betting on the drop, while only 36% are betting on the rise. This figure itself is a signal—when most participants in the market start shorting, you need to be careful about a "short squeeze trap" (i.e., the price suddenly rebounds and the people who had been shorting are forced to close at a loss). That process can temporarily push the price higher.
But based on the current chart, the candlesticks are still closing in the negative consecutively, and selling pressure hasn’t clearly weakened. If, going forward, you see trading volume noticeably contracting around $0.08, then that would be a sign that the downtrend might be slowing.
I’ll focus especially on whether the $0.082 low holds. If it breaks, this wave of panic may not be over yet.
$BTR #腰斩暴跌 #50% drop
Click the small card below to quickly check the market👇
This volume spike is extremely abnormal. Look at the data: when the price was around $0.15, the trading volume on a single candlestick suddenly surged to 400 million USDT—several times higher than the previous average. This kind of "high-volume crash" usually indicates that large holders are dumping in a concentrated manner, not that retail traders are selling slowly over time.
Then check the long/short ratio: now 64% of people are betting on the drop, while only 36% are betting on the rise. This figure itself is a signal—when most participants in the market start shorting, you need to be careful about a "short squeeze trap" (i.e., the price suddenly rebounds and the people who had been shorting are forced to close at a loss). That process can temporarily push the price higher.
But based on the current chart, the candlesticks are still closing in the negative consecutively, and selling pressure hasn’t clearly weakened. If, going forward, you see trading volume noticeably contracting around $0.08, then that would be a sign that the downtrend might be slowing.
I’ll focus especially on whether the $0.082 low holds. If it breaks, this wave of panic may not be over yet.
$BTR #腰斩暴跌 #50% drop
Click the small card below to quickly check the market👇
98
·
--
Increased by 50%, yet there are even more people shorting it.
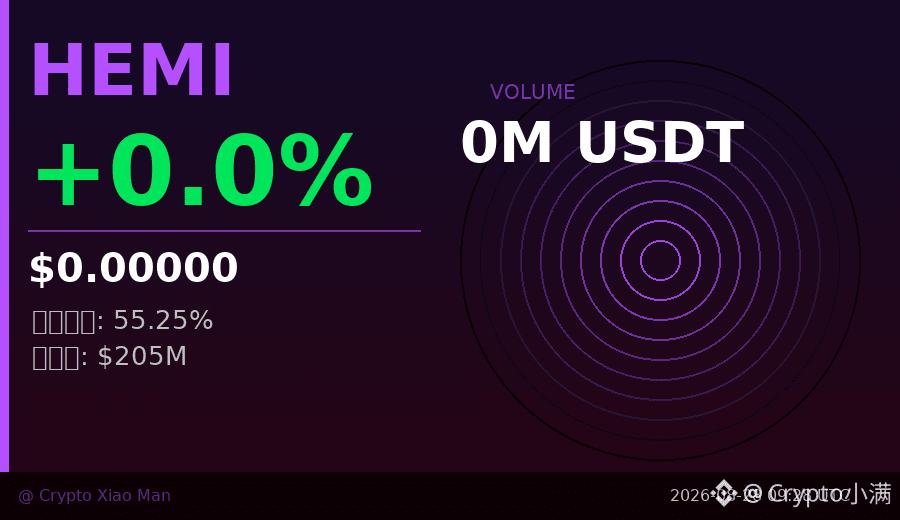
Today, HEMI’s price surged from 0.0078 straight to 0.0125—up more than 50%. A single-day move of this magnitude is rare even among smaller coins.
But just looking at the long/short ratio is a bit interesting: shorts account for 55.25%, while longs are only 44.75%. In other words, more than half the market is betting that it will drop back.
There’s a professional term for this kind of situation: a “short squeeze.” As the coin price keeps rising, short positions lose more and more. When they can’t take it anymore, they’re forced to close and buy back—only pushing the price higher.
The funding rate is currently only 0.005%, which is very low. That suggests the longs haven’t reached the point where they have to “pay up” at high prices yet, so there’s no immediate ceiling above them.
Trading volume is over 200 million, which is a big number for HEMI—indicating real capital has entered this move, not a fakeout.
Now the question is: will the shorts continue to get squeezed, or after this rally will we see a round of pullback?
Price is near the intraday high around 0.0125. If shorts start closing in a concentrated way, there may still be another push in the short term. But if volume can’t keep up, a dip back toward the 0.010 area would also be perfectly normal.
Watch how trading volume changes before today’s close—that’s the real signal for direction.
$HEMI #逼空行情 #50%涨幅
Click the small card below to quickly view the行情👇
Increased by 50%, yet there are even more people shorting it.
Today, HEMI’s price surged from 0.0078 straight to 0.0125—up more than 50%. A single-day move of this magnitude is rare even among smaller coins.
But just looking at the long/short ratio is a bit interesting: shorts account for 55.25%, while longs are only 44.75%. In other words, more than half the market is betting that it will drop back.
There’s a professional term for this kind of situation: a “short squeeze.” As the coin price keeps rising, short positions lose more and more. When they can’t take it anymore, they’re forced to close and buy back—only pushing the price higher.
The funding rate is currently only 0.005%, which is very low. That suggests the longs haven’t reached the point where they have to “pay up” at high prices yet, so there’s no immediate ceiling above them.
Trading volume is over 200 million, which is a big number for HEMI—indicating real capital has entered this move, not a fakeout.
Now the question is: will the shorts continue to get squeezed, or after this rally will we see a round of pullback?
Price is near the intraday high around 0.0125. If shorts start closing in a concentrated way, there may still be another push in the short term. But if volume can’t keep up, a dip back toward the 0.010 area would also be perfectly normal.
Watch how trading volume changes before today’s close—that’s the real signal for direction.
$HEMI #逼空行情 #50%涨幅
Click the small card below to quickly view the行情👇
Today, HEMI’s price surged from 0.0078 straight to 0.0125—up more than 50%. A single-day move of this magnitude is rare even among smaller coins.
But just looking at the long/short ratio is a bit interesting: shorts account for 55.25%, while longs are only 44.75%. In other words, more than half the market is betting that it will drop back.
There’s a professional term for this kind of situation: a “short squeeze.” As the coin price keeps rising, short positions lose more and more. When they can’t take it anymore, they’re forced to close and buy back—only pushing the price higher.
The funding rate is currently only 0.005%, which is very low. That suggests the longs haven’t reached the point where they have to “pay up” at high prices yet, so there’s no immediate ceiling above them.
Trading volume is over 200 million, which is a big number for HEMI—indicating real capital has entered this move, not a fakeout.
Now the question is: will the shorts continue to get squeezed, or after this rally will we see a round of pullback?
Price is near the intraday high around 0.0125. If shorts start closing in a concentrated way, there may still be another push in the short term. But if volume can’t keep up, a dip back toward the 0.010 area would also be perfectly normal.
Watch how trading volume changes before today’s close—that’s the real signal for direction.
$HEMI #逼空行情 #50%涨幅
Click the small card below to quickly view the行情👇
128
Log in to explore more content
Join global crypto users on Binance Square
⚡️ Get latest and useful information about crypto.
💬 Trusted by the world’s largest crypto exchange.
👍 Discover real insights from verified creators.
Email / Phone number
Trending Topics
1
#BitgetHackerMoves$83MStolenXRP
372 views
26 Discussing
2
#SOLSpotETFWeeklyInflow$188M
322 views
35 Discussing
3
#StrategyStriveAdd2305BitcoinThisWeek
30,261 views
900 Discussing
4
#TrumpRejectsIranHormuzReopening
32,771 views
734 Discussing
5
#CircleTetherFreezeBitgetHackerWallet
49,291 views
783 Discussing
6
#SECSaysTokenBuybacksNotAutoSecurities
23,904 views
420 Discussing
7
#ChinaUSAgreeOn$30BTariffCut
1,150 views
30 Discussing
8
#CoinMarketCapCompletesCoinglassAcquisition
41,043 views
563 Discussing
9
#CircleMints500MUSDCOnSolana
219,507 views
3,181 Discussing
10
#PolymarketBankFailureBetsDrawFDICConcern
187,386 views
2,414 Discussing