
#1hchart
1hchart
6,506 views
57 Discussing
Hot
Latest


·
--
Bullish
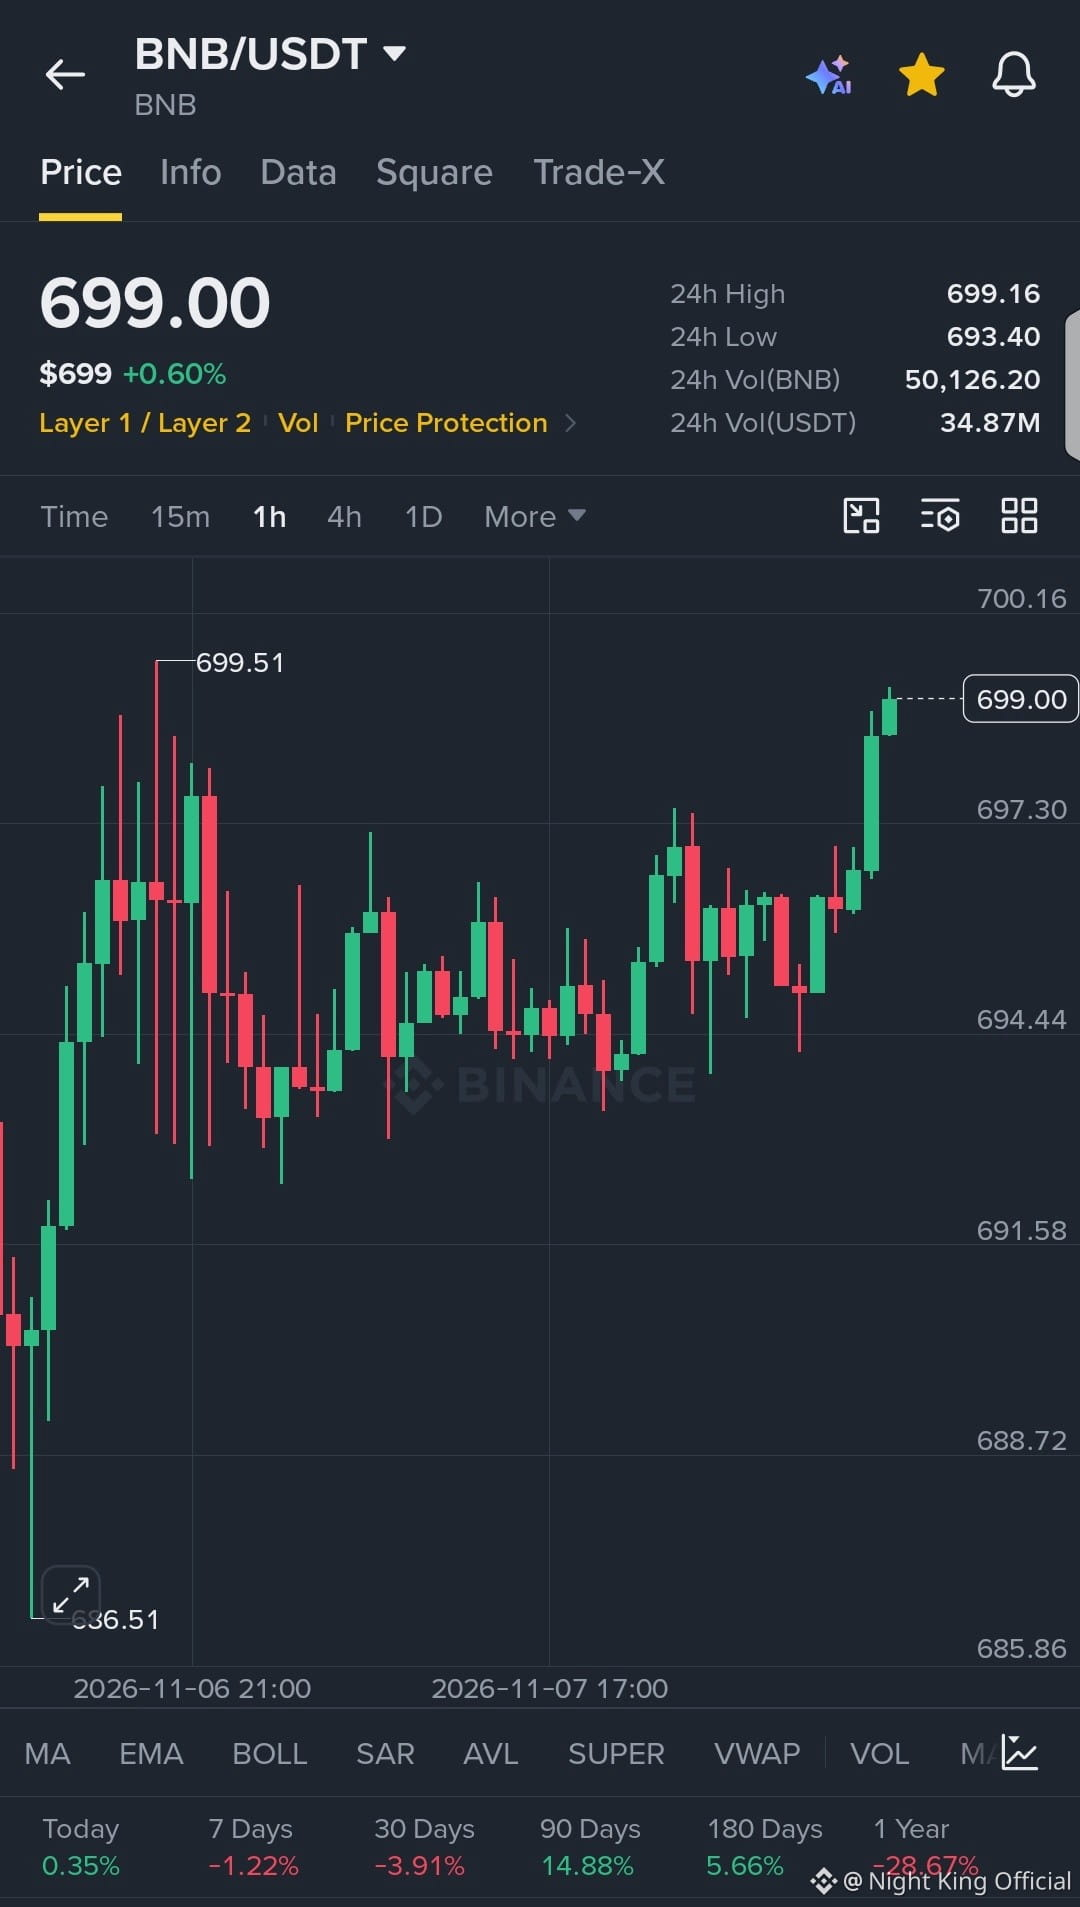
$BNB Pushes Up Into the 699.16 24h High on Strong 1H Candles 🚀
Bias: Long
Entry Range: 697.30 – 699.00
TP1: 699.16
TP2: 699.51
TP3: 700.16
SL: 1H close below 694.44
Momentum view: The last few 1H candles on $BNB are green and climbing, and price is now pressing right under the 699.51 swing high, but the range above is tight and a rejection there is possible.
Can $BNB close a 1H candle above 699.51, or does it get turned back again? Tell me what you think.
Not financial advice. DYOR.
#BNB #Binance #CryptoMomentum #1HChart #WriteToEarn
{spot}(BNBUSDT)
$BNB Pushes Up Into the 699.16 24h High on Strong 1H Candles 🚀
Bias: Long
Entry Range: 697.30 – 699.00
TP1: 699.16
TP2: 699.51
TP3: 700.16
SL: 1H close below 694.44
Momentum view: The last few 1H candles on $BNB are green and climbing, and price is now pressing right under the 699.51 swing high, but the range above is tight and a rejection there is possible.
Can $BNB close a 1H candle above 699.51, or does it get turned back again? Tell me what you think.
Not financial advice. DYOR.
#BNB #Binance #CryptoMomentum #1HChart #WriteToEarn
Bias: Long
Entry Range: 697.30 – 699.00
TP1: 699.16
TP2: 699.51
TP3: 700.16
SL: 1H close below 694.44
Momentum view: The last few 1H candles on $BNB are green and climbing, and price is now pressing right under the 699.51 swing high, but the range above is tight and a rejection there is possible.
Can $BNB close a 1H candle above 699.51, or does it get turned back again? Tell me what you think.
Not financial advice. DYOR.
#BNB #Binance #CryptoMomentum #1HChart #WriteToEarn
1
1
369
·
--
Bullish
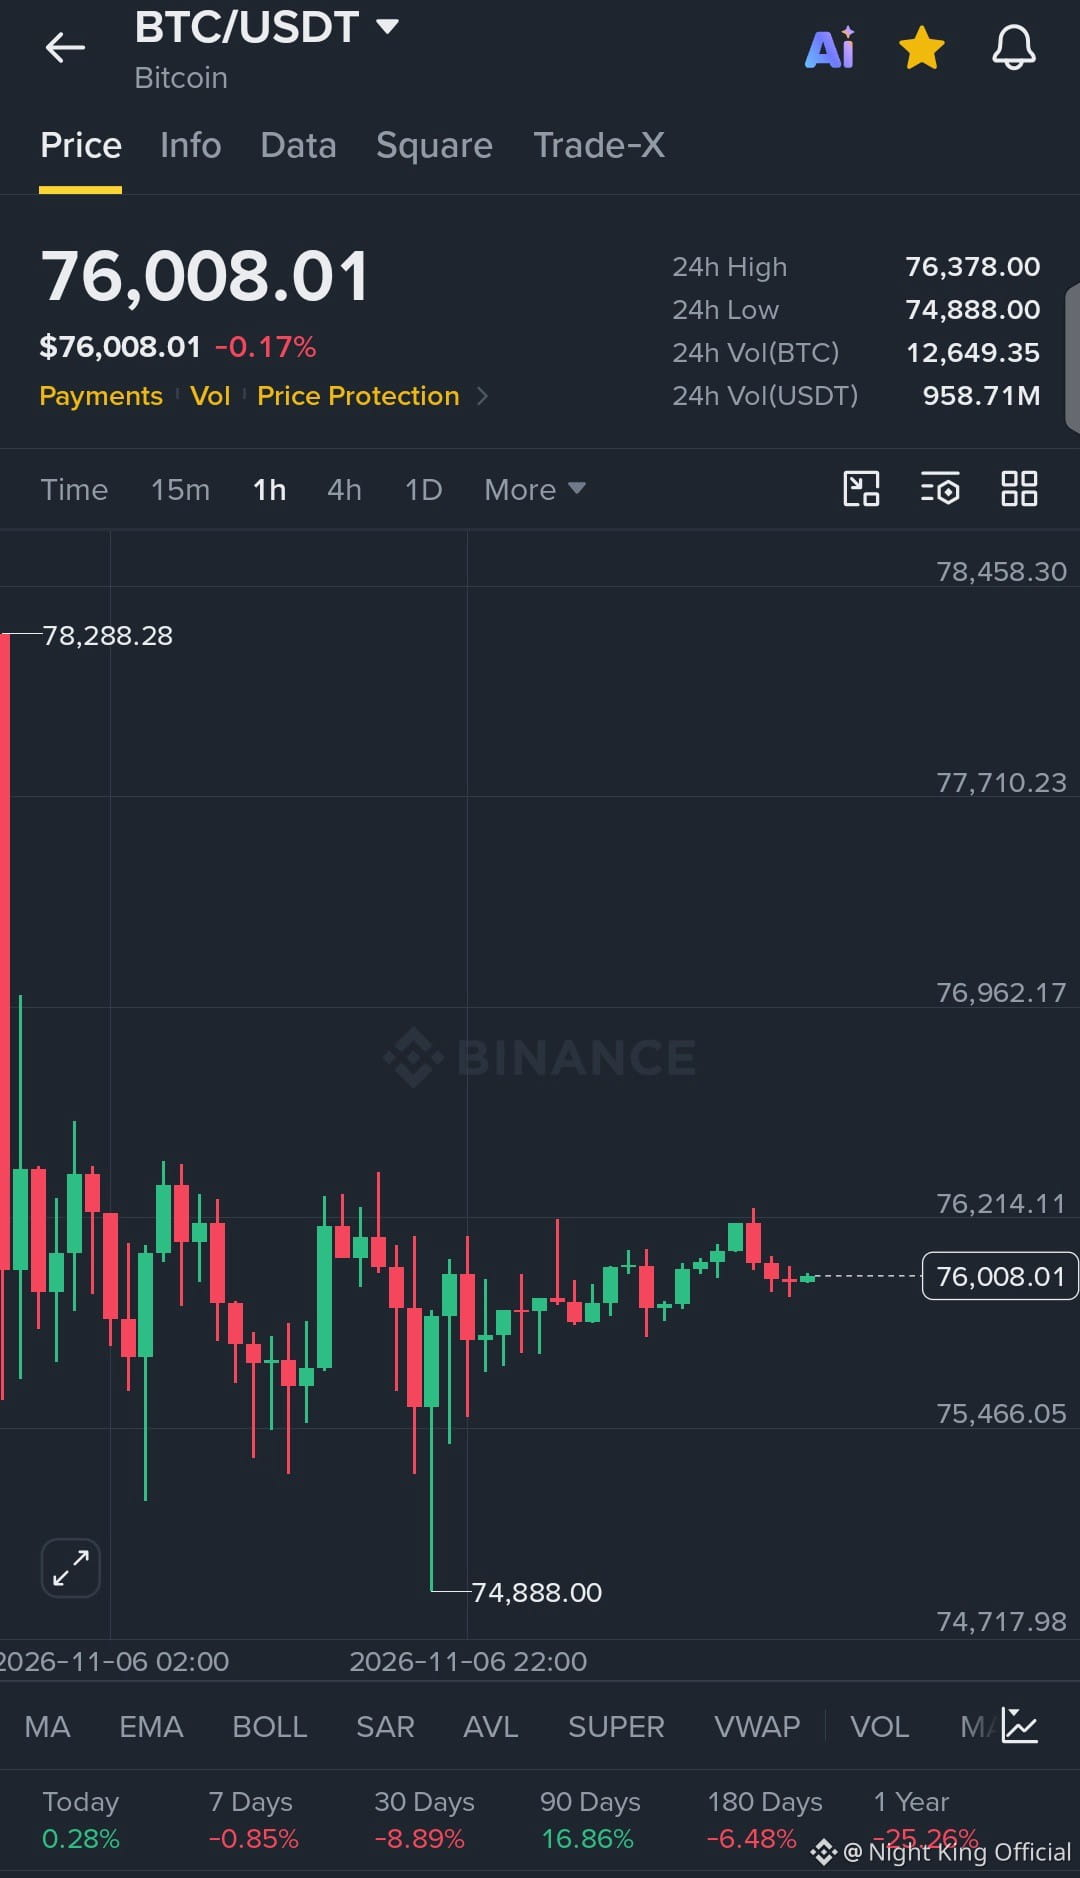
$BTC Coils Between 74,888.00 and 76,378.00 on the 1H Chart 🎯
Action: Short
Entry Range: 76,008.01 – 76,214.11
TP1: 75,466.05
TP2: 74,888.00
TP3: 74,717.98
SL: 1H close above 76,378.00
Chart note: After the sharp drop from the 78,288.28 swing high, $BTC has moved sideways in small 1H candles and failed to push above the 24h High at 76,378.00, while the 24h Low at 74,888.00 remains the key level underneath.
Does the 24h Low give way on the next test, or will buyers defend it again? Share your view below.
Not financial advice. DYOR.
#BTC #CryptoSignals #1HChart #WriteToEarn
{spot}(BTCUSDT)
$BTC Coils Between 74,888.00 and 76,378.00 on the 1H Chart 🎯
Action: Short
Entry Range: 76,008.01 – 76,214.11
TP1: 75,466.05
TP2: 74,888.00
TP3: 74,717.98
SL: 1H close above 76,378.00
Chart note: After the sharp drop from the 78,288.28 swing high, $BTC has moved sideways in small 1H candles and failed to push above the 24h High at 76,378.00, while the 24h Low at 74,888.00 remains the key level underneath.
Does the 24h Low give way on the next test, or will buyers defend it again? Share your view below.
Not financial advice. DYOR.
#BTC #CryptoSignals #1HChart #WriteToEarn
Action: Short
Entry Range: 76,008.01 – 76,214.11
TP1: 75,466.05
TP2: 74,888.00
TP3: 74,717.98
SL: 1H close above 76,378.00
Chart note: After the sharp drop from the 78,288.28 swing high, $BTC has moved sideways in small 1H candles and failed to push above the 24h High at 76,378.00, while the 24h Low at 74,888.00 remains the key level underneath.
Does the 24h Low give way on the next test, or will buyers defend it again? Share your view below.
Not financial advice. DYOR.
#BTC #CryptoSignals #1HChart #WriteToEarn
1
234
·
--
Bullish
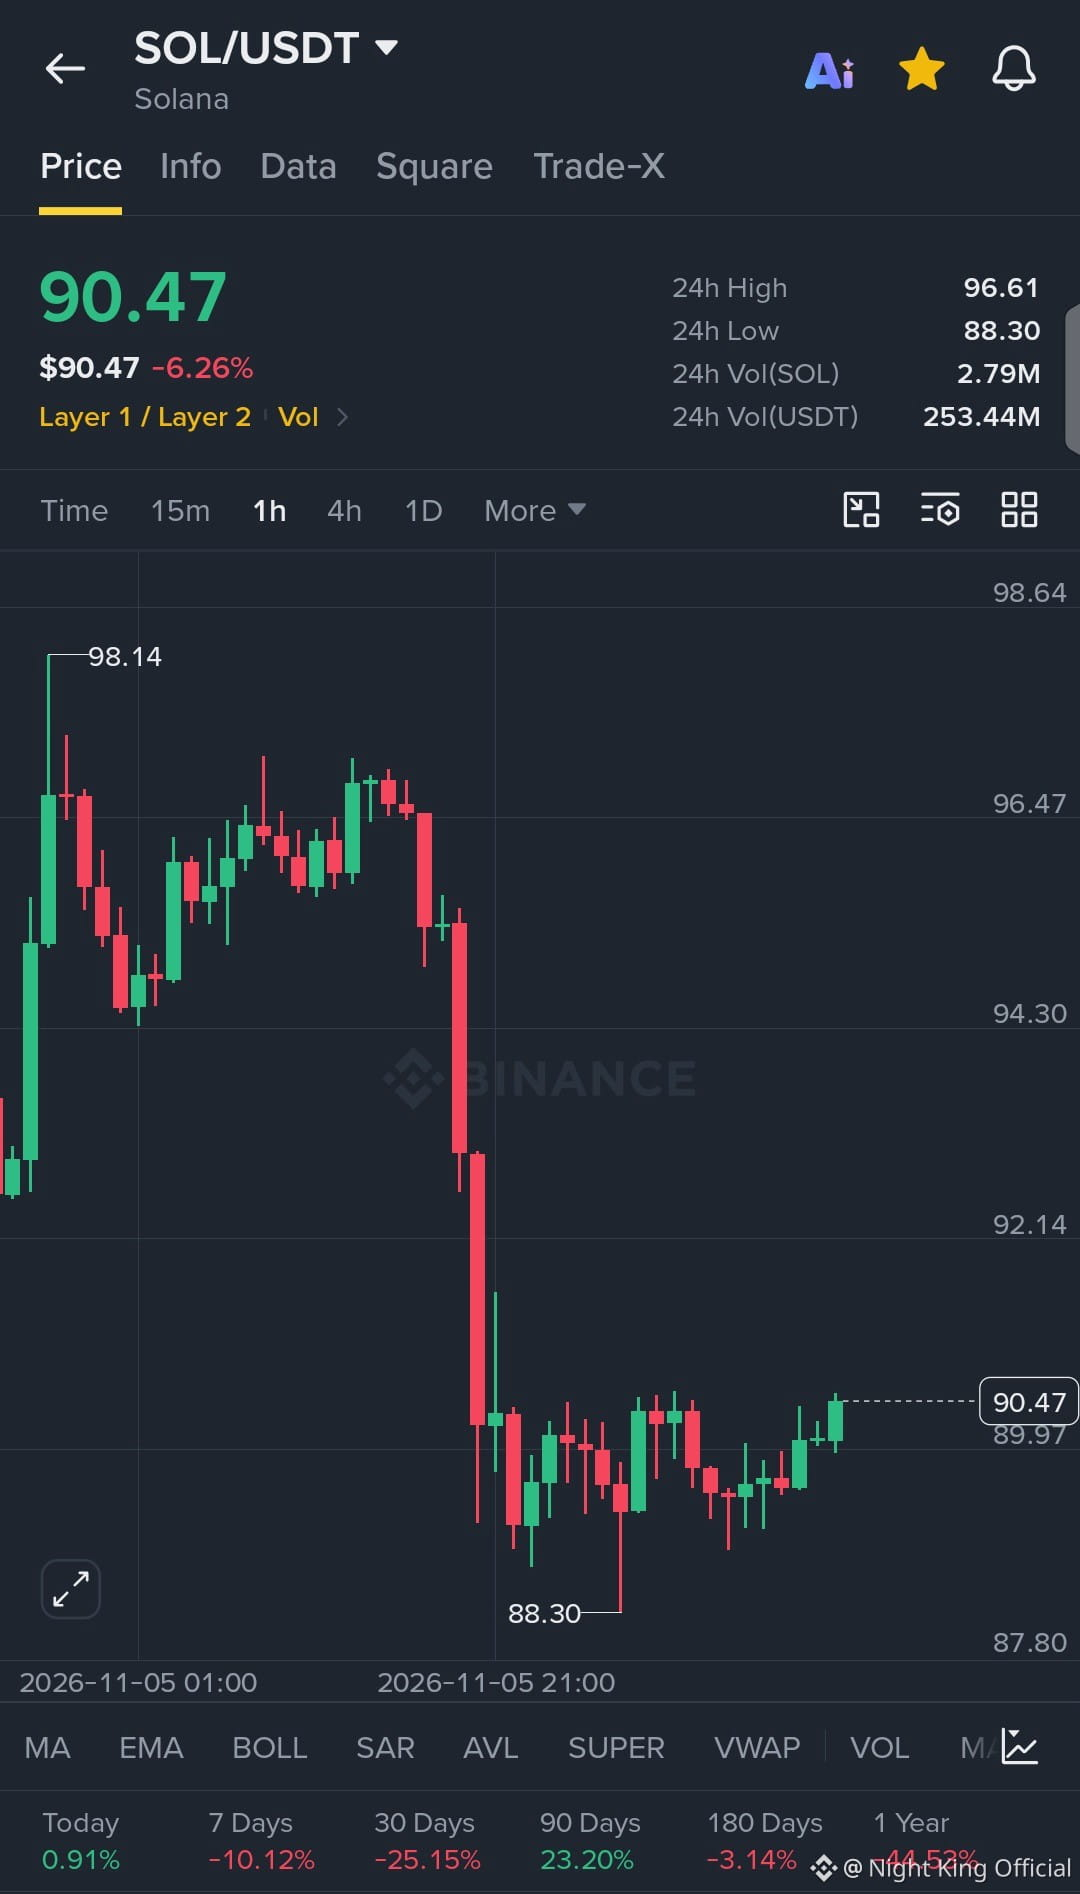
$SOL Builds a Base Above the 88.30 24h Low on the 1H Chart 🏗️
Direction: Long
Entry Range: 89.97 – 90.47
TP1: 92.14
TP2: 94.30
TP3: 96.47
SL: 1H close below 88.30
Momentum note: After the steep drop from the 98.14 swing high, $SOL has stopped falling and recent 1H candles are stepping up from the 24h Low, though price is still far below 96.61, the 24h High.
Will this push carry $SOL back toward 92.14, or does the bounce fade first? Tell me what you expect.
Not financial advice. DYOR.
#SOL #CryptoSignals #1HChart #WriteToEarn
{spot}(SOLUSDT)
$SOL Builds a Base Above the 88.30 24h Low on the 1H Chart 🏗️
Direction: Long
Entry Range: 89.97 – 90.47
TP1: 92.14
TP2: 94.30
TP3: 96.47
SL: 1H close below 88.30
Momentum note: After the steep drop from the 98.14 swing high, $SOL has stopped falling and recent 1H candles are stepping up from the 24h Low, though price is still far below 96.61, the 24h High.
Will this push carry $SOL back toward 92.14, or does the bounce fade first? Tell me what you expect.
Not financial advice. DYOR.
#SOL #CryptoSignals #1HChart #WriteToEarn
Direction: Long
Entry Range: 89.97 – 90.47
TP1: 92.14
TP2: 94.30
TP3: 96.47
SL: 1H close below 88.30
Momentum note: After the steep drop from the 98.14 swing high, $SOL has stopped falling and recent 1H candles are stepping up from the 24h Low, though price is still far below 96.61, the 24h High.
Will this push carry $SOL back toward 92.14, or does the bounce fade first? Tell me what you expect.
Not financial advice. DYOR.
#SOL #CryptoSignals #1HChart #WriteToEarn
3
390
·
--
Bullish
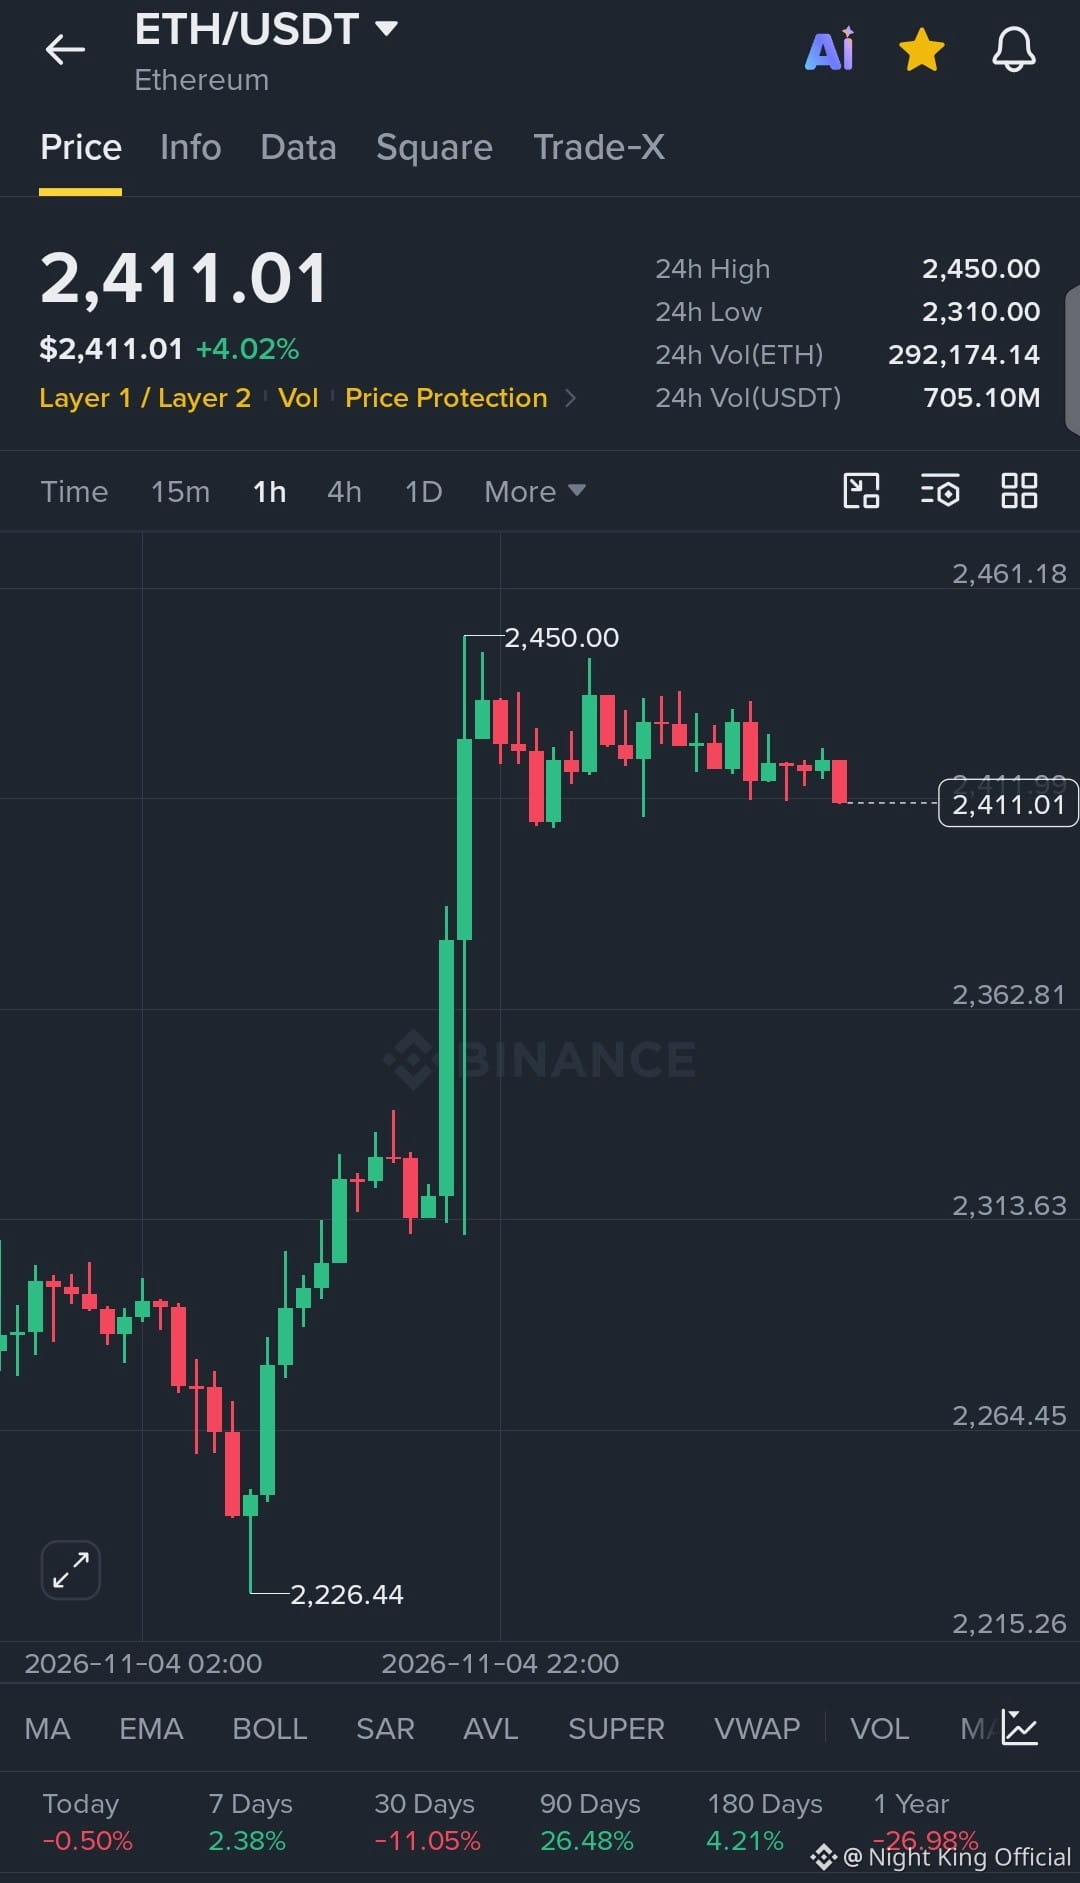
$ETH Stalls Under 2,450.00 After a Big 1H Rally 🧊
Trade: Short
Entry Range: 2,411.01 – 2,450.00
TP1: 2,362.81
TP2: 2,313.63
TP3: 2,264.45
SL: 1H close above 2,461.18
Direct read: After the sharp 1H climb from 2,226.44, $ETH printed a top at 2,450.00 and has since moved sideways in smaller candles, with the latest 1H candle closing red, so the upside looks stalled for now.
Is 2,450.00 the ceiling for this move, or will buyers force a breakout? Tell me which side you're on.
Not financial advice. DYOR.
#ETH #ShortSetup #1HChart #WriteToEarn
{spot}(ETHUSDT)
$ETH Stalls Under 2,450.00 After a Big 1H Rally 🧊
Trade: Short
Entry Range: 2,411.01 – 2,450.00
TP1: 2,362.81
TP2: 2,313.63
TP3: 2,264.45
SL: 1H close above 2,461.18
Direct read: After the sharp 1H climb from 2,226.44, $ETH printed a top at 2,450.00 and has since moved sideways in smaller candles, with the latest 1H candle closing red, so the upside looks stalled for now.
Is 2,450.00 the ceiling for this move, or will buyers force a breakout? Tell me which side you're on.
Not financial advice. DYOR.
#ETH #ShortSetup #1HChart #WriteToEarn
Trade: Short
Entry Range: 2,411.01 – 2,450.00
TP1: 2,362.81
TP2: 2,313.63
TP3: 2,264.45
SL: 1H close above 2,461.18
Direct read: After the sharp 1H climb from 2,226.44, $ETH printed a top at 2,450.00 and has since moved sideways in smaller candles, with the latest 1H candle closing red, so the upside looks stalled for now.
Is 2,450.00 the ceiling for this move, or will buyers force a breakout? Tell me which side you're on.
Not financial advice. DYOR.
#ETH #ShortSetup #1HChart #WriteToEarn
2
344
·
--
Bullish
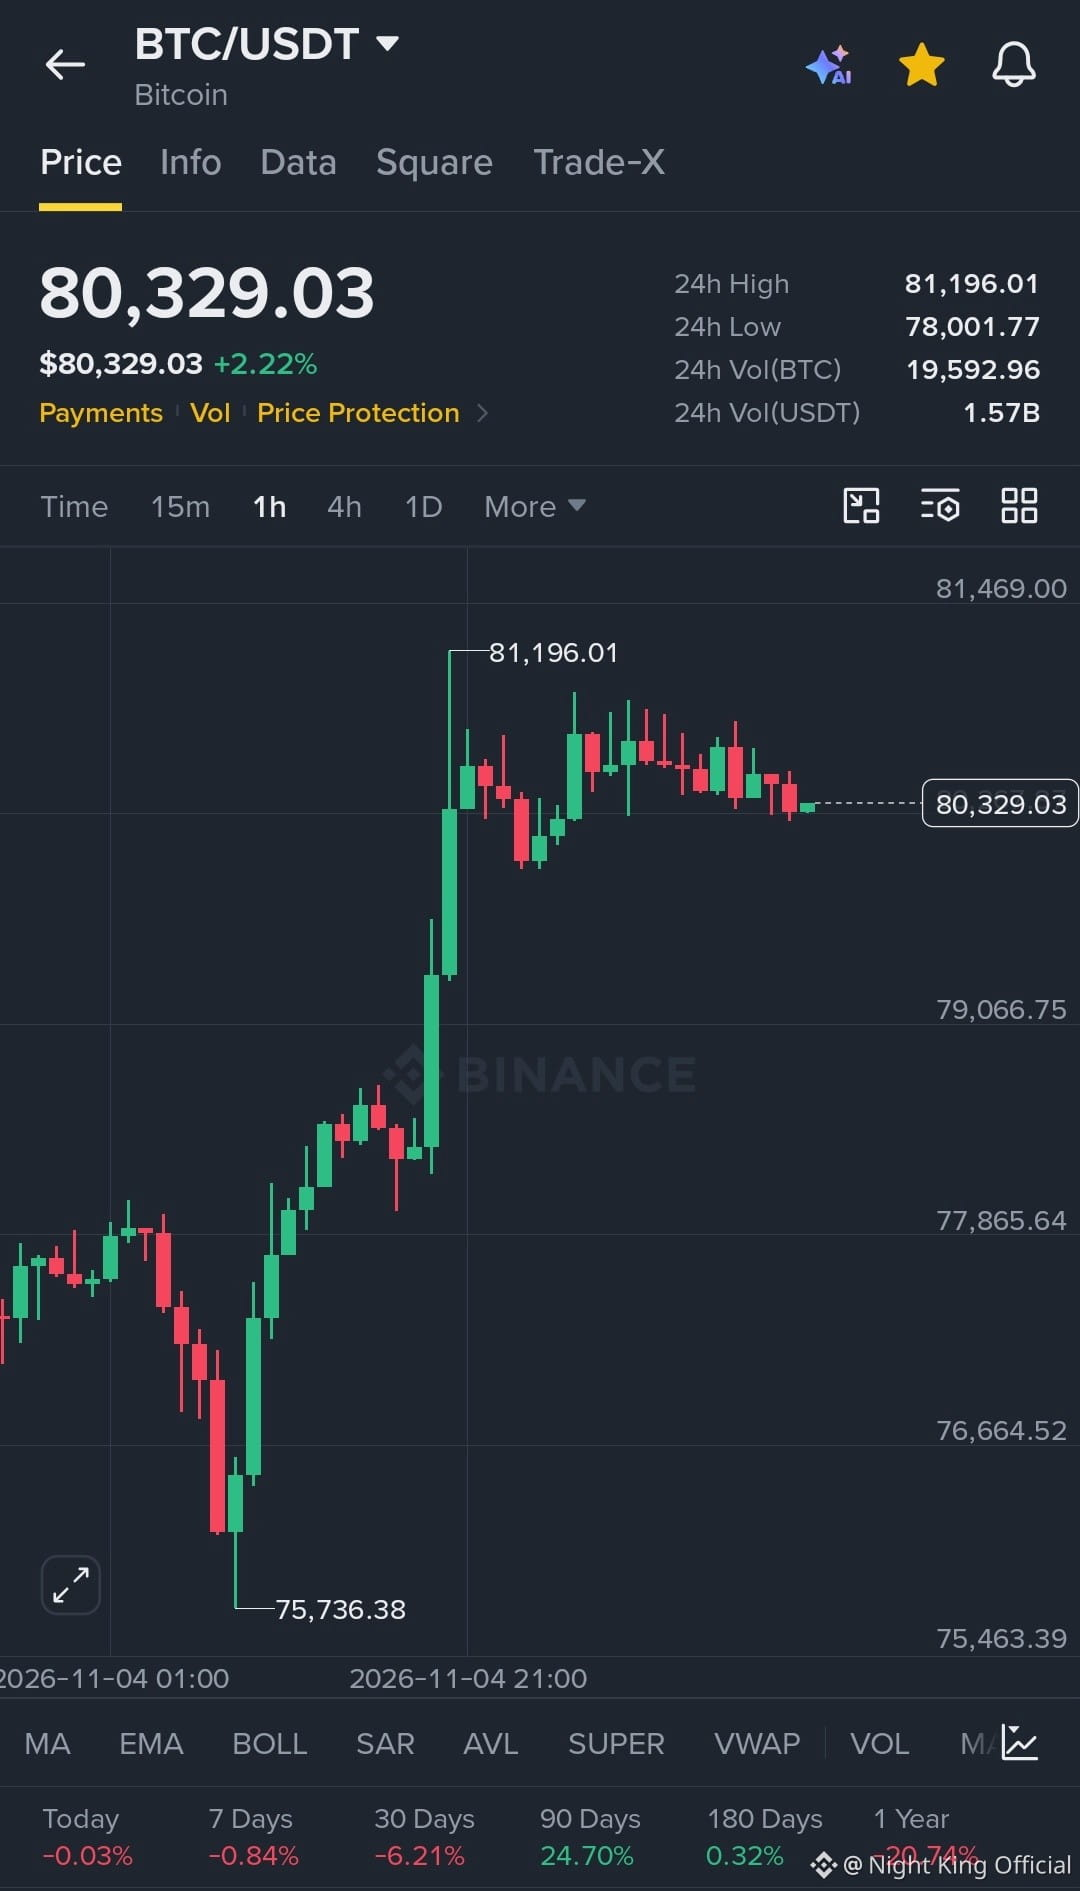
$BTC Fades Below 81,196.01 After a Sharp 1H Rally 🔔
Action: Short
Entry Range: 80,329.03 – 81,196.01
TP1: 79,066.75
TP2: 78,001.77
TP3: 77,865.64
SL: 81,469.00
Technical analysis: After the strong 1H climb from 75,736.38, $BTC stalled under the 81,196.01 swing high, and the recent 1H candles are small with a slight slide, which suggests the upside is losing steam.
Will sellers keep $BTC capped below 81,196.01, or is this just a pause before another push higher? Share your view.
Not financial advice. DYOR.
#BTC #CryptoSignals #1HChart #WriteToEarn
{spot}(BTCUSDT)
$BTC Fades Below 81,196.01 After a Sharp 1H Rally 🔔
Action: Short
Entry Range: 80,329.03 – 81,196.01
TP1: 79,066.75
TP2: 78,001.77
TP3: 77,865.64
SL: 81,469.00
Technical analysis: After the strong 1H climb from 75,736.38, $BTC stalled under the 81,196.01 swing high, and the recent 1H candles are small with a slight slide, which suggests the upside is losing steam.
Will sellers keep $BTC capped below 81,196.01, or is this just a pause before another push higher? Share your view.
Not financial advice. DYOR.
#BTC #CryptoSignals #1HChart #WriteToEarn
Action: Short
Entry Range: 80,329.03 – 81,196.01
TP1: 79,066.75
TP2: 78,001.77
TP3: 77,865.64
SL: 81,469.00
Technical analysis: After the strong 1H climb from 75,736.38, $BTC stalled under the 81,196.01 swing high, and the recent 1H candles are small with a slight slide, which suggests the upside is losing steam.
Will sellers keep $BTC capped below 81,196.01, or is this just a pause before another push higher? Share your view.
Not financial advice. DYOR.
#BTC #CryptoSignals #1HChart #WriteToEarn
1
2
238
·
--
Bullish
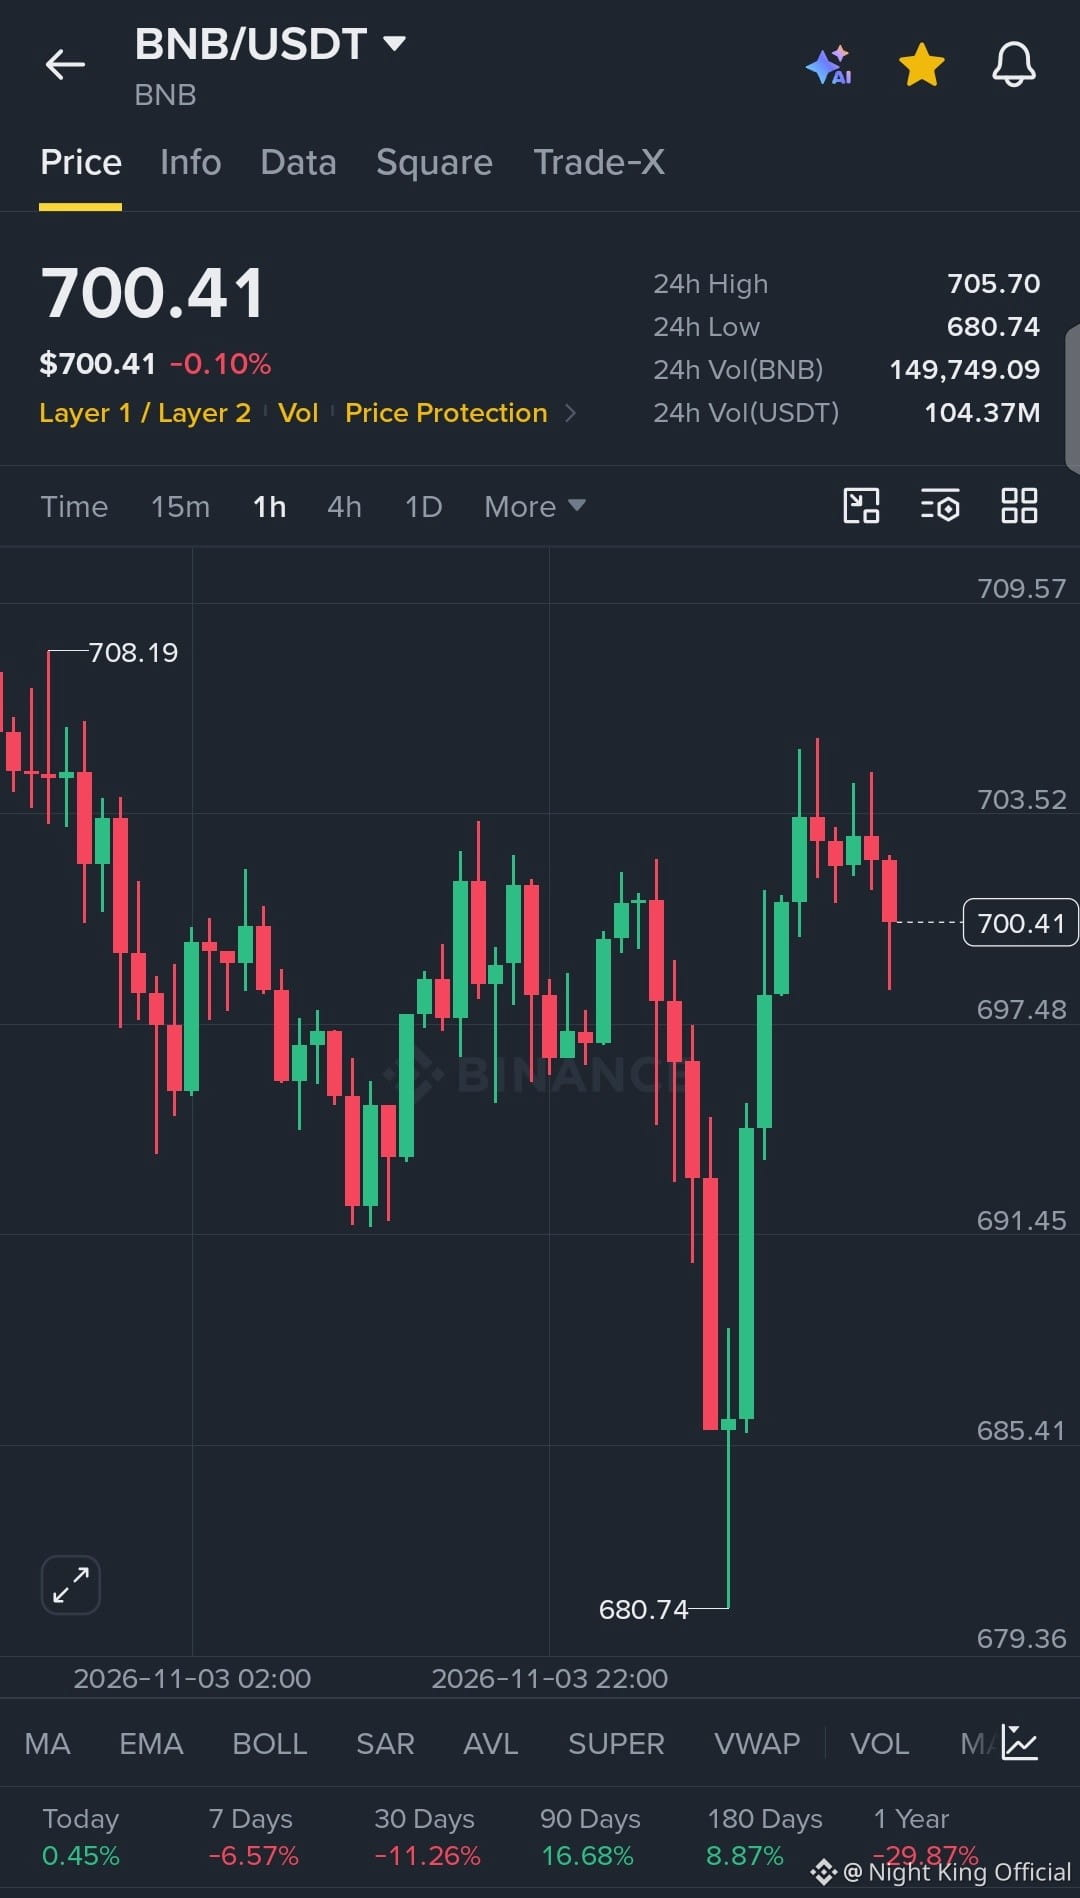
$BNB Pulls Back After a Sharp 1H Recovery From 680.74 🔄
Position: Long
Entry Range: 697.48 – 700.41
TP1: 703.52
TP2: 705.70
TP3: 708.19
SL: 1H close below 691.45
Momentum read: $BNB rallied hard on the 1H chart after the 680.74 low and tested the 24h High area near 705.70, and the latest red 1H candle shows a pullback toward 700.41.
Is this dip a chance to reload, or will the 24h High cap the next push? Tell me your move.
Not financial advice. DYOR.
#BNB #Binance #1HChart #CryptoSignals #WriteToEarn
{spot}(BNBUSDT)
$BNB Pulls Back After a Sharp 1H Recovery From 680.74 🔄
Position: Long
Entry Range: 697.48 – 700.41
TP1: 703.52
TP2: 705.70
TP3: 708.19
SL: 1H close below 691.45
Momentum read: $BNB rallied hard on the 1H chart after the 680.74 low and tested the 24h High area near 705.70, and the latest red 1H candle shows a pullback toward 700.41.
Is this dip a chance to reload, or will the 24h High cap the next push? Tell me your move.
Not financial advice. DYOR.
#BNB #Binance #1HChart #CryptoSignals #WriteToEarn
Position: Long
Entry Range: 697.48 – 700.41
TP1: 703.52
TP2: 705.70
TP3: 708.19
SL: 1H close below 691.45
Momentum read: $BNB rallied hard on the 1H chart after the 680.74 low and tested the 24h High area near 705.70, and the latest red 1H candle shows a pullback toward 700.41.
Is this dip a chance to reload, or will the 24h High cap the next push? Tell me your move.
Not financial advice. DYOR.
#BNB #Binance #1HChart #CryptoSignals #WriteToEarn
1
3
221

·
--
1H support and resistance levels for $1000CHEEMS
Immediate Support: The Bollinger Middle Band at 0.000662 provides a crucial support level.
Strong Resistance: The Bollinger Upper Band at 0.000775 represents a significant resistance area where profit-taking might occur.
000CHEEMS shows neutral momentum with key support at 0.000662 and resistance at 0.000775 on the 1-hour chart.
#1000CHEEMS #1HChart #analysis #crypto
{spot}(1000CHEEMSUSDT)
1H support and resistance levels for $1000CHEEMS
Immediate Support: The Bollinger Middle Band at 0.000662 provides a crucial support level.
Strong Resistance: The Bollinger Upper Band at 0.000775 represents a significant resistance area where profit-taking might occur.
000CHEEMS shows neutral momentum with key support at 0.000662 and resistance at 0.000775 on the 1-hour chart.
#1000CHEEMS #1HChart #analysis #crypto
Immediate Support: The Bollinger Middle Band at 0.000662 provides a crucial support level.
Strong Resistance: The Bollinger Upper Band at 0.000775 represents a significant resistance area where profit-taking might occur.
000CHEEMS shows neutral momentum with key support at 0.000662 and resistance at 0.000775 on the 1-hour chart.
#1000CHEEMS #1HChart #analysis #crypto
132

·
--
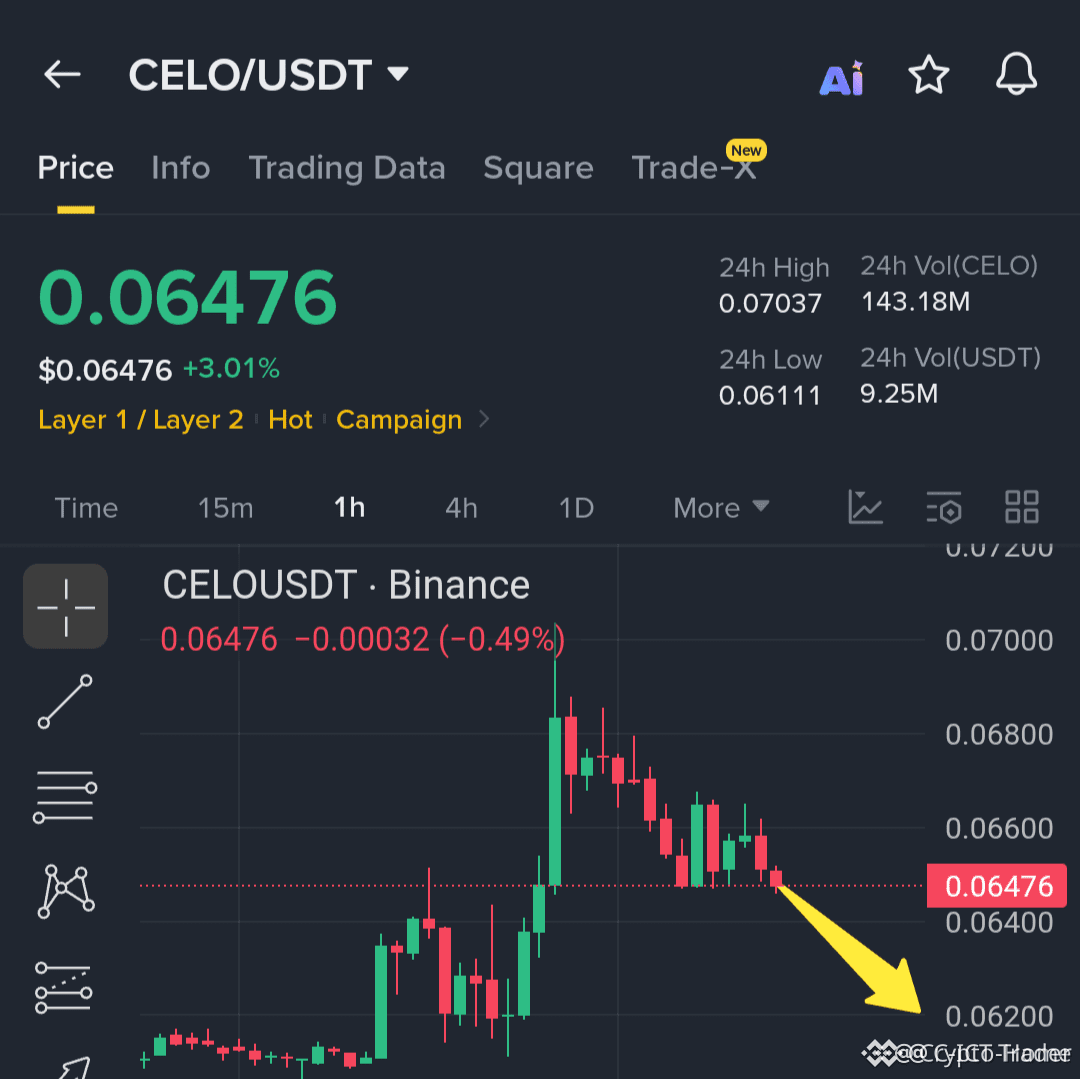
$CELO HEADING TO RETEST 0.06200 SUPPORT ON 1H CHART ⚠️
The 1H chart shows price making a clear move toward the 0.06200 zone — a level that has served as support multiple times in recent sessions. Volume is gradually increasing as price approaches, suggesting a decisive reaction is likely within the next few candles.
Will the support hold or will we see a breakdown?
Not financial advice. Always manage your risk.
#CELO #SupportTest #1HChart #CryptoAnalysis
⚡
$CELO HEADING TO RETEST 0.06200 SUPPORT ON 1H CHART ⚠️
The 1H chart shows price making a clear move toward the 0.06200 zone — a level that has served as support multiple times in recent sessions. Volume is gradually increasing as price approaches, suggesting a decisive reaction is likely within the next few candles.
Will the support hold or will we see a breakdown?
Not financial advice. Always manage your risk.
#CELO #SupportTest #1HChart #CryptoAnalysis
⚡
The 1H chart shows price making a clear move toward the 0.06200 zone — a level that has served as support multiple times in recent sessions. Volume is gradually increasing as price approaches, suggesting a decisive reaction is likely within the next few candles.
Will the support hold or will we see a breakdown?
Not financial advice. Always manage your risk.
#CELO #SupportTest #1HChart #CryptoAnalysis
⚡
41

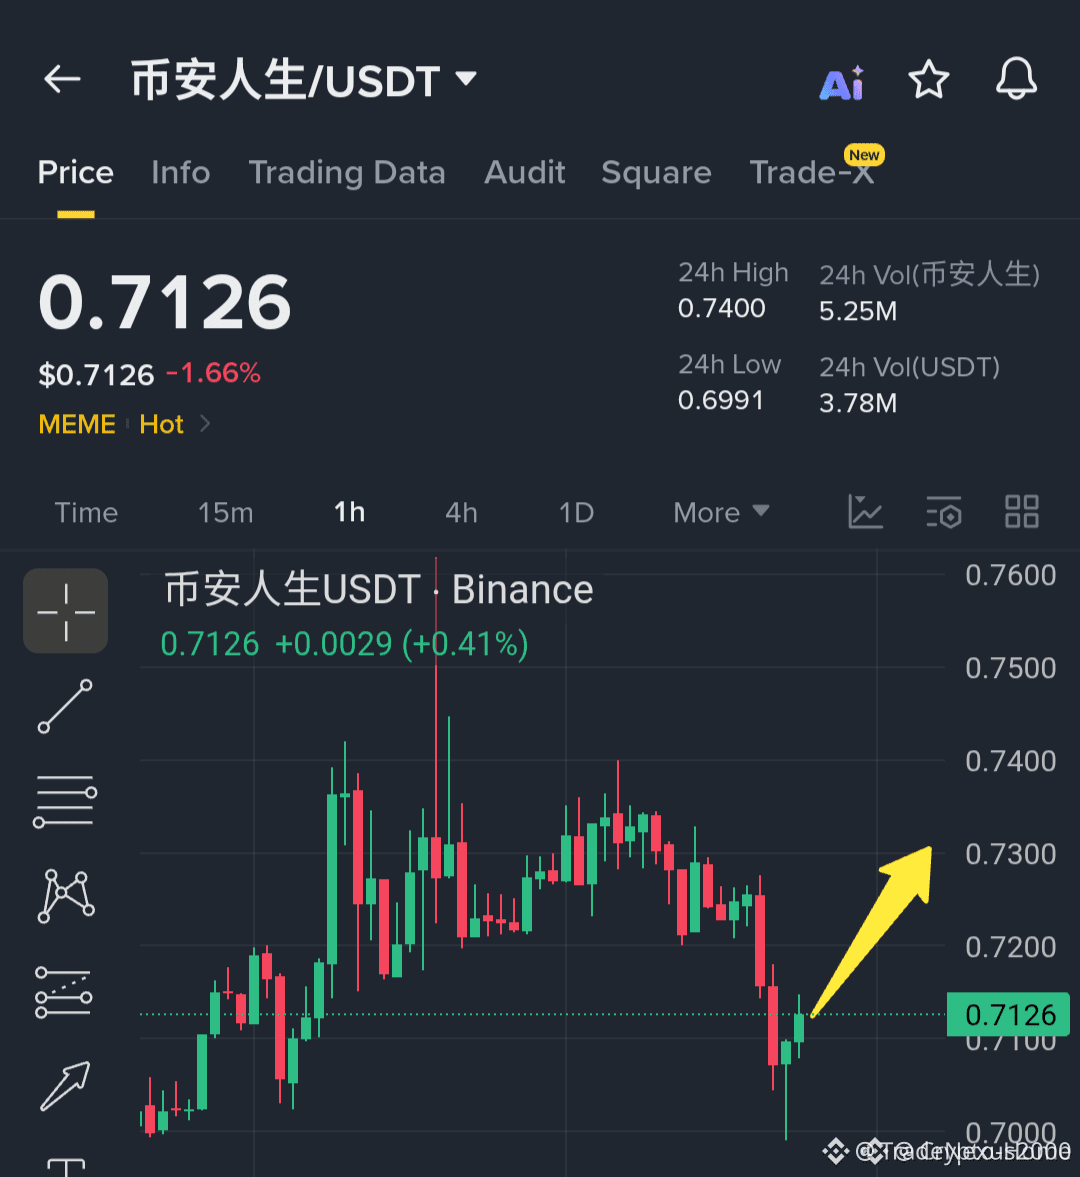
$BINANCELIFE IS BOUNCING OFF KEY SUPPORT ON THE 1H CHART 🎯
Target: 0.7300 🚀
Price is currently reacting off a well-defined support level on the 1h timeframe. This zone has held multiple times over the past sessions, and the rejection candle suggests buyers are stepping in. Volume is beginning to pick up on the shorter timeframes, indicating conviction behind this move.
The next target sits at 0.7300, roughly a 5% move from here — a clean R:R if momentum continues. Are you taking this bounce or waiting for a retest?
Not financial advice. Always manage your risk.
#BINANCELIFE #BounceSetup #SupportBounce #1HChart
🎯
$BINANCELIFE IS BOUNCING OFF KEY SUPPORT ON THE 1H CHART 🎯
Target: 0.7300 🚀
Price is currently reacting off a well-defined support level on the 1h timeframe. This zone has held multiple times over the past sessions, and the rejection candle suggests buyers are stepping in. Volume is beginning to pick up on the shorter timeframes, indicating conviction behind this move.
The next target sits at 0.7300, roughly a 5% move from here — a clean R:R if momentum continues. Are you taking this bounce or waiting for a retest?
Not financial advice. Always manage your risk.
#BINANCELIFE #BounceSetup #SupportBounce #1HChart
🎯
Target: 0.7300 🚀
Price is currently reacting off a well-defined support level on the 1h timeframe. This zone has held multiple times over the past sessions, and the rejection candle suggests buyers are stepping in. Volume is beginning to pick up on the shorter timeframes, indicating conviction behind this move.
The next target sits at 0.7300, roughly a 5% move from here — a clean R:R if momentum continues. Are you taking this bounce or waiting for a retest?
Not financial advice. Always manage your risk.
#BINANCELIFE #BounceSetup #SupportBounce #1HChart
🎯
315

·
--
Bullish
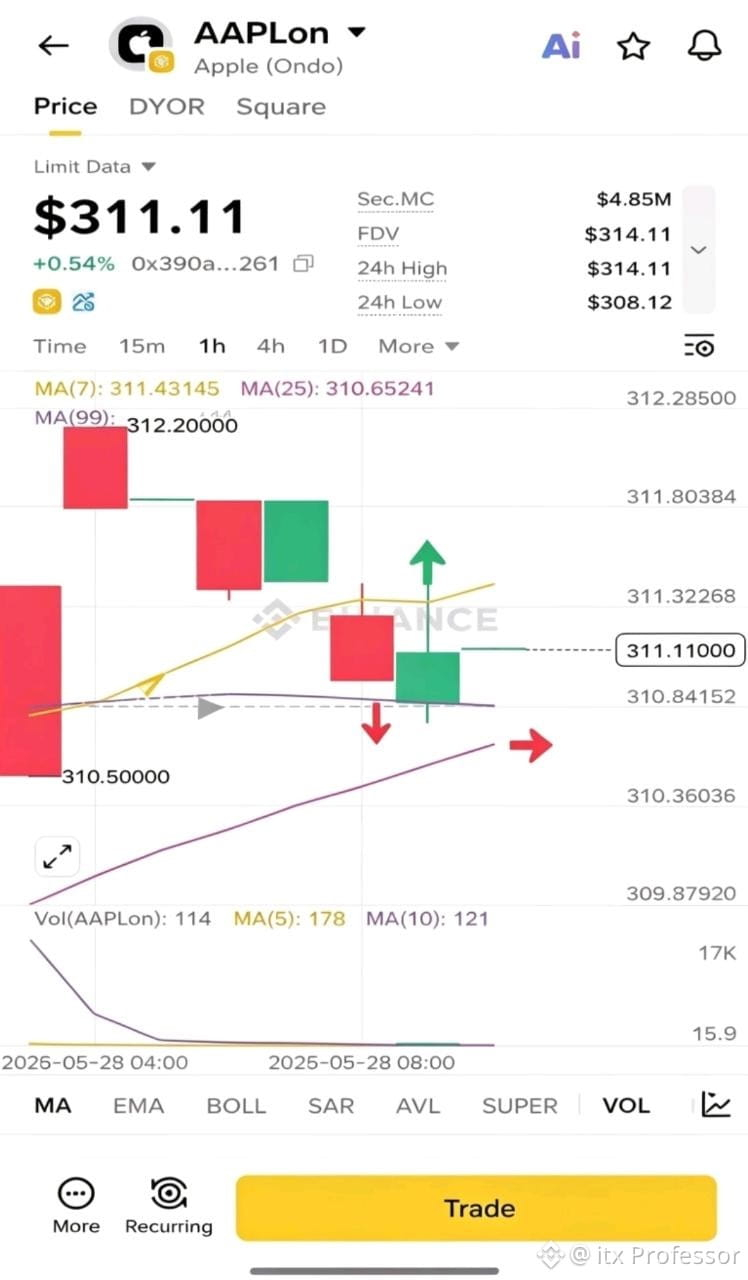
$AAPLon
AAPLon 1H Update 📊
Price is currently consolidating around *$311.11*.
- *Support:* $310.84 – bounce potential here ↑
- *Resistance:* $312.20 – rejection likely if not broken ↓
- *Trend:* Sideways with a slight bullish bias
Volume is low, so a strong move will need a breakout with volume confirmation.
⚠️ This is technical analysis only. Not financial advice. DYOR.
#AAPLon #Crypto #TechnicalAnalysisnalysis #1HChart
{future}(AAPLUSDT)
$AAPLon
AAPLon 1H Update 📊
Price is currently consolidating around *$311.11*.
- *Support:* $310.84 – bounce potential here ↑
- *Resistance:* $312.20 – rejection likely if not broken ↓
- *Trend:* Sideways with a slight bullish bias
Volume is low, so a strong move will need a breakout with volume confirmation.
⚠️ This is technical analysis only. Not financial advice. DYOR.
#AAPLon #Crypto #TechnicalAnalysisnalysis #1HChart
AAPLon 1H Update 📊
Price is currently consolidating around *$311.11*.
- *Support:* $310.84 – bounce potential here ↑
- *Resistance:* $312.20 – rejection likely if not broken ↓
- *Trend:* Sideways with a slight bullish bias
Volume is low, so a strong move will need a breakout with volume confirmation.
⚠️ This is technical analysis only. Not financial advice. DYOR.
#AAPLon #Crypto #TechnicalAnalysisnalysis #1HChart
1
151
·
--
Bullish
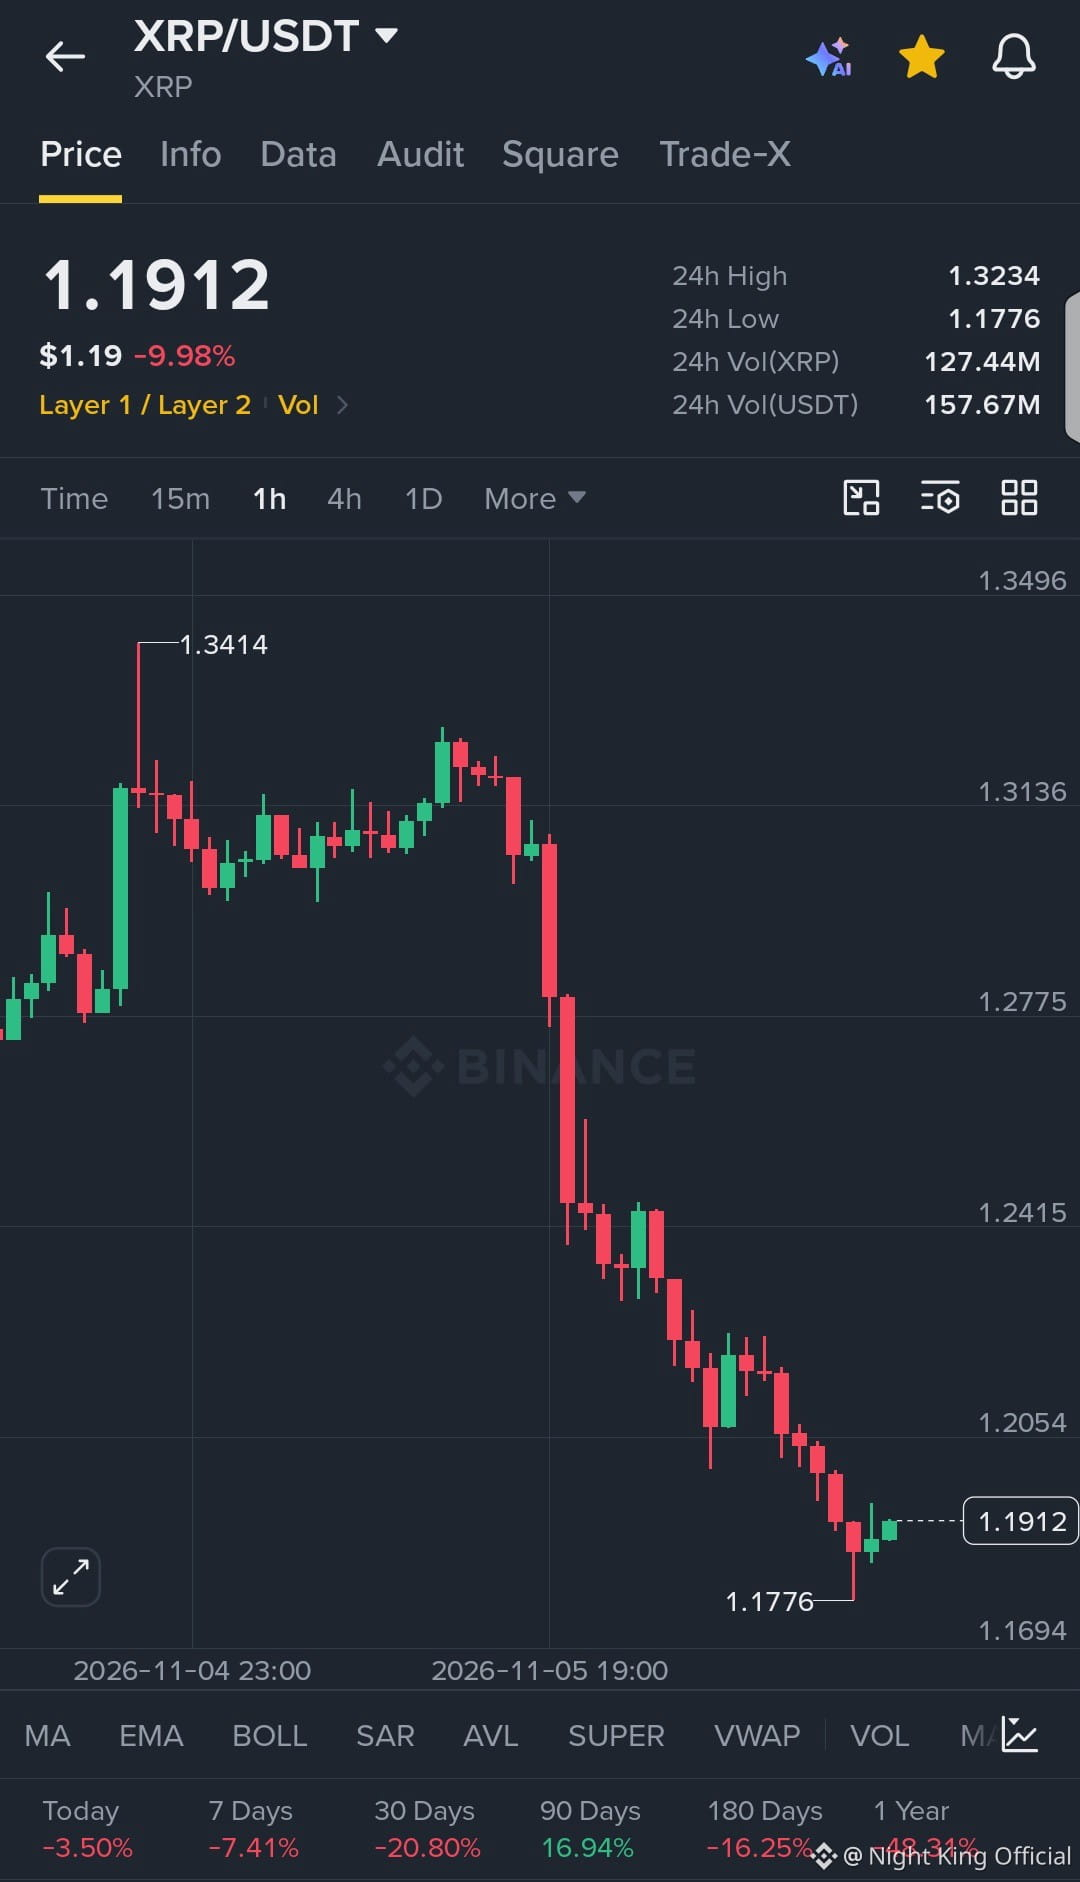
$XRP Bounces Off the 1.1776 24h Low After a Steady Slide 🪝
Plan: Long
Entry Range: 1.1776 – 1.1912
TP1: 1.2054
TP2: 1.2415
TP3: 1.2775
SL: 1H close below 1.1694
Momentum check: $XRP has been making lower 1H candles since the 1.3414 swing high, but the last two 1H candles are green just above the 1.1776 24h Low, which hints at a first bounce attempt, though nothing is confirmed yet.
Is this the start of a relief move, or just a short pause before another leg down? Tell me where you stand.
Not financial advice. DYOR.
#XRP #Ripple #CryptoSignals #1HChart #WriteToEarn
{spot}(XRPUSDT)
$XRP Bounces Off the 1.1776 24h Low After a Steady Slide 🪝
Plan: Long
Entry Range: 1.1776 – 1.1912
TP1: 1.2054
TP2: 1.2415
TP3: 1.2775
SL: 1H close below 1.1694
Momentum check: $XRP has been making lower 1H candles since the 1.3414 swing high, but the last two 1H candles are green just above the 1.1776 24h Low, which hints at a first bounce attempt, though nothing is confirmed yet.
Is this the start of a relief move, or just a short pause before another leg down? Tell me where you stand.
Not financial advice. DYOR.
#XRP #Ripple #CryptoSignals #1HChart #WriteToEarn
Plan: Long
Entry Range: 1.1776 – 1.1912
TP1: 1.2054
TP2: 1.2415
TP3: 1.2775
SL: 1H close below 1.1694
Momentum check: $XRP has been making lower 1H candles since the 1.3414 swing high, but the last two 1H candles are green just above the 1.1776 24h Low, which hints at a first bounce attempt, though nothing is confirmed yet.
Is this the start of a relief move, or just a short pause before another leg down? Tell me where you stand.
Not financial advice. DYOR.
#XRP #Ripple #CryptoSignals #1HChart #WriteToEarn
1
461
·
--
Article
🟡 Gold 1H Chart Analysis: Can Buyers Push Higher?🟡 Gold 1H Chart Analysis: Can Buyers Push Higher?
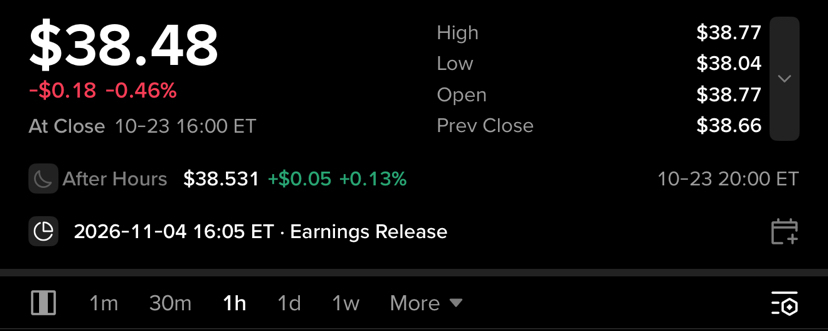
Gold is currently trading around $38.48 on the 1-hour chart, showing a period of consolidation after recent volatility.
On the technical side, the MA(7) is around $38.48, while MA(25) is near $38.51 and MA(99) is around $38.89. This shows that price is still below the longer moving averages, keeping short-term momentum somewhat cautious.
📊 Key Levels to Watch
Resistance:
$38.52 — first short-term hurdle
$38.81 — important resistance area
$38.89–$38.94 — stronger resistance zone
Support:
$38.24 — nearby support
$38.00 — important psychological support
If buyers manage to push and hold price above $38.52, the next area to watch could be $38.81, followed by the $38.89–$38.94 zone.
On the other hand, if price loses $38.24, sellers could test the $38.00 area again.
For now, the 1H chart looks like a range/consolidation setup, so the next breakout could be important for determining the short-term direction.
#GOLD #goldanalysis #Trading #1HChart #MarketUpdate
{stock_us}(GOLD.US)
🟡 Gold 1H Chart Analysis: Can Buyers Push Higher?
🟡 Gold 1H Chart Analysis: Can Buyers Push Higher?
Gold is currently trading around $38.48 on the 1-hour chart, showing a period of consolidation after recent volatility.
On the technical side, the MA(7) is around $38.48, while MA(25) is near $38.51 and MA(99) is around $38.89. This shows that price is still below the longer moving averages, keeping short-term momentum somewhat cautious.
📊 Key Levels to Watch
Resistance:
$38.52 — first short-term hurdle
$38.81 — important resistance area
$38.89–$38.94 — stronger resistance zone
Support:
$38.24 — nearby support
$38.00 — important psychological support
If buyers manage to push and hold price above $38.52, the next area to watch could be $38.81, followed by the $38.89–$38.94 zone.
On the other hand, if price loses $38.24, sellers could test the $38.00 area again.
For now, the 1H chart looks like a range/consolidation setup, so the next breakout could be important for determining the short-term direction.
#GOLD #goldanalysis #Trading #1HChart #MarketUpdate
Gold is currently trading around $38.48 on the 1-hour chart, showing a period of consolidation after recent volatility.
On the technical side, the MA(7) is around $38.48, while MA(25) is near $38.51 and MA(99) is around $38.89. This shows that price is still below the longer moving averages, keeping short-term momentum somewhat cautious.
📊 Key Levels to Watch
Resistance:
$38.52 — first short-term hurdle
$38.81 — important resistance area
$38.89–$38.94 — stronger resistance zone
Support:
$38.24 — nearby support
$38.00 — important psychological support
If buyers manage to push and hold price above $38.52, the next area to watch could be $38.81, followed by the $38.89–$38.94 zone.
On the other hand, if price loses $38.24, sellers could test the $38.00 area again.
For now, the 1H chart looks like a range/consolidation setup, so the next breakout could be important for determining the short-term direction.
#GOLD #goldanalysis #Trading #1HChart #MarketUpdate
XAU-2.53%
GOLDUS-0.57%
226

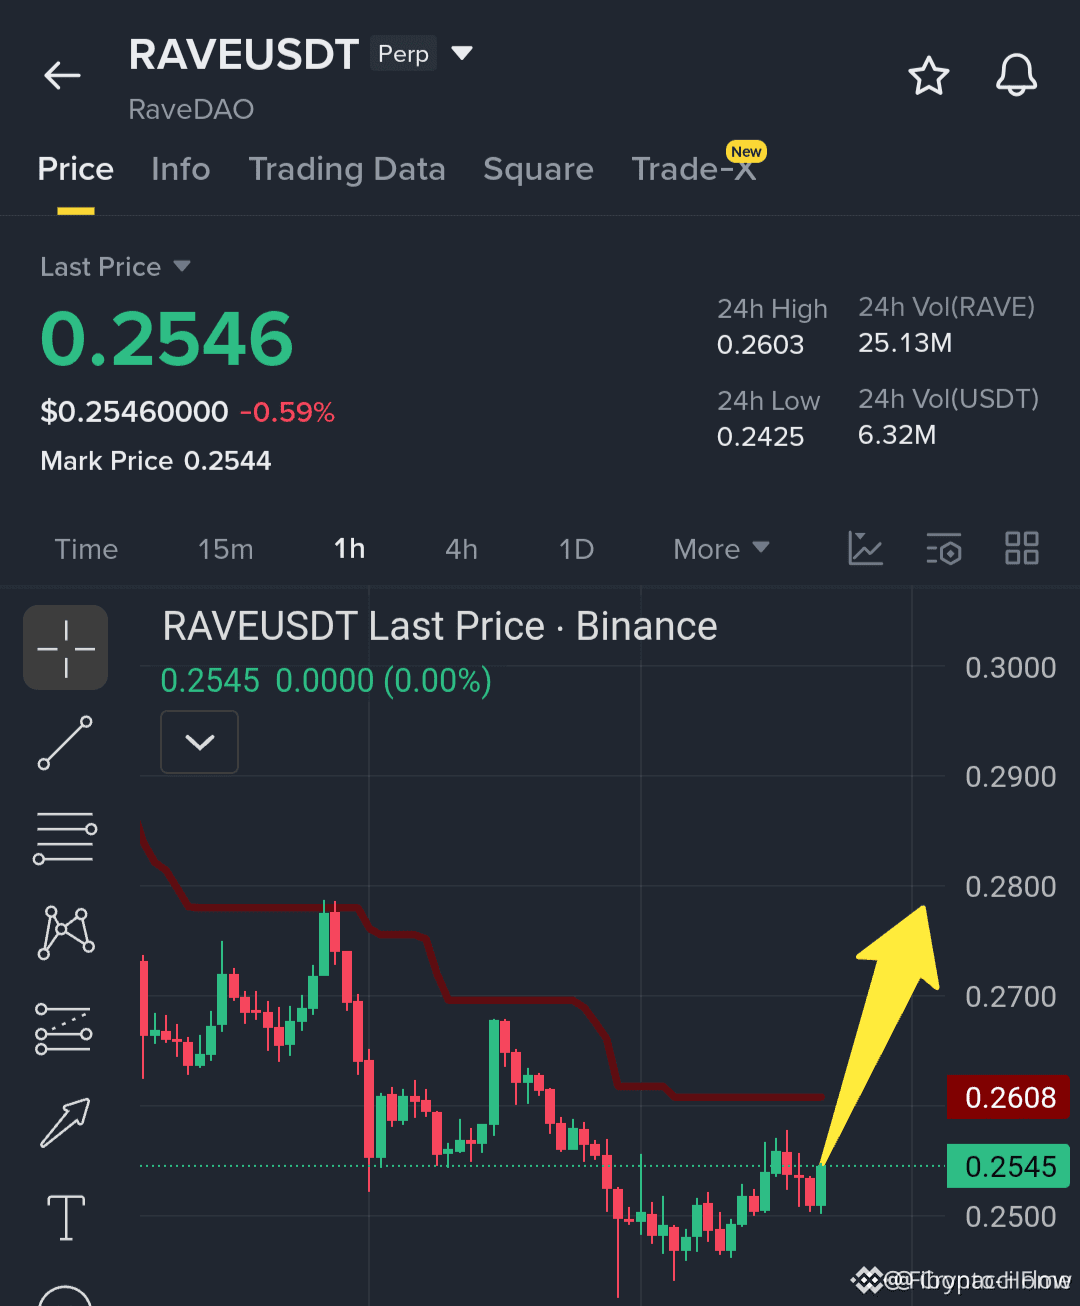
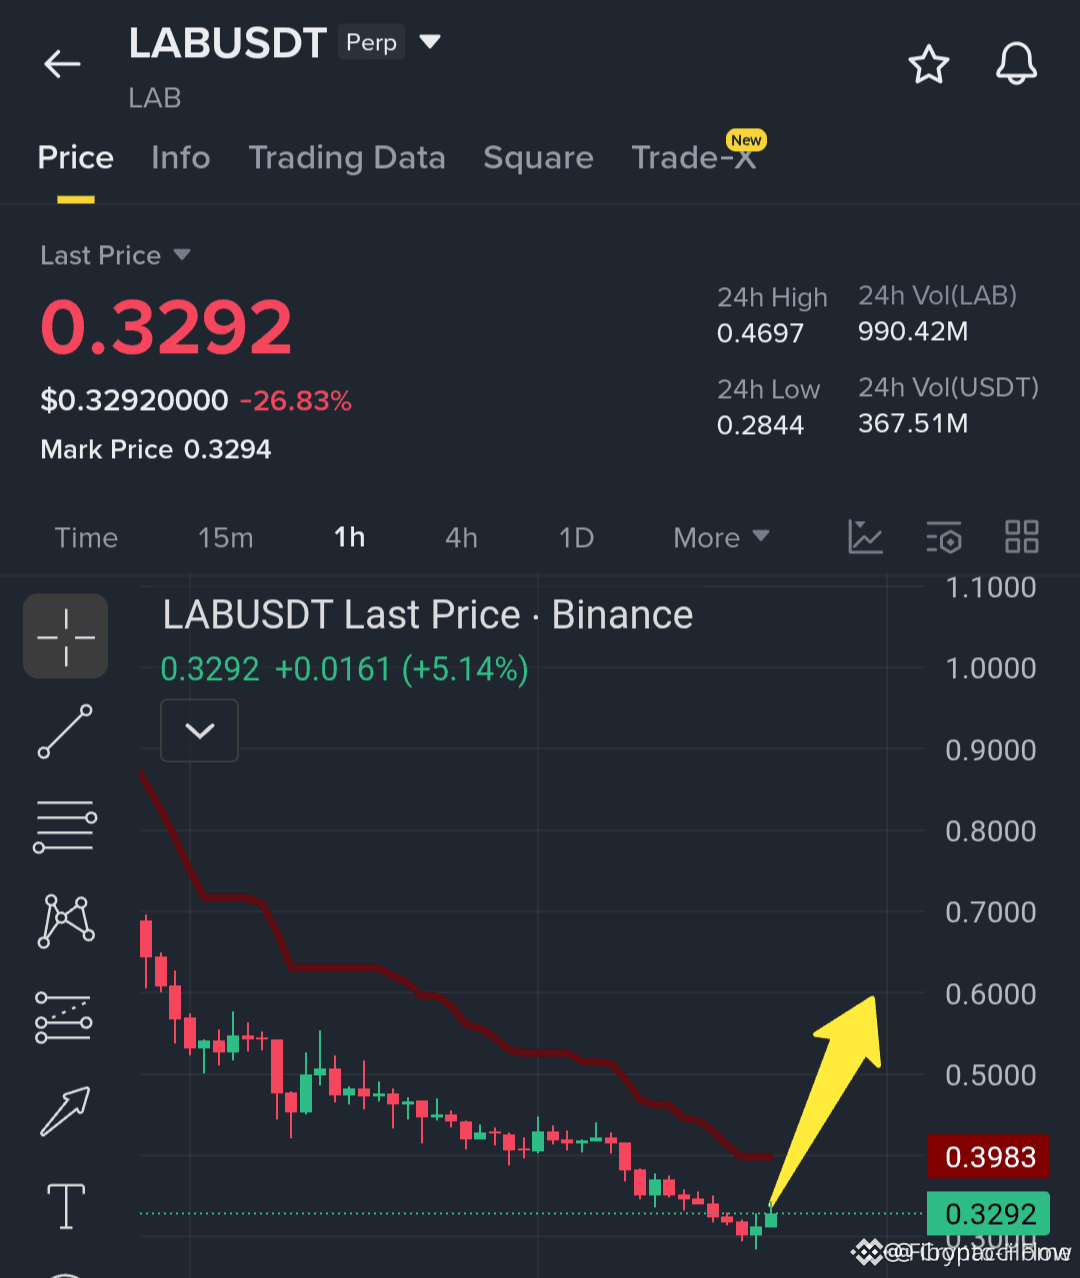
$LAB AND $RAVE ARE FLASHING A BOTTOM REVERSAL PATTERN 📈
Both charts just formed a clean 1H double bottom with rising volume — the same structure that preceded their last 15% rallies. Momentum is shifting on lower timeframes and sellers are losing control.
The bid is thickening right at these levels. Are you loading up or waiting for confirmation?
Not financial advice. Always manage your risk.
#LAB #RAVE #ReversalSetup #1HChart #Crypto
💎
$LAB AND $RAVE ARE FLASHING A BOTTOM REVERSAL PATTERN 📈
Both charts just formed a clean 1H double bottom with rising volume — the same structure that preceded their last 15% rallies. Momentum is shifting on lower timeframes and sellers are losing control.
The bid is thickening right at these levels. Are you loading up or waiting for confirmation?
Not financial advice. Always manage your risk.
#LAB #RAVE #ReversalSetup #1HChart #Crypto
💎
Both charts just formed a clean 1H double bottom with rising volume — the same structure that preceded their last 15% rallies. Momentum is shifting on lower timeframes and sellers are losing control.
The bid is thickening right at these levels. Are you loading up or waiting for confirmation?
Not financial advice. Always manage your risk.
#LAB #RAVE #ReversalSetup #1HChart #Crypto
💎
316

·
--
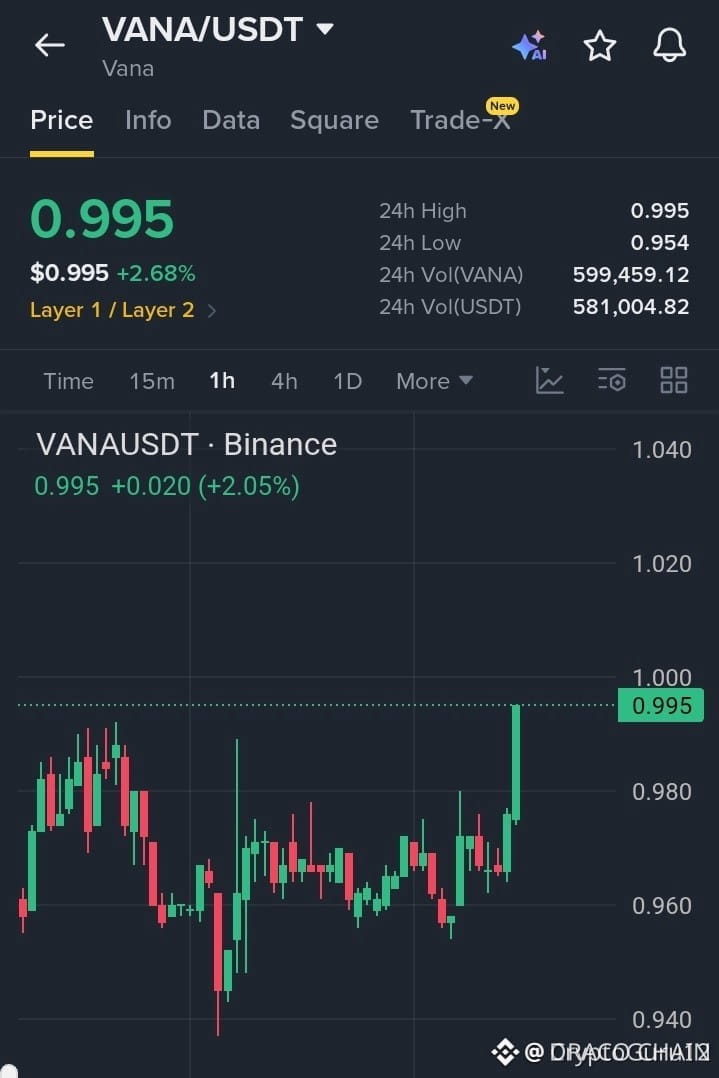
🦈 $VANA BREAKS ABOVE 0.98 AS 1.00 LIQUIDITY COMES INTO FOCUS 📈
Entry: 0.985 – 0.998 ⚡
Target: 1.010 – 1.040 🚀
Stop Loss: 0.970 ⚠️
$VANA clears the 0.98 congestion shelf on the 1H, with the 1.00 handle now acting as a magnet for continuation. 📊 Buyers are not merely punching through; they are testing whether this breakout can become a defended structural pivot.
💡 As long as price respects 0.975–0.980, the short-term order flow favors accumulation rather than exhaustion. A clean reclaim of 1.00 could open a measured path toward 1.040. 🌊
🤔 Will you scale into the 1.00 reclaim, or wait for a deeper sweep of the breakout shelf?
⚠️ Not financial advice. Always manage your risk. 🛡️
🏷️ #VANA #LongSetup #Breakout #1HChart #Crypto
🎯 💎
🦈 $VANA BREAKS ABOVE 0.98 AS 1.00 LIQUIDITY COMES INTO FOCUS 📈
Entry: 0.985 – 0.998 ⚡
Target: 1.010 – 1.040 🚀
Stop Loss: 0.970 ⚠️
$VANA clears the 0.98 congestion shelf on the 1H, with the 1.00 handle now acting as a magnet for continuation. 📊 Buyers are not merely punching through; they are testing whether this breakout can become a defended structural pivot.
💡 As long as price respects 0.975–0.980, the short-term order flow favors accumulation rather than exhaustion. A clean reclaim of 1.00 could open a measured path toward 1.040. 🌊
🤔 Will you scale into the 1.00 reclaim, or wait for a deeper sweep of the breakout shelf?
⚠️ Not financial advice. Always manage your risk. 🛡️
🏷️ #VANA #LongSetup #Breakout #1HChart #Crypto
🎯 💎
Entry: 0.985 – 0.998 ⚡
Target: 1.010 – 1.040 🚀
Stop Loss: 0.970 ⚠️
$VANA clears the 0.98 congestion shelf on the 1H, with the 1.00 handle now acting as a magnet for continuation. 📊 Buyers are not merely punching through; they are testing whether this breakout can become a defended structural pivot.
💡 As long as price respects 0.975–0.980, the short-term order flow favors accumulation rather than exhaustion. A clean reclaim of 1.00 could open a measured path toward 1.040. 🌊
🤔 Will you scale into the 1.00 reclaim, or wait for a deeper sweep of the breakout shelf?
⚠️ Not financial advice. Always manage your risk. 🛡️
🏷️ #VANA #LongSetup #Breakout #1HChart #Crypto
🎯 💎
26

·
--
Bearish
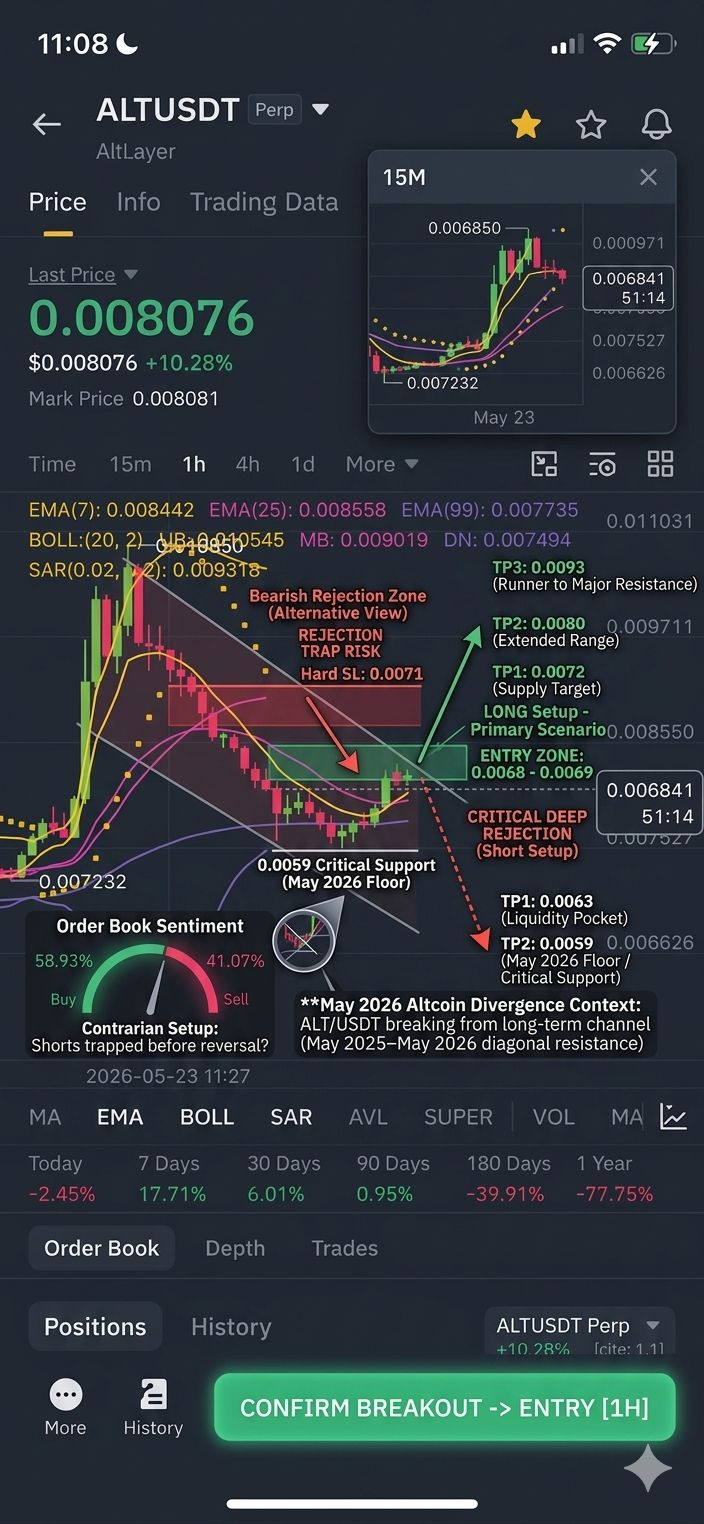
📉 $ALT / USDT: The 1H Structure & The Decision Point
Market Pulse:
We are tracking $ALT on the 1-hour timeframe, and the market is currently caught in a "tightening coil." After a period of corrective behavior, the asset is testing a critical diagonal resistance line that has governed the price action for the last few sessions. With Bitcoin dominance elevated, $ALT is showing the classic signs of a "selectivity narrative"—either we break the structure or we retest lower liquidity zones.
Technical Breakdown:
• The Trend: We are currently trading within a defined 1H consolidation zone. Buyers have stepped in to defend the 0.0067 floor multiple times, suggesting a possible base-building phase.
• The Resistance: The main trendline rejection zone is sitting near 0.0069–0.0070. A clean 1H candle close above this level is required to confirm a shift in momentum.
• Volume Profile: Trading volume has been inconsistent, which often precedes a "volatility expansion." Watch for a spike in volume during the next 4 hours to confirm the direction.
Strategic Setup:
• Bullish Case: If we reclaim 0.0069, the next major supply target is 0.0072.
• Bearish Case (Short Setup): If the price fails to break the diagonal resistance and loses the 0.0067 support, we expect a retest of the 0.0063–0.0064 liquidity pocket.
• Stop Loss Management: For any short entry, a stop loss at 0.0071 (above the recent wick) provides a clean invalidation point.
The Bottom Line:
Emotional trading is a trap in this market. I am waiting for a retest or a clean breakout—no FOMO. Are you leaning toward the breakout or the rejection here?
#ALTUSDT #AltLayer #CryptoTechnicalAnalysis #TradingSignals #Write2Earn #BinanceSquare #1HChart #MarketStructure
📉 $ALT / USDT: The 1H Structure & The Decision Point
Market Pulse:
We are tracking $ALT on the 1-hour timeframe, and the market is currently caught in a "tightening coil." After a period of corrective behavior, the asset is testing a critical diagonal resistance line that has governed the price action for the last few sessions. With Bitcoin dominance elevated, $ALT is showing the classic signs of a "selectivity narrative"—either we break the structure or we retest lower liquidity zones.
Technical Breakdown:
• The Trend: We are currently trading within a defined 1H consolidation zone. Buyers have stepped in to defend the 0.0067 floor multiple times, suggesting a possible base-building phase.
• The Resistance: The main trendline rejection zone is sitting near 0.0069–0.0070. A clean 1H candle close above this level is required to confirm a shift in momentum.
• Volume Profile: Trading volume has been inconsistent, which often precedes a "volatility expansion." Watch for a spike in volume during the next 4 hours to confirm the direction.
Strategic Setup:
• Bullish Case: If we reclaim 0.0069, the next major supply target is 0.0072.
• Bearish Case (Short Setup): If the price fails to break the diagonal resistance and loses the 0.0067 support, we expect a retest of the 0.0063–0.0064 liquidity pocket.
• Stop Loss Management: For any short entry, a stop loss at 0.0071 (above the recent wick) provides a clean invalidation point.
The Bottom Line:
Emotional trading is a trap in this market. I am waiting for a retest or a clean breakout—no FOMO. Are you leaning toward the breakout or the rejection here?
#ALTUSDT #AltLayer #CryptoTechnicalAnalysis #TradingSignals #Write2Earn #BinanceSquare #1HChart #MarketStructure
Market Pulse:
We are tracking $ALT on the 1-hour timeframe, and the market is currently caught in a "tightening coil." After a period of corrective behavior, the asset is testing a critical diagonal resistance line that has governed the price action for the last few sessions. With Bitcoin dominance elevated, $ALT is showing the classic signs of a "selectivity narrative"—either we break the structure or we retest lower liquidity zones.
Technical Breakdown:
• The Trend: We are currently trading within a defined 1H consolidation zone. Buyers have stepped in to defend the 0.0067 floor multiple times, suggesting a possible base-building phase.
• The Resistance: The main trendline rejection zone is sitting near 0.0069–0.0070. A clean 1H candle close above this level is required to confirm a shift in momentum.
• Volume Profile: Trading volume has been inconsistent, which often precedes a "volatility expansion." Watch for a spike in volume during the next 4 hours to confirm the direction.
Strategic Setup:
• Bullish Case: If we reclaim 0.0069, the next major supply target is 0.0072.
• Bearish Case (Short Setup): If the price fails to break the diagonal resistance and loses the 0.0067 support, we expect a retest of the 0.0063–0.0064 liquidity pocket.
• Stop Loss Management: For any short entry, a stop loss at 0.0071 (above the recent wick) provides a clean invalidation point.
The Bottom Line:
Emotional trading is a trap in this market. I am waiting for a retest or a clean breakout—no FOMO. Are you leaning toward the breakout or the rejection here?
#ALTUSDT #AltLayer #CryptoTechnicalAnalysis #TradingSignals #Write2Earn #BinanceSquare #1HChart #MarketStructure
2
85

🚨 AMD JUST FLASHED A MASSIVE 1H LONG SIGNAL 🚨
The bulls are loading up at $500.30 while RSI sits at a healthy 60—not overbought, just warming up. This is the sweet spot.
📊 Trade Setup:
➡️ Entry: $500.30
🛑 SL: $485.82 (tight risk)
🎯 TP1: $529.26 (+5.8%)
🎯 TP2: $558.23 (+11.6%)
Why? Momentum is shifting, volume confirms, and the 1H structure is breaking higher. This isn't a gamble—it's a calculated push.
🔥 Question: Are you buying the dip or fading this breakout? Drop your take below 👇
#AMD #TradingSignal #CryptoStocks #Bullish #1HChart
🚨 AMD JUST FLASHED A MASSIVE 1H LONG SIGNAL 🚨
The bulls are loading up at $500.30 while RSI sits at a healthy 60—not overbought, just warming up. This is the sweet spot.
📊 Trade Setup:
➡️ Entry: $500.30
🛑 SL: $485.82 (tight risk)
🎯 TP1: $529.26 (+5.8%)
🎯 TP2: $558.23 (+11.6%)
Why? Momentum is shifting, volume confirms, and the 1H structure is breaking higher. This isn't a gamble—it's a calculated push.
🔥 Question: Are you buying the dip or fading this breakout? Drop your take below 👇
#AMD #TradingSignal #CryptoStocks #Bullish #1HChart
The bulls are loading up at $500.30 while RSI sits at a healthy 60—not overbought, just warming up. This is the sweet spot.
📊 Trade Setup:
➡️ Entry: $500.30
🛑 SL: $485.82 (tight risk)
🎯 TP1: $529.26 (+5.8%)
🎯 TP2: $558.23 (+11.6%)
Why? Momentum is shifting, volume confirms, and the 1H structure is breaking higher. This isn't a gamble—it's a calculated push.
🔥 Question: Are you buying the dip or fading this breakout? Drop your take below 👇
#AMD #TradingSignal #CryptoStocks #Bullish #1HChart
4
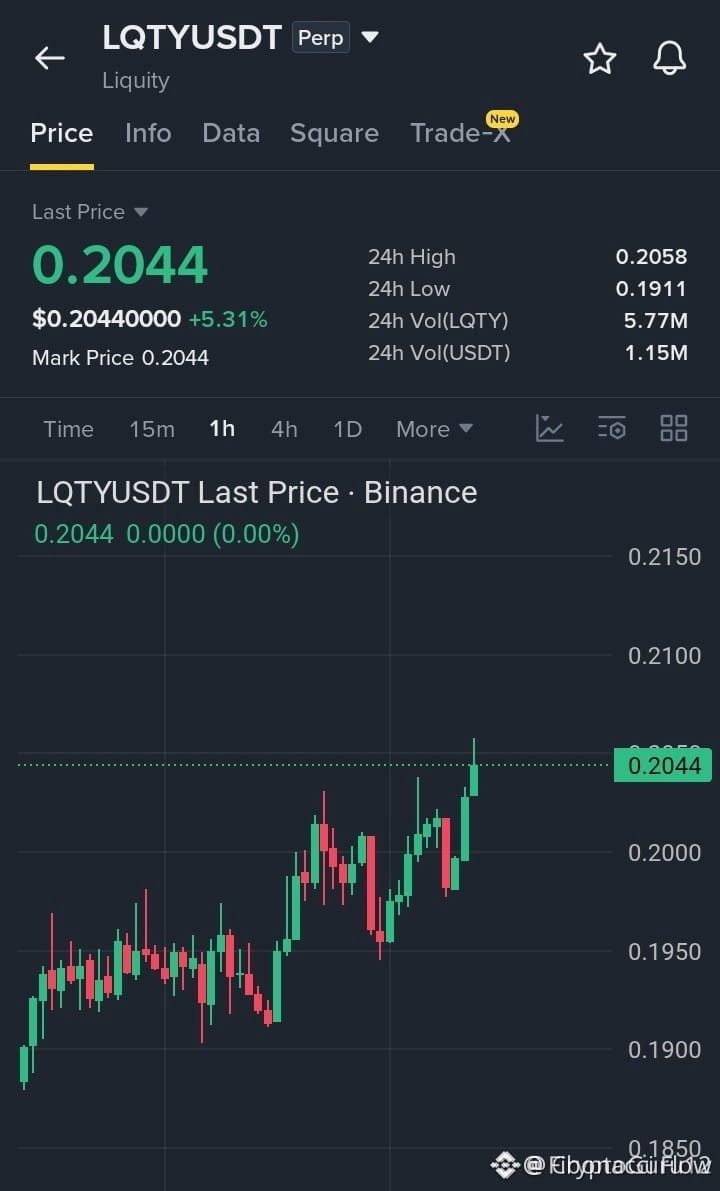
$LQTY 1H BULLISH LADDER LOADED — BREAKING $0.2058 UNLOCKS THE NEXT RUN 🚀
Entry: $0.2010–$0.2045 ⚡
Target: $0.2080 / $0.2125 / $0.2180 🚀
Stop Loss: $0.1970 ⚠️
📌 The 1H chart is printing a textbook bullish staircase — higher lows stacked with conviction as buyers defend every dip. The $0.2058 resistance is the last gatekeeper before momentum takes over. 📊 Volume is building underneath, and the pressure is mounting.
💡 A clean break and hold above this level could ignite the next expansion toward the targets above. The setup offers a tidy risk-to-reward with defined stops below structure. 💬 Are you buying the breakout or waiting for the retest of the break level? 👇
⚠️ Not financial advice. Always manage your risk. 🛡️
🏷️ #LQTY #BullishSetup #Breakout #1HChart #Crypto
🐂 🌕
$LQTY 1H BULLISH LADDER LOADED — BREAKING $0.2058 UNLOCKS THE NEXT RUN 🚀
Entry: $0.2010–$0.2045 ⚡
Target: $0.2080 / $0.2125 / $0.2180 🚀
Stop Loss: $0.1970 ⚠️
📌 The 1H chart is printing a textbook bullish staircase — higher lows stacked with conviction as buyers defend every dip. The $0.2058 resistance is the last gatekeeper before momentum takes over. 📊 Volume is building underneath, and the pressure is mounting.
💡 A clean break and hold above this level could ignite the next expansion toward the targets above. The setup offers a tidy risk-to-reward with defined stops below structure. 💬 Are you buying the breakout or waiting for the retest of the break level? 👇
⚠️ Not financial advice. Always manage your risk. 🛡️
🏷️ #LQTY #BullishSetup #Breakout #1HChart #Crypto
🐂 🌕
Entry: $0.2010–$0.2045 ⚡
Target: $0.2080 / $0.2125 / $0.2180 🚀
Stop Loss: $0.1970 ⚠️
📌 The 1H chart is printing a textbook bullish staircase — higher lows stacked with conviction as buyers defend every dip. The $0.2058 resistance is the last gatekeeper before momentum takes over. 📊 Volume is building underneath, and the pressure is mounting.
💡 A clean break and hold above this level could ignite the next expansion toward the targets above. The setup offers a tidy risk-to-reward with defined stops below structure. 💬 Are you buying the breakout or waiting for the retest of the break level? 👇
⚠️ Not financial advice. Always manage your risk. 🛡️
🏷️ #LQTY #BullishSetup #Breakout #1HChart #Crypto
🐂 🌕
28

·
--
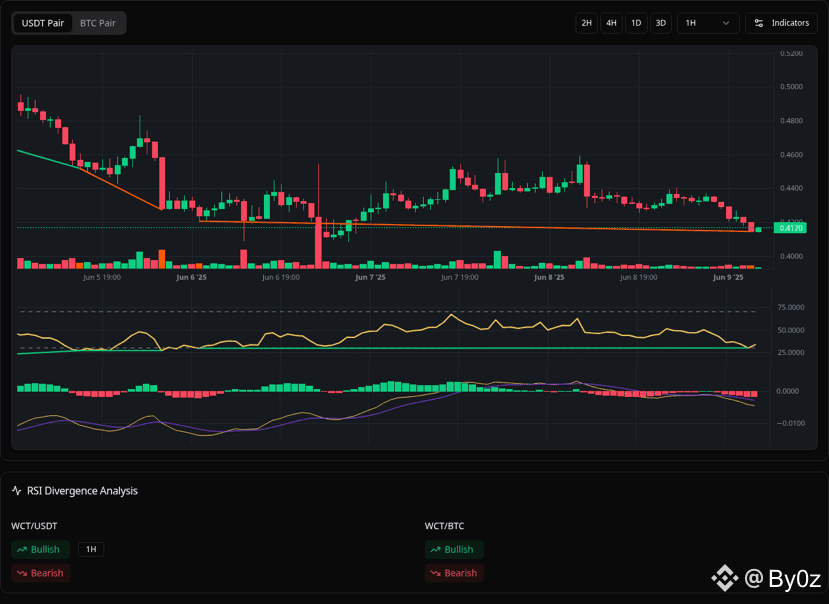
🟢 Bullish RSI Divergence Alert
Symbol: $WCT
Timeframe: 1h
Price: 0.4144
RSI: 29.9
Time: 09/06/2025 10:00 (VN)
Signal confirmations:
✓ RSI Divergence
✓ Volume Confirmation
✓ Continuous Divergence
#wct #BullishDivergence #BuySignal #1HChart
{spot}(WCTUSDT)
🟢 Bullish RSI Divergence Alert
Symbol: $WCT
Timeframe: 1h
Price: 0.4144
RSI: 29.9
Time: 09/06/2025 10:00 (VN)
Signal confirmations:
✓ RSI Divergence
✓ Volume Confirmation
✓ Continuous Divergence
#wct #BullishDivergence #BuySignal #1HChart
Symbol: $WCT
Timeframe: 1h
Price: 0.4144
RSI: 29.9
Time: 09/06/2025 10:00 (VN)
Signal confirmations:
✓ RSI Divergence
✓ Volume Confirmation
✓ Continuous Divergence
#wct #BullishDivergence #BuySignal #1HChart
11
439

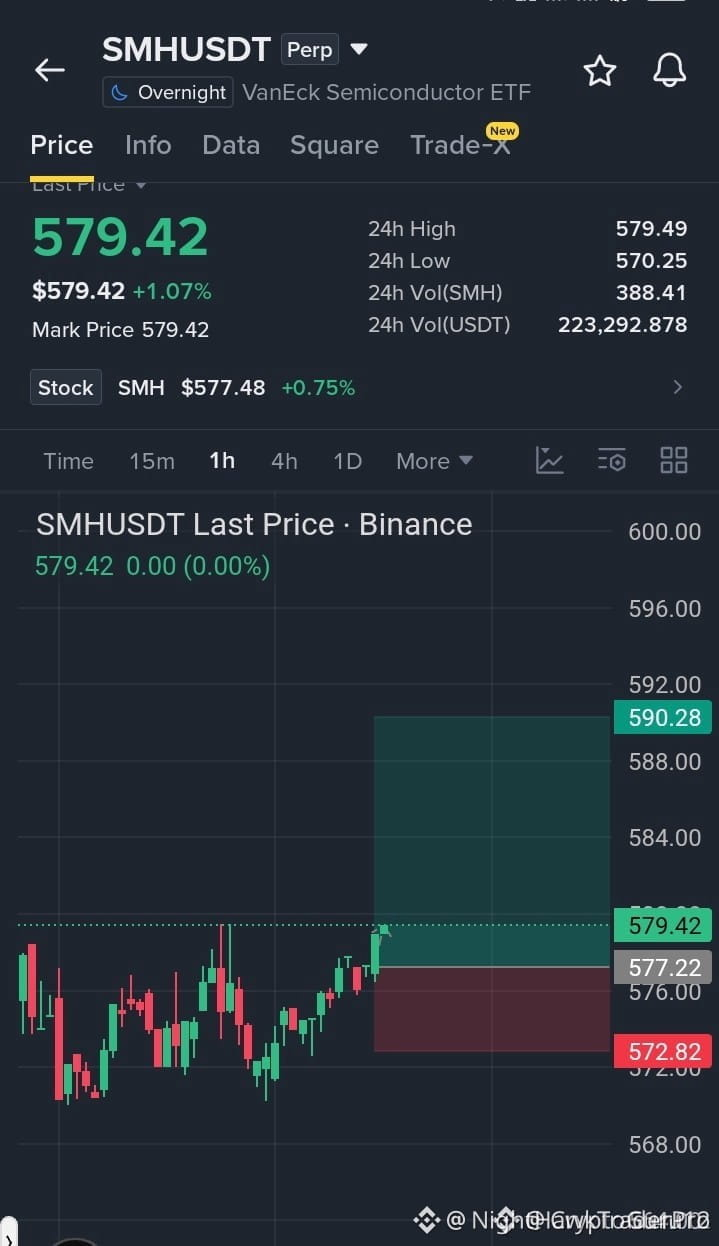
$SMH BREAKS 577.20 — HIGHER LOWS ARE BUILDING A BULLISH FORTRESS 🚀💥
Entry: 577.20–579.50 ⚡
Target: 583.00 / 586.50 / 590.00 🚀
Stop Loss: 572.80 ⚠️
📌 The 1H tape is shifting — every higher low is buyers defending their turf with more conviction, and the reclaim of 577.20 flips that former ceiling into a launchpad. 📊 Momentum is stacked behind this push, with the ascending sequence of lows giving dip-buyers a clear roadmap of where to reload without chasing.
💡 Three stacked targets above signal the market is pricing in continuation, not a one-off pop. The structure is clean, the break is decisive, and the risk window is tight enough to keep the downside honest. This is where patience meets precision. 💬 Is your bid already parked above the breakout, or are you waiting for a retest of the zone to confirm entry? 👇
⚠️ Not financial advice. Always manage your risk. 🛡️
🏷️ #SMH #Breakout #BullishSetup #1HChart #Crypto
🐂 ⚡
$SMH BREAKS 577.20 — HIGHER LOWS ARE BUILDING A BULLISH FORTRESS 🚀💥
Entry: 577.20–579.50 ⚡
Target: 583.00 / 586.50 / 590.00 🚀
Stop Loss: 572.80 ⚠️
📌 The 1H tape is shifting — every higher low is buyers defending their turf with more conviction, and the reclaim of 577.20 flips that former ceiling into a launchpad. 📊 Momentum is stacked behind this push, with the ascending sequence of lows giving dip-buyers a clear roadmap of where to reload without chasing.
💡 Three stacked targets above signal the market is pricing in continuation, not a one-off pop. The structure is clean, the break is decisive, and the risk window is tight enough to keep the downside honest. This is where patience meets precision. 💬 Is your bid already parked above the breakout, or are you waiting for a retest of the zone to confirm entry? 👇
⚠️ Not financial advice. Always manage your risk. 🛡️
🏷️ #SMH #Breakout #BullishSetup #1HChart #Crypto
🐂 ⚡
Entry: 577.20–579.50 ⚡
Target: 583.00 / 586.50 / 590.00 🚀
Stop Loss: 572.80 ⚠️
📌 The 1H tape is shifting — every higher low is buyers defending their turf with more conviction, and the reclaim of 577.20 flips that former ceiling into a launchpad. 📊 Momentum is stacked behind this push, with the ascending sequence of lows giving dip-buyers a clear roadmap of where to reload without chasing.
💡 Three stacked targets above signal the market is pricing in continuation, not a one-off pop. The structure is clean, the break is decisive, and the risk window is tight enough to keep the downside honest. This is where patience meets precision. 💬 Is your bid already parked above the breakout, or are you waiting for a retest of the zone to confirm entry? 👇
⚠️ Not financial advice. Always manage your risk. 🛡️
🏷️ #SMH #Breakout #BullishSetup #1HChart #Crypto
🐂 ⚡
25

·
--
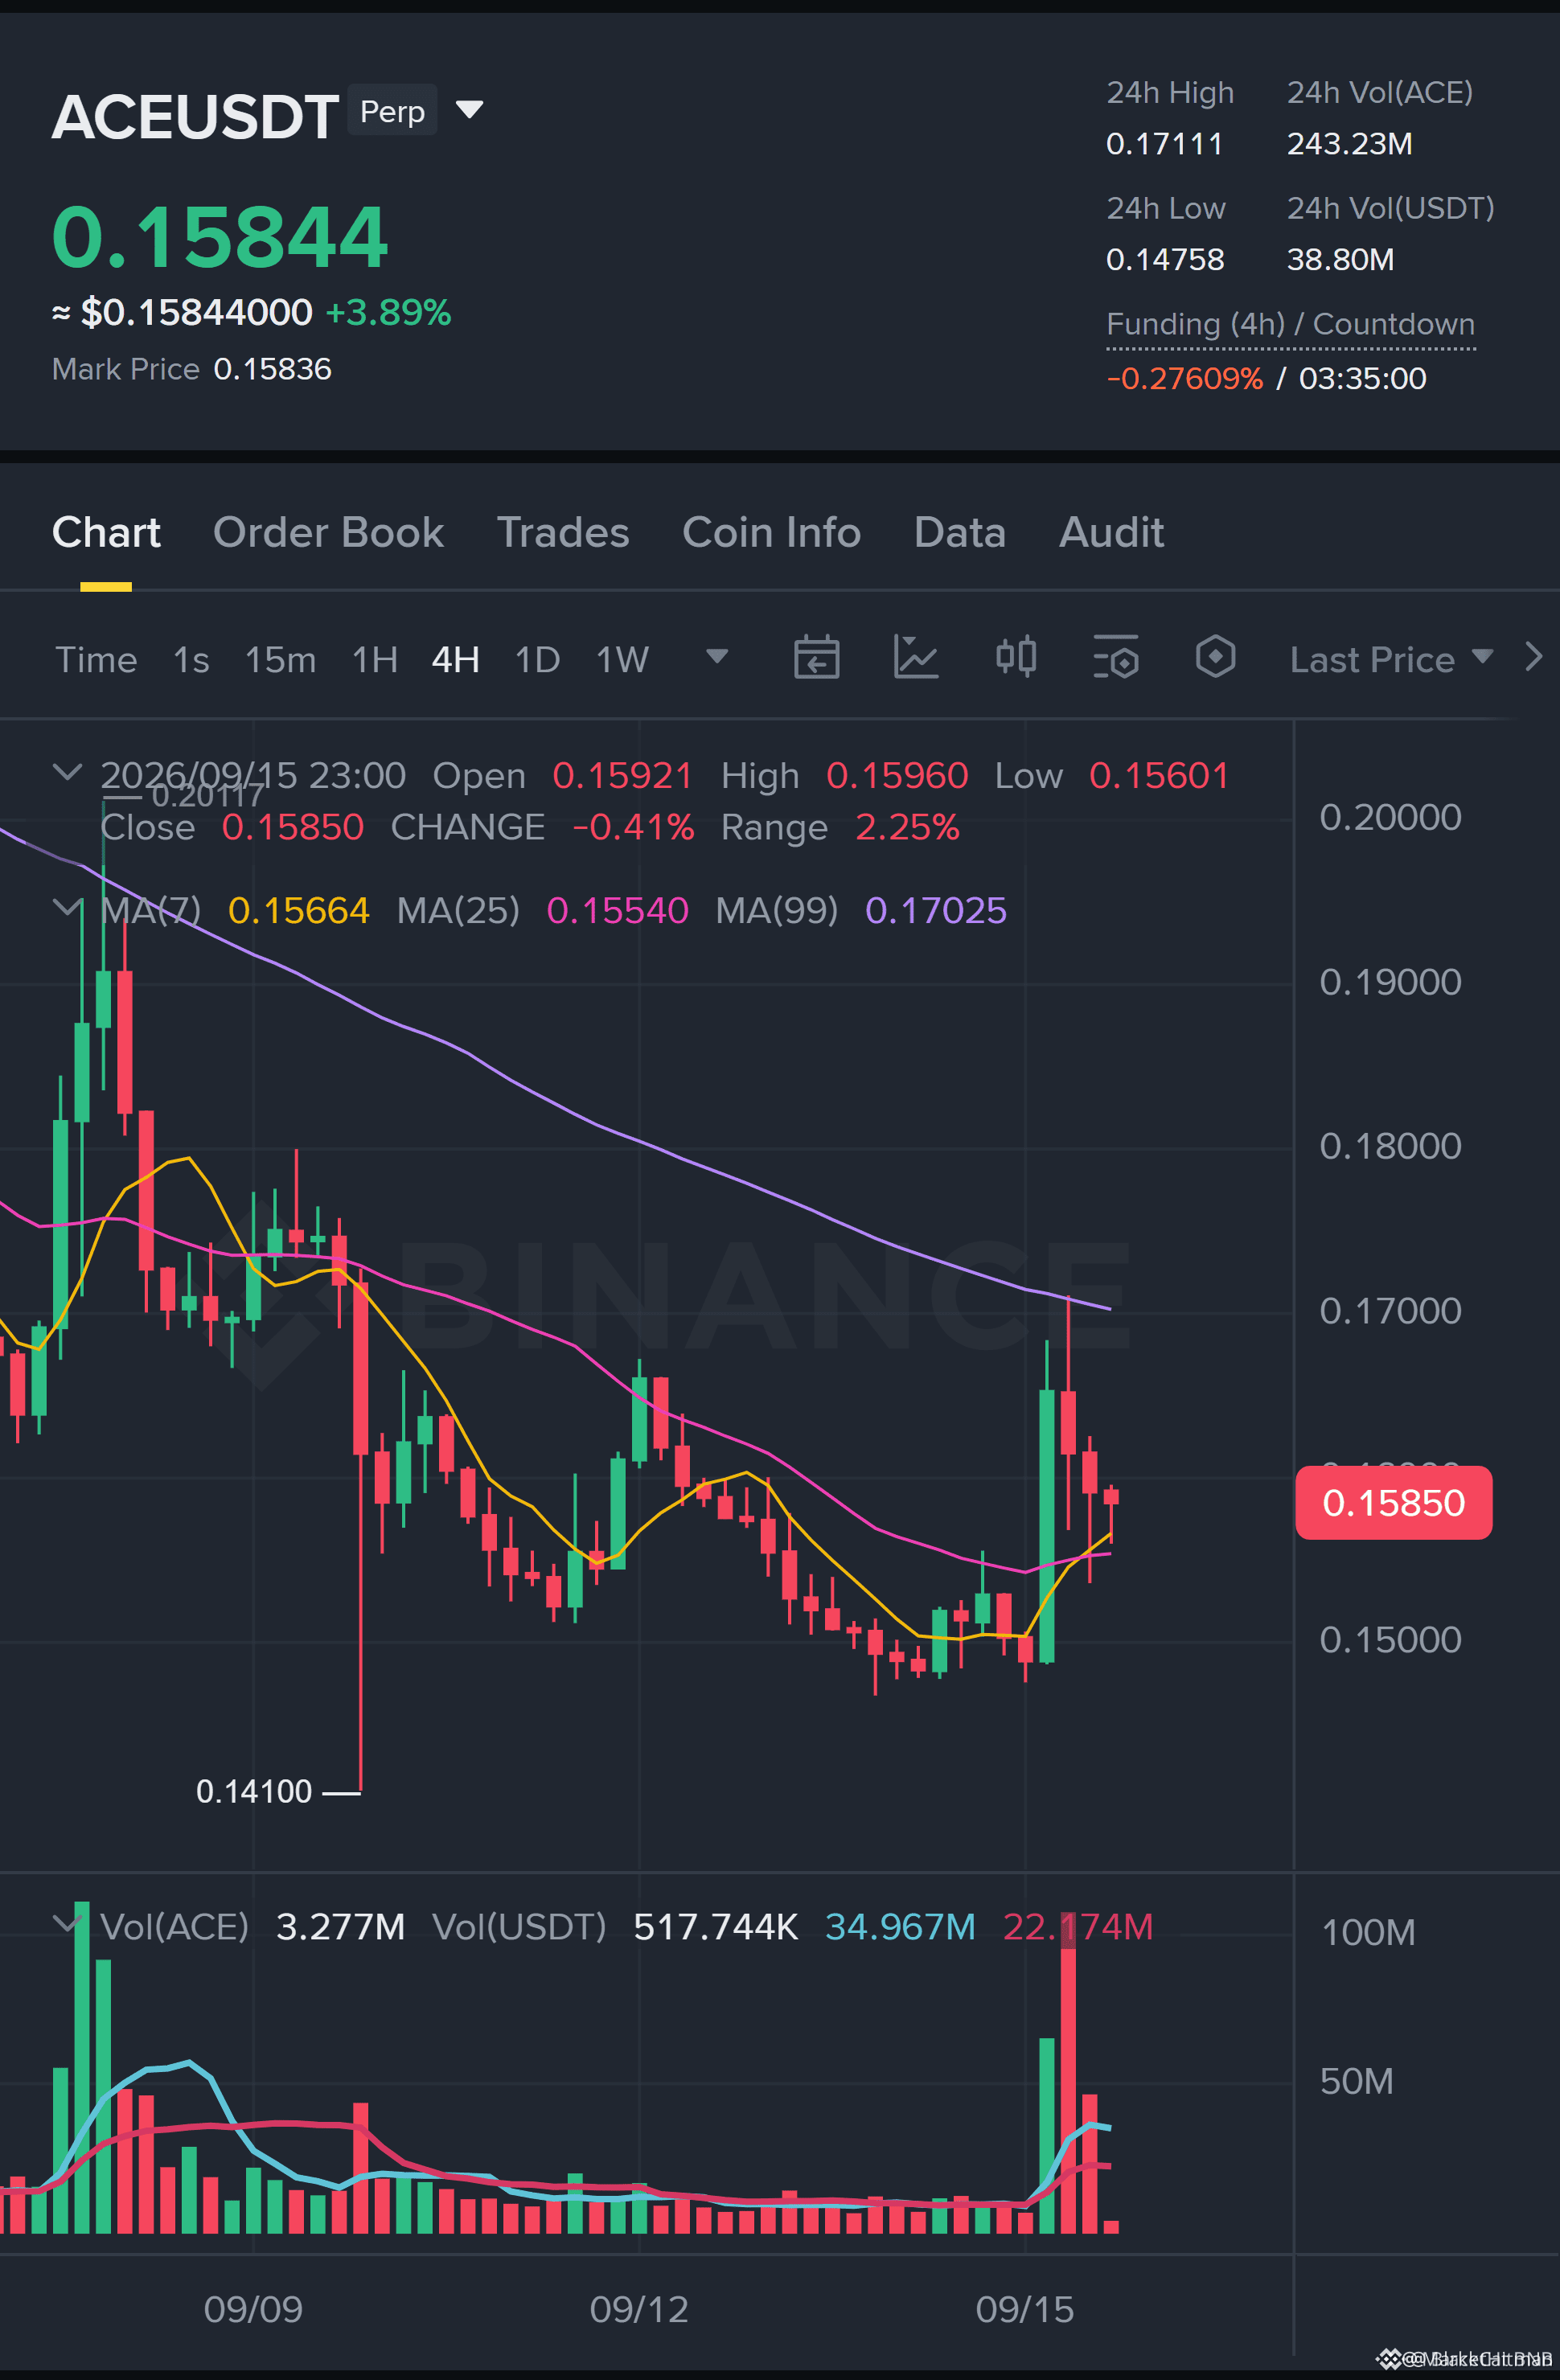
🚨 $ACE 1H LONG WATCH: RETRACEMENT READY FOR CONFIRMATION
Entry: 0.15788-0.15898 ⚡
Target: TP1 0.16174 / TP2 0.16493 / TP3 0.17111 🚀
Stop Loss: 0.15605 ⚠️
The $ACE 1H chart is showing a clean retracement into the 0.15788-0.15898 demand pocket, and buyers may try to defend it for another push. 📊 The structure supports a long continuation, but this is not a blind trigger: the $BTC 4H filter is still misaligned, and the decision score sits below the active threshold.
Treat this as a watchlist setup only. Wait for confirmation, then consider scaling out 30% / 30% / 40% across the listed targets. The R ladder stretches from 1.39R to 5.33R, but patience is the edge here. 💬 Are you waiting for a reclaim, or would you fade this until the broader market filter clears?
⚠️ Not financial advice. Always manage your risk. 🛡️
🏷️ #ACE #LongSetup #1HChart #Watchlist #Crypto
⚡ 🚀
🚨 $ACE 1H LONG WATCH: RETRACEMENT READY FOR CONFIRMATION
Entry: 0.15788-0.15898 ⚡
Target: TP1 0.16174 / TP2 0.16493 / TP3 0.17111 🚀
Stop Loss: 0.15605 ⚠️
The $ACE 1H chart is showing a clean retracement into the 0.15788-0.15898 demand pocket, and buyers may try to defend it for another push. 📊 The structure supports a long continuation, but this is not a blind trigger: the $BTC 4H filter is still misaligned, and the decision score sits below the active threshold.
Treat this as a watchlist setup only. Wait for confirmation, then consider scaling out 30% / 30% / 40% across the listed targets. The R ladder stretches from 1.39R to 5.33R, but patience is the edge here. 💬 Are you waiting for a reclaim, or would you fade this until the broader market filter clears?
⚠️ Not financial advice. Always manage your risk. 🛡️
🏷️ #ACE #LongSetup #1HChart #Watchlist #Crypto
⚡ 🚀
Entry: 0.15788-0.15898 ⚡
Target: TP1 0.16174 / TP2 0.16493 / TP3 0.17111 🚀
Stop Loss: 0.15605 ⚠️
The $ACE 1H chart is showing a clean retracement into the 0.15788-0.15898 demand pocket, and buyers may try to defend it for another push. 📊 The structure supports a long continuation, but this is not a blind trigger: the $BTC 4H filter is still misaligned, and the decision score sits below the active threshold.
Treat this as a watchlist setup only. Wait for confirmation, then consider scaling out 30% / 30% / 40% across the listed targets. The R ladder stretches from 1.39R to 5.33R, but patience is the edge here. 💬 Are you waiting for a reclaim, or would you fade this until the broader market filter clears?
⚠️ Not financial advice. Always manage your risk. 🛡️
🏷️ #ACE #LongSetup #1HChart #Watchlist #Crypto
⚡ 🚀
70
Log in to explore more content
Join global crypto users on Binance Square
⚡️ Get latest and useful information about crypto.
💬 Trusted by the world’s largest crypto exchange.
👍 Discover real insights from verified creators.
Email / Phone number
Trending Topics
1
#HuangRisksOusterOverReportedAffairWithSubordinate
48,596 views
711 Discussing
2
#AnthropicRejectsIPODelayValuationinQuestion
501,420 views
4,127 Discussing
3
#CoreWeaveJumps10%On168%RevenueGrowth
83,336 views
1,019 Discussing
4
#ZcashFallsBelow$1000ForFirstTimeSinceSeptember
46,612 views
207 Discussing
5
#MSCIRemovalMayCurbStrategy’sBitcoinBuying
8,513 views
149 Discussing
6
#CanNvidiaEarningsEaseMarketConcerns?
192,877 views
1,927 Discussing
7
#SouthKoreaToLetExchangesSuspendWithdrawalsOnSuspectedHacks
186 views
11 Discussing
8
#PythAddsNYSERealTimeDataToMarketplace
3,364 views
96 Discussing
9
#SolanaCompanyReports$3.4MQ3Revenue
1,320 views
30 Discussing
10
#TradFiForBeginners
488,002 views
3,328 Discussing