
#19
19
17,300 views
152 Discussing
Hot
Latest

·
--
$AAVE This move has got something.
On the 15m: it ran up 1.55% with volume directly to 3.36x, Z 3.10. The close even poked through the upper edge of nearly 20 consecutive 5m candles. The active buy/sell ratio is 1.32, active traded volume is -+13.7%, and it’s genuinely like someone is sweeping.
But look at OI: 15m -0.25%, 1h -0.26%. As price rises, positions are actually dropping. This doesn’t look like fresh long entries pushing it up; it feels more like shorts can’t hold and are covering, or older positions are rotating/turning over. Nominal change is still increasing (15m +1.39%), which suggests it’s not just simple closing and leaving.
OI abnormal percentile 98%, whole pool #10, nominal change #19. It’s been continuing across multiple consecutive cycles—this kind of placement usually isn’t a one-off impulse.
24h turnover is 121M; the order book is deep. If it were a real breakout, it wouldn’t be the case that nobody is there to take bids.
The easiest place for a short-covering rally to “bait you” is this: it looks fierce, but the real fuel is other people’s stop-losses. Once it breaks through and holds, don’t rush to all in—wait for a pullback and confirmation.
$AAVE This move has got something.
On the 15m: it ran up 1.55% with volume directly to 3.36x, Z 3.10. The close even poked through the upper edge of nearly 20 consecutive 5m candles. The active buy/sell ratio is 1.32, active traded volume is -+13.7%, and it’s genuinely like someone is sweeping.
But look at OI: 15m -0.25%, 1h -0.26%. As price rises, positions are actually dropping. This doesn’t look like fresh long entries pushing it up; it feels more like shorts can’t hold and are covering, or older positions are rotating/turning over. Nominal change is still increasing (15m +1.39%), which suggests it’s not just simple closing and leaving.
OI abnormal percentile 98%, whole pool #10, nominal change #19. It’s been continuing across multiple consecutive cycles—this kind of placement usually isn’t a one-off impulse.
24h turnover is 121M; the order book is deep. If it were a real breakout, it wouldn’t be the case that nobody is there to take bids.
The easiest place for a short-covering rally to “bait you” is this: it looks fierce, but the real fuel is other people’s stop-losses. Once it breaks through and holds, don’t rush to all in—wait for a pullback and confirmation.
On the 15m: it ran up 1.55% with volume directly to 3.36x, Z 3.10. The close even poked through the upper edge of nearly 20 consecutive 5m candles. The active buy/sell ratio is 1.32, active traded volume is -+13.7%, and it’s genuinely like someone is sweeping.
But look at OI: 15m -0.25%, 1h -0.26%. As price rises, positions are actually dropping. This doesn’t look like fresh long entries pushing it up; it feels more like shorts can’t hold and are covering, or older positions are rotating/turning over. Nominal change is still increasing (15m +1.39%), which suggests it’s not just simple closing and leaving.
OI abnormal percentile 98%, whole pool #10, nominal change #19. It’s been continuing across multiple consecutive cycles—this kind of placement usually isn’t a one-off impulse.
24h turnover is 121M; the order book is deep. If it were a real breakout, it wouldn’t be the case that nobody is there to take bids.
The easiest place for a short-covering rally to “bait you” is this: it looks fierce, but the real fuel is other people’s stop-losses. Once it breaks through and holds, don’t rush to all in—wait for a pullback and confirmation.

·
--
$ASTER This move feels a bit off.
The price isn’t dropping that hard—15m is only -0.58%—but volume directly spikes to 2.31x. The buy/sell ratio is 0.30, taker activity is down -53.9%, and it’s all smash orders. Even the close broke below the lower band of the last ~20 5m periods.
The key is OI. The 15m contract is -0.03%, and the 1h notional change is -348K. It doesn’t look like much, but the abnormal percentile is 89.1%—whole pool #19—with multiple consecutive periods showing continuation. This is a classic deleveraging event for longs: stop-losses and position reductions are getting squeezed together.
The funding rate is still in a high percentile recently, suggesting longs were previously pushed too full. Now volume is up, price has broken, and OI is falling—this isn’t a panic sell; it’s leverage being forced to liquidate.
With 24h turnover of 54.78M and enough depth, don’t rush to bottom-catch in this kind of structure. Wait for OI to stabilize first.
$ASTER This move feels a bit off.
The price isn’t dropping that hard—15m is only -0.58%—but volume directly spikes to 2.31x. The buy/sell ratio is 0.30, taker activity is down -53.9%, and it’s all smash orders. Even the close broke below the lower band of the last ~20 5m periods.
The key is OI. The 15m contract is -0.03%, and the 1h notional change is -348K. It doesn’t look like much, but the abnormal percentile is 89.1%—whole pool #19—with multiple consecutive periods showing continuation. This is a classic deleveraging event for longs: stop-losses and position reductions are getting squeezed together.
The funding rate is still in a high percentile recently, suggesting longs were previously pushed too full. Now volume is up, price has broken, and OI is falling—this isn’t a panic sell; it’s leverage being forced to liquidate.
With 24h turnover of 54.78M and enough depth, don’t rush to bottom-catch in this kind of structure. Wait for OI to stabilize first.
The price isn’t dropping that hard—15m is only -0.58%—but volume directly spikes to 2.31x. The buy/sell ratio is 0.30, taker activity is down -53.9%, and it’s all smash orders. Even the close broke below the lower band of the last ~20 5m periods.
The key is OI. The 15m contract is -0.03%, and the 1h notional change is -348K. It doesn’t look like much, but the abnormal percentile is 89.1%—whole pool #19—with multiple consecutive periods showing continuation. This is a classic deleveraging event for longs: stop-losses and position reductions are getting squeezed together.
The funding rate is still in a high percentile recently, suggesting longs were previously pushed too full. Now volume is up, price has broken, and OI is falling—this isn’t a panic sell; it’s leverage being forced to liquidate.
With 24h turnover of 54.78M and enough depth, don’t rush to bottom-catch in this kind of structure. Wait for OI to stabilize first.
6

Article
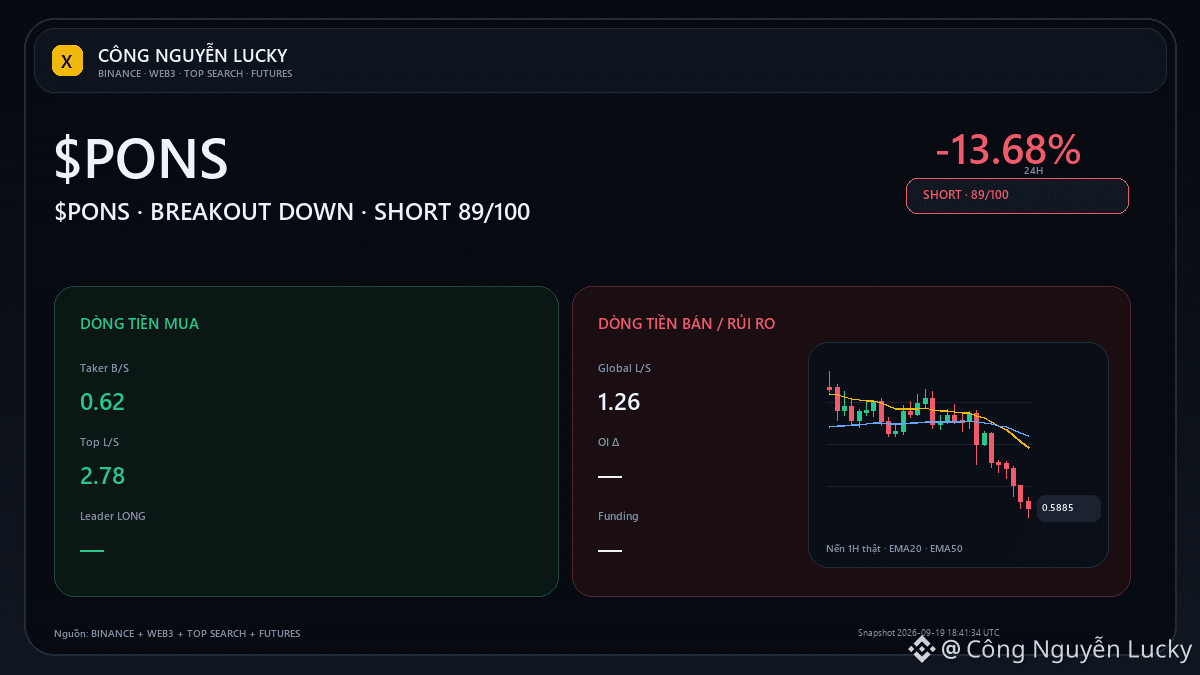
$PONS: Can the breakdown get confirmation?🚨 $PONS -13.68% but OI +5.98% — price and positions are telling two different stories. Market: 0.5839 · 24h -13.68% · volume ~107.5M USDT · 928,262 trades.
Candle volume/last 20 candles: x1.70 · ATR14 3.79% · technical bias SHORT 62/100. Nearby validation levels: support 0.5888 · resistance 0.7034.
Retest maintains the level we just broke + momentum without reversing, it will increase the probability of continuation; if the retest fails, reduce the bias immediately. The technical layers being selected are based on the current regime:
$PONS: Can the breakdown get confirmation?
🚨 $PONS -13.68% but OI +5.98% — price and positions are telling two different stories. Market: 0.5839 · 24h -13.68% · volume ~107.5M USDT · 928,262 trades.
Candle volume/last 20 candles: x1.70 · ATR14 3.79% · technical bias SHORT 62/100. Nearby validation levels: support 0.5888 · resistance 0.7034.
Retest maintains the level we just broke + momentum without reversing, it will increase the probability of continuation; if the retest fails, reduce the bias immediately. The technical layers being selected are based on the current regime:
Candle volume/last 20 candles: x1.70 · ATR14 3.79% · technical bias SHORT 62/100. Nearby validation levels: support 0.5888 · resistance 0.7034.
Retest maintains the level we just broke + momentum without reversing, it will increase the probability of continuation; if the retest fails, reduce the bias immediately. The technical layers being selected are based on the current regime:
23

·
--
$XMR There’s something interesting about this move at dawn.
The 15m candle dumped 1.76% outright, with volume running to 3.65x, Z-score 5.03, and the close even broke below the lower end of the last 20 5m candles. But what made me take a closer look was OI — 15m -0.28%, 1h -0.11%, notional dropped by more than 1M+ and 1.3M+ on both sides, while the OI anomaly percentile sat at 94.4%, and the whole-pool notional change ranked #19.
Price down + OI down: a classic deleveraging picture. This doesn’t look like fresh shorts piling in; it looks more like longs stopping out / being forced to de-risk. Aggressive turnover was -25%, buy/sell ratio 0.60 — the selling pressure was real, but positions were exiting at the same time.
Right now the price is sitting right on the edge of its own historical extreme range. Whole-pool anomaly #27, notional #19, and the depth/volume spike has already confirmed it. In plain terms, this wasn’t just any bearish candle — it’s either the final round of long liquidation, or the prelude to a larger timeframe shift. The 24h turnover of 91M is enough to support this scale of move.
I’m leaning toward first seeing whether it can hold near the boundary of this range. If it can’t, deleveraging may have only just begun; if it can, then this OI drop may actually be healthy rotation.
Watch the next 15m candle closely.
$XMR There’s something interesting about this move at dawn.
The 15m candle dumped 1.76% outright, with volume running to 3.65x, Z-score 5.03, and the close even broke below the lower end of the last 20 5m candles. But what made me take a closer look was OI — 15m -0.28%, 1h -0.11%, notional dropped by more than 1M+ and 1.3M+ on both sides, while the OI anomaly percentile sat at 94.4%, and the whole-pool notional change ranked #19.
Price down + OI down: a classic deleveraging picture. This doesn’t look like fresh shorts piling in; it looks more like longs stopping out / being forced to de-risk. Aggressive turnover was -25%, buy/sell ratio 0.60 — the selling pressure was real, but positions were exiting at the same time.
Right now the price is sitting right on the edge of its own historical extreme range. Whole-pool anomaly #27, notional #19, and the depth/volume spike has already confirmed it. In plain terms, this wasn’t just any bearish candle — it’s either the final round of long liquidation, or the prelude to a larger timeframe shift. The 24h turnover of 91M is enough to support this scale of move.
I’m leaning toward first seeing whether it can hold near the boundary of this range. If it can’t, deleveraging may have only just begun; if it can, then this OI drop may actually be healthy rotation.
Watch the next 15m candle closely.
The 15m candle dumped 1.76% outright, with volume running to 3.65x, Z-score 5.03, and the close even broke below the lower end of the last 20 5m candles. But what made me take a closer look was OI — 15m -0.28%, 1h -0.11%, notional dropped by more than 1M+ and 1.3M+ on both sides, while the OI anomaly percentile sat at 94.4%, and the whole-pool notional change ranked #19.
Price down + OI down: a classic deleveraging picture. This doesn’t look like fresh shorts piling in; it looks more like longs stopping out / being forced to de-risk. Aggressive turnover was -25%, buy/sell ratio 0.60 — the selling pressure was real, but positions were exiting at the same time.
Right now the price is sitting right on the edge of its own historical extreme range. Whole-pool anomaly #27, notional #19, and the depth/volume spike has already confirmed it. In plain terms, this wasn’t just any bearish candle — it’s either the final round of long liquidation, or the prelude to a larger timeframe shift. The 24h turnover of 91M is enough to support this scale of move.
I’m leaning toward first seeing whether it can hold near the boundary of this range. If it can’t, deleveraging may have only just begun; if it can, then this OI drop may actually be healthy rotation.
Watch the next 15m candle closely.
49
·
--
$ONE Things are starting to move a bit here.
In 15m, it’s up 1.05%, and the volume directly hits 2.03x. Over the past hour, OI is up +11.51%, and a notional 2M U has flowed into the pool. Price is rising, and so is OI—that’s typical of fresh leveraged long positions entering, not that kind of “short covering” driven by a fleeting uptick.
Active trade discrepancy is +12.8%, buy/sell ratio is 1.29, so the order book is more buyer-leaning. The abnormal percentile is 74.4%, across the whole pool #39, with nominal change #19—fairly one of the more prominent anomalies in tonight’s pools.
In the last 24h, traded value is 356M U; liquidity depth is sufficient, so it won’t just slip away if it’s lifted a little. But you need to watch this OI growth rate—once leverage is stacked up, if the direction is wrong, liquidations can come in waves. First see whether it can hold steady; don’t rush to chase.
$ONE Things are starting to move a bit here.
In 15m, it’s up 1.05%, and the volume directly hits 2.03x. Over the past hour, OI is up +11.51%, and a notional 2M U has flowed into the pool. Price is rising, and so is OI—that’s typical of fresh leveraged long positions entering, not that kind of “short covering” driven by a fleeting uptick.
Active trade discrepancy is +12.8%, buy/sell ratio is 1.29, so the order book is more buyer-leaning. The abnormal percentile is 74.4%, across the whole pool #39, with nominal change #19—fairly one of the more prominent anomalies in tonight’s pools.
In the last 24h, traded value is 356M U; liquidity depth is sufficient, so it won’t just slip away if it’s lifted a little. But you need to watch this OI growth rate—once leverage is stacked up, if the direction is wrong, liquidations can come in waves. First see whether it can hold steady; don’t rush to chase.
In 15m, it’s up 1.05%, and the volume directly hits 2.03x. Over the past hour, OI is up +11.51%, and a notional 2M U has flowed into the pool. Price is rising, and so is OI—that’s typical of fresh leveraged long positions entering, not that kind of “short covering” driven by a fleeting uptick.
Active trade discrepancy is +12.8%, buy/sell ratio is 1.29, so the order book is more buyer-leaning. The abnormal percentile is 74.4%, across the whole pool #39, with nominal change #19—fairly one of the more prominent anomalies in tonight’s pools.
In the last 24h, traded value is 356M U; liquidity depth is sufficient, so it won’t just slip away if it’s lifted a little. But you need to watch this OI growth rate—once leverage is stacked up, if the direction is wrong, liquidations can come in waves. First see whether it can hold steady; don’t rush to chase.
5


·
--
BULLA Volatility AnalysisBULLA This alert indicates a continued sell-off, -20.7%. It also notes that this is the 2nd time in 24 hours that the move is continuing in the same direction on the same coin. The prior wave that added speed late 13.4 hours ago hasn’t ended yet, and it’s still moving downward. The most lethal part is that OI shows -100.0%—the position is wiped out directly. This isn’t a normal turnover; it’s leveraged capital being knocked out, and the longs are basically carried away.
Market sentiment is highly split. On the square, template-based trading setups are being spammed. The bullish side has buy orders placed at 0.09495, with targets ranging from 0.0991 to 0.10605. On the bearish side, Void Volume, MarketHitman, and Alpha Breaker are shorting in the range 0.09043 to 0.1010, pushing the target down to 0.0773—while some Vietnamese users are directly calling for the price to fall back to 0.075. The retail long/short ratio over 24h is 1.9x, leaning bullish, but the momentum is cooling. This kind of structure—"the bulls won’t leave even though they’re stuck, and the shorts have clear downside targets"—usually still has another leg of decline that hasn’t finished yet.
BULLA Volatility Analysis
BULLA This alert indicates a continued sell-off, -20.7%. It also notes that this is the 2nd time in 24 hours that the move is continuing in the same direction on the same coin. The prior wave that added speed late 13.4 hours ago hasn’t ended yet, and it’s still moving downward. The most lethal part is that OI shows -100.0%—the position is wiped out directly. This isn’t a normal turnover; it’s leveraged capital being knocked out, and the longs are basically carried away.
Market sentiment is highly split. On the square, template-based trading setups are being spammed. The bullish side has buy orders placed at 0.09495, with targets ranging from 0.0991 to 0.10605. On the bearish side, Void Volume, MarketHitman, and Alpha Breaker are shorting in the range 0.09043 to 0.1010, pushing the target down to 0.0773—while some Vietnamese users are directly calling for the price to fall back to 0.075. The retail long/short ratio over 24h is 1.9x, leaning bullish, but the momentum is cooling. This kind of structure—"the bulls won’t leave even though they’re stuck, and the shorts have clear downside targets"—usually still has another leg of decline that hasn’t finished yet.
Market sentiment is highly split. On the square, template-based trading setups are being spammed. The bullish side has buy orders placed at 0.09495, with targets ranging from 0.0991 to 0.10605. On the bearish side, Void Volume, MarketHitman, and Alpha Breaker are shorting in the range 0.09043 to 0.1010, pushing the target down to 0.0773—while some Vietnamese users are directly calling for the price to fall back to 0.075. The retail long/short ratio over 24h is 1.9x, leaning bullish, but the momentum is cooling. This kind of structure—"the bulls won’t leave even though they’re stuck, and the shorts have clear downside targets"—usually still has another leg of decline that hasn’t finished yet.
79
·
--
$GENIUS This move is kind of interesting.
A 15m move of +2.1%—in the next hour, OI directly shot up to 9.6%. The notional increased by nearly 1 million U. The entire pool is at an abnormal percentile of 90%+. The funding rate is also pushed up to recent high levels.
This isn’t just simple price fluctuation—someone is adding leverage to go long. The buy/sell ratio is 1.01, and the difference in aggressive fills is only about 0.6%, which suggests there isn’t a very strong chasing-buy sentiment on the spot side. But on the derivatives side, there’s clearly building positions.
This kind of structure is either someone sensed something ahead of time, or it’s a bout of squeeze-pressurized buildup. OI anomaly #6, pool-wide notional change #19—placed on today’s chart, it’s pretty eye-catching.
24h trading volume is 124 million. Liquidity is sufficient. Just keep an eye on the OI so it doesn’t accelerate further—if it speeds up too much, it can easily backfire.
For now, add it to the watchlist.
$GENIUS This move is kind of interesting.
A 15m move of +2.1%—in the next hour, OI directly shot up to 9.6%. The notional increased by nearly 1 million U. The entire pool is at an abnormal percentile of 90%+. The funding rate is also pushed up to recent high levels.
This isn’t just simple price fluctuation—someone is adding leverage to go long. The buy/sell ratio is 1.01, and the difference in aggressive fills is only about 0.6%, which suggests there isn’t a very strong chasing-buy sentiment on the spot side. But on the derivatives side, there’s clearly building positions.
This kind of structure is either someone sensed something ahead of time, or it’s a bout of squeeze-pressurized buildup. OI anomaly #6, pool-wide notional change #19—placed on today’s chart, it’s pretty eye-catching.
24h trading volume is 124 million. Liquidity is sufficient. Just keep an eye on the OI so it doesn’t accelerate further—if it speeds up too much, it can easily backfire.
For now, add it to the watchlist.
A 15m move of +2.1%—in the next hour, OI directly shot up to 9.6%. The notional increased by nearly 1 million U. The entire pool is at an abnormal percentile of 90%+. The funding rate is also pushed up to recent high levels.
This isn’t just simple price fluctuation—someone is adding leverage to go long. The buy/sell ratio is 1.01, and the difference in aggressive fills is only about 0.6%, which suggests there isn’t a very strong chasing-buy sentiment on the spot side. But on the derivatives side, there’s clearly building positions.
This kind of structure is either someone sensed something ahead of time, or it’s a bout of squeeze-pressurized buildup. OI anomaly #6, pool-wide notional change #19—placed on today’s chart, it’s pretty eye-catching.
24h trading volume is 124 million. Liquidity is sufficient. Just keep an eye on the OI so it doesn’t accelerate further—if it speeds up too much, it can easily backfire.
For now, add it to the watchlist.
4
·
--
AAVE is getting interesting this time.
Over 15m it rose 0.57%. It doesn’t sound like much, but active trading skewed—active volume gap widened to 34.2%, and the buy/sell ratio is 2.04, with bids clearly rushing in.
OI didn’t move much—only -0.06% over 1h—but nominal change actually increased. 328K has entered the market; it doesn’t look like short covering so much as new longs probing.
The key is on the 5m Binance side: a 150K liquidation agent. Buying is concentrated—shorts are getting squeezed.
At the 80.8th percentile, the whole pool is anomalous #12, and nominal change is #19. Not the most explosive, but still quite high. 24h volume is 117M, and depth confirmation also touched the boundary of the recent range.
Since OI didn’t spike, it suggests leverage isn’t being piled on wildly. Price moved first and volume moved first—this structure is actually healthier than a sharp upward push driven by a sudden OI needle. If it can hold above this boundary, there may be another leg afterward. If it can’t hold, then the 150K liquidation will be the day’s high.
First, let’s see if it can reclaim that level.
AAVE is getting interesting this time.
Over 15m it rose 0.57%. It doesn’t sound like much, but active trading skewed—active volume gap widened to 34.2%, and the buy/sell ratio is 2.04, with bids clearly rushing in.
OI didn’t move much—only -0.06% over 1h—but nominal change actually increased. 328K has entered the market; it doesn’t look like short covering so much as new longs probing.
The key is on the 5m Binance side: a 150K liquidation agent. Buying is concentrated—shorts are getting squeezed.
At the 80.8th percentile, the whole pool is anomalous #12, and nominal change is #19. Not the most explosive, but still quite high. 24h volume is 117M, and depth confirmation also touched the boundary of the recent range.
Since OI didn’t spike, it suggests leverage isn’t being piled on wildly. Price moved first and volume moved first—this structure is actually healthier than a sharp upward push driven by a sudden OI needle. If it can hold above this boundary, there may be another leg afterward. If it can’t hold, then the 150K liquidation will be the day’s high.
First, let’s see if it can reclaim that level.
Over 15m it rose 0.57%. It doesn’t sound like much, but active trading skewed—active volume gap widened to 34.2%, and the buy/sell ratio is 2.04, with bids clearly rushing in.
OI didn’t move much—only -0.06% over 1h—but nominal change actually increased. 328K has entered the market; it doesn’t look like short covering so much as new longs probing.
The key is on the 5m Binance side: a 150K liquidation agent. Buying is concentrated—shorts are getting squeezed.
At the 80.8th percentile, the whole pool is anomalous #12, and nominal change is #19. Not the most explosive, but still quite high. 24h volume is 117M, and depth confirmation also touched the boundary of the recent range.
Since OI didn’t spike, it suggests leverage isn’t being piled on wildly. Price moved first and volume moved first—this structure is actually healthier than a sharp upward push driven by a sudden OI needle. If it can hold above this boundary, there may be another leg afterward. If it can’t hold, then the 150K liquidation will be the day’s high.
First, let’s see if it can reclaim that level.
2
·
--
POWER This move is a bit interesting.
In 15m, it directly surged 7.63%, with volume at 1.5x. The volatility (Z) hit 2.56, and the closing price held above the upper band of the previous ~20 5m candles. The aggressive trade imbalance is +13.2%, buy/sell ratio is 1.30, and the direction is tilted to the buy side.
But what really made me take a closer look isn’t the涨幅—it’s the OI falling. In 15m OI is -1.24%, and in 1h it’s -1.59%. While price moves upward, positions decline. This structure looks more like a short covering than new long positions being opened and driven.
Nominal changes are still substantial: 15m +6.26%, 1h +9.47%, suggesting capital turnover is accelerating.
Abnormal percentile is 83.7%, with the whole pool abnormal at #17, and nominal change at #19. Funding rates are also in a high percentile recently. 24h trading value is 215M, and depth-wise it’s sufficient.
A quick pump with OI down and funding a bit high—normally I wouldn’t chase the first candle. I’d wait for a pullback confirmation, or see whether OI can turn back positive. The shorts got hit, but whether there’s follow-through depends on whether buyers can keep it supported from here.
POWER This move is a bit interesting.
In 15m, it directly surged 7.63%, with volume at 1.5x. The volatility (Z) hit 2.56, and the closing price held above the upper band of the previous ~20 5m candles. The aggressive trade imbalance is +13.2%, buy/sell ratio is 1.30, and the direction is tilted to the buy side.
But what really made me take a closer look isn’t the涨幅—it’s the OI falling. In 15m OI is -1.24%, and in 1h it’s -1.59%. While price moves upward, positions decline. This structure looks more like a short covering than new long positions being opened and driven.
Nominal changes are still substantial: 15m +6.26%, 1h +9.47%, suggesting capital turnover is accelerating.
Abnormal percentile is 83.7%, with the whole pool abnormal at #17, and nominal change at #19. Funding rates are also in a high percentile recently. 24h trading value is 215M, and depth-wise it’s sufficient.
A quick pump with OI down and funding a bit high—normally I wouldn’t chase the first candle. I’d wait for a pullback confirmation, or see whether OI can turn back positive. The shorts got hit, but whether there’s follow-through depends on whether buyers can keep it supported from here.
In 15m, it directly surged 7.63%, with volume at 1.5x. The volatility (Z) hit 2.56, and the closing price held above the upper band of the previous ~20 5m candles. The aggressive trade imbalance is +13.2%, buy/sell ratio is 1.30, and the direction is tilted to the buy side.
But what really made me take a closer look isn’t the涨幅—it’s the OI falling. In 15m OI is -1.24%, and in 1h it’s -1.59%. While price moves upward, positions decline. This structure looks more like a short covering than new long positions being opened and driven.
Nominal changes are still substantial: 15m +6.26%, 1h +9.47%, suggesting capital turnover is accelerating.
Abnormal percentile is 83.7%, with the whole pool abnormal at #17, and nominal change at #19. Funding rates are also in a high percentile recently. 24h trading value is 215M, and depth-wise it’s sufficient.
A quick pump with OI down and funding a bit high—normally I wouldn’t chase the first candle. I’d wait for a pullback confirmation, or see whether OI can turn back positive. The shorts got hit, but whether there’s follow-through depends on whether buyers can keep it supported from here.
2

·
--
$I’m here, damn it. With this name and today’s market action, it’s actually pretty fitting.
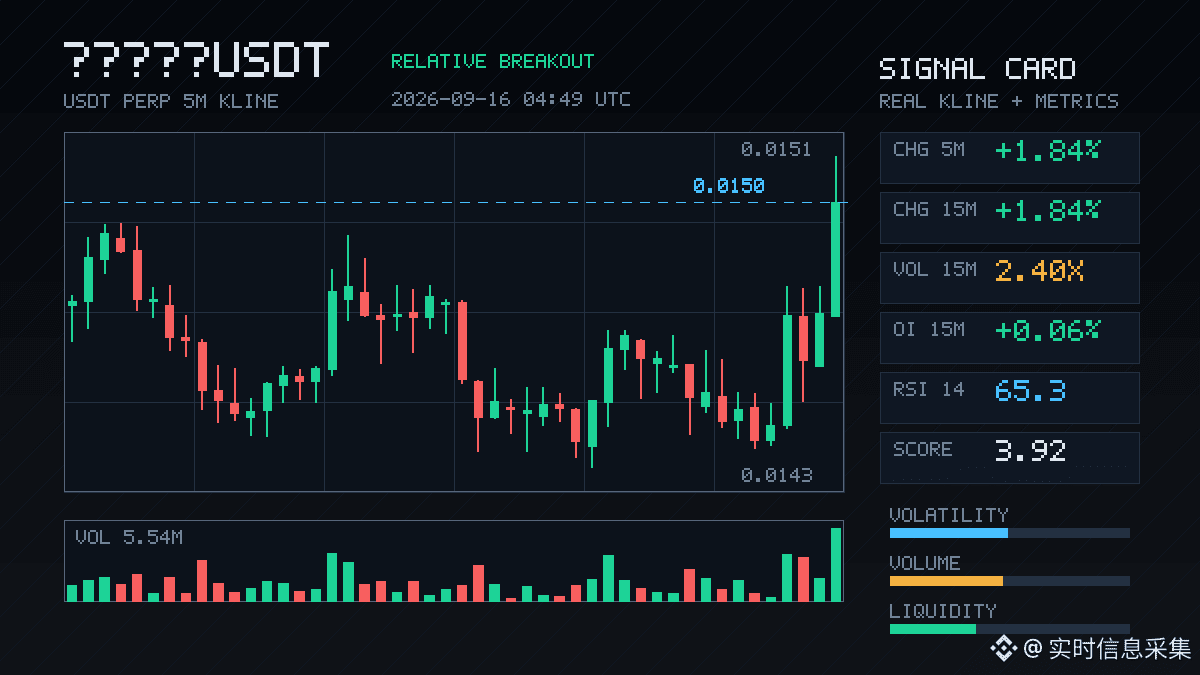
On the 15m timeframe it surged 1.84%, with volume jumping straight to 2.40x. The close pushed through the upper edge of the past ~20 5m bars. What’s even more interesting is the OI—on 15m it’s +0.06%, on 1h it’s +0.38%. The nominal increase keeps going step by step; the abnormal percentile is 77.4%, and the whole pool ranks at #19. Price is up, positions are up—classic leveraged longs piling in, not that kind of “short covering / dead-cats bounce” false heat.
But active trade volume is weak at -1.9%, with the buy/sell ratio at 0.96, slightly skewed toward sells. So yes, the move has buyers supporting it, but at this level someone is quietly distributing too. In the past 24h, turnover is 11.68M; the pool isn’t that thick. With this kind of volume scale, even a little breeze can amplify the volatility.
The breakout is real, and the leverage is real—just don’t treat a breakout in such a small pool as trend confirmation. Watch the OI. If the increase stops but the price keeps grinding in place, that’s when you really need to be careful.
$I’m here, damn it. With this name and today’s market action, it’s actually pretty fitting.
On the 15m timeframe it surged 1.84%, with volume jumping straight to 2.40x. The close pushed through the upper edge of the past ~20 5m bars. What’s even more interesting is the OI—on 15m it’s +0.06%, on 1h it’s +0.38%. The nominal increase keeps going step by step; the abnormal percentile is 77.4%, and the whole pool ranks at #19. Price is up, positions are up—classic leveraged longs piling in, not that kind of “short covering / dead-cats bounce” false heat.
But active trade volume is weak at -1.9%, with the buy/sell ratio at 0.96, slightly skewed toward sells. So yes, the move has buyers supporting it, but at this level someone is quietly distributing too. In the past 24h, turnover is 11.68M; the pool isn’t that thick. With this kind of volume scale, even a little breeze can amplify the volatility.
The breakout is real, and the leverage is real—just don’t treat a breakout in such a small pool as trend confirmation. Watch the OI. If the increase stops but the price keeps grinding in place, that’s when you really need to be careful.
On the 15m timeframe it surged 1.84%, with volume jumping straight to 2.40x. The close pushed through the upper edge of the past ~20 5m bars. What’s even more interesting is the OI—on 15m it’s +0.06%, on 1h it’s +0.38%. The nominal increase keeps going step by step; the abnormal percentile is 77.4%, and the whole pool ranks at #19. Price is up, positions are up—classic leveraged longs piling in, not that kind of “short covering / dead-cats bounce” false heat.
But active trade volume is weak at -1.9%, with the buy/sell ratio at 0.96, slightly skewed toward sells. So yes, the move has buyers supporting it, but at this level someone is quietly distributing too. In the past 24h, turnover is 11.68M; the pool isn’t that thick. With this kind of volume scale, even a little breeze can amplify the volatility.
The breakout is real, and the leverage is real—just don’t treat a breakout in such a small pool as trend confirmation. Watch the OI. If the increase stops but the price keeps grinding in place, that’s when you really need to be careful.
4
·
--
$Lobster This wave is kind of interesting.
In 15m, it surged straight up 1.31%, volume hit 8x, and the closing price broke above the upper edge of the last 20 five-minute candles. The buy/sell ratio is 1.63, and aggressive trade value is down 23.9%—the bids are genuinely pushing.
But the OI is a bit subtle—15m OI -0.68%, 1h -0.59%. Price is up while open interest is down. This doesn’t look like fresh long positions entering; it’s more like shorts are being forced to close, or older positions are being covered. The nominal change of 393K / 647K USDT doesn’t look huge, but the nominal change across the whole pool ranks #19, with an abnormal percentile of 35.9%. That suggests, relative to its own usual behavior, this move isn’t small.
In the past 24h, trading value is 189.88M, and the depth is sufficient.
My take: this short-term bounce is driven by shorts covering, not by incremental new capital building positions. This kind of structure often spikes and then runs out of follow-through, unless OI starts rising along with price. If you chase price now, you need to watch whether the positioning (open interest) volume turns.
$Lobster This wave is kind of interesting.
In 15m, it surged straight up 1.31%, volume hit 8x, and the closing price broke above the upper edge of the last 20 five-minute candles. The buy/sell ratio is 1.63, and aggressive trade value is down 23.9%—the bids are genuinely pushing.
But the OI is a bit subtle—15m OI -0.68%, 1h -0.59%. Price is up while open interest is down. This doesn’t look like fresh long positions entering; it’s more like shorts are being forced to close, or older positions are being covered. The nominal change of 393K / 647K USDT doesn’t look huge, but the nominal change across the whole pool ranks #19, with an abnormal percentile of 35.9%. That suggests, relative to its own usual behavior, this move isn’t small.
In the past 24h, trading value is 189.88M, and the depth is sufficient.
My take: this short-term bounce is driven by shorts covering, not by incremental new capital building positions. This kind of structure often spikes and then runs out of follow-through, unless OI starts rising along with price. If you chase price now, you need to watch whether the positioning (open interest) volume turns.
In 15m, it surged straight up 1.31%, volume hit 8x, and the closing price broke above the upper edge of the last 20 five-minute candles. The buy/sell ratio is 1.63, and aggressive trade value is down 23.9%—the bids are genuinely pushing.
But the OI is a bit subtle—15m OI -0.68%, 1h -0.59%. Price is up while open interest is down. This doesn’t look like fresh long positions entering; it’s more like shorts are being forced to close, or older positions are being covered. The nominal change of 393K / 647K USDT doesn’t look huge, but the nominal change across the whole pool ranks #19, with an abnormal percentile of 35.9%. That suggests, relative to its own usual behavior, this move isn’t small.
In the past 24h, trading value is 189.88M, and the depth is sufficient.
My take: this short-term bounce is driven by shorts covering, not by incremental new capital building positions. This kind of structure often spikes and then runs out of follow-through, unless OI starts rising along with price. If you chase price now, you need to watch whether the positioning (open interest) volume turns.
11
·
--
The flavor of this uptrend deleveraging move in POLYX is way too obvious.
On 15m, it directly dumped 1.22%, and the volume hit 8x. At the same time, OI fell by 3%, with the notional shrinking by over a hundred thousand U. On the 1h chart, it’s also in sync with de-leveraging/position reduction. When price drops + OI drops together, this combination basically means longs are being forced to close out passively—stop-losses are getting swept. It doesn’t look like new shorts just entered to slam the book.
The passive成交差 is -29.9%, the buy/sell ratio is 0.54, and the sell pressure is genuinely skewed toward the sellers. Also, the OI abnormal percentile has reached 99%—the whole pool is ranked at #19, and it’s been continuing across multiple consecutive cycles. Signals like this usually aren’t finished yet.
Over 24h, the trading value is only 7.76M, and the pool itself isn’t deep. With liquidity like this, you can push out to kill the longs, and rebounds are also easier to be fake. First, see whether this leverage cleanup is truly done—don’t rush to catch.
The flavor of this uptrend deleveraging move in POLYX is way too obvious.
On 15m, it directly dumped 1.22%, and the volume hit 8x. At the same time, OI fell by 3%, with the notional shrinking by over a hundred thousand U. On the 1h chart, it’s also in sync with de-leveraging/position reduction. When price drops + OI drops together, this combination basically means longs are being forced to close out passively—stop-losses are getting swept. It doesn’t look like new shorts just entered to slam the book.
The passive成交差 is -29.9%, the buy/sell ratio is 0.54, and the sell pressure is genuinely skewed toward the sellers. Also, the OI abnormal percentile has reached 99%—the whole pool is ranked at #19, and it’s been continuing across multiple consecutive cycles. Signals like this usually aren’t finished yet.
Over 24h, the trading value is only 7.76M, and the pool itself isn’t deep. With liquidity like this, you can push out to kill the longs, and rebounds are also easier to be fake. First, see whether this leverage cleanup is truly done—don’t rush to catch.
On 15m, it directly dumped 1.22%, and the volume hit 8x. At the same time, OI fell by 3%, with the notional shrinking by over a hundred thousand U. On the 1h chart, it’s also in sync with de-leveraging/position reduction. When price drops + OI drops together, this combination basically means longs are being forced to close out passively—stop-losses are getting swept. It doesn’t look like new shorts just entered to slam the book.
The passive成交差 is -29.9%, the buy/sell ratio is 0.54, and the sell pressure is genuinely skewed toward the sellers. Also, the OI abnormal percentile has reached 99%—the whole pool is ranked at #19, and it’s been continuing across multiple consecutive cycles. Signals like this usually aren’t finished yet.
Over 24h, the trading value is only 7.76M, and the pool itself isn’t deep. With liquidity like this, you can push out to kill the longs, and rebounds are also easier to be fake. First, see whether this leverage cleanup is truly done—don’t rush to catch.
108
·
--
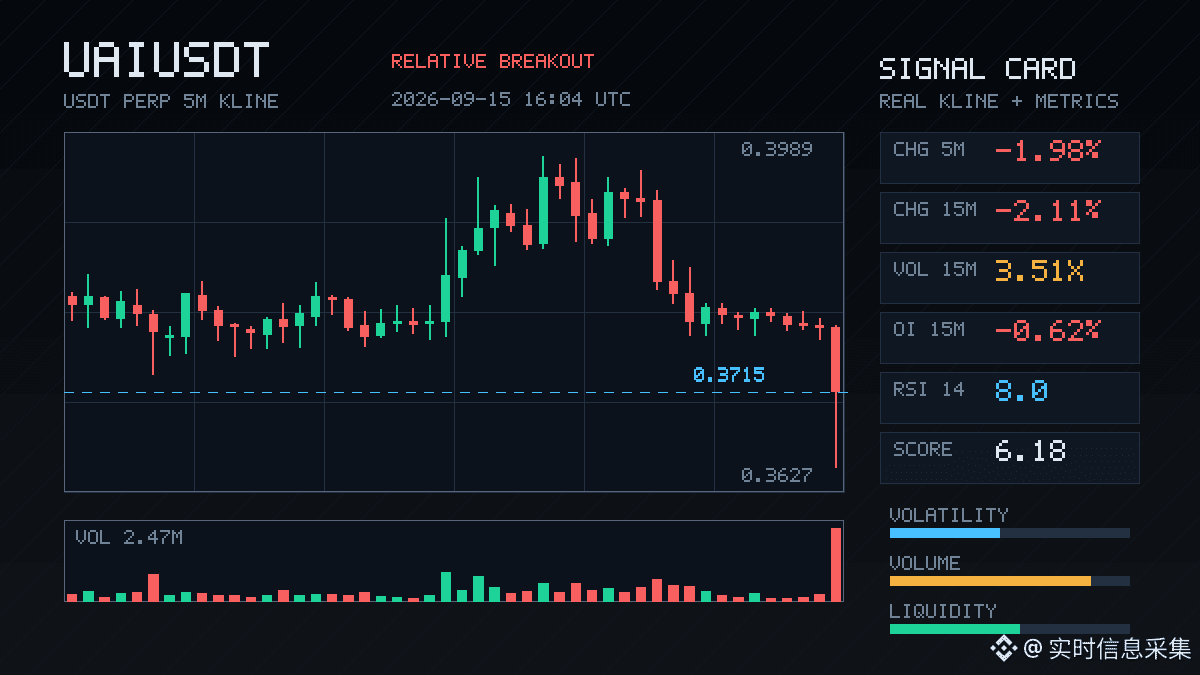
$UAI This 15m drop really hit hard—-2.11% alongside a 3.5x volume spike, with active order flow lagging by -15%. The buy-sell ratio fell to 0.74. At the close, price directly broke below the lower bound of the past ~20 5m candles. Short-term support wasn’t held.
What’s interesting is that OI is dropping in sync: 15m -0.62%, 1h -1.03%, with notional shrinking by 1 million USDT. This doesn’t look like new short positions pressing; it’s more like longs can’t bear it and deleveraged themselves—liquidation and stop-loss cascades have handed over the chips.
The abnormal percentile is 88.3%. In terms of whole-pool notional change, it ranks #19. Both depth and trades confirm it—this spot is worth watching closely. If it’s passive deleveraging, once the chips are rotated, a rebound is often easier to see. But if OI keeps dropping next and price still can’t rise, that would indicate a real retreat—don’t force a hard hold.
For now, at this point, first watch whether price can quickly reclaim the lower edge of the range. If it can’t, then it’s likely to follow the move and go seek lower liquidity.
$UAI This 15m drop really hit hard—-2.11% alongside a 3.5x volume spike, with active order flow lagging by -15%. The buy-sell ratio fell to 0.74. At the close, price directly broke below the lower bound of the past ~20 5m candles. Short-term support wasn’t held.
What’s interesting is that OI is dropping in sync: 15m -0.62%, 1h -1.03%, with notional shrinking by 1 million USDT. This doesn’t look like new short positions pressing; it’s more like longs can’t bear it and deleveraged themselves—liquidation and stop-loss cascades have handed over the chips.
The abnormal percentile is 88.3%. In terms of whole-pool notional change, it ranks #19. Both depth and trades confirm it—this spot is worth watching closely. If it’s passive deleveraging, once the chips are rotated, a rebound is often easier to see. But if OI keeps dropping next and price still can’t rise, that would indicate a real retreat—don’t force a hard hold.
For now, at this point, first watch whether price can quickly reclaim the lower edge of the range. If it can’t, then it’s likely to follow the move and go seek lower liquidity.
What’s interesting is that OI is dropping in sync: 15m -0.62%, 1h -1.03%, with notional shrinking by 1 million USDT. This doesn’t look like new short positions pressing; it’s more like longs can’t bear it and deleveraged themselves—liquidation and stop-loss cascades have handed over the chips.
The abnormal percentile is 88.3%. In terms of whole-pool notional change, it ranks #19. Both depth and trades confirm it—this spot is worth watching closely. If it’s passive deleveraging, once the chips are rotated, a rebound is often easier to see. But if OI keeps dropping next and price still can’t rise, that would indicate a real retreat—don’t force a hard hold.
For now, at this point, first watch whether price can quickly reclaim the lower edge of the range. If it can’t, then it’s likely to follow the move and go seek lower liquidity.
9

·
--
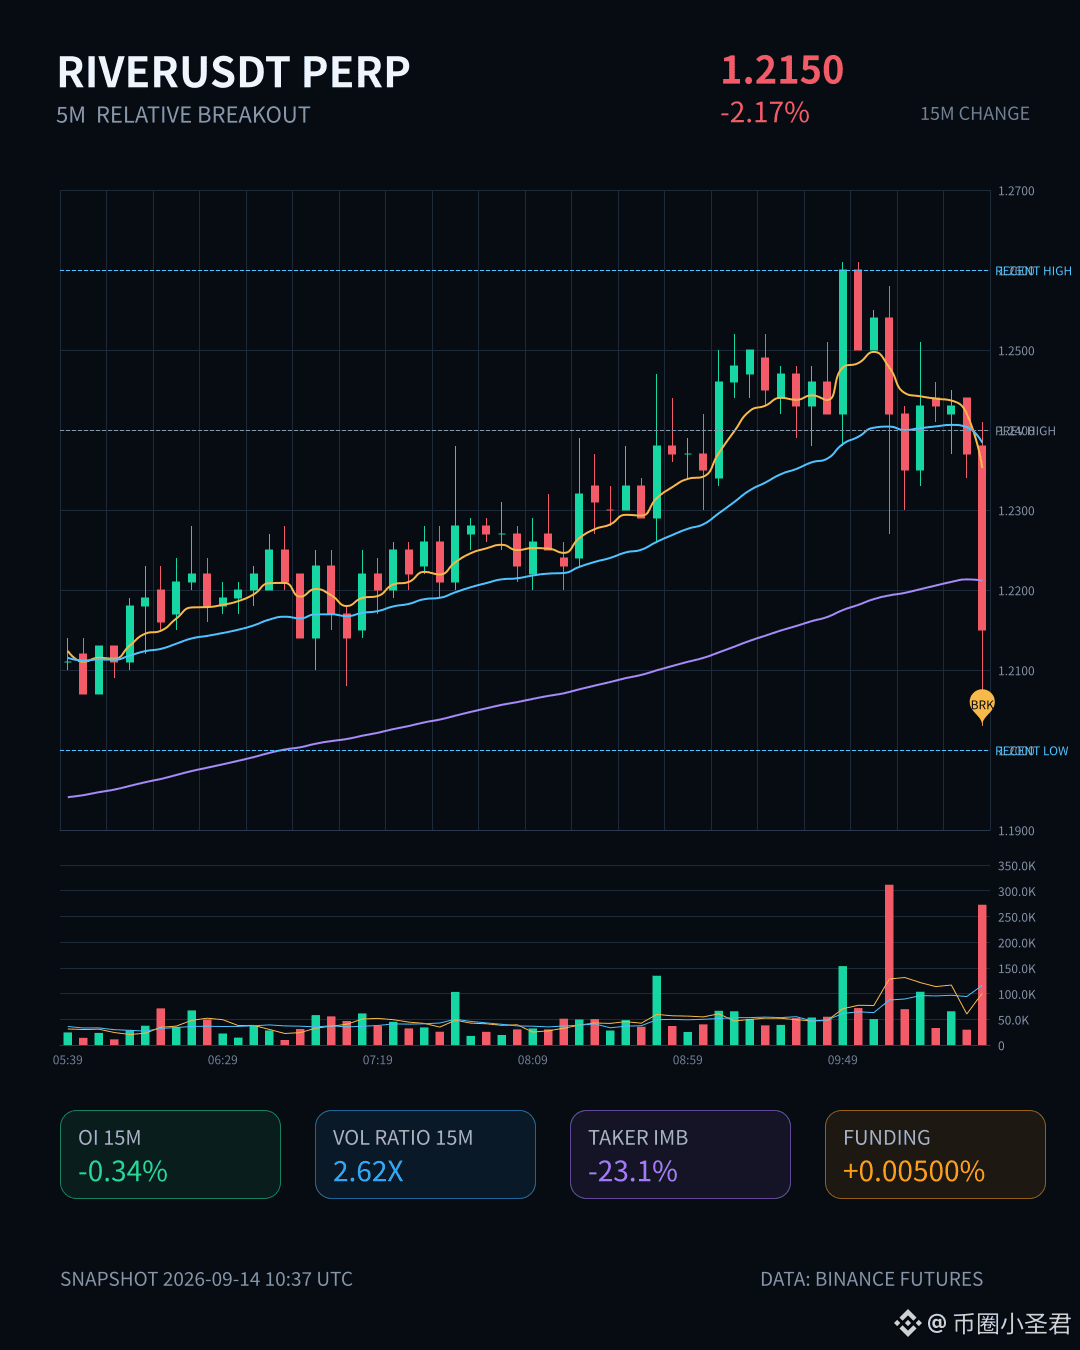
$RIVER This 15m drop is down 2.17%. Volume shot straight up to 2.62x, volatility (Z) hit 4.09—this isn’t an ordinary slow bleed; there’s capital hard-selling.
Focus on OI: on 15m it’s down 0.34%, and on 1h it’s down 0.50%, with notional falling by nearly 200k U. Price down + OI down is a classic sign that leveraged longs are being liquidated or they’re actively shrinking positions—this isn’t fresh short entry. The abnormal percentile is 91.9%; it ranks #19 across the whole pool, meaning this move is pretty conspicuous in the broader market.
The closing price has already broken below the lower band of the last ~20 5m candles. Active traded volume is -23.1%, buy/sell ratio is 0.63—sellers are fully in control. A 24h turnover of 28M isn’t huge for the whole pool; with volume like this, it’s hard for sentiment to repair immediately in the short term.
First, see whether this deleveraging can find support/absorption below—don’t rush to catch a falling knife.
$RIVER This 15m drop is down 2.17%. Volume shot straight up to 2.62x, volatility (Z) hit 4.09—this isn’t an ordinary slow bleed; there’s capital hard-selling.
Focus on OI: on 15m it’s down 0.34%, and on 1h it’s down 0.50%, with notional falling by nearly 200k U. Price down + OI down is a classic sign that leveraged longs are being liquidated or they’re actively shrinking positions—this isn’t fresh short entry. The abnormal percentile is 91.9%; it ranks #19 across the whole pool, meaning this move is pretty conspicuous in the broader market.
The closing price has already broken below the lower band of the last ~20 5m candles. Active traded volume is -23.1%, buy/sell ratio is 0.63—sellers are fully in control. A 24h turnover of 28M isn’t huge for the whole pool; with volume like this, it’s hard for sentiment to repair immediately in the short term.
First, see whether this deleveraging can find support/absorption below—don’t rush to catch a falling knife.
Focus on OI: on 15m it’s down 0.34%, and on 1h it’s down 0.50%, with notional falling by nearly 200k U. Price down + OI down is a classic sign that leveraged longs are being liquidated or they’re actively shrinking positions—this isn’t fresh short entry. The abnormal percentile is 91.9%; it ranks #19 across the whole pool, meaning this move is pretty conspicuous in the broader market.
The closing price has already broken below the lower band of the last ~20 5m candles. Active traded volume is -23.1%, buy/sell ratio is 0.63—sellers are fully in control. A 24h turnover of 28M isn’t huge for the whole pool; with volume like this, it’s hard for sentiment to repair immediately in the short term.
First, see whether this deleveraging can find support/absorption below—don’t rush to catch a falling knife.
20

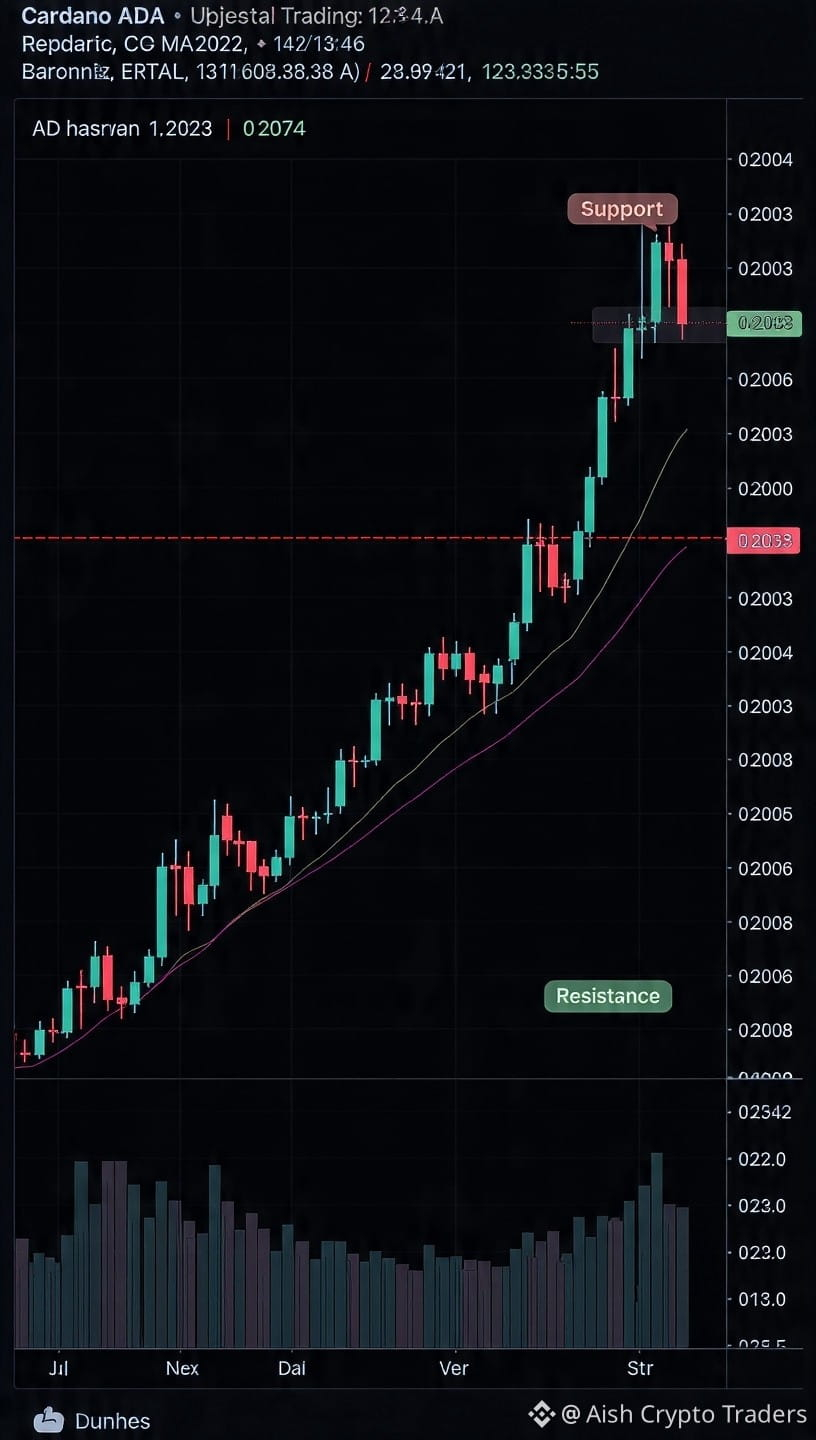
🚨 $ADA UPDATE: SEP 12, 2026 🚨
Cardano is trading at $0.2074 right now
24h Drop: -0.48% 📉
🔴 Resistance: $0.2093 zone
Break and hold above this = Next target $0.22
🟢 Support: $0.2032 zone
Lose this and we could retest $0.19
24h Range: $0.2032 - $0.2093
ADA is up +15.15% this month 🚀
Market Cap: $7.68B | Rank #19
Perp: ADAUSDT trading active
Bullish or Bearish on ADA? Comment 👇
#Cardano #ADA #Crypto r #Trading #DeFi #Staking #Ouroboros #BinanceSquareTalks #BinanceSquare $ADA $AAPL.US
{spot}(ADAUSDT)
🚨 $ADA UPDATE: SEP 12, 2026 🚨
Cardano is trading at $0.2074 right now
24h Drop: -0.48% 📉
🔴 Resistance: $0.2093 zone
Break and hold above this = Next target $0.22
🟢 Support: $0.2032 zone
Lose this and we could retest $0.19
24h Range: $0.2032 - $0.2093
ADA is up +15.15% this month 🚀
Market Cap: $7.68B | Rank #19
Perp: ADAUSDT trading active
Bullish or Bearish on ADA? Comment 👇
#Cardano #ADA #Crypto r #Trading #DeFi #Staking #Ouroboros #BinanceSquareTalks #BinanceSquare $ADA $AAPL.US
Cardano is trading at $0.2074 right now
24h Drop: -0.48% 📉
🔴 Resistance: $0.2093 zone
Break and hold above this = Next target $0.22
🟢 Support: $0.2032 zone
Lose this and we could retest $0.19
24h Range: $0.2032 - $0.2093
ADA is up +15.15% this month 🚀
Market Cap: $7.68B | Rank #19
Perp: ADAUSDT trading active
Bullish or Bearish on ADA? Comment 👇
#Cardano #ADA #Crypto r #Trading #DeFi #Staking #Ouroboros #BinanceSquareTalks #BinanceSquare $ADA $AAPL.US
ADA+6.50%
AAPLUS-0.01%
1
9
·
--
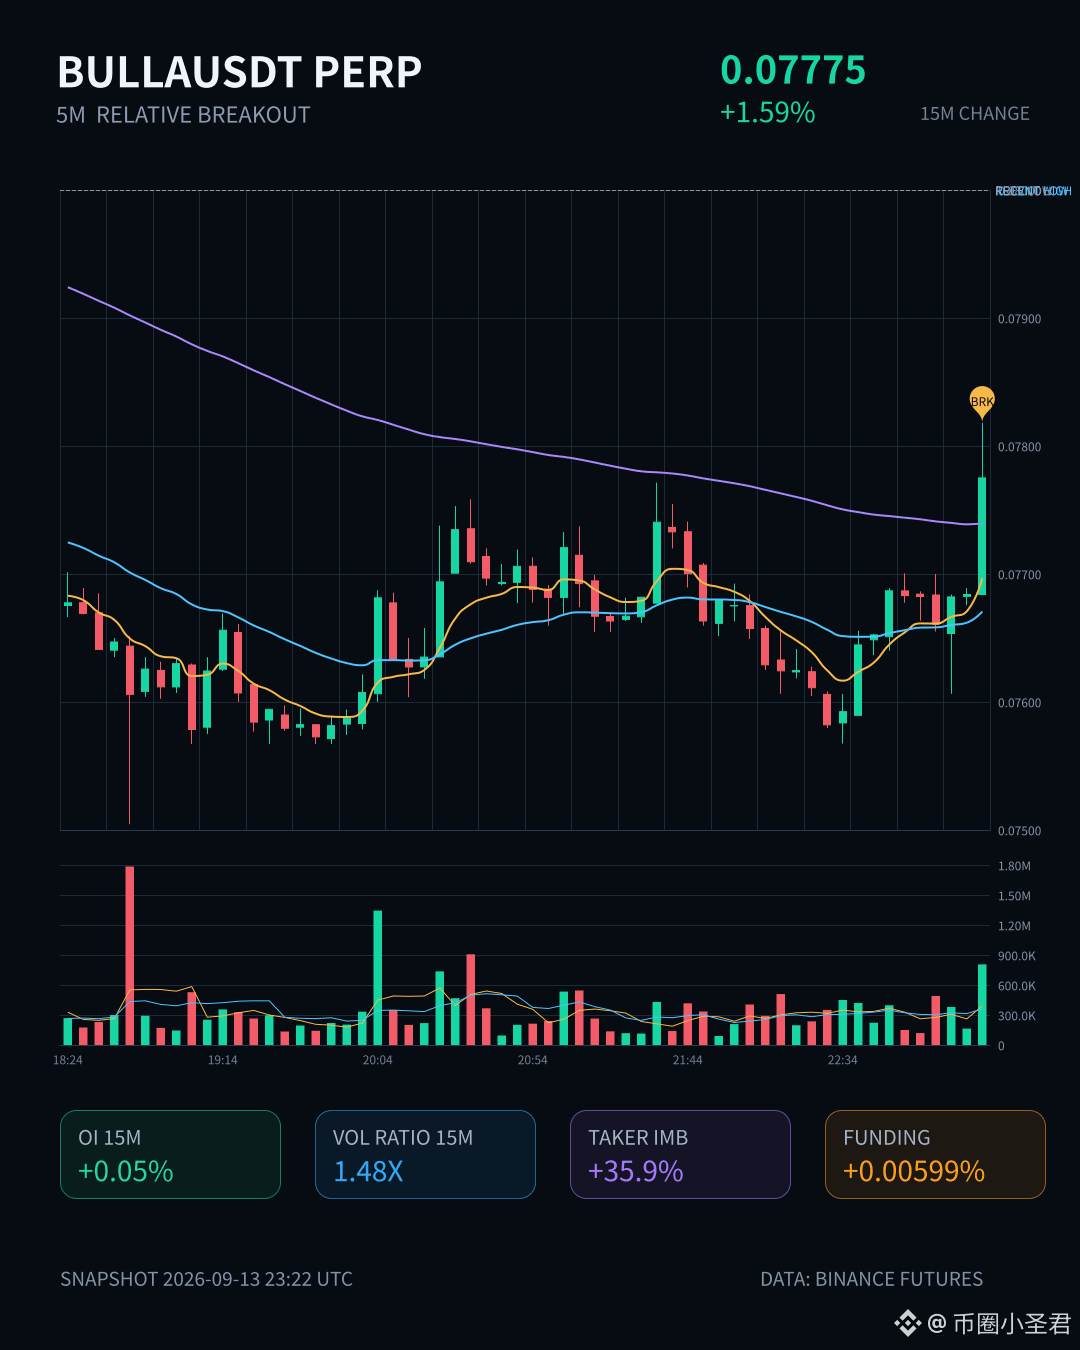
$BULLA This 15m move is kind of interesting. A 1.59% gain isn’t violent, but paired with the OI hourly +0.23% and notional +2.2%—it feels more like fresh leverage is slowly entering the market rather than old longs adding and just spinning.
The active trades are off by 35.9%, the buy-sell ratio is 2.12. The 5m closing price stands above the top of the recent range over nearly 20 intervals. If you chase the breakout from here, your stop-loss room is actually pretty clear, but don’t chase into the 15m candle’s upper wick with 1.48x volume.
Abnormal in the whole pool: #23, change in notional: #19. BULLA isn’t really the star today, but depth confirmation + net active buying are solid; the short-term structure is fine.
$BULLA This 15m move is kind of interesting. A 1.59% gain isn’t violent, but paired with the OI hourly +0.23% and notional +2.2%—it feels more like fresh leverage is slowly entering the market rather than old longs adding and just spinning.
The active trades are off by 35.9%, the buy-sell ratio is 2.12. The 5m closing price stands above the top of the recent range over nearly 20 intervals. If you chase the breakout from here, your stop-loss room is actually pretty clear, but don’t chase into the 15m candle’s upper wick with 1.48x volume.
Abnormal in the whole pool: #23, change in notional: #19. BULLA isn’t really the star today, but depth confirmation + net active buying are solid; the short-term structure is fine.
The active trades are off by 35.9%, the buy-sell ratio is 2.12. The 5m closing price stands above the top of the recent range over nearly 20 intervals. If you chase the breakout from here, your stop-loss room is actually pretty clear, but don’t chase into the 15m candle’s upper wick with 1.48x volume.
Abnormal in the whole pool: #23, change in notional: #19. BULLA isn’t really the star today, but depth confirmation + net active buying are solid; the short-term structure is fine.
113
·
--
$SOPH This drop isn’t that violent, but the structure is quite interesting—prices move down while OI shrinks in sync. Over 15m it’s -0.99%, over 1h -1.08%, with notional down nearly 200k U. This doesn’t look like shorts aggressively smashing the market; it looks more like longs themselves are reducing positions, with stop-losses getting swept.
Trading volume did pick up though: 15m reached 3.65x. The close broke below the lower edge of the recent ~20 5m candles. Aggressive volume is down -6.8%, buy/sell ratio is 0.87, and the sell-side pressure is real. But OI’s abnormal percentile is 87.9%, and it’s been continuing across several cycles. This kind of deleveraging-style decline often ends up cleaner than a simple sell-off smash—chips are rotating, not panic stampeding.
In the past 24h, turnover is 22.75M, and the abnormality rank in the pool is #19. First observe whether price can reclaim the lower edge. If it can’t, there’s another row of stops waiting below.
$SOPH This drop isn’t that violent, but the structure is quite interesting—prices move down while OI shrinks in sync. Over 15m it’s -0.99%, over 1h -1.08%, with notional down nearly 200k U. This doesn’t look like shorts aggressively smashing the market; it looks more like longs themselves are reducing positions, with stop-losses getting swept.
Trading volume did pick up though: 15m reached 3.65x. The close broke below the lower edge of the recent ~20 5m candles. Aggressive volume is down -6.8%, buy/sell ratio is 0.87, and the sell-side pressure is real. But OI’s abnormal percentile is 87.9%, and it’s been continuing across several cycles. This kind of deleveraging-style decline often ends up cleaner than a simple sell-off smash—chips are rotating, not panic stampeding.
In the past 24h, turnover is 22.75M, and the abnormality rank in the pool is #19. First observe whether price can reclaim the lower edge. If it can’t, there’s another row of stops waiting below.
Trading volume did pick up though: 15m reached 3.65x. The close broke below the lower edge of the recent ~20 5m candles. Aggressive volume is down -6.8%, buy/sell ratio is 0.87, and the sell-side pressure is real. But OI’s abnormal percentile is 87.9%, and it’s been continuing across several cycles. This kind of deleveraging-style decline often ends up cleaner than a simple sell-off smash—chips are rotating, not panic stampeding.
In the past 24h, turnover is 22.75M, and the abnormality rank in the pool is #19. First observe whether price can reclaim the lower edge. If it can’t, there’s another row of stops waiting below.
6
·
--
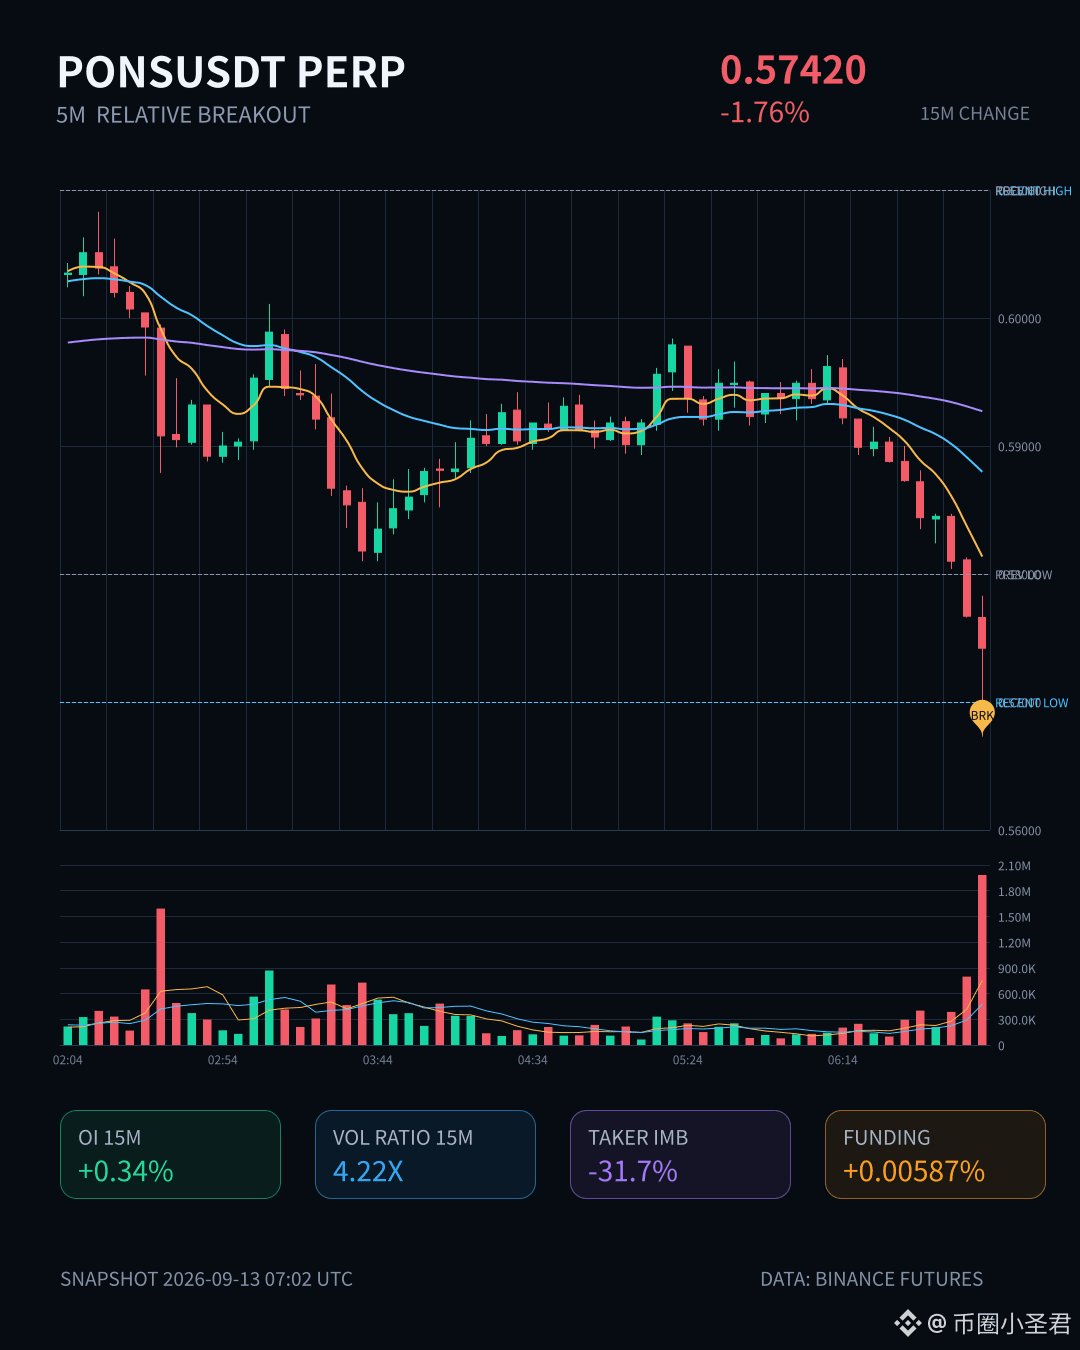
$PONS These last 15 minutes look a bit ugly. The price is down 1.76%, and the volume expansion has jumped straight to 4.22x, with a Z-score of 2.41—this isn’t a slow bleed; there’s capital at work. It’s broken below the lower edge of the past 20 5-minute bars, and the ratio of aggressive buys to sells is 0.52—sell pressure is clearly stronger.
But interestingly, the OI (open interest) shows otherwise: 15m is +0.34%, 1h is +0.20%, while the notional is shrinking. With OI rising, price falling, and notional decreasing, the structure looks more like newly added leveraged short positions coming in to press the move, rather than longs getting swept. The pool’s abnormal percentile is 79.6%, abnormal #34; notional change #19—the ranks on the board are all fairly high.
In the last 24 hours, turnover is 88.58M. With this kind of volume, a 1.76% drop isn’t too severe; the selling pressure isn’t as fierce as you might imagine. Whether the shorts are testing or building positions still depends on whether this 5m bar can reclaim the lower boundary of the range. If you chase a short after a breakdown, keep your eyes open.
$PONS These last 15 minutes look a bit ugly. The price is down 1.76%, and the volume expansion has jumped straight to 4.22x, with a Z-score of 2.41—this isn’t a slow bleed; there’s capital at work. It’s broken below the lower edge of the past 20 5-minute bars, and the ratio of aggressive buys to sells is 0.52—sell pressure is clearly stronger.
But interestingly, the OI (open interest) shows otherwise: 15m is +0.34%, 1h is +0.20%, while the notional is shrinking. With OI rising, price falling, and notional decreasing, the structure looks more like newly added leveraged short positions coming in to press the move, rather than longs getting swept. The pool’s abnormal percentile is 79.6%, abnormal #34; notional change #19—the ranks on the board are all fairly high.
In the last 24 hours, turnover is 88.58M. With this kind of volume, a 1.76% drop isn’t too severe; the selling pressure isn’t as fierce as you might imagine. Whether the shorts are testing or building positions still depends on whether this 5m bar can reclaim the lower boundary of the range. If you chase a short after a breakdown, keep your eyes open.
But interestingly, the OI (open interest) shows otherwise: 15m is +0.34%, 1h is +0.20%, while the notional is shrinking. With OI rising, price falling, and notional decreasing, the structure looks more like newly added leveraged short positions coming in to press the move, rather than longs getting swept. The pool’s abnormal percentile is 79.6%, abnormal #34; notional change #19—the ranks on the board are all fairly high.
In the last 24 hours, turnover is 88.58M. With this kind of volume, a 1.76% drop isn’t too severe; the selling pressure isn’t as fierce as you might imagine. Whether the shorts are testing or building positions still depends on whether this 5m bar can reclaim the lower boundary of the range. If you chase a short after a breakdown, keep your eyes open.
49
·
--
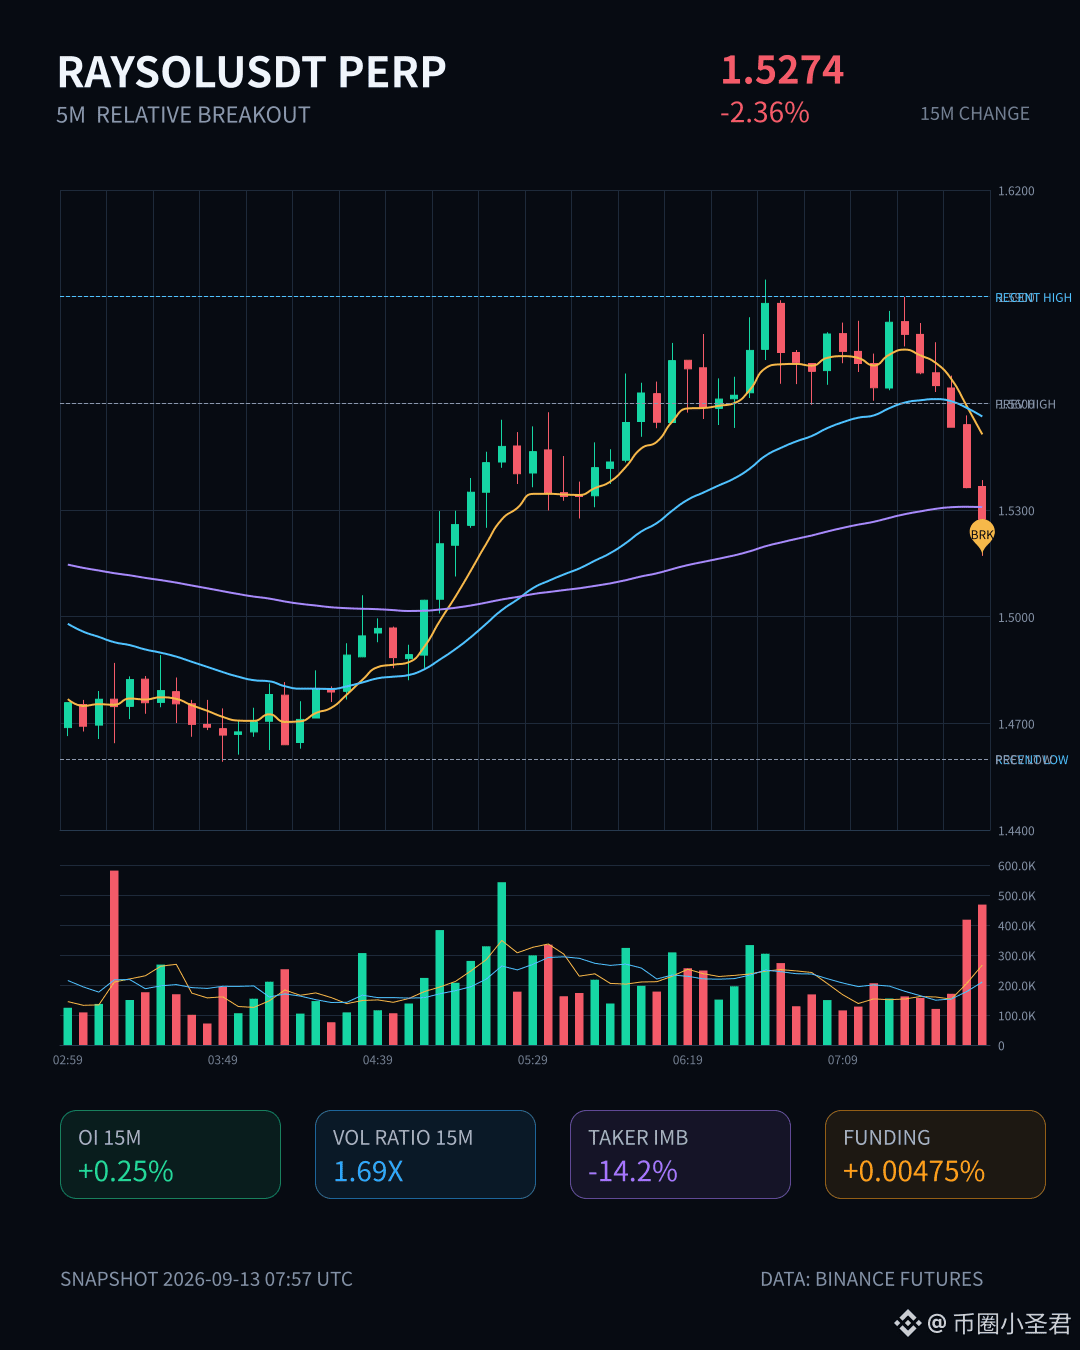
$RAYSOL This 15m move saw a drop of 2.36%. Volume increased to 1.69x—volume and momentum are finally picking up.
The key point isn’t the dip: OI is still rising. Price is falling while positions are increasing. This doesn’t look like panic liquidation of longs; it looks more like someone adding leverage to short at low levels. But if you look carefully, the notional change is negative—-228K, and within an hour it also decreased by 318K. What does that mean? Retail orders are increasing, while larger players’ positions are being reduced. This kind of structure is the most annoying: shorts look busy on the surface, but real money is withdrawing.
The active trade imbalance is -14.2%, the buy/sell ratio is 0.75, and sell pressure is in control. The price just slipped below the lower bound of the recent 20 five-minute range, and the key level for the short term has been broken.
In the whole pool, the abnormal percentile is 77.8%. The notional change ranks at #19, and the abnormality is genuine. But for a pool with only 89M in 24h turnover, to be honest, this level of OI is a bit thin.
The current contradiction: volume and price are aligned like new shorts are entering, but the notional contraction suggests this short “foundation” isn’t solid. If it can’t be hammered down here, and if selling volume dries up while the downtrend stabilizes, it could easily turn into a false breakout that lures shorts. If you’re thinking about chasing a short, think it through—don’t get tricked in by this 15m signal.
$RAYSOL This 15m move saw a drop of 2.36%. Volume increased to 1.69x—volume and momentum are finally picking up.
The key point isn’t the dip: OI is still rising. Price is falling while positions are increasing. This doesn’t look like panic liquidation of longs; it looks more like someone adding leverage to short at low levels. But if you look carefully, the notional change is negative—-228K, and within an hour it also decreased by 318K. What does that mean? Retail orders are increasing, while larger players’ positions are being reduced. This kind of structure is the most annoying: shorts look busy on the surface, but real money is withdrawing.
The active trade imbalance is -14.2%, the buy/sell ratio is 0.75, and sell pressure is in control. The price just slipped below the lower bound of the recent 20 five-minute range, and the key level for the short term has been broken.
In the whole pool, the abnormal percentile is 77.8%. The notional change ranks at #19, and the abnormality is genuine. But for a pool with only 89M in 24h turnover, to be honest, this level of OI is a bit thin.
The current contradiction: volume and price are aligned like new shorts are entering, but the notional contraction suggests this short “foundation” isn’t solid. If it can’t be hammered down here, and if selling volume dries up while the downtrend stabilizes, it could easily turn into a false breakout that lures shorts. If you’re thinking about chasing a short, think it through—don’t get tricked in by this 15m signal.
The key point isn’t the dip: OI is still rising. Price is falling while positions are increasing. This doesn’t look like panic liquidation of longs; it looks more like someone adding leverage to short at low levels. But if you look carefully, the notional change is negative—-228K, and within an hour it also decreased by 318K. What does that mean? Retail orders are increasing, while larger players’ positions are being reduced. This kind of structure is the most annoying: shorts look busy on the surface, but real money is withdrawing.
The active trade imbalance is -14.2%, the buy/sell ratio is 0.75, and sell pressure is in control. The price just slipped below the lower bound of the recent 20 five-minute range, and the key level for the short term has been broken.
In the whole pool, the abnormal percentile is 77.8%. The notional change ranks at #19, and the abnormality is genuine. But for a pool with only 89M in 24h turnover, to be honest, this level of OI is a bit thin.
The current contradiction: volume and price are aligned like new shorts are entering, but the notional contraction suggests this short “foundation” isn’t solid. If it can’t be hammered down here, and if selling volume dries up while the downtrend stabilizes, it could easily turn into a false breakout that lures shorts. If you’re thinking about chasing a short, think it through—don’t get tricked in by this 15m signal.
45
·
--
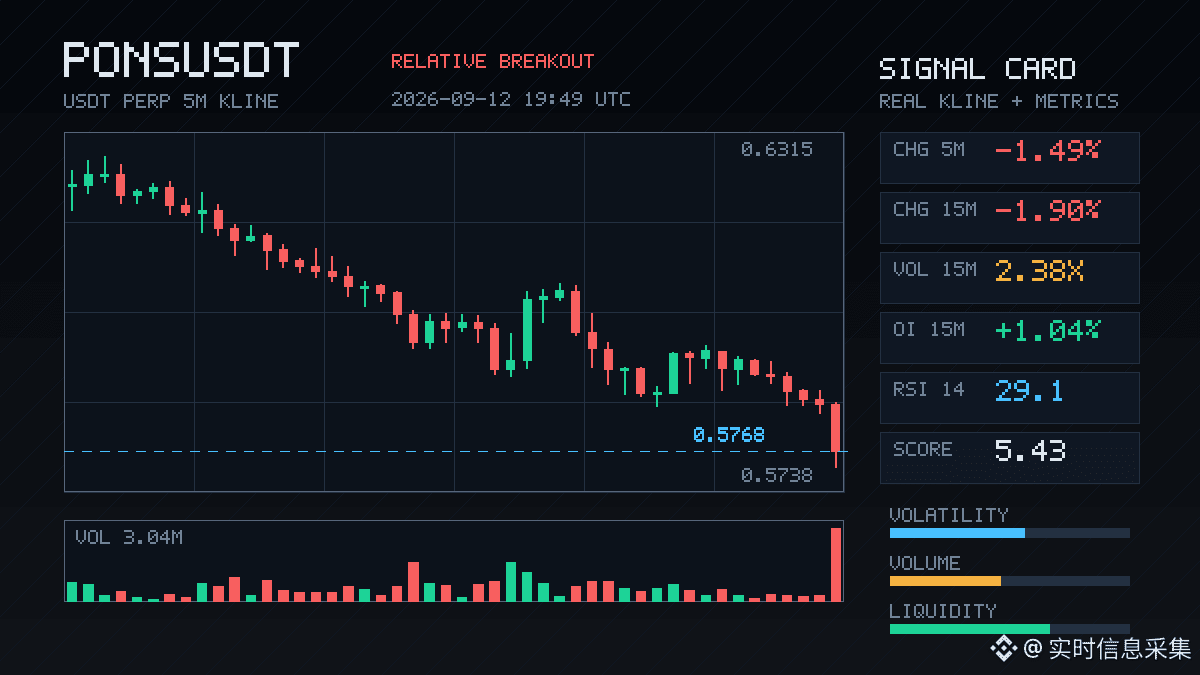
$PONS This drop has some substance.
On the 15m chart, it directly breaks through the lows of nearly 20 5m candles. Volume is 2.38x, aggressive trade imbalance is -37.9%, and buy/sell ratio is 0.45—selling pressure is absolutely real.
But here’s the interesting part: OI is rising. On 15m, +1.04%, and on 1h, +1.37%. Price is falling while positions are increasing. This isn’t long liquidation—it looks more like new shorts entering and adding leverage.
Notional change is -249K, and the magnitude isn’t huge, but the full-pool notional change ranks at #19, with an anomaly percentile of 43%, indicating sufficient activity relative to others.
24h trading volume is 99.82M, and liquidity depth is fine. With this kind of structure, be careful about two possible paths: either the shorts keep pressing down, or you get squeezed into a rebound. Don’t rush to bottom-pick—wait for confirmation.
$PONS This drop has some substance.
On the 15m chart, it directly breaks through the lows of nearly 20 5m candles. Volume is 2.38x, aggressive trade imbalance is -37.9%, and buy/sell ratio is 0.45—selling pressure is absolutely real.
But here’s the interesting part: OI is rising. On 15m, +1.04%, and on 1h, +1.37%. Price is falling while positions are increasing. This isn’t long liquidation—it looks more like new shorts entering and adding leverage.
Notional change is -249K, and the magnitude isn’t huge, but the full-pool notional change ranks at #19, with an anomaly percentile of 43%, indicating sufficient activity relative to others.
24h trading volume is 99.82M, and liquidity depth is fine. With this kind of structure, be careful about two possible paths: either the shorts keep pressing down, or you get squeezed into a rebound. Don’t rush to bottom-pick—wait for confirmation.
On the 15m chart, it directly breaks through the lows of nearly 20 5m candles. Volume is 2.38x, aggressive trade imbalance is -37.9%, and buy/sell ratio is 0.45—selling pressure is absolutely real.
But here’s the interesting part: OI is rising. On 15m, +1.04%, and on 1h, +1.37%. Price is falling while positions are increasing. This isn’t long liquidation—it looks more like new shorts entering and adding leverage.
Notional change is -249K, and the magnitude isn’t huge, but the full-pool notional change ranks at #19, with an anomaly percentile of 43%, indicating sufficient activity relative to others.
24h trading volume is 99.82M, and liquidity depth is fine. With this kind of structure, be careful about two possible paths: either the shorts keep pressing down, or you get squeezed into a rebound. Don’t rush to bottom-pick—wait for confirmation.
29
Log in to explore more content
Join global crypto users on Binance Square
⚡️ Get latest and useful information about crypto.
💬 Trusted by the world’s largest crypto exchange.
👍 Discover real insights from verified creators.
Email / Phone number
Trending Topics
1
#XRPRises8%
1,927 views
195 Discussing
2
#AppleGoogleSeekStablecoinTokenizedDepositTalent
1,491 views
150 Discussing
3
#NvidiaToBuyAnother$1.5BSBEnergySharesPreIPO
399 views
13 Discussing
4
#AgoraGetsPreliminaryOCCApprovalForTrustBank
705 views
68 Discussing
5
#NEARRisesNearly80%InAWeek
58,017 views
1,134 Discussing
6
#MultiversXPlansHardForkRecovery
47,461 views
858 Discussing
7
#CircleLaunchesInstitutionalBTCBackedBorrowing
42,537 views
869 Discussing
8
#BitcoinHits$85K
59,683 views
326 Discussing
9
#ZetaChainVotesToMigrateZETAToSolana
29,912 views
571 Discussing
10
#ECBStartsBlockchainEuroSettlement
58,421 views
864 Discussing