
#12
12
30,675 views
279 Discussing
Hot
Latest

·
--
🏆 CRYPTO vs THE WORLD
$BTC #12 of all assets · needs +$15.40B to flip Broadcom
ETH #60 of all assets · needs +$265.9M to flip UnitedHealth
🍳 Crypto vs stocks, gold, everything. Not financial advice.
#CookingBNB #Crypto
🏆 CRYPTO vs THE WORLD
$BTC #12 of all assets · needs +$15.40B to flip Broadcom
ETH #60 of all assets · needs +$265.9M to flip UnitedHealth
🍳 Crypto vs stocks, gold, everything. Not financial advice.
#CookingBNB #Crypto
$BTC #12 of all assets · needs +$15.40B to flip Broadcom
ETH #60 of all assets · needs +$265.9M to flip UnitedHealth
🍳 Crypto vs stocks, gold, everything. Not financial advice.
#CookingBNB #Crypto

92

$DOGE (Dogecoin) update: Currently trading at $0.099721, +12% in the last 24 hours, and +20% over the past 7 days. Today's trading range was $0.089702 to $0.105575. Market cap stands at $15562325393, ranking #12 globally, with a 24h market cap change of 12%. Fully diluted valuation: $17129553592. 24h trading volume: $3573963564. All-time high: $0.731578 (-86% from peak, reached 2021-05-07T21:08:23.000Z); all-time low: $0.0000869 (reached 2015-05-05T16:00:00.000Z). Circulating supply: 156017416383.70523 DOGE, total supply: 171730003126.579 DOGE. Last updated 2026-09-22T07:17:10.000Z. (CoinGecko data, informational only) #DOGE #Crypto
$DOGE (Dogecoin) update: Currently trading at $0.099721, +12% in the last 24 hours, and +20% over the past 7 days. Today's trading range was $0.089702 to $0.105575. Market cap stands at $15562325393, ranking #12 globally, with a 24h market cap change of 12%. Fully diluted valuation: $17129553592. 24h trading volume: $3573963564. All-time high: $0.731578 (-86% from peak, reached 2021-05-07T21:08:23.000Z); all-time low: $0.0000869 (reached 2015-05-05T16:00:00.000Z). Circulating supply: 156017416383.70523 DOGE, total supply: 171730003126.579 DOGE. Last updated 2026-09-22T07:17:10.000Z. (CoinGecko data, informational only) #DOGE #Crypto
1
92
·
--
🏆 FLIPPENING
💰 Bitcoin just flipped Meta Platforms (Facebook)!
$BTC $1.70T · now #12 of all assets
Passed Meta Platforms (Facebook) ($1.70T)
🍳 Crypto vs the whole world. Not financial advice.
#CookingBNB #Crypto #Bitcoin #BTC
🏆 FLIPPENING
💰 Bitcoin just flipped Meta Platforms (Facebook)!
$BTC $1.70T · now #12 of all assets
Passed Meta Platforms (Facebook) ($1.70T)
🍳 Crypto vs the whole world. Not financial advice.
#CookingBNB #Crypto #Bitcoin #BTC
💰 Bitcoin just flipped Meta Platforms (Facebook)!
$BTC $1.70T · now #12 of all assets
Passed Meta Platforms (Facebook) ($1.70T)
🍳 Crypto vs the whole world. Not financial advice.
#CookingBNB #Crypto #Bitcoin #BTC

19

·
--
$PUMP This is a bit interesting.
In the 15m timeframe, it rallied 1.13%. Volume was strong and quickly reached 1.86x, with a Z value of 2.30. The price broke above the recent upper band of the last 20 of the 5m candles—this isn’t a fake move where it pokes and immediately runs. Active buy-sell imbalance is +20.5%, and the buy-to-sell ratio is 1.52. Clearly, there’s capital being pushed in.
More importantly is OI. On 15m, it’s +0.21%; on 1h, it’s +0.18%. The nominal changes have been stacking upward all along. The abnormal percentile is already 88.7%, and it ranks #12 in the entire pool. This has continued across multiple consecutive periods—this kind of structure can’t be built by a single wick.
Price rising + OI lifting in sync suggests new leveraged long positions are entering. Funding rates have also been in the high percentile recently, indicating that bullish sentiment isn’t low.
Over the past 24h, trading value is 195.96M—liquidity is sufficient. The boundary has just been broken; first, we need to see whether it can hold above the top of this range. If it can hold, then we’ll have follow-through.
$PUMP This is a bit interesting.
In the 15m timeframe, it rallied 1.13%. Volume was strong and quickly reached 1.86x, with a Z value of 2.30. The price broke above the recent upper band of the last 20 of the 5m candles—this isn’t a fake move where it pokes and immediately runs. Active buy-sell imbalance is +20.5%, and the buy-to-sell ratio is 1.52. Clearly, there’s capital being pushed in.
More importantly is OI. On 15m, it’s +0.21%; on 1h, it’s +0.18%. The nominal changes have been stacking upward all along. The abnormal percentile is already 88.7%, and it ranks #12 in the entire pool. This has continued across multiple consecutive periods—this kind of structure can’t be built by a single wick.
Price rising + OI lifting in sync suggests new leveraged long positions are entering. Funding rates have also been in the high percentile recently, indicating that bullish sentiment isn’t low.
Over the past 24h, trading value is 195.96M—liquidity is sufficient. The boundary has just been broken; first, we need to see whether it can hold above the top of this range. If it can hold, then we’ll have follow-through.
In the 15m timeframe, it rallied 1.13%. Volume was strong and quickly reached 1.86x, with a Z value of 2.30. The price broke above the recent upper band of the last 20 of the 5m candles—this isn’t a fake move where it pokes and immediately runs. Active buy-sell imbalance is +20.5%, and the buy-to-sell ratio is 1.52. Clearly, there’s capital being pushed in.
More importantly is OI. On 15m, it’s +0.21%; on 1h, it’s +0.18%. The nominal changes have been stacking upward all along. The abnormal percentile is already 88.7%, and it ranks #12 in the entire pool. This has continued across multiple consecutive periods—this kind of structure can’t be built by a single wick.
Price rising + OI lifting in sync suggests new leveraged long positions are entering. Funding rates have also been in the high percentile recently, indicating that bullish sentiment isn’t low.
Over the past 24h, trading value is 195.96M—liquidity is sufficient. The boundary has just been broken; first, we need to see whether it can hold above the top of this range. If it can hold, then we’ll have follow-through.
1

·
--
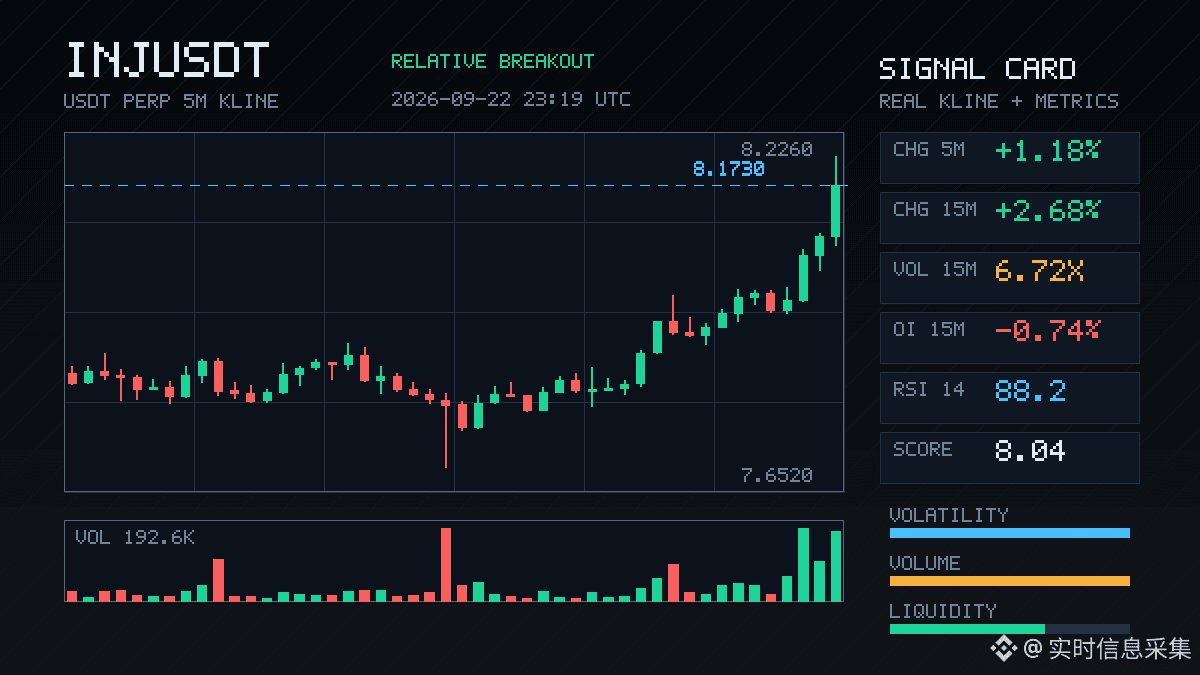
$INJ This one is a bit interesting.
In the 15m chart it directly pulled up 2.68%, with volume hitting 6.7 times the usual level; the buy/sell ratio of aggressive orders is 2.26—clearly, buy orders are pushing. But what’s weird is that OI is falling: 15m -0.74%, 1h -0.21%. Price is up while positions are decreasing—this is the classic short-covering script, not fresh long entries.
The closing price has just broken above the upper bound of the last 20 5m candles. The OI percentile is extremely high at 94.8%, and it ranks #12 across the whole pool. This kind of structure is either shorts being forced into a corner and squeezed further, or a one-wave move that’s done and then dissipates.
Whether you chase it is up to you—I just know that with a breakout showing volume-price divergence, those who run slow are more likely to end up catching the last baton.
$INJ This one is a bit interesting.
In the 15m chart it directly pulled up 2.68%, with volume hitting 6.7 times the usual level; the buy/sell ratio of aggressive orders is 2.26—clearly, buy orders are pushing. But what’s weird is that OI is falling: 15m -0.74%, 1h -0.21%. Price is up while positions are decreasing—this is the classic short-covering script, not fresh long entries.
The closing price has just broken above the upper bound of the last 20 5m candles. The OI percentile is extremely high at 94.8%, and it ranks #12 across the whole pool. This kind of structure is either shorts being forced into a corner and squeezed further, or a one-wave move that’s done and then dissipates.
Whether you chase it is up to you—I just know that with a breakout showing volume-price divergence, those who run slow are more likely to end up catching the last baton.
In the 15m chart it directly pulled up 2.68%, with volume hitting 6.7 times the usual level; the buy/sell ratio of aggressive orders is 2.26—clearly, buy orders are pushing. But what’s weird is that OI is falling: 15m -0.74%, 1h -0.21%. Price is up while positions are decreasing—this is the classic short-covering script, not fresh long entries.
The closing price has just broken above the upper bound of the last 20 5m candles. The OI percentile is extremely high at 94.8%, and it ranks #12 across the whole pool. This kind of structure is either shorts being forced into a corner and squeezed further, or a one-wave move that’s done and then dissipates.
Whether you chase it is up to you—I just know that with a breakout showing volume-price divergence, those who run slow are more likely to end up catching the last baton.
13

·
--
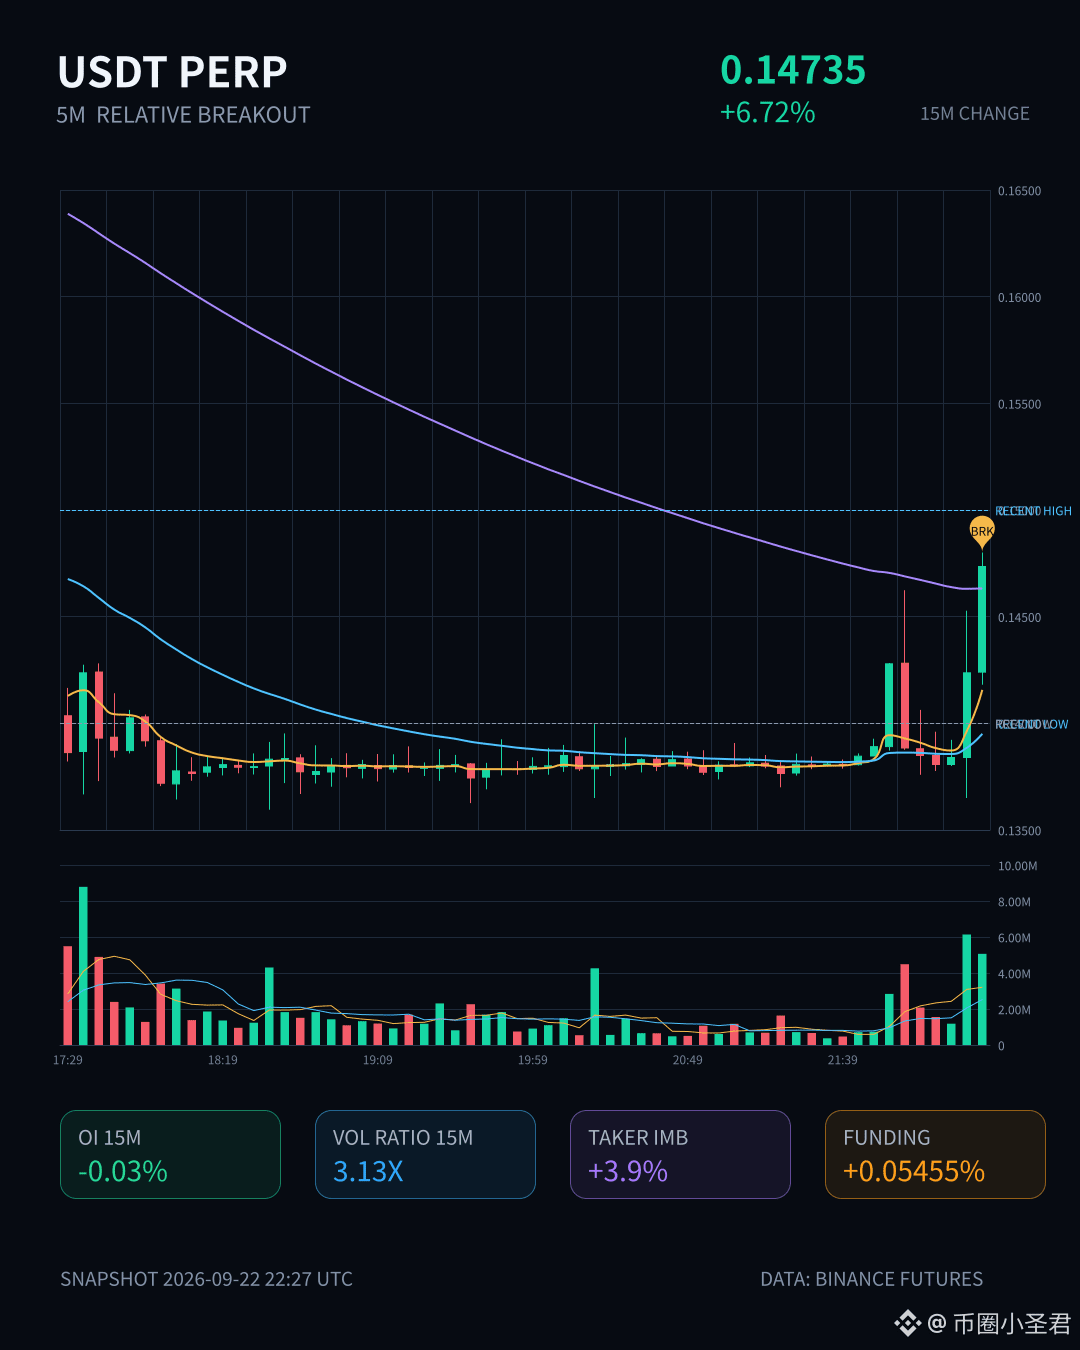
$Lobster, this 15m move has pulled up 6.72%; the volume directly reached 3.13x, with a Z-value of 8.57, breaking above the upper bound of nearly 20 consecutive 5m bars.
What’s interesting is the OI: the 15m contract is -0.03%, only +0.33% at 1h, but the notional change is already +2.40M / +2.59M USDT, with an abnormal percentile of 88.5% and an abnormal pool rank of #12. Price is pushing up, but OI isn’t following—this is a typical short-covering or positioning-rebuilding structure. It doesn’t look like fresh longs establishing positions.
The passive vs. aggressive execution gap is 3.9%, the buy/sell ratio is 1.08, and the 24h turnover is 188M. The order book depth is sufficient—this isn’t the kind of fake breakout that’s just “jacked up” on thin liquidity.
With this kind of structure, watch for two things: first, if OI keeps not picking up, the rally is likely to be pulse-like—once the cover is done, it fizzles out; second, the notional change ranking is #6, indicating capital is actively doing something at this level, not just a retail-driven move.
First, see whether it can hold steady above the upper edge of this range. If it can’t, expect a wick/poke rather than a real break.
$Lobster, this 15m move has pulled up 6.72%; the volume directly reached 3.13x, with a Z-value of 8.57, breaking above the upper bound of nearly 20 consecutive 5m bars.
What’s interesting is the OI: the 15m contract is -0.03%, only +0.33% at 1h, but the notional change is already +2.40M / +2.59M USDT, with an abnormal percentile of 88.5% and an abnormal pool rank of #12. Price is pushing up, but OI isn’t following—this is a typical short-covering or positioning-rebuilding structure. It doesn’t look like fresh longs establishing positions.
The passive vs. aggressive execution gap is 3.9%, the buy/sell ratio is 1.08, and the 24h turnover is 188M. The order book depth is sufficient—this isn’t the kind of fake breakout that’s just “jacked up” on thin liquidity.
With this kind of structure, watch for two things: first, if OI keeps not picking up, the rally is likely to be pulse-like—once the cover is done, it fizzles out; second, the notional change ranking is #6, indicating capital is actively doing something at this level, not just a retail-driven move.
First, see whether it can hold steady above the upper edge of this range. If it can’t, expect a wick/poke rather than a real break.
What’s interesting is the OI: the 15m contract is -0.03%, only +0.33% at 1h, but the notional change is already +2.40M / +2.59M USDT, with an abnormal percentile of 88.5% and an abnormal pool rank of #12. Price is pushing up, but OI isn’t following—this is a typical short-covering or positioning-rebuilding structure. It doesn’t look like fresh longs establishing positions.
The passive vs. aggressive execution gap is 3.9%, the buy/sell ratio is 1.08, and the 24h turnover is 188M. The order book depth is sufficient—this isn’t the kind of fake breakout that’s just “jacked up” on thin liquidity.
With this kind of structure, watch for two things: first, if OI keeps not picking up, the rally is likely to be pulse-like—once the cover is done, it fizzles out; second, the notional change ranking is #6, indicating capital is actively doing something at this level, not just a retail-driven move.
First, see whether it can hold steady above the upper edge of this range. If it can’t, expect a wick/poke rather than a real break.
7

·
--
$MINA There’s something going on here.
In 15m, it rose 2.57%. The volume surged straight to 2.43x; the Z value is 3.24. The close has broken above the upper bound of the past ~20 of the 5m candles. The key is OI—OI is up 2.42% over 1h, and the 15m is also adding along with it; the abnormal percentile is 95%, and the whole pool ranks at #12.
Price is up + OI is up—not like short covering from a hollow fake move. It looks more like new-leverage longs are entering. The aggressive volume is down 22.4%, buy/sell ratio is 1.58, and the buy side is clearly more aggressive.
Over 24h, the traded value is only 16.76M; the pool isn’t that deep. In this kind of spot, if there’s sustained capital pushing, the upside elasticity could be relatively large. But on the flip side, insufficient depth also means the cost of a false breakout is low—so you need to watch whether OI can keep stacking.
For now, set a watch level and see whether this 15m candle’s continuation holds after it closes.
$MINA There’s something going on here.
In 15m, it rose 2.57%. The volume surged straight to 2.43x; the Z value is 3.24. The close has broken above the upper bound of the past ~20 of the 5m candles. The key is OI—OI is up 2.42% over 1h, and the 15m is also adding along with it; the abnormal percentile is 95%, and the whole pool ranks at #12.
Price is up + OI is up—not like short covering from a hollow fake move. It looks more like new-leverage longs are entering. The aggressive volume is down 22.4%, buy/sell ratio is 1.58, and the buy side is clearly more aggressive.
Over 24h, the traded value is only 16.76M; the pool isn’t that deep. In this kind of spot, if there’s sustained capital pushing, the upside elasticity could be relatively large. But on the flip side, insufficient depth also means the cost of a false breakout is low—so you need to watch whether OI can keep stacking.
For now, set a watch level and see whether this 15m candle’s continuation holds after it closes.
In 15m, it rose 2.57%. The volume surged straight to 2.43x; the Z value is 3.24. The close has broken above the upper bound of the past ~20 of the 5m candles. The key is OI—OI is up 2.42% over 1h, and the 15m is also adding along with it; the abnormal percentile is 95%, and the whole pool ranks at #12.
Price is up + OI is up—not like short covering from a hollow fake move. It looks more like new-leverage longs are entering. The aggressive volume is down 22.4%, buy/sell ratio is 1.58, and the buy side is clearly more aggressive.
Over 24h, the traded value is only 16.76M; the pool isn’t that deep. In this kind of spot, if there’s sustained capital pushing, the upside elasticity could be relatively large. But on the flip side, insufficient depth also means the cost of a false breakout is low—so you need to watch whether OI can keep stacking.
For now, set a watch level and see whether this 15m candle’s continuation holds after it closes.
7
·
--
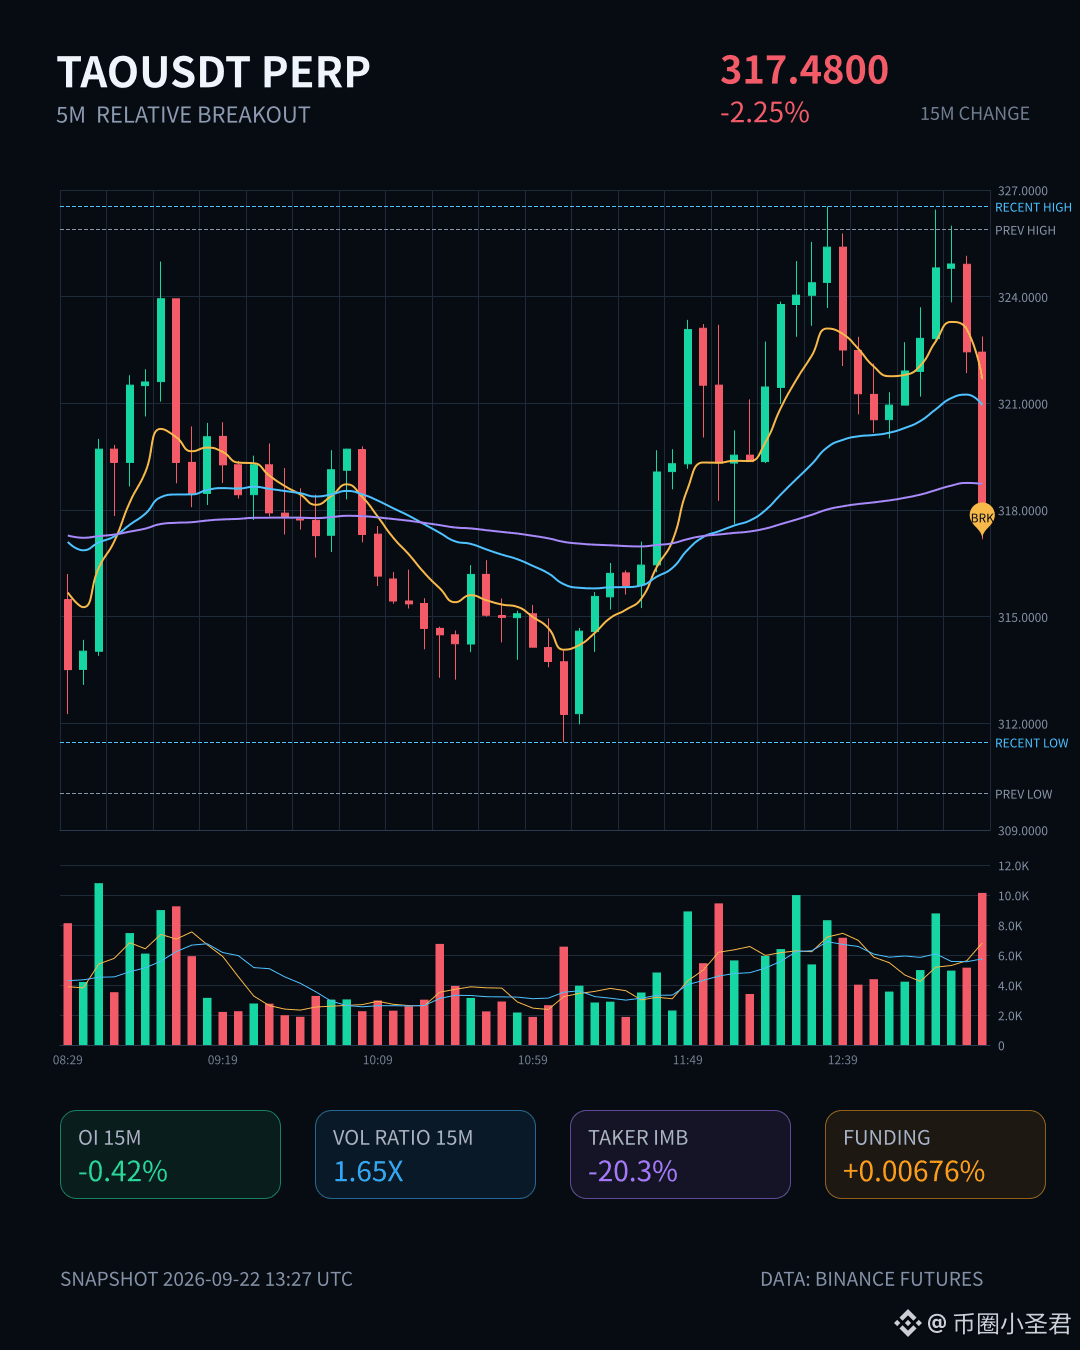
$TAO This 15m move was quite decisive—down 2.25%. Volume rose to 1.65x, and the Z value went straight to 2.58.
Looking at the OI structure: the 15m contract is -0.42%; the notional moved 2.65M, while the 1h only slightly increased by +0.24%, but its notional is also -1.81M. Price fell and OI dropped—that doesn’t look like fresh shorts entering. It feels more like longs de-leveraging, with stop-loss orders getting swept.
The closing price has already broken below the lower bound of the recent 20× 5m range. Active traded volume is -20.3% versus passive. The buy/sell ratio is 0.66, with sell pressure clearly more aggressive.
OI percentile is at 96.4%—the whole pool is #12; notional change is #9. In addition, the 24h trading value is still 501M. Price is near its own historical extreme range. For this kind of deleveraging-style drop, first see whether it can recover before getting in—don’t rush to catch it.
$TAO This 15m move was quite decisive—down 2.25%. Volume rose to 1.65x, and the Z value went straight to 2.58.
Looking at the OI structure: the 15m contract is -0.42%; the notional moved 2.65M, while the 1h only slightly increased by +0.24%, but its notional is also -1.81M. Price fell and OI dropped—that doesn’t look like fresh shorts entering. It feels more like longs de-leveraging, with stop-loss orders getting swept.
The closing price has already broken below the lower bound of the recent 20× 5m range. Active traded volume is -20.3% versus passive. The buy/sell ratio is 0.66, with sell pressure clearly more aggressive.
OI percentile is at 96.4%—the whole pool is #12; notional change is #9. In addition, the 24h trading value is still 501M. Price is near its own historical extreme range. For this kind of deleveraging-style drop, first see whether it can recover before getting in—don’t rush to catch it.
Looking at the OI structure: the 15m contract is -0.42%; the notional moved 2.65M, while the 1h only slightly increased by +0.24%, but its notional is also -1.81M. Price fell and OI dropped—that doesn’t look like fresh shorts entering. It feels more like longs de-leveraging, with stop-loss orders getting swept.
The closing price has already broken below the lower bound of the recent 20× 5m range. Active traded volume is -20.3% versus passive. The buy/sell ratio is 0.66, with sell pressure clearly more aggressive.
OI percentile is at 96.4%—the whole pool is #12; notional change is #9. In addition, the 24h trading value is still 501M. Price is near its own historical extreme range. For this kind of deleveraging-style drop, first see whether it can recover before getting in—don’t rush to catch it.
22
·
--
$KAITO There’s something interesting about this spot.
On the 15m timeframe, a surge pulled it past the upper band of about 20 of the preceding 5m candles, with volume at 1.57x. The OI percentile has already climbed to 96.8%, and the entire pool’s abnormal activity has been pushed out to #12—this isn’t the kind of move casual retail traders make with a couple of taps; it looks more like leveraged capital is being added while the price is being pushed.
But there’s one detail I’m not comfortable with: the taker trade imbalance is -8.9%, and the buy/sell ratio is 0.84. While the price is rising, the active buy side isn’t keeping up. That suggests there’s a sizable portion of resting orders absorbing the move. It can push higher, but it may not be reliably sustainable.
OI over 1h only increased by 0.01%. The nominal +1.42% on 15m is essentially wiped out when viewed over an hour—meaning this newly added leverage likely just came in recently, and its follow-through hasn’t been validated.
My view: the breakout is real, and the volume is real too. But with the funding-rate high percentile plus relatively weak active buying, the risk-reward for chasing highs isn’t great. Either wait for a pullback to confirm, or wait until active buying fills in. Charging in now feels more like lifting the sedan for the early players.
It’s not that I don’t like it—I just don’t feel in a rush at this price.
$KAITO There’s something interesting about this spot.
On the 15m timeframe, a surge pulled it past the upper band of about 20 of the preceding 5m candles, with volume at 1.57x. The OI percentile has already climbed to 96.8%, and the entire pool’s abnormal activity has been pushed out to #12—this isn’t the kind of move casual retail traders make with a couple of taps; it looks more like leveraged capital is being added while the price is being pushed.
But there’s one detail I’m not comfortable with: the taker trade imbalance is -8.9%, and the buy/sell ratio is 0.84. While the price is rising, the active buy side isn’t keeping up. That suggests there’s a sizable portion of resting orders absorbing the move. It can push higher, but it may not be reliably sustainable.
OI over 1h only increased by 0.01%. The nominal +1.42% on 15m is essentially wiped out when viewed over an hour—meaning this newly added leverage likely just came in recently, and its follow-through hasn’t been validated.
My view: the breakout is real, and the volume is real too. But with the funding-rate high percentile plus relatively weak active buying, the risk-reward for chasing highs isn’t great. Either wait for a pullback to confirm, or wait until active buying fills in. Charging in now feels more like lifting the sedan for the early players.
It’s not that I don’t like it—I just don’t feel in a rush at this price.
On the 15m timeframe, a surge pulled it past the upper band of about 20 of the preceding 5m candles, with volume at 1.57x. The OI percentile has already climbed to 96.8%, and the entire pool’s abnormal activity has been pushed out to #12—this isn’t the kind of move casual retail traders make with a couple of taps; it looks more like leveraged capital is being added while the price is being pushed.
But there’s one detail I’m not comfortable with: the taker trade imbalance is -8.9%, and the buy/sell ratio is 0.84. While the price is rising, the active buy side isn’t keeping up. That suggests there’s a sizable portion of resting orders absorbing the move. It can push higher, but it may not be reliably sustainable.
OI over 1h only increased by 0.01%. The nominal +1.42% on 15m is essentially wiped out when viewed over an hour—meaning this newly added leverage likely just came in recently, and its follow-through hasn’t been validated.
My view: the breakout is real, and the volume is real too. But with the funding-rate high percentile plus relatively weak active buying, the risk-reward for chasing highs isn’t great. Either wait for a pullback to confirm, or wait until active buying fills in. Charging in now feels more like lifting the sedan for the early players.
It’s not that I don’t like it—I just don’t feel in a rush at this price.
132
·
--
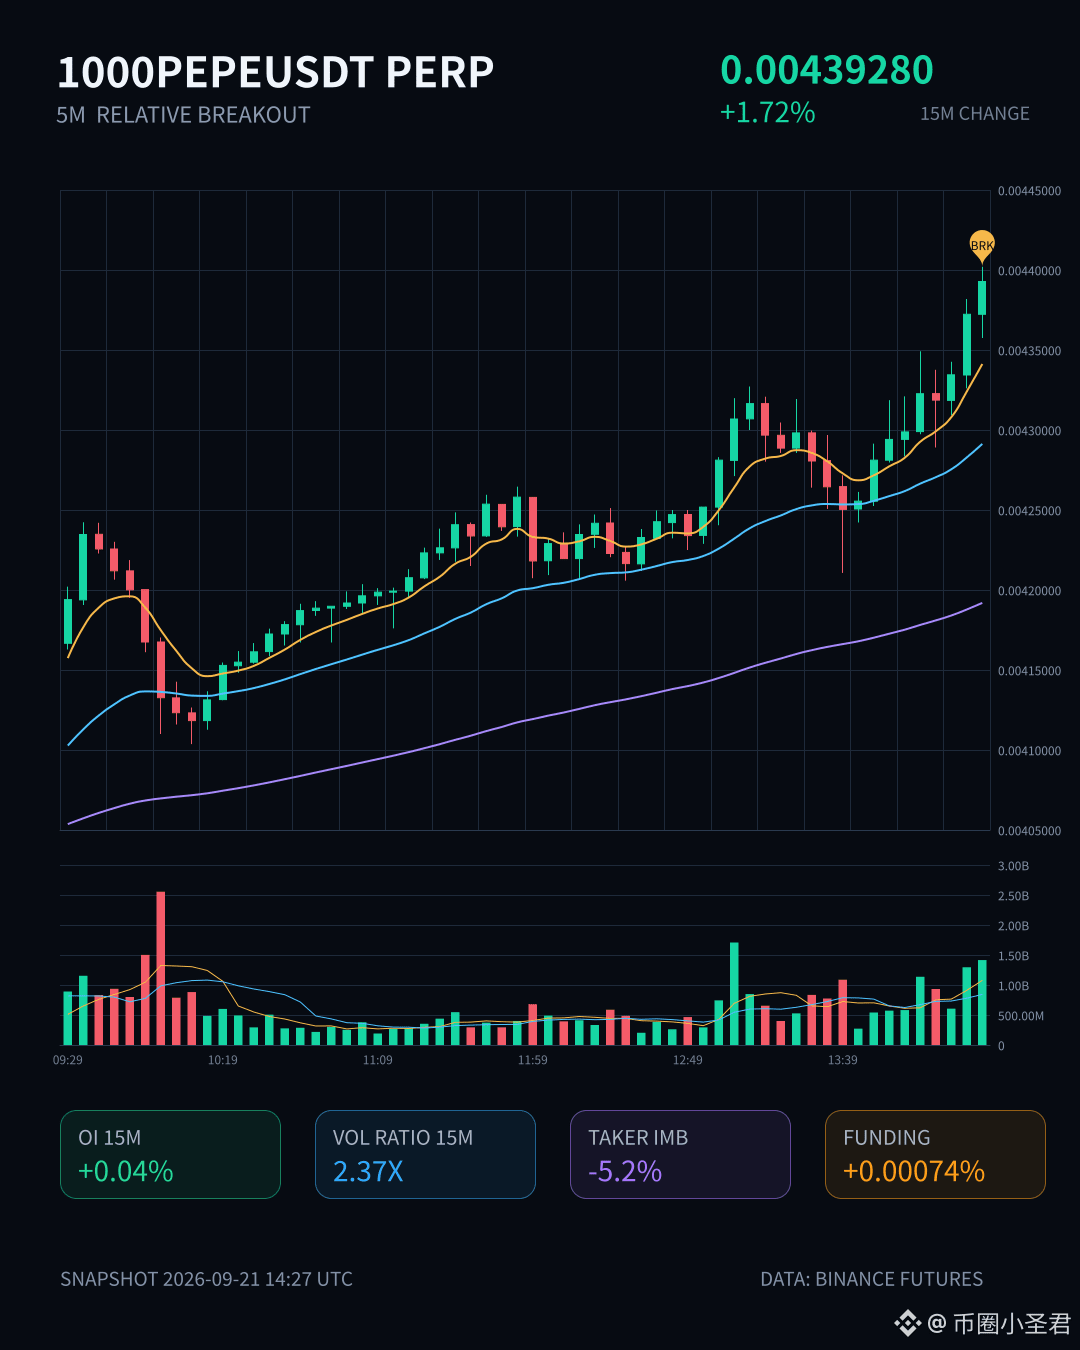
$1000PEPE This 15m has something going on.
The volume jumped straight to 2.37x, with a Z-score of 2.30. The price is pressing upward along the upper edge of the last 20 5m candles. OI is even more interesting—on the 15m contract, +0.04%; notional value incoming is 1.64M USDT. The abnormal percentile hit 95%, and the entire pool ranked up to #12. The 1h OI is still negative, which suggests this move isn’t old positions being covered—it’s fresh leverage just entering.
The order book looks a bit twisted. Taker volume is down 5.2%, buy/sell ratio is 0.90, price is rising, yet proactive sells are still being held down. Either someone is pulling the price up while exiting, or shorts are probing by adding at this level and getting eaten.
24h trading value is 397M—this depth can support the current volatility. Multiple consecutive cycles are continuing + touching the boundary of the recent range. This structure either keeps accelerating, or it’s a fake breakout with a needle. The fact that OI anomalies are consecutively continuing is worth watching: if the 1h OI turns positive next, it means the longs are still adding; if the 15m OI starts to drop, then short-term profit-taking is withdrawing.
PEPE is a meme—when the structure is right, it’s a one-wave move. If the structure is wrong, it’s just a few candles’ worth of trouble.
$1000PEPE This 15m has something going on.
The volume jumped straight to 2.37x, with a Z-score of 2.30. The price is pressing upward along the upper edge of the last 20 5m candles. OI is even more interesting—on the 15m contract, +0.04%; notional value incoming is 1.64M USDT. The abnormal percentile hit 95%, and the entire pool ranked up to #12. The 1h OI is still negative, which suggests this move isn’t old positions being covered—it’s fresh leverage just entering.
The order book looks a bit twisted. Taker volume is down 5.2%, buy/sell ratio is 0.90, price is rising, yet proactive sells are still being held down. Either someone is pulling the price up while exiting, or shorts are probing by adding at this level and getting eaten.
24h trading value is 397M—this depth can support the current volatility. Multiple consecutive cycles are continuing + touching the boundary of the recent range. This structure either keeps accelerating, or it’s a fake breakout with a needle. The fact that OI anomalies are consecutively continuing is worth watching: if the 1h OI turns positive next, it means the longs are still adding; if the 15m OI starts to drop, then short-term profit-taking is withdrawing.
PEPE is a meme—when the structure is right, it’s a one-wave move. If the structure is wrong, it’s just a few candles’ worth of trouble.
The volume jumped straight to 2.37x, with a Z-score of 2.30. The price is pressing upward along the upper edge of the last 20 5m candles. OI is even more interesting—on the 15m contract, +0.04%; notional value incoming is 1.64M USDT. The abnormal percentile hit 95%, and the entire pool ranked up to #12. The 1h OI is still negative, which suggests this move isn’t old positions being covered—it’s fresh leverage just entering.
The order book looks a bit twisted. Taker volume is down 5.2%, buy/sell ratio is 0.90, price is rising, yet proactive sells are still being held down. Either someone is pulling the price up while exiting, or shorts are probing by adding at this level and getting eaten.
24h trading value is 397M—this depth can support the current volatility. Multiple consecutive cycles are continuing + touching the boundary of the recent range. This structure either keeps accelerating, or it’s a fake breakout with a needle. The fact that OI anomalies are consecutively continuing is worth watching: if the 1h OI turns positive next, it means the longs are still adding; if the 15m OI starts to drop, then short-term profit-taking is withdrawing.
PEPE is a meme—when the structure is right, it’s a one-wave move. If the structure is wrong, it’s just a few candles’ worth of trouble.
16
·
--
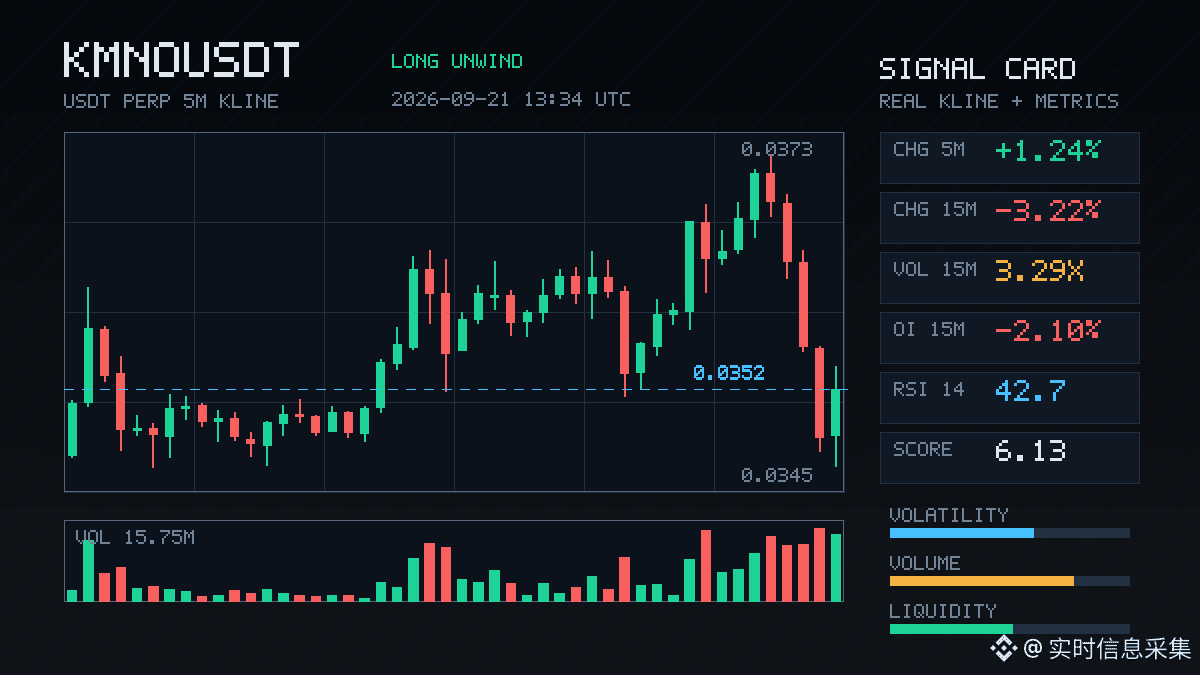
$KMNO This drop is a bit brutal—on the 15m chart it smashed down by more than 3 points. Trading volume was pulled to more than 3 times the norm. This isn’t a slow bleed; someone is genuinely running.
OI on the 15m fell by a bit over 2%, but on the 1h it’s still slightly increasing. Put simply, this structure means longs are unwinding leverage, and a round of stop-loss orders has been swept.
Even more worth noting: the abnormal percentile of OI has reached 97.2%, ranking the whole pool at #12. At this level, long crowding is extremely stretched. With even a small bit of “wind and grass,” it’s easy for a chain-reaction stampede to happen.
Near the historical extreme range, don’t rush to bottom-fish. Wait until OI has cleared out cleanly first.
$KMNO This drop is a bit brutal—on the 15m chart it smashed down by more than 3 points. Trading volume was pulled to more than 3 times the norm. This isn’t a slow bleed; someone is genuinely running.
OI on the 15m fell by a bit over 2%, but on the 1h it’s still slightly increasing. Put simply, this structure means longs are unwinding leverage, and a round of stop-loss orders has been swept.
Even more worth noting: the abnormal percentile of OI has reached 97.2%, ranking the whole pool at #12. At this level, long crowding is extremely stretched. With even a small bit of “wind and grass,” it’s easy for a chain-reaction stampede to happen.
Near the historical extreme range, don’t rush to bottom-fish. Wait until OI has cleared out cleanly first.
OI on the 15m fell by a bit over 2%, but on the 1h it’s still slightly increasing. Put simply, this structure means longs are unwinding leverage, and a round of stop-loss orders has been swept.
Even more worth noting: the abnormal percentile of OI has reached 97.2%, ranking the whole pool at #12. At this level, long crowding is extremely stretched. With even a small bit of “wind and grass,” it’s easy for a chain-reaction stampede to happen.
Near the historical extreme range, don’t rush to bottom-fish. Wait until OI has cleared out cleanly first.
·
--
$OPG This wave of longs de-leveraging a bit too fast.
On the 15m timeframe, the price is down 1.41%, and OI also fell by 1.79%. Notional ran about 231K U out—this isn’t new shorts entering; it’s leveraged longs pulling back. The funding rate is still in the high percentile in the recent period, which suggests many people were crowded into going long earlier, and now they’re starting to clear them out.
The OI percentile is异常 at 94.8%, the whole pool #12—this position is inherently sensitive. Aggressive trade imbalance is -0.8%, buy/sell ratio is 0.98. Sell pressure isn’t particularly fierce, but the longs themselves started shrinking first. Over the past 24h, total traded value is a bit over 26M. Liquidity depth isn’t great—if a slightly concentrated portion of positions closes, it’s easy to push the price down by a further step.
Watch whether this level can hold. If OI keeps dropping, that would actually be cleaner.
$OPG This wave of longs de-leveraging a bit too fast.
On the 15m timeframe, the price is down 1.41%, and OI also fell by 1.79%. Notional ran about 231K U out—this isn’t new shorts entering; it’s leveraged longs pulling back. The funding rate is still in the high percentile in the recent period, which suggests many people were crowded into going long earlier, and now they’re starting to clear them out.
The OI percentile is异常 at 94.8%, the whole pool #12—this position is inherently sensitive. Aggressive trade imbalance is -0.8%, buy/sell ratio is 0.98. Sell pressure isn’t particularly fierce, but the longs themselves started shrinking first. Over the past 24h, total traded value is a bit over 26M. Liquidity depth isn’t great—if a slightly concentrated portion of positions closes, it’s easy to push the price down by a further step.
Watch whether this level can hold. If OI keeps dropping, that would actually be cleaner.
On the 15m timeframe, the price is down 1.41%, and OI also fell by 1.79%. Notional ran about 231K U out—this isn’t new shorts entering; it’s leveraged longs pulling back. The funding rate is still in the high percentile in the recent period, which suggests many people were crowded into going long earlier, and now they’re starting to clear them out.
The OI percentile is异常 at 94.8%, the whole pool #12—this position is inherently sensitive. Aggressive trade imbalance is -0.8%, buy/sell ratio is 0.98. Sell pressure isn’t particularly fierce, but the longs themselves started shrinking first. Over the past 24h, total traded value is a bit over 26M. Liquidity depth isn’t great—if a slightly concentrated portion of positions closes, it’s easy to push the price down by a further step.
Watch whether this level can hold. If OI keeps dropping, that would actually be cleaner.
1
·
--
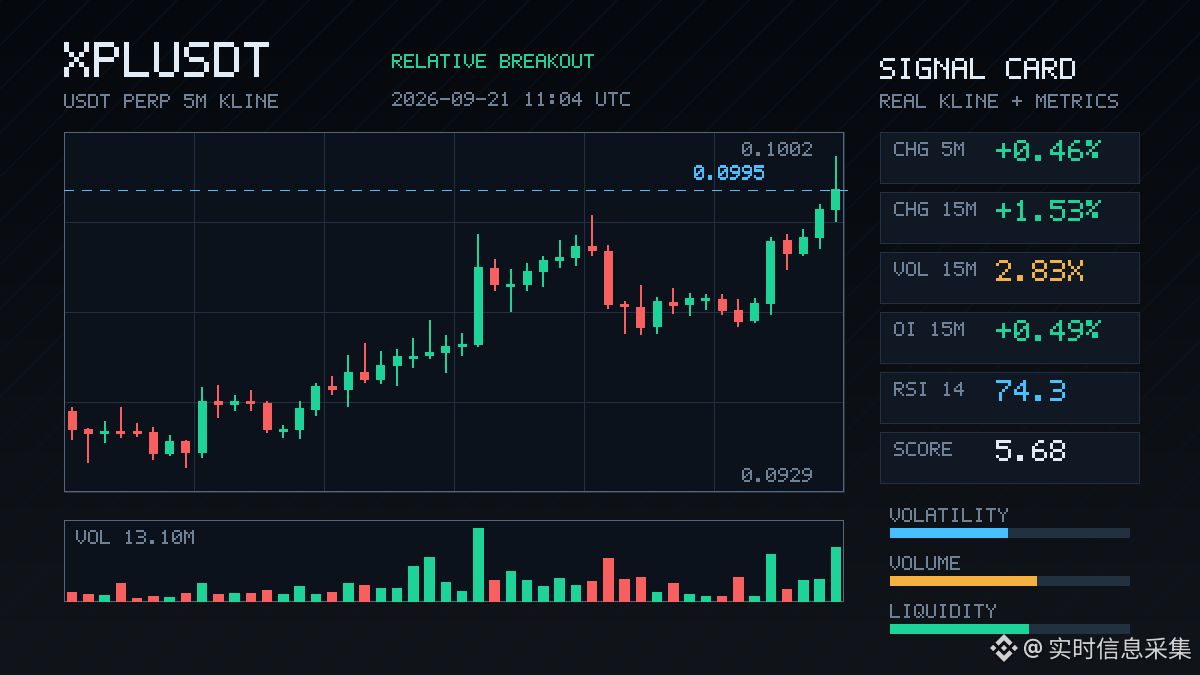
$XPL This move has a little something to it.
On the 15m timeframe, it pulled +1.53%, and volume directly surged to 2.83x. The buy/sell ratio is 1.52 in favor of active buying, and the buy side is noticeably stronger. The key point is that OI is rising in sync—15m +0.49%, 1h +1.00%. The nominal change totals nearly 3 million U, the percentile anomaly is 95.6%, and the whole pool ranks #12.
This structure doesn’t really look like a short-covering rebound; it looks more like new leveraged longs moving in. The price just closed below and broke through the upper edge of the recent ~20 5m-range; funding rate also climbed to a high percentile recently.
Across several consecutive cycles, the momentum has continued: 24h turnover is 54M. It’s approaching the historical extreme zone. In a position like this, it either accelerates or gets a wick/needle. I tend to first see whether it can hold steadily before making a move.
$XPL This move has a little something to it.
On the 15m timeframe, it pulled +1.53%, and volume directly surged to 2.83x. The buy/sell ratio is 1.52 in favor of active buying, and the buy side is noticeably stronger. The key point is that OI is rising in sync—15m +0.49%, 1h +1.00%. The nominal change totals nearly 3 million U, the percentile anomaly is 95.6%, and the whole pool ranks #12.
This structure doesn’t really look like a short-covering rebound; it looks more like new leveraged longs moving in. The price just closed below and broke through the upper edge of the recent ~20 5m-range; funding rate also climbed to a high percentile recently.
Across several consecutive cycles, the momentum has continued: 24h turnover is 54M. It’s approaching the historical extreme zone. In a position like this, it either accelerates or gets a wick/needle. I tend to first see whether it can hold steadily before making a move.
On the 15m timeframe, it pulled +1.53%, and volume directly surged to 2.83x. The buy/sell ratio is 1.52 in favor of active buying, and the buy side is noticeably stronger. The key point is that OI is rising in sync—15m +0.49%, 1h +1.00%. The nominal change totals nearly 3 million U, the percentile anomaly is 95.6%, and the whole pool ranks #12.
This structure doesn’t really look like a short-covering rebound; it looks more like new leveraged longs moving in. The price just closed below and broke through the upper edge of the recent ~20 5m-range; funding rate also climbed to a high percentile recently.
Across several consecutive cycles, the momentum has continued: 24h turnover is 54M. It’s approaching the historical extreme zone. In a position like this, it either accelerates or gets a wick/needle. I tend to first see whether it can hold steadily before making a move.
12
·
--
$PIEVERSE This pull is a bit too hasty.
On the 15m chart, it directly pushed through and gained 3.48%, with volume up to 2.1x. There’s a good match between volume and price, and the close held above the upper edge of nearly 20 5m candles—short-term structure-wise, it effectively pushed through the previous high’s “breath.” The longs actively drove the move upward; it wasn’t just being passively filled.
But there’s one detail I’m not too comfortable with: OI on the 15m is -0.03%, and only +0.35% on the 1h. Even if you add the nominal changes together, it’s not that large.
Price is rising, but OI doesn’t keep up (or even dips slightly). This looks more like shorts are being forced to cover rather than new longs entering to take over.
The rally driven by short covering tends to be fast and brittle. Once the covering ends, the question is: who’s going to take the next baton?
The OI abnormal percentile has already reached 95.6%, the whole pool is #12, and over several consecutive cycles it’s kept extending. I’ve seen extreme ranges like this play out in two ways: either it signals a transition—volume keeps expanding and it runs the trend; or sentiment hits the top, and after spiking higher, it then plunges dramatically.
At this level, I won’t chase. I’ll wait for a pullback to confirm, or wait for a signal that OI truly catches up and that fresh capital is coming in.
If you want to eat the rebound after short covering, go ahead and take the “fish body,” but don’t get greedy for the “fish tail.”
$PIEVERSE This pull is a bit too hasty.
On the 15m chart, it directly pushed through and gained 3.48%, with volume up to 2.1x. There’s a good match between volume and price, and the close held above the upper edge of nearly 20 5m candles—short-term structure-wise, it effectively pushed through the previous high’s “breath.” The longs actively drove the move upward; it wasn’t just being passively filled.
But there’s one detail I’m not too comfortable with: OI on the 15m is -0.03%, and only +0.35% on the 1h. Even if you add the nominal changes together, it’s not that large.
Price is rising, but OI doesn’t keep up (or even dips slightly). This looks more like shorts are being forced to cover rather than new longs entering to take over.
The rally driven by short covering tends to be fast and brittle. Once the covering ends, the question is: who’s going to take the next baton?
The OI abnormal percentile has already reached 95.6%, the whole pool is #12, and over several consecutive cycles it’s kept extending. I’ve seen extreme ranges like this play out in two ways: either it signals a transition—volume keeps expanding and it runs the trend; or sentiment hits the top, and after spiking higher, it then plunges dramatically.
At this level, I won’t chase. I’ll wait for a pullback to confirm, or wait for a signal that OI truly catches up and that fresh capital is coming in.
If you want to eat the rebound after short covering, go ahead and take the “fish body,” but don’t get greedy for the “fish tail.”
On the 15m chart, it directly pushed through and gained 3.48%, with volume up to 2.1x. There’s a good match between volume and price, and the close held above the upper edge of nearly 20 5m candles—short-term structure-wise, it effectively pushed through the previous high’s “breath.” The longs actively drove the move upward; it wasn’t just being passively filled.
But there’s one detail I’m not too comfortable with: OI on the 15m is -0.03%, and only +0.35% on the 1h. Even if you add the nominal changes together, it’s not that large.
Price is rising, but OI doesn’t keep up (or even dips slightly). This looks more like shorts are being forced to cover rather than new longs entering to take over.
The rally driven by short covering tends to be fast and brittle. Once the covering ends, the question is: who’s going to take the next baton?
The OI abnormal percentile has already reached 95.6%, the whole pool is #12, and over several consecutive cycles it’s kept extending. I’ve seen extreme ranges like this play out in two ways: either it signals a transition—volume keeps expanding and it runs the trend; or sentiment hits the top, and after spiking higher, it then plunges dramatically.
At this level, I won’t chase. I’ll wait for a pullback to confirm, or wait for a signal that OI truly catches up and that fresh capital is coming in.
If you want to eat the rebound after short covering, go ahead and take the “fish body,” but don’t get greedy for the “fish tail.”
4


·
--
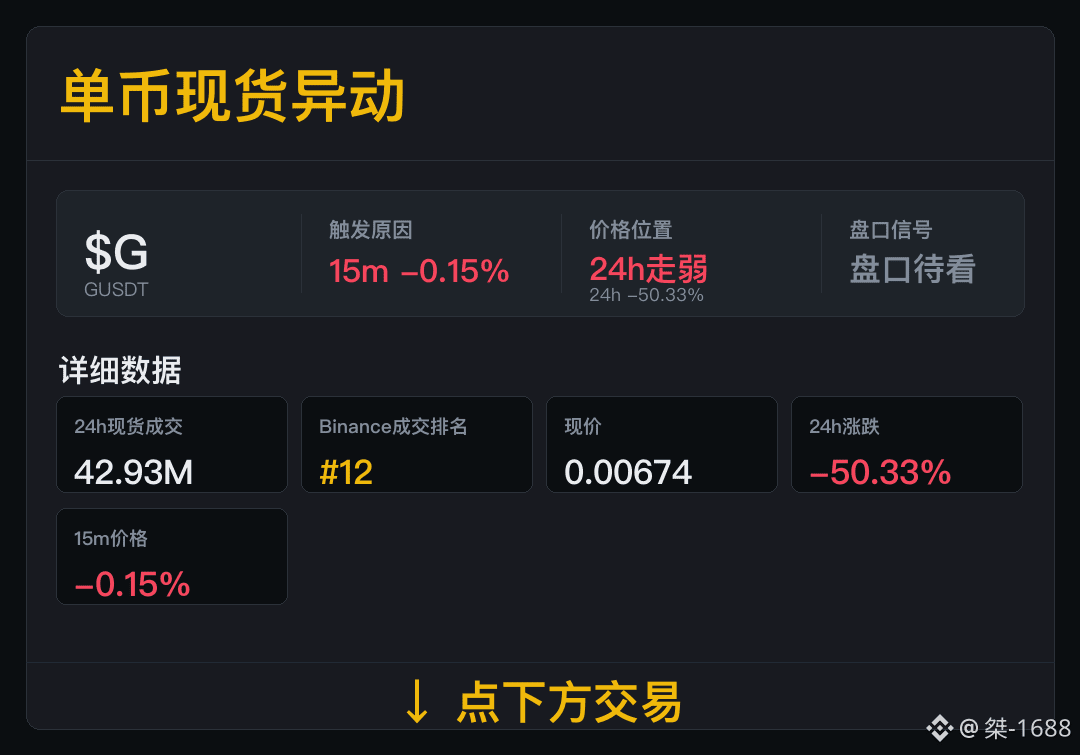
$G 15m the price starts to change—first verify spot trades.
Spot trades 42.93M, Binance spot trading rank #12. Spot trading is the current main clue; we’ll continue tracking engagement afterward.
Now 24h change -50.33%. Record this anomaly first; whether to continue tracking will be decided in the next trading cycle.
When the price retraces, there is still trading participation—only then will the short-term signals be more complete.
$G 15m the price starts to change—first verify spot trades.
Spot trades 42.93M, Binance spot trading rank #12. Spot trading is the current main clue; we’ll continue tracking engagement afterward.
Now 24h change -50.33%. Record this anomaly first; whether to continue tracking will be decided in the next trading cycle.
When the price retraces, there is still trading participation—only then will the short-term signals be more complete.
Spot trades 42.93M, Binance spot trading rank #12. Spot trading is the current main clue; we’ll continue tracking engagement afterward.
Now 24h change -50.33%. Record this anomaly first; whether to continue tracking will be decided in the next trading cycle.
When the price retraces, there is still trading participation—only then will the short-term signals be more complete.
170
·
--
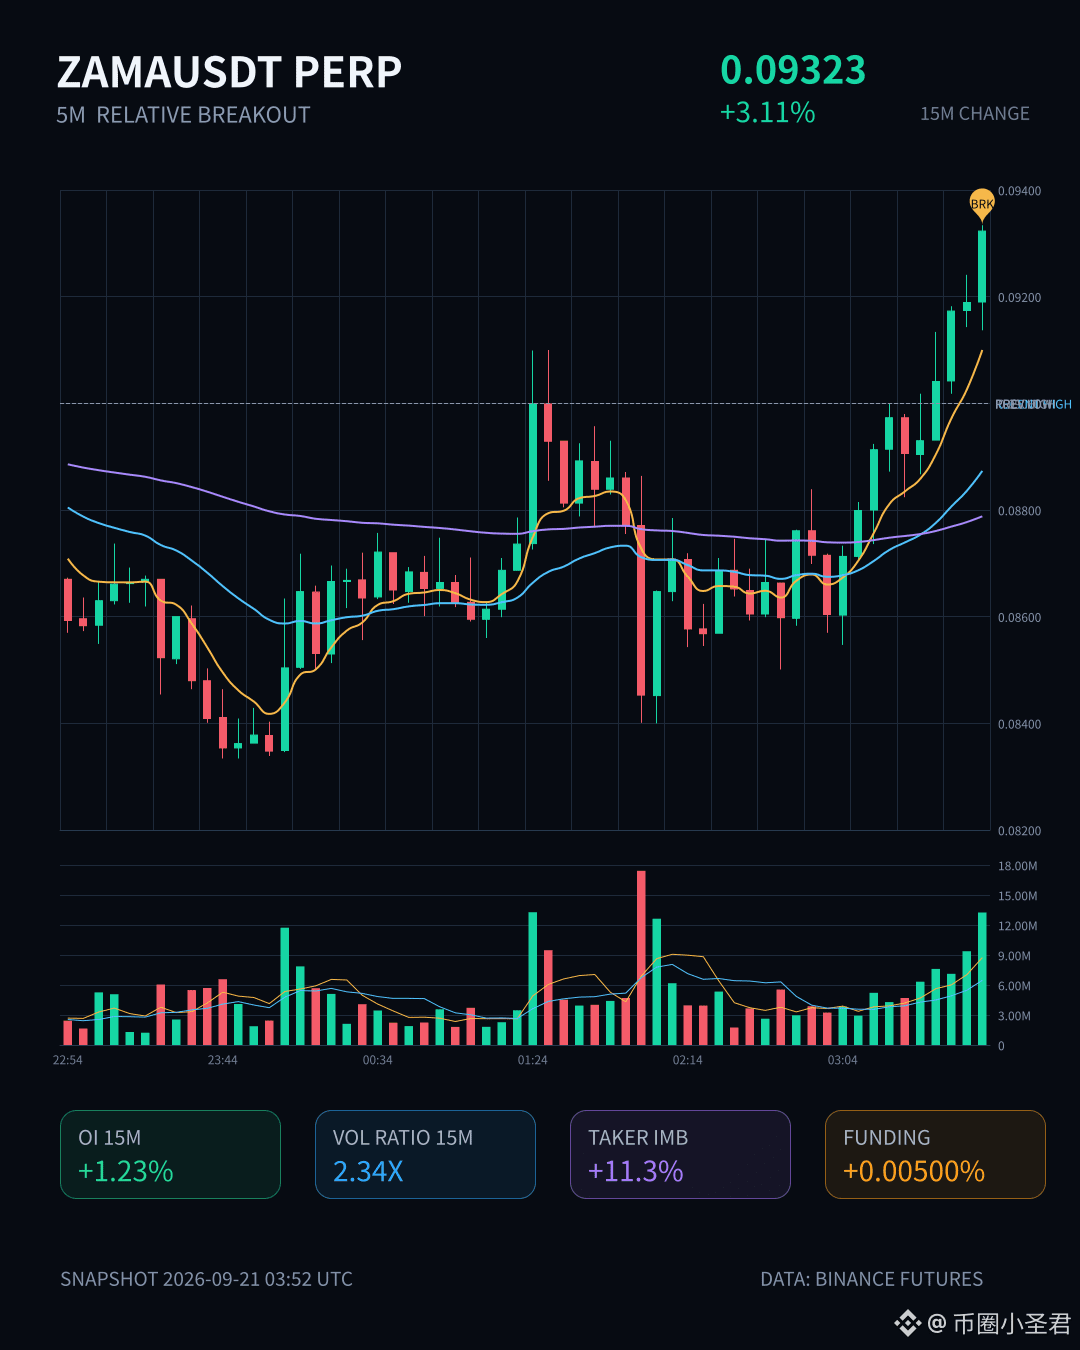
$ZAMA This market has some interesting points.
In the 15m timeframe, it surged 3.11%. Volume immediately went up to 2.34x. The closing price broke above the upper boundary of roughly the last 20 consecutive 5m candles. But what really made me take a closer look is the OI (open interest): on 15m, +1.23%; on 1h, +1.58%. Nominal change over 1h added 1.47 million U. The abnormal percentile is 90.7%, ranking #12 across the whole pool.
Price is rising together with OI—this doesn’t look like a weak short-covering squeeze. It’s more like new leveraged long positions are entering.
Passive trades are lower by 11.3%, with buy/sell ratio at 1.25. The buy side is genuinely consuming liquidity, not just bouncing it.
Over 24h, turnover is 183M and the order book depth is also solid. This isn’t the kind of pool that just slips when it gets pushed. Over multiple consecutive cycles, OI keeps extending. Structurally, this setup usually doesn’t just end after one wave.
First, I’ll mark this down and see whether it can hold and stabilize above the upper edge of this range.
$ZAMA This market has some interesting points.
In the 15m timeframe, it surged 3.11%. Volume immediately went up to 2.34x. The closing price broke above the upper boundary of roughly the last 20 consecutive 5m candles. But what really made me take a closer look is the OI (open interest): on 15m, +1.23%; on 1h, +1.58%. Nominal change over 1h added 1.47 million U. The abnormal percentile is 90.7%, ranking #12 across the whole pool.
Price is rising together with OI—this doesn’t look like a weak short-covering squeeze. It’s more like new leveraged long positions are entering.
Passive trades are lower by 11.3%, with buy/sell ratio at 1.25. The buy side is genuinely consuming liquidity, not just bouncing it.
Over 24h, turnover is 183M and the order book depth is also solid. This isn’t the kind of pool that just slips when it gets pushed. Over multiple consecutive cycles, OI keeps extending. Structurally, this setup usually doesn’t just end after one wave.
First, I’ll mark this down and see whether it can hold and stabilize above the upper edge of this range.
In the 15m timeframe, it surged 3.11%. Volume immediately went up to 2.34x. The closing price broke above the upper boundary of roughly the last 20 consecutive 5m candles. But what really made me take a closer look is the OI (open interest): on 15m, +1.23%; on 1h, +1.58%. Nominal change over 1h added 1.47 million U. The abnormal percentile is 90.7%, ranking #12 across the whole pool.
Price is rising together with OI—this doesn’t look like a weak short-covering squeeze. It’s more like new leveraged long positions are entering.
Passive trades are lower by 11.3%, with buy/sell ratio at 1.25. The buy side is genuinely consuming liquidity, not just bouncing it.
Over 24h, turnover is 183M and the order book depth is also solid. This isn’t the kind of pool that just slips when it gets pushed. Over multiple consecutive cycles, OI keeps extending. Structurally, this setup usually doesn’t just end after one wave.
First, I’ll mark this down and see whether it can hold and stabilize above the upper edge of this range.
10
·
--
ENA has gotten a bit interesting this round.
In the 15m timeframe, it’s up 2.37%. Volume surged straight to 2.52x. The Z value is 3.38, but OI is declining—15m: -0.27%, 1h: -0.06%. Price is rising while positions are shrinking. That’s the classic short-covering play, not new long entries. Nominal change is positive, though—2.65M and 4.20M—indicating some positioning is covering, but the direction still skews bearish.
Across the whole pool, the anomaly percentile is 87.3%, with an anomaly rank of #12. The nominal change ranks as high as #3. On 5m Binance, there were 243K liquidations by the liquidation agent, and buys are concentrated—there’s a very clear sign that shorts were forced to close.
However, active trading is weaker: -8.4%. The buy/sell ratio is 0.84, and sell pressure is still there. This move looks more like shorts getting liquidated and being pushed upward, not driven by spot buy demand. The 24h trading volume is 655M, and liquidity depth is sufficient.
Price has touched the recent range boundary, and volume has picked up too. Next, we’ll see whether OI can turn positive. If OI keeps falling and price stalls without further progress, then this short-covering gap-filling move is probably close to ending. Consider carefully before chasing longs yourself.
ENA has gotten a bit interesting this round.
In the 15m timeframe, it’s up 2.37%. Volume surged straight to 2.52x. The Z value is 3.38, but OI is declining—15m: -0.27%, 1h: -0.06%. Price is rising while positions are shrinking. That’s the classic short-covering play, not new long entries. Nominal change is positive, though—2.65M and 4.20M—indicating some positioning is covering, but the direction still skews bearish.
Across the whole pool, the anomaly percentile is 87.3%, with an anomaly rank of #12. The nominal change ranks as high as #3. On 5m Binance, there were 243K liquidations by the liquidation agent, and buys are concentrated—there’s a very clear sign that shorts were forced to close.
However, active trading is weaker: -8.4%. The buy/sell ratio is 0.84, and sell pressure is still there. This move looks more like shorts getting liquidated and being pushed upward, not driven by spot buy demand. The 24h trading volume is 655M, and liquidity depth is sufficient.
Price has touched the recent range boundary, and volume has picked up too. Next, we’ll see whether OI can turn positive. If OI keeps falling and price stalls without further progress, then this short-covering gap-filling move is probably close to ending. Consider carefully before chasing longs yourself.
In the 15m timeframe, it’s up 2.37%. Volume surged straight to 2.52x. The Z value is 3.38, but OI is declining—15m: -0.27%, 1h: -0.06%. Price is rising while positions are shrinking. That’s the classic short-covering play, not new long entries. Nominal change is positive, though—2.65M and 4.20M—indicating some positioning is covering, but the direction still skews bearish.
Across the whole pool, the anomaly percentile is 87.3%, with an anomaly rank of #12. The nominal change ranks as high as #3. On 5m Binance, there were 243K liquidations by the liquidation agent, and buys are concentrated—there’s a very clear sign that shorts were forced to close.
However, active trading is weaker: -8.4%. The buy/sell ratio is 0.84, and sell pressure is still there. This move looks more like shorts getting liquidated and being pushed upward, not driven by spot buy demand. The 24h trading volume is 655M, and liquidity depth is sufficient.
Price has touched the recent range boundary, and volume has picked up too. Next, we’ll see whether OI can turn positive. If OI keeps falling and price stalls without further progress, then this short-covering gap-filling move is probably close to ending. Consider carefully before chasing longs yourself.
116

·
--
$PIEVERSE That one is a bit harsh.
15m directly dropped 3.67%, volume expanded to 1.44x, aggressive trading imbalance was -18.2%, buy/sell ratio 0.69. The close also fell below the lower band of the past 20 5m candles. This isn’t a normal pullback—someone pulled liquidity first.
But interestingly, OI: in 1h the notional actually decreased by 488K, and in 15m by -803K. Price fell while OI fell as well—typical deleveraging. It looks more like longs were squeezed out or cut their positions, rather than new shorts piling in aggressively.
OI percentile is 94%, overall pool abnormality is #4, and notional change is #12, indicating this level is already extreme within the pool. The 24h trading value is 44.61M, and depth is sufficient, so this move isn’t a fakeout caused by liquidity being drained.
Now we just need to see whether the lower edge of this range can be recovered quickly. If it can’t be reclaimed, there may be another wave of forced stop-losses below.
$PIEVERSE That one is a bit harsh.
15m directly dropped 3.67%, volume expanded to 1.44x, aggressive trading imbalance was -18.2%, buy/sell ratio 0.69. The close also fell below the lower band of the past 20 5m candles. This isn’t a normal pullback—someone pulled liquidity first.
But interestingly, OI: in 1h the notional actually decreased by 488K, and in 15m by -803K. Price fell while OI fell as well—typical deleveraging. It looks more like longs were squeezed out or cut their positions, rather than new shorts piling in aggressively.
OI percentile is 94%, overall pool abnormality is #4, and notional change is #12, indicating this level is already extreme within the pool. The 24h trading value is 44.61M, and depth is sufficient, so this move isn’t a fakeout caused by liquidity being drained.
Now we just need to see whether the lower edge of this range can be recovered quickly. If it can’t be reclaimed, there may be another wave of forced stop-losses below.
15m directly dropped 3.67%, volume expanded to 1.44x, aggressive trading imbalance was -18.2%, buy/sell ratio 0.69. The close also fell below the lower band of the past 20 5m candles. This isn’t a normal pullback—someone pulled liquidity first.
But interestingly, OI: in 1h the notional actually decreased by 488K, and in 15m by -803K. Price fell while OI fell as well—typical deleveraging. It looks more like longs were squeezed out or cut their positions, rather than new shorts piling in aggressively.
OI percentile is 94%, overall pool abnormality is #4, and notional change is #12, indicating this level is already extreme within the pool. The 24h trading value is 44.61M, and depth is sufficient, so this move isn’t a fakeout caused by liquidity being drained.
Now we just need to see whether the lower edge of this range can be recovered quickly. If it can’t be reclaimed, there may be another wave of forced stop-losses below.
5
·
--
$ZEC This drop isn’t that severe, but the structure is pretty interesting.
In the 15m interval, volume directly reaches 3.6 times the average volume, while the price only falls 0.82%. It looks like a dull knife, but in terms of aggressive trading the active executions are down 20.9%, and the buy/sell ratio is 0.65—sell pressure is smashing, it just didn’t break through.
The key is the OI: 15m is -1.02%, 1h is -0.92%, and nominally it has shed more than 10 million U. The price is down while OI is also down—this isn’t new short-selling entering the market. It’s longs deleveraging, taking stop-losses, and shrinking positions. The abnormal percentile is 96.6%, the abnormal pool is #12, and nominal change is #2. Data-wise, it’s already triggering alarms.
The close broke below the lower edge of the recent 20 five-minute ranges, and the price is also pressing right against a historical extreme zone. With these two factors combined, it’s either a washout that ends quickly, or a warning sign of a larger-scale loosening.
24h trading value is over 2.5 billion, and the order-book depth is sufficient. At this level, there’s no rush to pick a side—first watch whether OI keeps falling or stabilizes. If OI finishes dropping and the price doesn’t rebound, then that’s the real problem.
$ZEC This drop isn’t that severe, but the structure is pretty interesting.
In the 15m interval, volume directly reaches 3.6 times the average volume, while the price only falls 0.82%. It looks like a dull knife, but in terms of aggressive trading the active executions are down 20.9%, and the buy/sell ratio is 0.65—sell pressure is smashing, it just didn’t break through.
The key is the OI: 15m is -1.02%, 1h is -0.92%, and nominally it has shed more than 10 million U. The price is down while OI is also down—this isn’t new short-selling entering the market. It’s longs deleveraging, taking stop-losses, and shrinking positions. The abnormal percentile is 96.6%, the abnormal pool is #12, and nominal change is #2. Data-wise, it’s already triggering alarms.
The close broke below the lower edge of the recent 20 five-minute ranges, and the price is also pressing right against a historical extreme zone. With these two factors combined, it’s either a washout that ends quickly, or a warning sign of a larger-scale loosening.
24h trading value is over 2.5 billion, and the order-book depth is sufficient. At this level, there’s no rush to pick a side—first watch whether OI keeps falling or stabilizes. If OI finishes dropping and the price doesn’t rebound, then that’s the real problem.
In the 15m interval, volume directly reaches 3.6 times the average volume, while the price only falls 0.82%. It looks like a dull knife, but in terms of aggressive trading the active executions are down 20.9%, and the buy/sell ratio is 0.65—sell pressure is smashing, it just didn’t break through.
The key is the OI: 15m is -1.02%, 1h is -0.92%, and nominally it has shed more than 10 million U. The price is down while OI is also down—this isn’t new short-selling entering the market. It’s longs deleveraging, taking stop-losses, and shrinking positions. The abnormal percentile is 96.6%, the abnormal pool is #12, and nominal change is #2. Data-wise, it’s already triggering alarms.
The close broke below the lower edge of the recent 20 five-minute ranges, and the price is also pressing right against a historical extreme zone. With these two factors combined, it’s either a washout that ends quickly, or a warning sign of a larger-scale loosening.
24h trading value is over 2.5 billion, and the order-book depth is sufficient. At this level, there’s no rush to pick a side—first watch whether OI keeps falling or stabilizes. If OI finishes dropping and the price doesn’t rebound, then that’s the real problem.
47
·
--
$GENIUS This move is kind of interesting.
On the 15m timeframe it directly surged by 4.27%. The volume hit 4.33x the norm, with a Z value of 5.08—this isn’t just small-time action. The key is that OI is moving up in sync: 15m +0.41%, 1h +0.44%. When you add up the nominal changes, it comes to nearly 700k U. Price up plus OI up means new leveraged long positions are entering—not some fake squeeze move by shorts.
The aggressive trade gap is 20%, the buy/sell ratio is 1.5, and the funding rate is also pushed up to a very high percentile recently. The OI abnormal percentile is 94.4%, ranking #12 across the whole pool. The closing price has just broken above the upper band of the past ~20 consecutive 5m candles, and it has been extending through several periods—depth confirmation seems solid.
In the past 24h, the traded value is only a little over 30M, so the market cap isn’t big. At this level, it’s easy for the move to keep going. But with a high funding percentile plus continuous OI build-up, stay alert—when longs get too crowded, a single needle can wash out a batch of people.
Watch it first and see whether it can hold above the top of this range.
$GENIUS This move is kind of interesting.
On the 15m timeframe it directly surged by 4.27%. The volume hit 4.33x the norm, with a Z value of 5.08—this isn’t just small-time action. The key is that OI is moving up in sync: 15m +0.41%, 1h +0.44%. When you add up the nominal changes, it comes to nearly 700k U. Price up plus OI up means new leveraged long positions are entering—not some fake squeeze move by shorts.
The aggressive trade gap is 20%, the buy/sell ratio is 1.5, and the funding rate is also pushed up to a very high percentile recently. The OI abnormal percentile is 94.4%, ranking #12 across the whole pool. The closing price has just broken above the upper band of the past ~20 consecutive 5m candles, and it has been extending through several periods—depth confirmation seems solid.
In the past 24h, the traded value is only a little over 30M, so the market cap isn’t big. At this level, it’s easy for the move to keep going. But with a high funding percentile plus continuous OI build-up, stay alert—when longs get too crowded, a single needle can wash out a batch of people.
Watch it first and see whether it can hold above the top of this range.
On the 15m timeframe it directly surged by 4.27%. The volume hit 4.33x the norm, with a Z value of 5.08—this isn’t just small-time action. The key is that OI is moving up in sync: 15m +0.41%, 1h +0.44%. When you add up the nominal changes, it comes to nearly 700k U. Price up plus OI up means new leveraged long positions are entering—not some fake squeeze move by shorts.
The aggressive trade gap is 20%, the buy/sell ratio is 1.5, and the funding rate is also pushed up to a very high percentile recently. The OI abnormal percentile is 94.4%, ranking #12 across the whole pool. The closing price has just broken above the upper band of the past ~20 consecutive 5m candles, and it has been extending through several periods—depth confirmation seems solid.
In the past 24h, the traded value is only a little over 30M, so the market cap isn’t big. At this level, it’s easy for the move to keep going. But with a high funding percentile plus continuous OI build-up, stay alert—when longs get too crowded, a single needle can wash out a batch of people.
Watch it first and see whether it can hold above the top of this range.
13
Log in to explore more content
Join global crypto users on Binance Square
⚡️ Get latest and useful information about crypto.
💬 Trusted by the world’s largest crypto exchange.
👍 Discover real insights from verified creators.
Email / Phone number
Trending Topics
1
#AIStocksWhatNext
461,268 views
3,411 Discussing
2
#BitcoinTops$87KAtEightMonthHigh
181 views
13 Discussing
3
#ZECBreaksAbove$1600AtRecordHigh
0 views
0 Discussing
4
#BitwiseNEARStakingETPAssetsTop$100M
6,030 views
42 Discussing
5
#BitcoinBreaksAboveMayHighNears$86K
21,221 views
224 Discussing
6
#DogecoinRises15%
66,618 views
1,175 Discussing
7
#$14BBitcoinOptionsExpireFriday
6,029 views
103 Discussing
8
#BNBMarketCapPassesBNYMellon
41,934 views
864 Discussing
9
#CryptoMarketCapReclaims$3Trillion
8,424 views
87 Discussing
10
#MuseOvertakesChatGPTAsTopFreeIOSApp
23,687 views
631 Discussing