
#118
118
2,980 views
43 Discussing
Hot
Latest

·
--
Pudgy Penguins (PENGU) — Rank #118, Score 2.0
The strongest performer in this trio, PENGU benefits from the Pudgy Penguins NFT brand’s mainstream crossover. With physical toys
Pudgy Penguins (PENGU) — Rank #118, Score 2.0
The strongest performer in this trio, PENGU benefits from the Pudgy Penguins NFT brand’s mainstream crossover. With physical toys
The strongest performer in this trio, PENGU benefits from the Pudgy Penguins NFT brand’s mainstream crossover. With physical toys
158

·
--
💎 BINANCE GEMS | EARLY SPOT WATCH
Signal #118 · $WCT
Score: 48/100 | EARLY ENTRY
I've got $WCT on my radar because the setup may still be developing, rather than being a move I'd want to chase after a big candle.
Volume activity is one of the main things supporting this watch.
Price reference: $0.03825
24h change: +5.2% · 24h volume: $5.32M
Risk reference — SL: $0.036455357
Targets omitted: nearby resistance leaves limited room.
My plan: no chasing. I want the setup to hold, volume to stay healthy, and resistance to clear cleanly. If those conditions fail, I skip it.
This is a spot-market watchlist idea, not a guaranteed result. Manage risk and confirm the live chart before acting.
#BinanceGems #SpotTrading $WCT
💎 BINANCE GEMS | EARLY SPOT WATCH
Signal #118 · $WCT
Score: 48/100 | EARLY ENTRY
I've got $WCT on my radar because the setup may still be developing, rather than being a move I'd want to chase after a big candle.
Volume activity is one of the main things supporting this watch.
Price reference: $0.03825
24h change: +5.2% · 24h volume: $5.32M
Risk reference — SL: $0.036455357
Targets omitted: nearby resistance leaves limited room.
My plan: no chasing. I want the setup to hold, volume to stay healthy, and resistance to clear cleanly. If those conditions fail, I skip it.
This is a spot-market watchlist idea, not a guaranteed result. Manage risk and confirm the live chart before acting.
#BinanceGems #SpotTrading $WCT
Signal #118 · $WCT
Score: 48/100 | EARLY ENTRY
I've got $WCT on my radar because the setup may still be developing, rather than being a move I'd want to chase after a big candle.
Volume activity is one of the main things supporting this watch.
Price reference: $0.03825
24h change: +5.2% · 24h volume: $5.32M
Risk reference — SL: $0.036455357
Targets omitted: nearby resistance leaves limited room.
My plan: no chasing. I want the setup to hold, volume to stay healthy, and resistance to clear cleanly. If those conditions fail, I skip it.
This is a spot-market watchlist idea, not a guaranteed result. Manage risk and confirm the live chart before acting.
#BinanceGems #SpotTrading $WCT
5

·
--
$PENGU now looks more like a case of the narrative still being there while liquidity has pulled out first. When it surged above $0.010 in late September, daily trading volume briefly exceeded $500M; now it’s down to around $90M, with the price back at $0.0074, a market cap of $467M, and a ranking of #118. It’s not that people suddenly stopped recognizing the project; rather, the same pool of capital has moved on to chase opportunities with better short-term odds.
The 24-hour change of -0.04% can easily be read as a sign that the decline has halted, but I’m more focused on the fact that volume hasn’t returned. It’s down 8.88% over 7 days and 6.02% over 30 days. The losses aren’t particularly steep, but each rebound has been weaker than the last, as overhead selling pressure and narrative fatigue weigh on it at the same time. Being 89% below its ATH is a fact, but don’t treat “it’s fallen enough” as a reason to buy.
$PENGU still has its IP foundation, but what’s missing is a catalyst that would make holders willing to keep their tokens locked up. Only if trading volume climbs back above $120M and the price reclaims $0.0082 would that count as a return of capital. If volume keeps shrinking and $0.0071 is tested repeatedly, this is just a pause in a gradual decline.
Where are you seeing signs of fresh momentum—an NFT sector rebound, net inflows on CEXs, or a new use case driving activity in the $PENGU ecosystem? That’s more useful than looking at a single daily candle.
$PENGU now looks more like a case of the narrative still being there while liquidity has pulled out first. When it surged above $0.010 in late September, daily trading volume briefly exceeded $500M; now it’s down to around $90M, with the price back at $0.0074, a market cap of $467M, and a ranking of #118. It’s not that people suddenly stopped recognizing the project; rather, the same pool of capital has moved on to chase opportunities with better short-term odds.
The 24-hour change of -0.04% can easily be read as a sign that the decline has halted, but I’m more focused on the fact that volume hasn’t returned. It’s down 8.88% over 7 days and 6.02% over 30 days. The losses aren’t particularly steep, but each rebound has been weaker than the last, as overhead selling pressure and narrative fatigue weigh on it at the same time. Being 89% below its ATH is a fact, but don’t treat “it’s fallen enough” as a reason to buy.
$PENGU still has its IP foundation, but what’s missing is a catalyst that would make holders willing to keep their tokens locked up. Only if trading volume climbs back above $120M and the price reclaims $0.0082 would that count as a return of capital. If volume keeps shrinking and $0.0071 is tested repeatedly, this is just a pause in a gradual decline.
Where are you seeing signs of fresh momentum—an NFT sector rebound, net inflows on CEXs, or a new use case driving activity in the $PENGU ecosystem? That’s more useful than looking at a single daily candle.
The 24-hour change of -0.04% can easily be read as a sign that the decline has halted, but I’m more focused on the fact that volume hasn’t returned. It’s down 8.88% over 7 days and 6.02% over 30 days. The losses aren’t particularly steep, but each rebound has been weaker than the last, as overhead selling pressure and narrative fatigue weigh on it at the same time. Being 89% below its ATH is a fact, but don’t treat “it’s fallen enough” as a reason to buy.
$PENGU still has its IP foundation, but what’s missing is a catalyst that would make holders willing to keep their tokens locked up. Only if trading volume climbs back above $120M and the price reclaims $0.0082 would that count as a return of capital. If volume keeps shrinking and $0.0071 is tested repeatedly, this is just a pause in a gradual decline.
Where are you seeing signs of fresh momentum—an NFT sector rebound, net inflows on CEXs, or a new use case driving activity in the $PENGU ecosystem? That’s more useful than looking at a single daily candle.
12

·
--
How can a fictional coin in a game trailer trigger a real 2,900% surge? Rockstar released a GTA VI trailer featuring a meme coin, and copycat tokens immediately appeared on Solana, surging 2,900% in 24 hours. At the same time, on CoinGecko’s trending list, DACITY rose 48.9%, reaching rank #718 by market cap; QTC gained just 4.3%, ranking #620; and PENGU actually fell 0.2%, ranking #118. Meanwhile, BTC barely moved around 82,100, down 0.9% over 24 hours, with $1.2 billion in trading volume. Money didn’t flow into major coins—it all rushed into the narrative. I’ve been watching this “cultural event → copycat token → trending list” chain for a while. DACITY and QTC showing up in the search rankings at the same time suggests that people jumping in hadn’t even looked at what the projects were—they just cared whether the names sounded like the one in the trailer. In this kind of market, the first people to get burned are often the ones who only clicked in after seeing the 2,900% gain. $SOL $BTC
How can a fictional coin in a game trailer trigger a real 2,900% surge? Rockstar released a GTA VI trailer featuring a meme coin, and copycat tokens immediately appeared on Solana, surging 2,900% in 24 hours. At the same time, on CoinGecko’s trending list, DACITY rose 48.9%, reaching rank #718 by market cap; QTC gained just 4.3%, ranking #620; and PENGU actually fell 0.2%, ranking #118. Meanwhile, BTC barely moved around 82,100, down 0.9% over 24 hours, with $1.2 billion in trading volume. Money didn’t flow into major coins—it all rushed into the narrative. I’ve been watching this “cultural event → copycat token → trending list” chain for a while. DACITY and QTC showing up in the search rankings at the same time suggests that people jumping in hadn’t even looked at what the projects were—they just cared whether the names sounded like the one in the trailer. In this kind of market, the first people to get burned are often the ones who only clicked in after seeing the 2,900% gain. $SOL $BTC

81
·
--
The money hasn’t left $PENGU; it’s just changed its posture. The high-volume surge candle on September 23 saw $512M in trading volume in a single day. Since then, the price has slid back to around 0.0075, but it’s still up +12.42% over 30 days and has $109M in 24-hour volume—hardly dead water for a meme coin with a $474M market cap. What matters more to me is that this pullback has come on declining volume without breaking support. Since the high of 0.0103, volume has fallen from $512M to its current level, while buyers have repeatedly stepped in around 0.0075. That looks more like accumulation on dips than an exit. Its return to #118 on the trending list also shows that attention is still there; the narrative just lacks a catalyst.
But don’t rush to call it a reversal. It’s still -88.96% off its ATH, with heavy overhead supply. Any rebound will have to absorb that selling pressure first. The +12.42% over 30 days looks more like movement within a bottoming range than the start of a new trend. The real confirmation signal would be volume picking back up above $200M, with the price holding above 0.0082. If volume keeps shrinking and the price breaks below 0.0075, that’s a different story.
What’s missing right now is a new funding narrative that could take it from “dip buying” to “active bullish positioning.” Have you spotted any unusual activity in exchange wallets, whale accumulation, or clues that other ecosystems are bringing liquidity to $PENGU ? There’s only so much I can see from the charts, so feel free to add anything I’ve missed.
The money hasn’t left $PENGU ; it’s just changed its posture. The high-volume surge candle on September 23 saw $512M in trading volume in a single day. Since then, the price has slid back to around 0.0075, but it’s still up +12.42% over 30 days and has $109M in 24-hour volume—hardly dead water for a meme coin with a $474M market cap. What matters more to me is that this pullback has come on declining volume without breaking support. Since the high of 0.0103, volume has fallen from $512M to its current level, while buyers have repeatedly stepped in around 0.0075. That looks more like accumulation on dips than an exit. Its return to #118 on the trending list also shows that attention is still there; the narrative just lacks a catalyst.
But don’t rush to call it a reversal. It’s still -88.96% off its ATH, with heavy overhead supply. Any rebound will have to absorb that selling pressure first. The +12.42% over 30 days looks more like movement within a bottoming range than the start of a new trend. The real confirmation signal would be volume picking back up above $200M, with the price holding above 0.0082. If volume keeps shrinking and the price breaks below 0.0075, that’s a different story.
What’s missing right now is a new funding narrative that could take it from “dip buying” to “active bullish positioning.” Have you spotted any unusual activity in exchange wallets, whale accumulation, or clues that other ecosystems are bringing liquidity to $PENGU ? There’s only so much I can see from the charts, so feel free to add anything I’ve missed.
But don’t rush to call it a reversal. It’s still -88.96% off its ATH, with heavy overhead supply. Any rebound will have to absorb that selling pressure first. The +12.42% over 30 days looks more like movement within a bottoming range than the start of a new trend. The real confirmation signal would be volume picking back up above $200M, with the price holding above 0.0082. If volume keeps shrinking and the price breaks below 0.0075, that’s a different story.
What’s missing right now is a new funding narrative that could take it from “dip buying” to “active bullish positioning.” Have you spotted any unusual activity in exchange wallets, whale accumulation, or clues that other ecosystems are bringing liquidity to $PENGU ? There’s only so much I can see from the charts, so feel free to add anything I’ve missed.
6


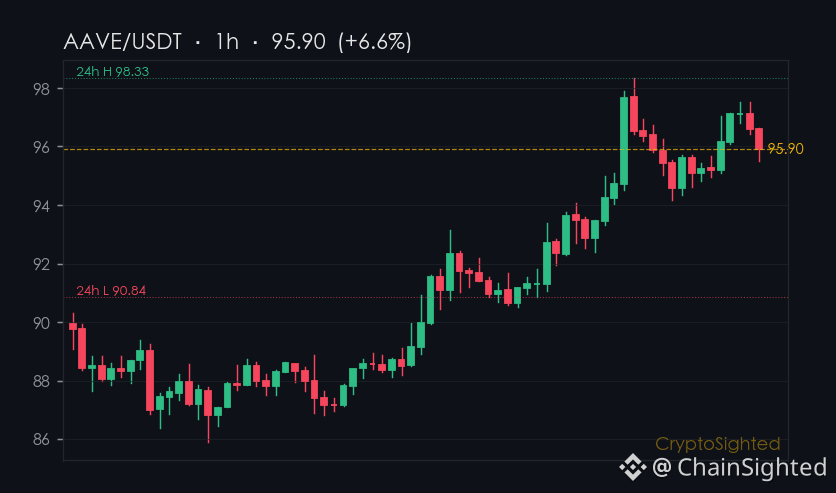
4.83% - that’s the kind of move that makes you sit up and take notice.
$AAVE is up 4.83% in the last 24 hours, climbing from $90.84 to $98.33 - not just a one-day pop, but part of a 7-day rise of 7.2%, more than double the 1.4% rise in the broader crypto market.
That’s not noise - that’s a signal.
Now, is this the kind of move that hints at something bigger - like a shift in DeFi’s structure or a new layer of institutional interest?
Or is it just a short-term spike in a niche corner of the market?
Defense or offense - one word.
—
Not financial advice. DYOR.
📌 Hotspot Watch · #118 · #CryptoTrends #CryptoSighted $AAVE
4.83% - that’s the kind of move that makes you sit up and take notice.
$AAVE is up 4.83% in the last 24 hours, climbing from $90.84 to $98.33 - not just a one-day pop, but part of a 7-day rise of 7.2%, more than double the 1.4% rise in the broader crypto market.
That’s not noise - that’s a signal.
Now, is this the kind of move that hints at something bigger - like a shift in DeFi’s structure or a new layer of institutional interest?
Or is it just a short-term spike in a niche corner of the market?
Defense or offense - one word.
—
Not financial advice. DYOR.
📌 Hotspot Watch · #118 · #CryptoTrends #CryptoSighted $AAVE
$AAVE is up 4.83% in the last 24 hours, climbing from $90.84 to $98.33 - not just a one-day pop, but part of a 7-day rise of 7.2%, more than double the 1.4% rise in the broader crypto market.
That’s not noise - that’s a signal.
Now, is this the kind of move that hints at something bigger - like a shift in DeFi’s structure or a new layer of institutional interest?
Or is it just a short-term spike in a niche corner of the market?
Defense or offense - one word.
—
Not financial advice. DYOR.
📌 Hotspot Watch · #118 · #CryptoTrends #CryptoSighted $AAVE
24
·
--
$PRL is up 25.77% today, but the most unusual thing isn’t the green candle itself—it’s the volume structure behind it. It’s nearly tripled in 30 days, with a market cap of $480M and a ranking of #118—but 24-hour trading volume is only $7.14M. Just $7 million in volume supporting a 25-point gain on a $380M project: liquidity this thin can snap.
Looking back: the run from 0.38 to 1.07 on September 19 came with steadily rising volume, reaching 5.77M—real money was coming in. What about now? Over the past week, the price has moved back and forth between 1.04 and 1.48. Today it surged to 1.41, with volume only twice yesterday’s—and still below 7.2M. This points to one thing: the tokens are still concentrated in the hands of a few key holders. Everyday selling pressure is actually quite low, but the real smart money may still be watching from the sidelines.
So there are two ways to read the market right now. Which side you’re on is up to you.
The first: this is natural turnover after a token unlock. Most of the circulating supply has been absorbed, and the climb on lower volume means buyers are taking control, ahead of a concentrated move before the ATH. To confirm this, watch the next 2–3 days: can the price hold above $1.41, can daily volume stay above $6M, and can BTC avoid dragging the market down?
The second: this kind of low-volume move looks like a “pump-and-distribute” setup—using a small amount of circulating supply to push the price to new highs, while volume starts to fade. Once the momentum runs out, a break below 1.09 (the 24-hour low) could be the start of liquidity drying up. What you’d need to see in this scenario is daily volume returning to over $10M, while the price fails to break through 1.48 and continues to stall sideways near the highs around 1.3.
My view is a little more bearish: looking at the price action $PRL has seen, what really matters isn’t whether it can reach its ATH of 1.76, but whether volume can support the price at these levels. A new asset, high volatility, thin liquidity—when a token like this moves, it can be a rocket, but when it crashes, it won’t give you a discount.
# There’s no need to go in heavily right now. Wait for volume to provide an answer, and for the market to put confirmation of a potential second leg down on the table before making a decision. If you’re not looking at both sides, what do you think this move at 1.41 is—what shot has it just fired?
$PRL is up 25.77% today, but the most unusual thing isn’t the green candle itself—it’s the volume structure behind it. It’s nearly tripled in 30 days, with a market cap of $480M and a ranking of #118—but 24-hour trading volume is only $7.14M. Just $7 million in volume supporting a 25-point gain on a $380M project: liquidity this thin can snap.
Looking back: the run from 0.38 to 1.07 on September 19 came with steadily rising volume, reaching 5.77M—real money was coming in. What about now? Over the past week, the price has moved back and forth between 1.04 and 1.48. Today it surged to 1.41, with volume only twice yesterday’s—and still below 7.2M. This points to one thing: the tokens are still concentrated in the hands of a few key holders. Everyday selling pressure is actually quite low, but the real smart money may still be watching from the sidelines.
So there are two ways to read the market right now. Which side you’re on is up to you.
The first: this is natural turnover after a token unlock. Most of the circulating supply has been absorbed, and the climb on lower volume means buyers are taking control, ahead of a concentrated move before the ATH. To confirm this, watch the next 2–3 days: can the price hold above $1.41, can daily volume stay above $6M, and can BTC avoid dragging the market down?
The second: this kind of low-volume move looks like a “pump-and-distribute” setup—using a small amount of circulating supply to push the price to new highs, while volume starts to fade. Once the momentum runs out, a break below 1.09 (the 24-hour low) could be the start of liquidity drying up. What you’d need to see in this scenario is daily volume returning to over $10M, while the price fails to break through 1.48 and continues to stall sideways near the highs around 1.3.
My view is a little more bearish: looking at the price action $PRL has seen, what really matters isn’t whether it can reach its ATH of 1.76, but whether volume can support the price at these levels. A new asset, high volatility, thin liquidity—when a token like this moves, it can be a rocket, but when it crashes, it won’t give you a discount.
# There’s no need to go in heavily right now. Wait for volume to provide an answer, and for the market to put confirmation of a potential second leg down on the table before making a decision. If you’re not looking at both sides, what do you think this move at 1.41 is—what shot has it just fired?
Looking back: the run from 0.38 to 1.07 on September 19 came with steadily rising volume, reaching 5.77M—real money was coming in. What about now? Over the past week, the price has moved back and forth between 1.04 and 1.48. Today it surged to 1.41, with volume only twice yesterday’s—and still below 7.2M. This points to one thing: the tokens are still concentrated in the hands of a few key holders. Everyday selling pressure is actually quite low, but the real smart money may still be watching from the sidelines.
So there are two ways to read the market right now. Which side you’re on is up to you.
The first: this is natural turnover after a token unlock. Most of the circulating supply has been absorbed, and the climb on lower volume means buyers are taking control, ahead of a concentrated move before the ATH. To confirm this, watch the next 2–3 days: can the price hold above $1.41, can daily volume stay above $6M, and can BTC avoid dragging the market down?
The second: this kind of low-volume move looks like a “pump-and-distribute” setup—using a small amount of circulating supply to push the price to new highs, while volume starts to fade. Once the momentum runs out, a break below 1.09 (the 24-hour low) could be the start of liquidity drying up. What you’d need to see in this scenario is daily volume returning to over $10M, while the price fails to break through 1.48 and continues to stall sideways near the highs around 1.3.
My view is a little more bearish: looking at the price action $PRL has seen, what really matters isn’t whether it can reach its ATH of 1.76, but whether volume can support the price at these levels. A new asset, high volatility, thin liquidity—when a token like this moves, it can be a rocket, but when it crashes, it won’t give you a discount.
# There’s no need to go in heavily right now. Wait for volume to provide an answer, and for the market to put confirmation of a potential second leg down on the table before making a decision. If you’re not looking at both sides, what do you think this move at 1.41 is—what shot has it just fired?
79

·
--
I’ve been tracking the CoinGecko trending list and noticed a few stand‑outs. Uniswap (UNI) is up +7.2% today, pushing it solidly into the top‑30. Lighter (LIT) follows with a +5.4% surge, and Artificial Inu (AI) surprises with a +4.9% jump. 🚀
I’m also keeping an eye on the mid‑range movers. Pons (PONS) climbs +3.1% despite a #118 rank, while Pudgy Penguins (PENGU) nudges +2.8% at #102. MarsCoin (MARSCOIN) shows a modest +2.3% gain, holding #288.
Finally, The Index (INDEX) rounds out the list with a +1.9% tick at #445, reminding me that even lower‑rank tokens can surprise. I’ll keep you posted as these trends evolve – stay tuned for the next swing! 😊
$HEMI, $EGLD, $AKE
I’ve been tracking the CoinGecko trending list and noticed a few stand‑outs. Uniswap (UNI) is up +7.2% today, pushing it solidly into the top‑30. Lighter (LIT) follows with a +5.4% surge, and Artificial Inu (AI) surprises with a +4.9% jump. 🚀
I’m also keeping an eye on the mid‑range movers. Pons (PONS) climbs +3.1% despite a #118 rank, while Pudgy Penguins (PENGU) nudges +2.8% at #102. MarsCoin (MARSCOIN) shows a modest +2.3% gain, holding #288.
Finally, The Index (INDEX) rounds out the list with a +1.9% tick at #445, reminding me that even lower‑rank tokens can surprise. I’ll keep you posted as these trends evolve – stay tuned for the next swing! 😊
$HEMI , $EGLD , $AKE
I’m also keeping an eye on the mid‑range movers. Pons (PONS) climbs +3.1% despite a #118 rank, while Pudgy Penguins (PENGU) nudges +2.8% at #102. MarsCoin (MARSCOIN) shows a modest +2.3% gain, holding #288.
Finally, The Index (INDEX) rounds out the list with a +1.9% tick at #445, reminding me that even lower‑rank tokens can surprise. I’ll keep you posted as these trends evolve – stay tuned for the next swing! 😊
$HEMI , $EGLD , $AKE
318

·
--
I've been tracking trending tokens on CoinGecko.
I'm seeing tokens like Hyperliquid (HYPE) and Pudgy Penguins (PENGU) with notable market cap ranks.
I think these tokens are worth watching, so I'm keeping an eye on them 📈, with HYPE at #10 and PENGU at #118, along with others like Ethena (ENA) at #84 and TAC (TAC) at #140 💡.
I've also noticed United States Water Reserve (USWR) and The Black Bull (ANSEM) with lower ranks, but still trending 🚀.
$RE, $AIGENSYN, $TAC
I've been tracking trending tokens on CoinGecko.
I'm seeing tokens like Hyperliquid (HYPE) and Pudgy Penguins (PENGU) with notable market cap ranks.
I think these tokens are worth watching, so I'm keeping an eye on them 📈, with HYPE at #10 and PENGU at #118, along with others like Ethena (ENA) at #84 and TAC (TAC) at #140 💡.
I've also noticed United States Water Reserve (USWR) and The Black Bull (ANSEM) with lower ranks, but still trending 🚀.
$RE , $AIGENSYN , $TAC
I'm seeing tokens like Hyperliquid (HYPE) and Pudgy Penguins (PENGU) with notable market cap ranks.
I think these tokens are worth watching, so I'm keeping an eye on them 📈, with HYPE at #10 and PENGU at #118, along with others like Ethena (ENA) at #84 and TAC (TAC) at #140 💡.
I've also noticed United States Water Reserve (USWR) and The Black Bull (ANSEM) with lower ranks, but still trending 🚀.
$RE , $AIGENSYN , $TAC
1
281

·
--
We're excited to share the latest trending tokens on CoinGecko. Our community is always on the lookout for new and exciting projects.
We've got Pudgy Penguins (PENGU) and ADI (ADI) making waves, with market cap ranks #118 and #75 respectively 🚀.
We're also seeing Cash Cat (CASHCAT) and Toshi (TOSHI) gaining traction, albeit with lower market cap ranks.
Our research shows that The Black Bull (ANSEM) and Akedo (AKE) are also trending, with ranks #322 and #501. Solana (SOL) is a notable mention, with a market cap rank of #7, showing significant growth 📈.
We're confident that our community will find this information valuable 🤑. We're committed to keeping our community informed about the latest market trends 💡.
$DGB, $UTK, $AKE
We're excited to share the latest trending tokens on CoinGecko. Our community is always on the lookout for new and exciting projects.
We've got Pudgy Penguins (PENGU) and ADI (ADI) making waves, with market cap ranks #118 and #75 respectively 🚀.
We're also seeing Cash Cat (CASHCAT) and Toshi (TOSHI) gaining traction, albeit with lower market cap ranks.
Our research shows that The Black Bull (ANSEM) and Akedo (AKE) are also trending, with ranks #322 and #501. Solana (SOL) is a notable mention, with a market cap rank of #7, showing significant growth 📈.
We're confident that our community will find this information valuable 🤑. We're committed to keeping our community informed about the latest market trends 💡.
$DGB , $UTK, $AKE
We've got Pudgy Penguins (PENGU) and ADI (ADI) making waves, with market cap ranks #118 and #75 respectively 🚀.
We're also seeing Cash Cat (CASHCAT) and Toshi (TOSHI) gaining traction, albeit with lower market cap ranks.
Our research shows that The Black Bull (ANSEM) and Akedo (AKE) are also trending, with ranks #322 and #501. Solana (SOL) is a notable mention, with a market cap rank of #7, showing significant growth 📈.
We're confident that our community will find this information valuable 🤑. We're committed to keeping our community informed about the latest market trends 💡.
$DGB , $UTK, $AKE
201
·
--
I've checked CoinGecko's trending tokens, and I'm excited to share my findings.
I see Concordium and LAB are on the list.
I'm looking at their market cap ranks, with Pudgy Penguins at #118 and Jupiter at #90, showing notable positions.
Jupiter rose 5% and Pudgy Penguins rose 3%.
I also noticed ADI and Cash Cat, with changes of 2% and 1%.
I think this data is useful for crypto enthusiasts.
I'm wrapping up with a positive note, crypto is trending 🚀💰😊
$XEC, $ALLO, $1000XEC
I've checked CoinGecko's trending tokens, and I'm excited to share my findings.
I see Concordium and LAB are on the list.
I'm looking at their market cap ranks, with Pudgy Penguins at #118 and Jupiter at #90, showing notable positions.
Jupiter rose 5% and Pudgy Penguins rose 3%.
I also noticed ADI and Cash Cat, with changes of 2% and 1%.
I think this data is useful for crypto enthusiasts.
I'm wrapping up with a positive note, crypto is trending 🚀💰😊
$XEC , $ALLO , $1000XEC
I see Concordium and LAB are on the list.
I'm looking at their market cap ranks, with Pudgy Penguins at #118 and Jupiter at #90, showing notable positions.
Jupiter rose 5% and Pudgy Penguins rose 3%.
I also noticed ADI and Cash Cat, with changes of 2% and 1%.
I think this data is useful for crypto enthusiasts.
I'm wrapping up with a positive note, crypto is trending 🚀💰😊
$XEC , $ALLO , $1000XEC
494

·
--
** “ While Dropping 2.1% in 24 Hours, Why This Decline Could Be a “Buying Opportunity”?”Pons (PONSUSDT) is trending right now!
Rank: #118
** Shock? With an instant **-2.106% drop**, it fell to the **2,472.49 $** level, and volume reached **558 M USDT**. Most traders are expecting a “sell-off,” but I see a “ape-in” signal at this dip. 📉 First of all, ETH’s **-2.1% move in the last 24 hours** isn’t just a correction. Spot volume reaching **558 M USDT** shows that big whales are still holding liquidity in their hands. The volume–price distribution indicates that buyers have launched an aggressive **DCA campaign** to defend the price. **Let’s check the Top Movers:** - **UNIUSDT** 6.12 $ (‑5.38 %) – Uniswap is at risk of “pump-and-dump” due to low liquidity and high volatility. - **NEARUSDT** 2.29 $ (‑3.82 %) – Near has growth potential with the Layer-2 ecosystem, but it’s under pressure in the short term. - **DOGEUSDT** 0.08225 $ (‑3.06 %) – The meme coin still expects a “pump,” but the current volatility increases rekt risk. - **LINKUSDT** 11.163 $ (‑2.93 %) – Chainlink was affected by uncertainty in oracle demand. - **ADAUSDT** 0.2032 $ (‑2.40 %) – Cardano’s turned-off staking rewards pulled the price down. The common thread in these declines is that they’re all down **between 2% and 5%**, and volumes range from **10–150 M USDT**. So there’s “sell-pressure” across the market, but there’s also a hidden “buy-the-dip” opportunity. **Why an “buy” signal here?** 1. **Volume–price correlation**: Price falls as volume increases—this usually means “smart money” is buying. 2. **Staking yields**: In ETH 2.0, annual staking is %4–5 yearly st…
** “ While Dropping 2.1% in 24 Hours, Why This Decline Could Be a “Buying Opportunity”?”
Pons (PONSUSDT) is trending right now!
Rank: #118
** Shock? With an instant **-2.106% drop**, it fell to the **2,472.49 $** level, and volume reached **558 M USDT**. Most traders are expecting a “sell-off,” but I see a “ape-in” signal at this dip. 📉 First of all, ETH’s **-2.1% move in the last 24 hours** isn’t just a correction. Spot volume reaching **558 M USDT** shows that big whales are still holding liquidity in their hands. The volume–price distribution indicates that buyers have launched an aggressive **DCA campaign** to defend the price. **Let’s check the Top Movers:** - **UNIUSDT** 6.12 $ (‑5.38 %) – Uniswap is at risk of “pump-and-dump” due to low liquidity and high volatility. - **NEARUSDT** 2.29 $ (‑3.82 %) – Near has growth potential with the Layer-2 ecosystem, but it’s under pressure in the short term. - **DOGEUSDT** 0.08225 $ (‑3.06 %) – The meme coin still expects a “pump,” but the current volatility increases rekt risk. - **LINKUSDT** 11.163 $ (‑2.93 %) – Chainlink was affected by uncertainty in oracle demand. - **ADAUSDT** 0.2032 $ (‑2.40 %) – Cardano’s turned-off staking rewards pulled the price down. The common thread in these declines is that they’re all down **between 2% and 5%**, and volumes range from **10–150 M USDT**. So there’s “sell-pressure” across the market, but there’s also a hidden “buy-the-dip” opportunity. **Why an “buy” signal here?** 1. **Volume–price correlation**: Price falls as volume increases—this usually means “smart money” is buying. 2. **Staking yields**: In ETH 2.0, annual staking is %4–5 yearly st…
Rank: #118
** Shock? With an instant **-2.106% drop**, it fell to the **2,472.49 $** level, and volume reached **558 M USDT**. Most traders are expecting a “sell-off,” but I see a “ape-in” signal at this dip. 📉 First of all, ETH’s **-2.1% move in the last 24 hours** isn’t just a correction. Spot volume reaching **558 M USDT** shows that big whales are still holding liquidity in their hands. The volume–price distribution indicates that buyers have launched an aggressive **DCA campaign** to defend the price. **Let’s check the Top Movers:** - **UNIUSDT** 6.12 $ (‑5.38 %) – Uniswap is at risk of “pump-and-dump” due to low liquidity and high volatility. - **NEARUSDT** 2.29 $ (‑3.82 %) – Near has growth potential with the Layer-2 ecosystem, but it’s under pressure in the short term. - **DOGEUSDT** 0.08225 $ (‑3.06 %) – The meme coin still expects a “pump,” but the current volatility increases rekt risk. - **LINKUSDT** 11.163 $ (‑2.93 %) – Chainlink was affected by uncertainty in oracle demand. - **ADAUSDT** 0.2032 $ (‑2.40 %) – Cardano’s turned-off staking rewards pulled the price down. The common thread in these declines is that they’re all down **between 2% and 5%**, and volumes range from **10–150 M USDT**. So there’s “sell-pressure” across the market, but there’s also a hidden “buy-the-dip” opportunity. **Why an “buy” signal here?** 1. **Volume–price correlation**: Price falls as volume increases—this usually means “smart money” is buying. 2. **Staking yields**: In ETH 2.0, annual staking is %4–5 yearly st…
182
·
--
How to Choose the Strongest Altcoins? Relative Strength (RS) Strategy 📌Raydium (RAYUSDT) is trending right now!
Rank: #118
There are hundreds of altcoins in the market, so how do you figure out which one will rise? The logic of “a falling coin is cheap, I’ll buy it” is one of the biggest mistakes that makes people lose the most money in crypto. Today, we’re going to show you **
#bitcoin #ethereum #crypto
How to Choose the Strongest Altcoins? Relative Strength (RS) Strategy 📌
Raydium (RAYUSDT) is trending right now!
Rank: #118
There are hundreds of altcoins in the market, so how do you figure out which one will rise? The logic of “a falling coin is cheap, I’ll buy it” is one of the biggest mistakes that makes people lose the most money in crypto. Today, we’re going to show you **
#bitcoin #ethereum #crypto
Rank: #118
There are hundreds of altcoins in the market, so how do you figure out which one will rise? The logic of “a falling coin is cheap, I’ll buy it” is one of the biggest mistakes that makes people lose the most money in crypto. Today, we’re going to show you **
#bitcoin #ethereum #crypto
13
·
--
Crypto Market UpdatePons (PONSUSDT) is trending right now!
Rank: #118
**DESPITE BITCOIN'S $7,000 SPIKE, I HAVE 3 REASONS NOT TO BUY** Last night, the price broke above the $7,000 level, but I’m still being cautious. In a period when everyone in the market is enthusiastic, why do some traders like me still approach this rally with skepticism? Today, I’ll explain why I haven’t made a buy yet, even though the Bitcoin price is at these levels. First of all, the **24-hour trading volume of '** has shown a significant decline in recent days.** Trading volume dropping below $30 billion suggests that market participants’ activity has decreased. This is something you usually see when a trend is about to reverse. Therefore, even if '’s price is high, the market’s real momentum looks questionable. Second, I’m also concerned about **Ethereum’s () weakness**. When the price drops below the ,400 level, this often serves as a barometer for the altcoin market and may signal a broader correction across the crypto market. '’s weakness is warning that ' may also experience a longer-term correction. Third, **technical indicators** still aren’t fully convincing. The Relative Strength Index (RSI) is still in a neutral zone, and the MACD indicator is not giving a clear bullish signal yet. These technical data suggest that the market hasn’t yet reached an overbought area, meaning there’s still potential for a correction. So, si
Crypto Market Update
Pons (PONSUSDT) is trending right now!
Rank: #118
**DESPITE BITCOIN'S $7,000 SPIKE, I HAVE 3 REASONS NOT TO BUY** Last night, the price broke above the $7,000 level, but I’m still being cautious. In a period when everyone in the market is enthusiastic, why do some traders like me still approach this rally with skepticism? Today, I’ll explain why I haven’t made a buy yet, even though the Bitcoin price is at these levels. First of all, the **24-hour trading volume of '** has shown a significant decline in recent days.** Trading volume dropping below $30 billion suggests that market participants’ activity has decreased. This is something you usually see when a trend is about to reverse. Therefore, even if '’s price is high, the market’s real momentum looks questionable. Second, I’m also concerned about **Ethereum’s () weakness**. When the price drops below the ,400 level, this often serves as a barometer for the altcoin market and may signal a broader correction across the crypto market. '’s weakness is warning that ' may also experience a longer-term correction. Third, **technical indicators** still aren’t fully convincing. The Relative Strength Index (RSI) is still in a neutral zone, and the MACD indicator is not giving a clear bullish signal yet. These technical data suggest that the market hasn’t yet reached an overbought area, meaning there’s still potential for a correction. So, si
Rank: #118
**DESPITE BITCOIN'S $7,000 SPIKE, I HAVE 3 REASONS NOT TO BUY** Last night, the price broke above the $7,000 level, but I’m still being cautious. In a period when everyone in the market is enthusiastic, why do some traders like me still approach this rally with skepticism? Today, I’ll explain why I haven’t made a buy yet, even though the Bitcoin price is at these levels. First of all, the **24-hour trading volume of '** has shown a significant decline in recent days.** Trading volume dropping below $30 billion suggests that market participants’ activity has decreased. This is something you usually see when a trend is about to reverse. Therefore, even if '’s price is high, the market’s real momentum looks questionable. Second, I’m also concerned about **Ethereum’s () weakness**. When the price drops below the ,400 level, this often serves as a barometer for the altcoin market and may signal a broader correction across the crypto market. '’s weakness is warning that ' may also experience a longer-term correction. Third, **technical indicators** still aren’t fully convincing. The Relative Strength Index (RSI) is still in a neutral zone, and the MACD indicator is not giving a clear bullish signal yet. These technical data suggest that the market hasn’t yet reached an overbought area, meaning there’s still potential for a correction. So, si
·
--
** UNI’s 11.67% crash—why we might be able to expect a “pump” this fast?Pons (PONSUSDT) is trending right now!
Rank: #118
** UNIUSDT in the past 24 hours fell by 11.670 and hit the .904 level. 📉 While most traders switch to a “dump = buy” mindset, I see an **alpha call** forming at this dip. With $65M in 24‑hour volume, this movement doesn’t look like mere panic selling—real buyers are still coming in. **Why is this so important?** - **Weighted avg price** is .203, meaning price is still about 5.2% below the average level. - The **open‑high‑low** range is 5.806–6.730—this is a **range‑bounce** opportunity. - The **bid‑ask spread** is only /bin/sh.001, indicating high liquidity depth; the risk of “slippage” is low for a big **ape‑in**. These data suggest that major pairs like **** and **** are currently stable (both are fluctuating under 0.2%). The current “risk‑off” wave in large markets makes **DCA** (Dollar‑Cost‑Averaging) strategies more appealing in altcoins. Many people view UNI as a “profitable dip,” but I believe **Layer‑2** integrations and the new Uniswap v4 roadmap could set the stage for the price to moon again. **Counterpoint:** There are those saying, “UNI has been sold too much—it will fall more.” Yes, the price is down 11.6%, but **volume** of $65M has formed a “buy‑wall.” That suggests big whales are scooping up lower prices and accumulating positions for the next **pump**. If **** drops to 5.50, it could be reasonable to open positions with a **30‑day DCA** plan. **Educational corner:** - To avoid **pump‑and‑dump** traps
** UNI’s 11.67% crash—why we might be able to expect a “pump” this fast?
Pons (PONSUSDT) is trending right now!
Rank: #118
** UNIUSDT in the past 24 hours fell by 11.670 and hit the .904 level. 📉 While most traders switch to a “dump = buy” mindset, I see an **alpha call** forming at this dip. With $65M in 24‑hour volume, this movement doesn’t look like mere panic selling—real buyers are still coming in. **Why is this so important?** - **Weighted avg price** is .203, meaning price is still about 5.2% below the average level. - The **open‑high‑low** range is 5.806–6.730—this is a **range‑bounce** opportunity. - The **bid‑ask spread** is only /bin/sh.001, indicating high liquidity depth; the risk of “slippage” is low for a big **ape‑in**. These data suggest that major pairs like **** and **** are currently stable (both are fluctuating under 0.2%). The current “risk‑off” wave in large markets makes **DCA** (Dollar‑Cost‑Averaging) strategies more appealing in altcoins. Many people view UNI as a “profitable dip,” but I believe **Layer‑2** integrations and the new Uniswap v4 roadmap could set the stage for the price to moon again. **Counterpoint:** There are those saying, “UNI has been sold too much—it will fall more.” Yes, the price is down 11.6%, but **volume** of $65M has formed a “buy‑wall.” That suggests big whales are scooping up lower prices and accumulating positions for the next **pump**. If **** drops to 5.50, it could be reasonable to open positions with a **30‑day DCA** plan. **Educational corner:** - To avoid **pump‑and‑dump** traps
Rank: #118
** UNIUSDT in the past 24 hours fell by 11.670 and hit the .904 level. 📉 While most traders switch to a “dump = buy” mindset, I see an **alpha call** forming at this dip. With $65M in 24‑hour volume, this movement doesn’t look like mere panic selling—real buyers are still coming in. **Why is this so important?** - **Weighted avg price** is .203, meaning price is still about 5.2% below the average level. - The **open‑high‑low** range is 5.806–6.730—this is a **range‑bounce** opportunity. - The **bid‑ask spread** is only /bin/sh.001, indicating high liquidity depth; the risk of “slippage” is low for a big **ape‑in**. These data suggest that major pairs like **** and **** are currently stable (both are fluctuating under 0.2%). The current “risk‑off” wave in large markets makes **DCA** (Dollar‑Cost‑Averaging) strategies more appealing in altcoins. Many people view UNI as a “profitable dip,” but I believe **Layer‑2** integrations and the new Uniswap v4 roadmap could set the stage for the price to moon again. **Counterpoint:** There are those saying, “UNI has been sold too much—it will fall more.” Yes, the price is down 11.6%, but **volume** of $65M has formed a “buy‑wall.” That suggests big whales are scooping up lower prices and accumulating positions for the next **pump**. If **** drops to 5.50, it could be reasonable to open positions with a **30‑day DCA** plan. **Educational corner:** - To avoid **pump‑and‑dump** traps
238
·
--
** How to Create a Daily Trade Plan on Binance Square and Maximize Your Profit? 📈🎯Pons (PONSUSDT) is trending right now!
Rank: #118
** ### 1️⃣ Market Scanning – “Finding Books in the Library” **Why is it important?** Knowing the assets that move the most during the day helps you not miss opportunities. **Step:** Open Binance Square’s “Top Movers” list. As of 2026‑09‑17, the biggest gainers: | Symbol | Price (USDT) | 24h % Change | Volume (USDT) | |--------|--------------|--------------|--------------| | | 2.631 | **+12.39 %** | 86 459 539 | | | 1.032 | **+9.55 %** | 10 707 431 | | | 6.660 | **+4.95 %** | 62 208 520 | | | 7.548 | **+3.98 %** | 19 143 431 | | | 98.850| **+1.94 %** | 227 563 946 | 🔎 **Practical Tip:** - **Filter:** Select those with Volume > 50 M USDT and % Change > 5%. - **Save:** Add these 5 coins to your “Watch List” (the “Watchlist” button on Binance Square). ### 2️⃣ Trend Analysis – “Learning Where the Wind Blows” **Why is it important?** The direction of the trend determines your trade timing. **Step:** Examine each watchlist coin on 4-hour (4H) and daily (1D) charts. | Coin | 4H Trend | 1D Trend | Visual Hint | |------|----------|----------|--------------| | | Upward “Bullish Flag” | Upward-broken “Ascending Triangle” | 📊 Flag + Triangle | | | Upward “Ascending Channel” | Upward “Higher Highs” | 📊 Channel | | | Consolidation “Symmetrical Triangle” | Mid-level “Flat” | 📊 Triangle | | | Short-term “Cup & Handle” | Upward “Rising Wedge” | 📊 Cup | | |
** How to Create a Daily Trade Plan on Binance Square and Maximize Your Profit? 📈🎯
Pons (PONSUSDT) is trending right now!
Rank: #118
** ### 1️⃣ Market Scanning – “Finding Books in the Library” **Why is it important?** Knowing the assets that move the most during the day helps you not miss opportunities. **Step:** Open Binance Square’s “Top Movers” list. As of 2026‑09‑17, the biggest gainers: | Symbol | Price (USDT) | 24h % Change | Volume (USDT) | |--------|--------------|--------------|--------------| | | 2.631 | **+12.39 %** | 86 459 539 | | | 1.032 | **+9.55 %** | 10 707 431 | | | 6.660 | **+4.95 %** | 62 208 520 | | | 7.548 | **+3.98 %** | 19 143 431 | | | 98.850| **+1.94 %** | 227 563 946 | 🔎 **Practical Tip:** - **Filter:** Select those with Volume > 50 M USDT and % Change > 5%. - **Save:** Add these 5 coins to your “Watch List” (the “Watchlist” button on Binance Square). ### 2️⃣ Trend Analysis – “Learning Where the Wind Blows” **Why is it important?** The direction of the trend determines your trade timing. **Step:** Examine each watchlist coin on 4-hour (4H) and daily (1D) charts. | Coin | 4H Trend | 1D Trend | Visual Hint | |------|----------|----------|--------------| | | Upward “Bullish Flag” | Upward-broken “Ascending Triangle” | 📊 Flag + Triangle | | | Upward “Ascending Channel” | Upward “Higher Highs” | 📊 Channel | | | Consolidation “Symmetrical Triangle” | Mid-level “Flat” | 📊 Triangle | | | Short-term “Cup & Handle” | Upward “Rising Wedge” | 📊 Cup | | |
Rank: #118
** ### 1️⃣ Market Scanning – “Finding Books in the Library” **Why is it important?** Knowing the assets that move the most during the day helps you not miss opportunities. **Step:** Open Binance Square’s “Top Movers” list. As of 2026‑09‑17, the biggest gainers: | Symbol | Price (USDT) | 24h % Change | Volume (USDT) | |--------|--------------|--------------|--------------| | | 2.631 | **+12.39 %** | 86 459 539 | | | 1.032 | **+9.55 %** | 10 707 431 | | | 6.660 | **+4.95 %** | 62 208 520 | | | 7.548 | **+3.98 %** | 19 143 431 | | | 98.850| **+1.94 %** | 227 563 946 | 🔎 **Practical Tip:** - **Filter:** Select those with Volume > 50 M USDT and % Change > 5%. - **Save:** Add these 5 coins to your “Watch List” (the “Watchlist” button on Binance Square). ### 2️⃣ Trend Analysis – “Learning Where the Wind Blows” **Why is it important?** The direction of the trend determines your trade timing. **Step:** Examine each watchlist coin on 4-hour (4H) and daily (1D) charts. | Coin | 4H Trend | 1D Trend | Visual Hint | |------|----------|----------|--------------| | | Upward “Bullish Flag” | Upward-broken “Ascending Triangle” | 📊 Flag + Triangle | | | Upward “Ascending Channel” | Upward “Higher Highs” | 📊 Channel | | | Consolidation “Symmetrical Triangle” | Mid-level “Flat” | 📊 Triangle | | | Short-term “Cup & Handle” | Upward “Rising Wedge” | 📊 Cup | | |
208
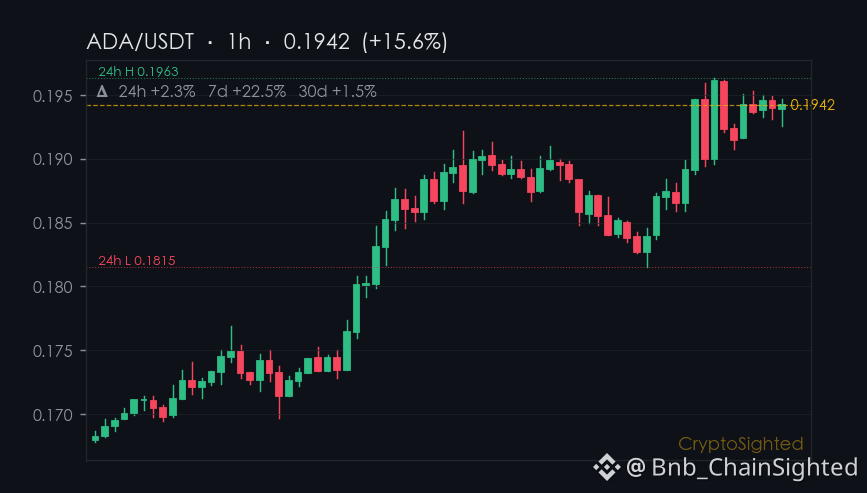
2.3% - that’s the 24-hour jump $ADA just made, and it’s sitting oddly beside its 204 million volume - a number that feels light for such a move.
Meanwhile, $DOGE is down ↓0.96% with a much larger 332 million volume.
That contrast raises a question: why does liquidity seem to flow against price trends?
What’s more telling is how ADA’s price action lines up with its longer-term movement.
Over the past 7 days, it’s gained ↑22.9%, a sharp rise that’s far ahead of its 30-day ↑0.9% gain.
That divergence between the 7-day and 30-day trends suggests something is shifting - but not necessarily in a way that’s reflected in the current volume.
It’s like the asset is moving higher on its own, without the crowd yet catching up.
—
Not financial advice. DYOR.
📌 Funding Pulse · #118 · #FundingRate #CryptoSighted $ADA
2.3% - that’s the 24-hour jump $ADA just made, and it’s sitting oddly beside its 204 million volume - a number that feels light for such a move.
Meanwhile, $DOGE is down ↓0.96% with a much larger 332 million volume.
That contrast raises a question: why does liquidity seem to flow against price trends?
What’s more telling is how ADA’s price action lines up with its longer-term movement.
Over the past 7 days, it’s gained ↑22.9%, a sharp rise that’s far ahead of its 30-day ↑0.9% gain.
That divergence between the 7-day and 30-day trends suggests something is shifting - but not necessarily in a way that’s reflected in the current volume.
It’s like the asset is moving higher on its own, without the crowd yet catching up.
—
Not financial advice. DYOR.
📌 Funding Pulse · #118 · #FundingRate #CryptoSighted $ADA
Meanwhile, $DOGE is down ↓0.96% with a much larger 332 million volume.
That contrast raises a question: why does liquidity seem to flow against price trends?
What’s more telling is how ADA’s price action lines up with its longer-term movement.
Over the past 7 days, it’s gained ↑22.9%, a sharp rise that’s far ahead of its 30-day ↑0.9% gain.
That divergence between the 7-day and 30-day trends suggests something is shifting - but not necessarily in a way that’s reflected in the current volume.
It’s like the asset is moving higher on its own, without the crowd yet catching up.
—
Not financial advice. DYOR.
📌 Funding Pulse · #118 · #FundingRate #CryptoSighted $ADA
264

·
--
$KAITO Late-night spike in volume—this isn’t retail-driven.
00:00-00:28 Impulsive surge +20%, $13.3M in turnover with no discount—straight up扫 (swept) orders. Open $1.1179 → Now $1.3424, no hanging orders the whole way, no messing around. For an MC $325M project with CG rank #118 , this kind of late-night buying style looks more like institutions/smart money抢货 (snatching), not retail FOMO.
Longs and shorts aren’t really arguing whether it will go up or not right now—they’re fighting over what this capital actually is: a strategic initial position, or a market maker’s night-time liquidity buyback?
Watch $1.28. If it pulls back to this level and volume contracts with stabilization, this rally has staying power; if it breaks down on increased volume, then that last candle was a timed distribution—whoever chases is the one catching the falling knife.
That late-night $13M pulse sweep of orders—do you think it’s institutions accumulating, or a market maker drawing the line? Drop a comment in the section below to chat.
#暗影萨满 #KAITO #Trading Signal
$KAITO Late-night spike in volume—this isn’t retail-driven.
00:00-00:28 Impulsive surge +20%, $13.3M in turnover with no discount—straight up扫 (swept) orders. Open $1.1179 → Now $1.3424, no hanging orders the whole way, no messing around. For an MC $325M project with CG rank #118 , this kind of late-night buying style looks more like institutions/smart money抢货 (snatching), not retail FOMO.
Longs and shorts aren’t really arguing whether it will go up or not right now—they’re fighting over what this capital actually is: a strategic initial position, or a market maker’s night-time liquidity buyback?
Watch $1.28. If it pulls back to this level and volume contracts with stabilization, this rally has staying power; if it breaks down on increased volume, then that last candle was a timed distribution—whoever chases is the one catching the falling knife.
That late-night $13M pulse sweep of orders—do you think it’s institutions accumulating, or a market maker drawing the line? Drop a comment in the section below to chat.
#暗影萨满 #KAITO #Trading Signal
00:00-00:28 Impulsive surge +20%, $13.3M in turnover with no discount—straight up扫 (swept) orders. Open $1.1179 → Now $1.3424, no hanging orders the whole way, no messing around. For an MC $325M project with CG rank #118 , this kind of late-night buying style looks more like institutions/smart money抢货 (snatching), not retail FOMO.
Longs and shorts aren’t really arguing whether it will go up or not right now—they’re fighting over what this capital actually is: a strategic initial position, or a market maker’s night-time liquidity buyback?
Watch $1.28. If it pulls back to this level and volume contracts with stabilization, this rally has staying power; if it breaks down on increased volume, then that last candle was a timed distribution—whoever chases is the one catching the falling knife.
That late-night $13M pulse sweep of orders—do you think it’s institutions accumulating, or a market maker drawing the line? Drop a comment in the section below to chat.
#暗影萨满 #KAITO #Trading Signal
59
·
--
Pons (PONS) just jumped over 15% in 24 hours, hitting $0.50 and pushing its market cap near $355 million!
If you’re new to crypto, this kind of move often happens when trading volume spikes — currently over $136 million — signaling heavy interest from buyers. Ranked #118 globally, PONS is showing strong momentum compared to major assets like Bitcoin and Ethereum. But remember, green candles don’t last forever. Volatility cuts both ways, so never invest more than you can afford to lose. Always check the project’s fundamentals: what problem does it solve? Who is the team? Is the community active? Price action is exciting, but research builds wealth.
Stay curious, stay safe, and keep learning the ropes.
#PONS #CryptoEducation
What’s your rule for taking profits when a token pumps this fast?
Pons (PONS) just jumped over 15% in 24 hours, hitting $0.50 and pushing its market cap near $355 million!
If you’re new to crypto, this kind of move often happens when trading volume spikes — currently over $136 million — signaling heavy interest from buyers. Ranked #118 globally, PONS is showing strong momentum compared to major assets like Bitcoin and Ethereum. But remember, green candles don’t last forever. Volatility cuts both ways, so never invest more than you can afford to lose. Always check the project’s fundamentals: what problem does it solve? Who is the team? Is the community active? Price action is exciting, but research builds wealth.
Stay curious, stay safe, and keep learning the ropes.
#PONS #CryptoEducation
What’s your rule for taking profits when a token pumps this fast?
If you’re new to crypto, this kind of move often happens when trading volume spikes — currently over $136 million — signaling heavy interest from buyers. Ranked #118 globally, PONS is showing strong momentum compared to major assets like Bitcoin and Ethereum. But remember, green candles don’t last forever. Volatility cuts both ways, so never invest more than you can afford to lose. Always check the project’s fundamentals: what problem does it solve? Who is the team? Is the community active? Price action is exciting, but research builds wealth.
Stay curious, stay safe, and keep learning the ropes.
#PONS #CryptoEducation
What’s your rule for taking profits when a token pumps this fast?
83
·
--
Pons (PONSUSDT) is trending on CoinGecko!
Rank: #118
**
The crypto market is showing signs of strength today, with Bitcoin (BTC) and Ethereum (ETH) both posting positive momentum in the last 24 hours. According to the latest data from CoinGecko, Bitcoin is trading at **8,748**, up **0.74%** in the past day, while Ethereum has climbed **1.38%** to **,473.95**. Both assets are demonstrating resilience amid broader market movements, hinting at potential opportunities for traders and investors alike.
Bitcoin, the leading cryptocurrency, has maintained a strong position above the **8K** mark, with a **24-hour trading volume** of nearly **9 billion**. This suggests sustained institutional and retail interest. Meanwhile, Ethereum, the second-largest cryptocurrency by market cap, is also seeing increased activity, with a **24-hour volume** of over **1 billion**. The outperformance of ETH relative to BTC could indicate growing anticipation around Ethereum-based developments, such as staking rewards, DeFi activity, or potential ETF approvals.
What’s driving this upward trend? Several factors could be at play:
1. **Market Sentiment:** Positive macroeconomic signals, such as easing inflation concerns or favorable regulatory developments, may be boosting investor confidence.
2. **Institutional Activity:** Continued inflows into Bitcoin and Ethereum ETFs could be providing steady demand.
3. **Technical Breakouts:** Bitcoin has been consolidating near key resistance levels, and a sustained breakout could trigger further upside m
Pons (PONSUSDT) is trending on CoinGecko!
Rank: #118
**
The crypto market is showing signs of strength today, with Bitcoin (BTC) and Ethereum (ETH) both posting positive momentum in the last 24 hours. According to the latest data from CoinGecko, Bitcoin is trading at **8,748**, up **0.74%** in the past day, while Ethereum has climbed **1.38%** to **,473.95**. Both assets are demonstrating resilience amid broader market movements, hinting at potential opportunities for traders and investors alike.
Bitcoin, the leading cryptocurrency, has maintained a strong position above the **8K** mark, with a **24-hour trading volume** of nearly **9 billion**. This suggests sustained institutional and retail interest. Meanwhile, Ethereum, the second-largest cryptocurrency by market cap, is also seeing increased activity, with a **24-hour volume** of over **1 billion**. The outperformance of ETH relative to BTC could indicate growing anticipation around Ethereum-based developments, such as staking rewards, DeFi activity, or potential ETF approvals.
What’s driving this upward trend? Several factors could be at play:
1. **Market Sentiment:** Positive macroeconomic signals, such as easing inflation concerns or favorable regulatory developments, may be boosting investor confidence.
2. **Institutional Activity:** Continued inflows into Bitcoin and Ethereum ETFs could be providing steady demand.
3. **Technical Breakouts:** Bitcoin has been consolidating near key resistance levels, and a sustained breakout could trigger further upside m
Rank: #118
**
The crypto market is showing signs of strength today, with Bitcoin (BTC) and Ethereum (ETH) both posting positive momentum in the last 24 hours. According to the latest data from CoinGecko, Bitcoin is trading at **8,748**, up **0.74%** in the past day, while Ethereum has climbed **1.38%** to **,473.95**. Both assets are demonstrating resilience amid broader market movements, hinting at potential opportunities for traders and investors alike.
Bitcoin, the leading cryptocurrency, has maintained a strong position above the **8K** mark, with a **24-hour trading volume** of nearly **9 billion**. This suggests sustained institutional and retail interest. Meanwhile, Ethereum, the second-largest cryptocurrency by market cap, is also seeing increased activity, with a **24-hour volume** of over **1 billion**. The outperformance of ETH relative to BTC could indicate growing anticipation around Ethereum-based developments, such as staking rewards, DeFi activity, or potential ETF approvals.
What’s driving this upward trend? Several factors could be at play:
1. **Market Sentiment:** Positive macroeconomic signals, such as easing inflation concerns or favorable regulatory developments, may be boosting investor confidence.
2. **Institutional Activity:** Continued inflows into Bitcoin and Ethereum ETFs could be providing steady demand.
3. **Technical Breakouts:** Bitcoin has been consolidating near key resistance levels, and a sustained breakout could trigger further upside m
4
Log in to explore more content
Join global crypto users on Binance Square
⚡️ Get latest and useful information about crypto.
💬 Trusted by the world’s largest crypto exchange.
👍 Discover real insights from verified creators.
Email / Phone number
Trending Topics
1
#HotCPIDecemberHikePriced
50,149 views
811 Discussing
2
#AnthropicRejectsIPODelayValuationinQuestion
184,956 views
1,626 Discussing
3
#NvidiaInvestigatesAfterHuang’sAffairApology
460,295 views
3,081 Discussing
4
#CanNvidiaEarningsEaseMarketConcerns?
24,752 views
437 Discussing
5
#ADPWeeklyEstimateShowsUSPrivatePayrollsUp19750
10,392 views
219 Discussing
6
#US-IranTalksFuelStrongStockMarketRebound
109,710 views
572 Discussing
7
#BitcoinFiveWeeklyLosses
475,692 views
3,220 Discussing
8
#AIChipSlumpNasdaq
259,852 views
1,806 Discussing
9
#BitcoinSpotETFsPost$201MNetOutflowForThirdStraightDay
1,741 views
30 Discussing
10
#CryptoLiquidationsReach$1.16BIn24Hours
66,842 views
84 Discussing