
#140
140
3,361 views
21 Discussing
Hot
Latest

·
--
The biggest misread is treating $CARDS as “a small coin that just started trending.” It’s only 9.54% below its ATH, currently around $0.345, and has already gained 108% over the past 30 days. This isn’t a coin just lifting off the bottom; it’s nearing its previous high and being repriced.
The key isn’t the 24-hour gain of +14.28%, but the trading volume. Thirty days ago, daily volume was just over $4 million; yesterday it reached $34.69 million, and today the price has returned to around the high-volume peak from October 16. In between, from October 17 to 19, the price fell from $0.35 back to $0.257 as volume tapered off, suggesting the tokens were still changing hands—not that the price had surged one-way with no buyers left. The real question is whether this asset, with a $310 million market cap and a ranking of #140 , can sustain average daily trading volume above $30 million. If it can’t, this rally looks more like a liquidity-driven spike.
Bulls should watch whether $0.33 can turn from resistance into support. Bears should watch the same level: if the price breaks below it on heavy volume, being close to the ATH stops being a sign of strength and becomes evidence that longs are crowded. Don’t argue about direction; watch the same number first—the volume on the next retest.
The biggest misread is treating $CARDS as “a small coin that just started trending.” It’s only 9.54% below its ATH, currently around $0.345, and has already gained 108% over the past 30 days. This isn’t a coin just lifting off the bottom; it’s nearing its previous high and being repriced.
The key isn’t the 24-hour gain of +14.28%, but the trading volume. Thirty days ago, daily volume was just over $4 million; yesterday it reached $34.69 million, and today the price has returned to around the high-volume peak from October 16. In between, from October 17 to 19, the price fell from $0.35 back to $0.257 as volume tapered off, suggesting the tokens were still changing hands—not that the price had surged one-way with no buyers left. The real question is whether this asset, with a $310 million market cap and a ranking of #140 , can sustain average daily trading volume above $30 million. If it can’t, this rally looks more like a liquidity-driven spike.
Bulls should watch whether $0.33 can turn from resistance into support. Bears should watch the same level: if the price breaks below it on heavy volume, being close to the ATH stops being a sign of strength and becomes evidence that longs are crowded. Don’t argue about direction; watch the same number first—the volume on the next retest.
The key isn’t the 24-hour gain of +14.28%, but the trading volume. Thirty days ago, daily volume was just over $4 million; yesterday it reached $34.69 million, and today the price has returned to around the high-volume peak from October 16. In between, from October 17 to 19, the price fell from $0.35 back to $0.257 as volume tapered off, suggesting the tokens were still changing hands—not that the price had surged one-way with no buyers left. The real question is whether this asset, with a $310 million market cap and a ranking of #140 , can sustain average daily trading volume above $30 million. If it can’t, this rally looks more like a liquidity-driven spike.
Bulls should watch whether $0.33 can turn from resistance into support. Bears should watch the same level: if the price breaks below it on heavy volume, being close to the ATH stops being a sign of strength and becomes evidence that longs are crowded. Don’t argue about direction; watch the same number first—the volume on the next retest.

·
--
TRUTH plunges 7.9%! Support levels to watch in this batchAt 14:57 (6 minutes ago), TRUTH fell 7.9% within 5 minutes (5-minute window 14:52→14:57). As of 15:04:42, the current price is 0.01715, down 18.4% over 24h. Other tokens moving sharply during the same period include SOPH and ZK.
📅 Data as of 15:04:42 (event trigger times are noted in each item; prices are real-time snapshots taken at the time of writing)
📌 In a nutshell: Short-term momentum is concentrated, and pullbacks can come quickly—placing staggered limit orders is safer than chasing highs
Market overview: BTC 80,855.20(-3.02%) · ETH 2,357.25(-5.90%); across the market, 23 assets rose / 470 fell in 24h; top 24h gainer: ZEREBRO +47.26%, top loser: Lobster -35.69%.
TRUTH plunges 7.9%! Support levels to watch in this batch
At 14:57 (6 minutes ago), TRUTH fell 7.9% within 5 minutes (5-minute window 14:52→14:57). As of 15:04:42, the current price is 0.01715, down 18.4% over 24h. Other tokens moving sharply during the same period include SOPH and ZK.
📅 Data as of 15:04:42 (event trigger times are noted in each item; prices are real-time snapshots taken at the time of writing)
📌 In a nutshell: Short-term momentum is concentrated, and pullbacks can come quickly—placing staggered limit orders is safer than chasing highs
Market overview: BTC 80,855.20(-3.02%) · ETH 2,357.25(-5.90%); across the market, 23 assets rose / 470 fell in 24h; top 24h gainer: ZEREBRO +47.26%, top loser: Lobster -35.69%.
📅 Data as of 15:04:42 (event trigger times are noted in each item; prices are real-time snapshots taken at the time of writing)
📌 In a nutshell: Short-term momentum is concentrated, and pullbacks can come quickly—placing staggered limit orders is safer than chasing highs
Market overview: BTC 80,855.20(-3.02%) · ETH 2,357.25(-5.90%); across the market, 23 assets rose / 470 fell in 24h; top 24h gainer: ZEREBRO +47.26%, top loser: Lobster -35.69%.
5
·
--
KMNO suddenly plunges 1.5% at a key time! Panic or opportunity? Key support levels to watchAt 13:21 (27 minutes ago), KMNO dropped 1.5% at a key time (5-minute window: 13:16→13:21). As of 13:49:16, the current price is 0.03765, up 4.5% in 24h. Other assets with unusual moves in the same batch include CYBER and CFG.
📅 Data as of 13:49:16 (event trigger times are noted in each item; prices are real-time snapshots taken at the time of writing)
📌 In a nutshell: Unusual moves at key times (such as candlestick closes and the U.S. market open/close) often involve institutional participants, making them more reliable signals
Market overview: BTC 83,937.10(+1.11%) · ETH 2,561.94(+2.33%); across the market, 333 assets rose and 157 fell in 24h; top gainer: W +61.90%, top loser: US -35.52%.
KMNO suddenly plunges 1.5% at a key time! Panic or opportunity? Key support levels to watch
At 13:21 (27 minutes ago), KMNO dropped 1.5% at a key time (5-minute window: 13:16→13:21). As of 13:49:16, the current price is 0.03765, up 4.5% in 24h. Other assets with unusual moves in the same batch include CYBER and CFG.
📅 Data as of 13:49:16 (event trigger times are noted in each item; prices are real-time snapshots taken at the time of writing)
📌 In a nutshell: Unusual moves at key times (such as candlestick closes and the U.S. market open/close) often involve institutional participants, making them more reliable signals
Market overview: BTC 83,937.10(+1.11%) · ETH 2,561.94(+2.33%); across the market, 333 assets rose and 157 fell in 24h; top gainer: W +61.90%, top loser: US -35.52%.
📅 Data as of 13:49:16 (event trigger times are noted in each item; prices are real-time snapshots taken at the time of writing)
📌 In a nutshell: Unusual moves at key times (such as candlestick closes and the U.S. market open/close) often involve institutional participants, making them more reliable signals
Market overview: BTC 83,937.10(+1.11%) · ETH 2,561.94(+2.33%); across the market, 333 assets rose and 157 fell in 24h; top gainer: W +61.90%, top loser: US -35.52%.
11

·
--
$BEAT The past 24 hours saw a rise of +24.72%, currently trading at 1.1969 USDT, close to the 24h high.
📈 Price Performance: 24h range 0.9492 / 1.202, with an amplitude of about 26.63%; lower bound 0.9492 (20.70% below current price) / midline 1.0756 (10.13% below current price) / upper bound 1.202 (0.43% above current price), currently closer to the upper bound; about 0.43% away from the 24h high.
📊 Data Insights: Trading volume is approximately 86.73M USDT; current open interest (OI) is around 24.26M BEAT; large holders are positioned 64.34% long / 35.66% short, long/short ratio is 1.80; nominal size based on the latest price is about 29.04M USDT; current funding rate is +0.0213% (cost fluctuations before and after settlement need tracking), next settlement around 12:00 UTC.
🔎 Contract Details: Contract underlying $BEAT; trading pair BEAT/USDT; public market name Audiera; exchange category: Alpha; live for about 196 days; market cap rank #140; market cap approximately 314.99M USD; spot 24h trading volume around 22.22M USD.
⚠️ Technical Analysis: For this data set, first look at the upper bound 1.202, then consider that we are about 0.43% from the 24h high, keep an eye on high-level trades and profit-taking pressure.
Data Source: Binance Futures public market data + CoinGecko.
Which item from this data set do you want to continue tracking the most? #BEAT #Perpetual Contract
$BEAT The past 24 hours saw a rise of +24.72%, currently trading at 1.1969 USDT, close to the 24h high.
📈 Price Performance: 24h range 0.9492 / 1.202, with an amplitude of about 26.63%; lower bound 0.9492 (20.70% below current price) / midline 1.0756 (10.13% below current price) / upper bound 1.202 (0.43% above current price), currently closer to the upper bound; about 0.43% away from the 24h high.
📊 Data Insights: Trading volume is approximately 86.73M USDT; current open interest (OI) is around 24.26M BEAT; large holders are positioned 64.34% long / 35.66% short, long/short ratio is 1.80; nominal size based on the latest price is about 29.04M USDT; current funding rate is +0.0213% (cost fluctuations before and after settlement need tracking), next settlement around 12:00 UTC.
🔎 Contract Details: Contract underlying $BEAT ; trading pair BEAT/USDT; public market name Audiera; exchange category: Alpha; live for about 196 days; market cap rank #140; market cap approximately 314.99M USD; spot 24h trading volume around 22.22M USD.
⚠️ Technical Analysis: For this data set, first look at the upper bound 1.202, then consider that we are about 0.43% from the 24h high, keep an eye on high-level trades and profit-taking pressure.
Data Source: Binance Futures public market data + CoinGecko.
Which item from this data set do you want to continue tracking the most? #BEAT #Perpetual Contract
📈 Price Performance: 24h range 0.9492 / 1.202, with an amplitude of about 26.63%; lower bound 0.9492 (20.70% below current price) / midline 1.0756 (10.13% below current price) / upper bound 1.202 (0.43% above current price), currently closer to the upper bound; about 0.43% away from the 24h high.
📊 Data Insights: Trading volume is approximately 86.73M USDT; current open interest (OI) is around 24.26M BEAT; large holders are positioned 64.34% long / 35.66% short, long/short ratio is 1.80; nominal size based on the latest price is about 29.04M USDT; current funding rate is +0.0213% (cost fluctuations before and after settlement need tracking), next settlement around 12:00 UTC.
🔎 Contract Details: Contract underlying $BEAT ; trading pair BEAT/USDT; public market name Audiera; exchange category: Alpha; live for about 196 days; market cap rank #140; market cap approximately 314.99M USD; spot 24h trading volume around 22.22M USD.
⚠️ Technical Analysis: For this data set, first look at the upper bound 1.202, then consider that we are about 0.43% from the 24h high, keep an eye on high-level trades and profit-taking pressure.
Data Source: Binance Futures public market data + CoinGecko.
Which item from this data set do you want to continue tracking the most? #BEAT #Perpetual Contract
4


·
--
I've been tracking trending tokens on CoinGecko.
I'm seeing tokens like Hyperliquid (HYPE) and Pudgy Penguins (PENGU) with notable market cap ranks.
I think these tokens are worth watching, so I'm keeping an eye on them 📈, with HYPE at #10 and PENGU at #118, along with others like Ethena (ENA) at #84 and TAC (TAC) at #140 💡.
I've also noticed United States Water Reserve (USWR) and The Black Bull (ANSEM) with lower ranks, but still trending 🚀.
$RE, $AIGENSYN, $TAC
I've been tracking trending tokens on CoinGecko.
I'm seeing tokens like Hyperliquid (HYPE) and Pudgy Penguins (PENGU) with notable market cap ranks.
I think these tokens are worth watching, so I'm keeping an eye on them 📈, with HYPE at #10 and PENGU at #118, along with others like Ethena (ENA) at #84 and TAC (TAC) at #140 💡.
I've also noticed United States Water Reserve (USWR) and The Black Bull (ANSEM) with lower ranks, but still trending 🚀.
$RE , $AIGENSYN , $TAC
I'm seeing tokens like Hyperliquid (HYPE) and Pudgy Penguins (PENGU) with notable market cap ranks.
I think these tokens are worth watching, so I'm keeping an eye on them 📈, with HYPE at #10 and PENGU at #118, along with others like Ethena (ENA) at #84 and TAC (TAC) at #140 💡.
I've also noticed United States Water Reserve (USWR) and The Black Bull (ANSEM) with lower ranks, but still trending 🚀.
$RE , $AIGENSYN , $TAC
1
281
·
--
XAI suddenly plunges 2.0% at a key time! Panic or opportunity? Key support levels at a glance13:04 (19 minutes ago): XAI dropped 2.0% at a key time (5-minute window 12:59→13:04). As of 13:23:55, the current price is 0.01005, up 14.2% over 24h. BAT and CHR also made notable moves around the same time.
📅 Data as of 13:23:55 (event trigger times are noted for each item; prices are live snapshots at the time of writing)
📌 In a nutshell: Notable moves during key periods (K-line closes / U.S. market open and close) often involve institutional participation, making the signals more credible
Market overview: BTC 82,645.00(+0.29%) · ETH 2,493.50(+0.07%); across the market, 385 gainers / 106 losers in 24h; top gainer: MAGIC +130.03%; top loser: OGN -17.02%.
XAI suddenly plunges 2.0% at a key time! Panic or opportunity? Key support levels at a glance
13:04 (19 minutes ago): XAI dropped 2.0% at a key time (5-minute window 12:59→13:04). As of 13:23:55, the current price is 0.01005, up 14.2% over 24h. BAT and CHR also made notable moves around the same time.
📅 Data as of 13:23:55 (event trigger times are noted for each item; prices are live snapshots at the time of writing)
📌 In a nutshell: Notable moves during key periods (K-line closes / U.S. market open and close) often involve institutional participation, making the signals more credible
Market overview: BTC 82,645.00(+0.29%) · ETH 2,493.50(+0.07%); across the market, 385 gainers / 106 losers in 24h; top gainer: MAGIC +130.03%; top loser: OGN -17.02%.
📅 Data as of 13:23:55 (event trigger times are noted for each item; prices are live snapshots at the time of writing)
📌 In a nutshell: Notable moves during key periods (K-line closes / U.S. market open and close) often involve institutional participation, making the signals more credible
Market overview: BTC 82,645.00(+0.29%) · ETH 2,493.50(+0.07%); across the market, 385 gainers / 106 losers in 24h; top gainer: MAGIC +130.03%; top loser: OGN -17.02%.
1
·
--
Breaking! BAT plunges 2.7% at a key time—check these support levels before buying the dip09:50 (just now): BAT fell 2.7% at a key time (5-minute window 09:45→09:50). As of 09:51:42, the current price is 0.1358, up 32.5% over 24h. GMT and STRK also made notable moves during the same period.
📅 Data as of 09:51:42 (event trigger times are noted in each item; prices are real-time snapshots taken when this was written)
📌 In a nutshell: Moves around key times (candle closes / U.S. market opens and closes) often involve institutional participation, making them stronger signals
Market overview: BTC 82,676.20(+0.91%) · ETH 2,494.02(+0.47%); 24h market-wide gainers: 411 / losers: 82; top 24h gainer: US +114.31%, top loser: Lobster -14.17%.
Breaking! BAT plunges 2.7% at a key time—check these support levels before buying the dip
09:50 (just now): BAT fell 2.7% at a key time (5-minute window 09:45→09:50). As of 09:51:42, the current price is 0.1358, up 32.5% over 24h. GMT and STRK also made notable moves during the same period.
📅 Data as of 09:51:42 (event trigger times are noted in each item; prices are real-time snapshots taken when this was written)
📌 In a nutshell: Moves around key times (candle closes / U.S. market opens and closes) often involve institutional participation, making them stronger signals
Market overview: BTC 82,676.20(+0.91%) · ETH 2,494.02(+0.47%); 24h market-wide gainers: 411 / losers: 82; top 24h gainer: US +114.31%, top loser: Lobster -14.17%.
📅 Data as of 09:51:42 (event trigger times are noted in each item; prices are real-time snapshots taken when this was written)
📌 In a nutshell: Moves around key times (candle closes / U.S. market opens and closes) often involve institutional participation, making them stronger signals
Market overview: BTC 82,676.20(+0.91%) · ETH 2,494.02(+0.47%); 24h market-wide gainers: 411 / losers: 82; top 24h gainer: US +114.31%, top loser: Lobster -14.17%.
109

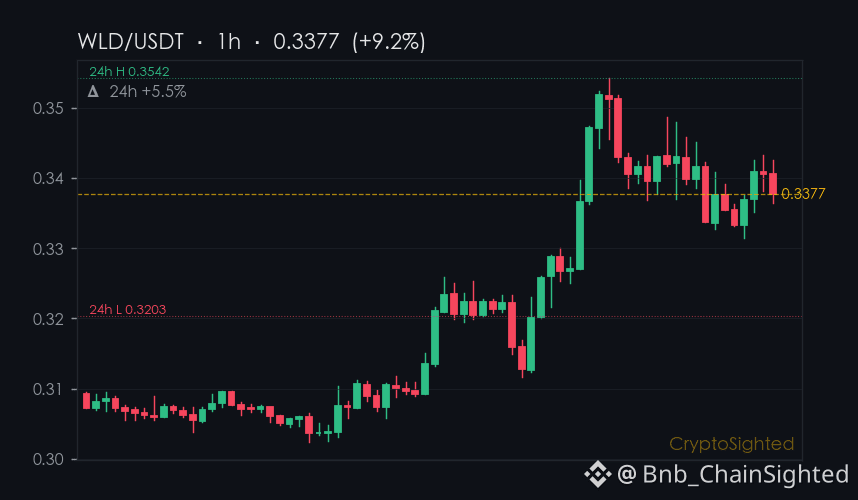
$WLD’s 24-hour price surge of ↑5.5% masks a quiet shift in leverage dynamics.
Its current price sits near $0.34, with volume climbing to 72 million tokens - a move that’s sharp, but not yet backed by rising funding rates.
The 21-day cumulative funding rate is actually ↓0.120%, suggesting longs have been paying a hidden cost over time, even as the token rallies.
Checkpoint: WLD’s 21-day cumulative funding rate is ↓0.120% now - if it remains negative as the price continues to climb, the rally could be more about volume than leverage backing.
—
Not financial advice. DYOR.
📌 Funding Pulse · #140 · #FundingRate #CryptoSighted $WLD
$WLD ’s 24-hour price surge of ↑5.5% masks a quiet shift in leverage dynamics.
Its current price sits near $0.34, with volume climbing to 72 million tokens - a move that’s sharp, but not yet backed by rising funding rates.
The 21-day cumulative funding rate is actually ↓0.120%, suggesting longs have been paying a hidden cost over time, even as the token rallies.
Checkpoint: WLD’s 21-day cumulative funding rate is ↓0.120% now - if it remains negative as the price continues to climb, the rally could be more about volume than leverage backing.
—
Not financial advice. DYOR.
📌 Funding Pulse · #140 · #FundingRate #CryptoSighted $WLD
Its current price sits near $0.34, with volume climbing to 72 million tokens - a move that’s sharp, but not yet backed by rising funding rates.
The 21-day cumulative funding rate is actually ↓0.120%, suggesting longs have been paying a hidden cost over time, even as the token rallies.
Checkpoint: WLD’s 21-day cumulative funding rate is ↓0.120% now - if it remains negative as the price continues to climb, the rally could be more about volume than leverage backing.
—
Not financial advice. DYOR.
📌 Funding Pulse · #140 · #FundingRate #CryptoSighted $WLD
206
·
--
Attention! ESP surged straight up 2.2% at an important time point—where to look for a pullback entry?10:52 (13 minutes ago) — ESP saw a surge of 2.2% at a key time point (5-minute window 10:47→10:52). As of 11:06:14, the current price is 0.1113, up 9.2% over 24h. Other movers in the same batch include INIT and ZAMA.
📅 Data as of 11:06:14 (event trigger times are noted on each item; prices are real-time snapshots at the time of writing)
📌 One-line highlight: In important time windows (K-line close / US stock market open/close), many of the breakouts involve institutions, so the signal quality is higher.
Market overview: BTC 84,765.00 (+0.27%) · ETH 2,691.00 (+0.58%); across the whole market, 215 stocks rose / 140 fell over the past 24h; the top gainer in the past 24h was STRK (+21.67%), and the biggest loser was AT (-10.93%).
Attention! ESP surged straight up 2.2% at an important time point—where to look for a pullback entry?
10:52 (13 minutes ago) — ESP saw a surge of 2.2% at a key time point (5-minute window 10:47→10:52). As of 11:06:14, the current price is 0.1113, up 9.2% over 24h. Other movers in the same batch include INIT and ZAMA.
📅 Data as of 11:06:14 (event trigger times are noted on each item; prices are real-time snapshots at the time of writing)
📌 One-line highlight: In important time windows (K-line close / US stock market open/close), many of the breakouts involve institutions, so the signal quality is higher.
Market overview: BTC 84,765.00 (+0.27%) · ETH 2,691.00 (+0.58%); across the whole market, 215 stocks rose / 140 fell over the past 24h; the top gainer in the past 24h was STRK (+21.67%), and the biggest loser was AT (-10.93%).
📅 Data as of 11:06:14 (event trigger times are noted on each item; prices are real-time snapshots at the time of writing)
📌 One-line highlight: In important time windows (K-line close / US stock market open/close), many of the breakouts involve institutions, so the signal quality is higher.
Market overview: BTC 84,765.00 (+0.27%) · ETH 2,691.00 (+0.58%); across the whole market, 215 stocks rose / 140 fell over the past 24h; the top gainer in the past 24h was STRK (+21.67%), and the biggest loser was AT (-10.93%).
15
Log in to explore more content
Join global crypto users on Binance Square
⚡️ Get latest and useful information about crypto.
💬 Trusted by the world’s largest crypto exchange.
👍 Discover real insights from verified creators.
Email / Phone number
Trending Topics
1
#HotCPIDecemberHikePriced
363,298 views
3,418 Discussing
2
#ZcashFallsBelow$1000ForFirstTimeSinceSeptember
13,440 views
76 Discussing
3
#StrategyFaces$2.8BSelloffRiskFromMSCIRemoval
24,253 views
150 Discussing
4
#AnthropicRejectsIPODelayValuationinQuestion
379,807 views
3,298 Discussing
5
#BitcoinETFsLose$1.6BInNovember
11,287 views
58 Discussing
6
#AnthropicDisclosesOver$10BNewComputeDeals
2,273 views
34 Discussing
7
#CoreWeaveJumps10%On168%RevenueGrowth
28,616 views
522 Discussing
8
#CanNvidiaEarningsEaseMarketConcerns?
117,986 views
1,452 Discussing
9
#BarclaysRaisesBlackRockBitcoinETFStake48%
24,600 views
384 Discussing
10
#BitmineReports$6.3BFiscal2026Loss
8,311 views
26 Discussing