
Bantee X
1.6k Posts

Bantee X
Report
Block User
“Crypto | Trades | Market Updates 🚀 | Follow for daily signals & insights 💎
Open Trade
Occasional Trader
2.3 Years
59 Following
233 Followers
1.0K+ Liked
Posts
Portfolio
All
Quotes
Videos
PINNED
·
--
Bullish
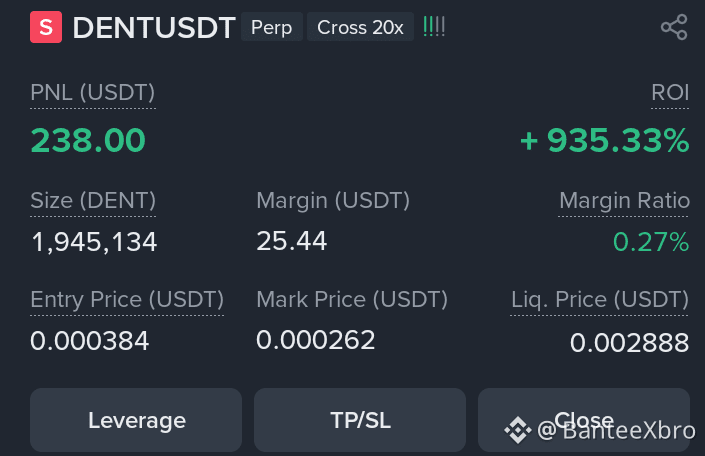
"They say small accounts can’t grow, but the truth is they just lack the right roadmap; with a true guide, even the smallest seed becomes a forest. 🌳📈"
$DENT @Thesignalprovider
{future}(DENTUSDT)
"They say small accounts can’t grow, but the truth is they just lack the right roadmap; with a true guide, even the smallest seed becomes a forest. 🌳📈"
$DENT @Bantee X
$DENT @Bantee X
Bantee X
·
--
Bearishlook at $DENT I'm open short at this 👇
see my entry and my final target is 🎯 0.000300
Must use stop lose ⛔ at 0.000432
let's see 😉 ....
Always protect your capital first 🥇
see my entry and my final target is 🎯 0.000300
Must use stop lose ⛔ at 0.000432
let's see 😉 ....
Always protect your capital first 🥇
1
3
301
PINNED
·
--
New Update for All Crypto Traders
Hey everyone,
I’m excited to share something new — I’m now officially sharing SPOT TRADE SIGNALS right here on Binance Square.
No hype. No shortcuts. Just real strategies to help you trade with more confidence and less stress.
Here’s what you can expect:
🔹 Genuine market analysis — based on trends, not guesswork
🔹 Clear buy & sell zones — no confusion, just smart decisions
🔹 Stop-loss guidance — because protecting your capital is priority #1
🔹 Beginner-friendly setups — simple to follow, easy to act on
🔹 Daily updates — so you stay ahead of market shifts
Many traders lose money not because of the market — but because they don’t have a clear plan. This is your chance to change that.
Whether you’re just starting out or looking to improve your results, these SPOT signals are made to support your journey.
👉 Follow me to start getting insights
👉 Learn to trade smarter, not harder
👉 Be part of a growing community that focuses on knowledge, discipline & growth
Let’s simplify your trading and start building real progress — together.
#USCryptoWeek #MemecoinSentiment #ETHBreaks3k #BTCBreaksATH #ArbitrageTradingStrategy
$BNB
{spot}(BNBUSDT)
New Update for All Crypto Traders
Hey everyone,
I’m excited to share something new — I’m now officially sharing SPOT TRADE SIGNALS right here on Binance Square.
No hype. No shortcuts. Just real strategies to help you trade with more confidence and less stress.
Here’s what you can expect:
🔹 Genuine market analysis — based on trends, not guesswork
🔹 Clear buy & sell zones — no confusion, just smart decisions
🔹 Stop-loss guidance — because protecting your capital is priority #1
🔹 Beginner-friendly setups — simple to follow, easy to act on
🔹 Daily updates — so you stay ahead of market shifts
Many traders lose money not because of the market — but because they don’t have a clear plan. This is your chance to change that.
Whether you’re just starting out or looking to improve your results, these SPOT signals are made to support your journey.
👉 Follow me to start getting insights
👉 Learn to trade smarter, not harder
👉 Be part of a growing community that focuses on knowledge, discipline & growth
Let’s simplify your trading and start building real progress — together.
#USCryptoWeek #MemecoinSentiment #ETHBreaks3k #BTCBreaksATH #ArbitrageTradingStrategy
$BNB
Hey everyone,
I’m excited to share something new — I’m now officially sharing SPOT TRADE SIGNALS right here on Binance Square.
No hype. No shortcuts. Just real strategies to help you trade with more confidence and less stress.
Here’s what you can expect:
🔹 Genuine market analysis — based on trends, not guesswork
🔹 Clear buy & sell zones — no confusion, just smart decisions
🔹 Stop-loss guidance — because protecting your capital is priority #1
🔹 Beginner-friendly setups — simple to follow, easy to act on
🔹 Daily updates — so you stay ahead of market shifts
Many traders lose money not because of the market — but because they don’t have a clear plan. This is your chance to change that.
Whether you’re just starting out or looking to improve your results, these SPOT signals are made to support your journey.
👉 Follow me to start getting insights
👉 Learn to trade smarter, not harder
👉 Be part of a growing community that focuses on knowledge, discipline & growth
Let’s simplify your trading and start building real progress — together.
#USCryptoWeek #MemecoinSentiment #ETHBreaks3k #BTCBreaksATH #ArbitrageTradingStrategy
$BNB
3
1
7
93
·
--
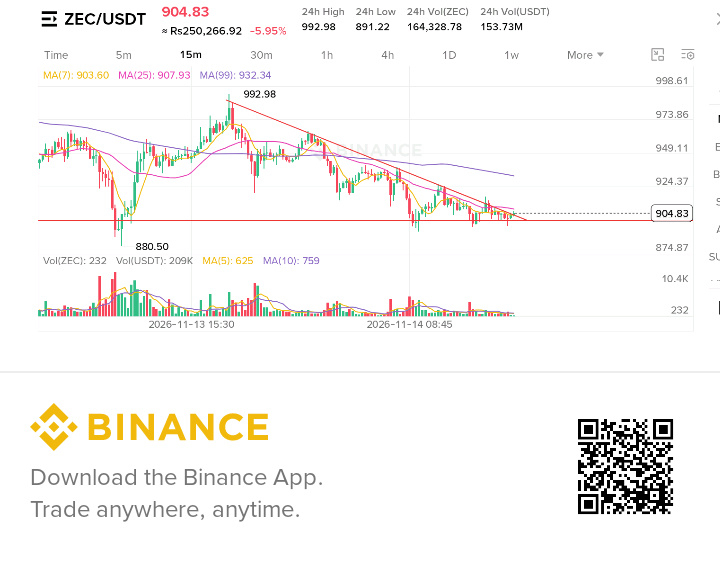
#zcash is currently compressing tightly inside a descending resistance structure on the 15m chart, sitting right around $903.18. The market is hovering above a crucial support line near the $890–$900 zone, setting the stage for an explosive directional move.
Let’s break down the macro context, the technical setup, and the exact trade execution plan.
📊 The Technical Picture & Market Context
The Compression: Price action has been carving lower highs against a descending trendline while respecting a foundational support base around $890–$900.
The Bullish Catalyst: If bulls manage a high volume breakout and clean candle close above the descending trendline resistance, we unlock an immediate path toward higher liquidity pools.
The Bearish Threat: Conversely, if this local support floor fails and price breaks downward, the order books open up for a deeper correction toward the $860 support shelf.
🚀 Long Position 📈
Wait for a confirmed 15m/1H candle close above the descending trendline resistance. Do not chase blindly look for retest confirmation.
{future}(ZECUSDT)
Stop Loss (SL): Placed safely below the breakout validation structure around $885) to protect capital.
Target 1: $916 🎯
Target 2: $927 🎯 (Book partial profits here secure half your position and move your Stop-Loss to Break Even and risk free trade.
Final Target: $934 🎯
📉 But If the price loses the $890–$900 support zone and prints a confirmed breakdown candle.
Expect accelerated downside momentum pushing the asset toward the $860 target zone.
Discipline beats emotion every single time. Respect your risk management, utilize proper position sizing, and let the market confirm the direction before executing.
What’s your read on $ZEC right now are we breaking upward to $934, or dropping to $860? Drop your thoughts below! 👇
#zcash is currently compressing tightly inside a descending resistance structure on the 15m chart, sitting right around $903.18. The market is hovering above a crucial support line near the $890–$900 zone, setting the stage for an explosive directional move.
Let’s break down the macro context, the technical setup, and the exact trade execution plan.
📊 The Technical Picture & Market Context
The Compression: Price action has been carving lower highs against a descending trendline while respecting a foundational support base around $890–$900.
The Bullish Catalyst: If bulls manage a high volume breakout and clean candle close above the descending trendline resistance, we unlock an immediate path toward higher liquidity pools.
The Bearish Threat: Conversely, if this local support floor fails and price breaks downward, the order books open up for a deeper correction toward the $860 support shelf.
🚀 Long Position 📈
Wait for a confirmed 15m/1H candle close above the descending trendline resistance. Do not chase blindly look for retest confirmation.
Stop Loss (SL): Placed safely below the breakout validation structure around $885) to protect capital.
Target 1: $916 🎯
Target 2: $927 🎯 (Book partial profits here secure half your position and move your Stop-Loss to Break Even and risk free trade.
Final Target: $934 🎯
📉 But If the price loses the $890–$900 support zone and prints a confirmed breakdown candle.
Expect accelerated downside momentum pushing the asset toward the $860 target zone.
Discipline beats emotion every single time. Respect your risk management, utilize proper position sizing, and let the market confirm the direction before executing.
What’s your read on $ZEC right now are we breaking upward to $934, or dropping to $860? Drop your thoughts below! 👇
Let’s break down the macro context, the technical setup, and the exact trade execution plan.
📊 The Technical Picture & Market Context
The Compression: Price action has been carving lower highs against a descending trendline while respecting a foundational support base around $890–$900.
The Bullish Catalyst: If bulls manage a high volume breakout and clean candle close above the descending trendline resistance, we unlock an immediate path toward higher liquidity pools.
The Bearish Threat: Conversely, if this local support floor fails and price breaks downward, the order books open up for a deeper correction toward the $860 support shelf.
🚀 Long Position 📈
Wait for a confirmed 15m/1H candle close above the descending trendline resistance. Do not chase blindly look for retest confirmation.
Stop Loss (SL): Placed safely below the breakout validation structure around $885) to protect capital.
Target 1: $916 🎯
Target 2: $927 🎯 (Book partial profits here secure half your position and move your Stop-Loss to Break Even and risk free trade.
Final Target: $934 🎯
📉 But If the price loses the $890–$900 support zone and prints a confirmed breakdown candle.
Expect accelerated downside momentum pushing the asset toward the $860 target zone.
Discipline beats emotion every single time. Respect your risk management, utilize proper position sizing, and let the market confirm the direction before executing.
What’s your read on $ZEC right now are we breaking upward to $934, or dropping to $860? Drop your thoughts below! 👇
343
·
--

Article
ZCASH : THE NEXT BIG COMEBACK OR A WARNING SIGN?Analyzing Zcash's Fundamentals, Mining Economics, Technical Structure & What's Next for Price
The Zcash market is entering an interesting phase.
After an extraordinary recovery and a powerful rally, ZEC is now experiencing a significant correction. While short-term momentum has weakened, its longer-term fundamentals and privacy-focused technology continue to make it one of the more interesting projects to watch in the cryptocurrency market.
But is this correction creating a buying opportunity, or is another leg down coming?
Let's break down the fundamentals, mining economics, technical indicators, and potential price scenarios.
A Strong Project Facing a Critical Market Test
Zcash (ZEC) is a privacy-focused cryptocurrency designed to enable shielded transactions using zero-knowledge cryptography.
Its maximum supply is capped at 21 million coins, similar to Bitcoin's $BTC monetary supply limit.
According to the November 14 market snapshot:
Market capitalization: Approximately $15.37 billion.Fully diluted valuation: Approximately $19.02 billion.Circulating supply: 16.96 million ZEC.Maximum supply: 21 million ZEC.Reference price in our TradingView screenshot: $904.72.
Approximately 80.8% of the maximum supply is already circulating.
This limited supply structure is an important part of Zcash's long term investment thesis. However, scarcity alone does not guarantee higher prices. Demand, adoption, liquidity, and investor confidence remain essential.
Mining Revenue: A Fundamental Warning Worth Watching
One of the most interesting indicators in our analysis is Zcash mining revenue.
The TradingView fundamentals dashboard shows:
Earlier miner revenue readings around $1.7M–$1.9M.Latest miner revenue around $1.35M.Fee share of miner revenue falling to approximately 0.05%.
This suggests that miner revenue has weakened during the observed period.
Why does this matter?
Mining economics are important because miners have operating costs, including electricity, hardware, and infrastructure. If revenue declines for an extended period, some miners may face pressure on profitability.
Another important observation is the extremely small contribution from transaction fees.
At approximately 0.05%, the fee share indicates that mining revenue remains overwhelmingly dependent on block rewards.
This is something investors should monitor closely.
However, declining miner revenue does not automatically mean miners are selling their holdings. Exchange deposits and miner wallet movements would need to confirm that.
The Technology and Ecosystem Story
Zcash's long term opportunity is closely connected to financial privacy.
Privacy is an important feature of digital financial infrastructure, particularly for users and institutions that require transaction confidentiality.
Its shielded transaction technology gives Zcash a distinct identity in the cryptocurrency market.
Network improvements and better wallet experiences could help strengthen adoption.
The important question is whether technological development translates into:
More shielded transactions.Greater network activity.More active users.Improved ecosystem participation.Sustainable demand for ZEC.
These are the metrics worth watching beyond price speculation.
Technical Analysis: Is ZEC Preparing for a Recovery?
The technical picture is mixed.
Our November 14 market data snapshots indicate:
Daily RSI around 32.Weekly RSI around 51.Price trading above the referenced 200-day moving average.High volatility and significant speculative positioning.
The daily RSI suggests that selling momentum is approaching oversold territory.
But remember:
Oversold does not mean the market must immediately reverse.
A bullish reversal needs confirmation through price structure, volume, and sustained buying pressure.
Important support levels
The first important support area is:
$890 – 900
If buyers defend this region and establish a higher low on the 4-hour chart, a relief rally could develop.
If this support fails, the next areas to watch are:
$850.$823.$805.
A sustained breakdown could open the door to a deeper correction.
Important resistance levels
For bulls, the first major challenge is:
$940–956
A successful recovery above this region would improve the short-term outlook.
Additional resistance and upside targets:
$991.$1,012.$1,048.$1,104.
A daily close above $956 followed by a successful retest would provide a stronger bullish confirmation than simply seeing an intraday price spike.
{spot}(ZECUSDT)
If ZEC holds $890–900, buyers return, and price reclaims $956, the market could attempt a recovery toward:
$991 → $1,012 → $1,048 → $1,104.
This is the scenario bulls want to see.
FOR now Sideways Consolidation
ZEC could remain trapped between approximately $890 and $990.
This would suggest that the market is searching for direction while buyers and sellers establish a new balance.
A period of consolidation could create a stronger foundation for the next move.
Bearish Continuation 👇
If ZEC loses $890 and establishes a daily close below approximately $879, the bullish recovery thesis becomes weaker.
The market could then revisit:
$850 → $823 → $805.
Investors should avoid treating every dip as an automatic buying opportunity.
MY Trading Approach: Patience Over Prediction
For a spot swing trading strategy, we prefer confirmation rather than chasing volatility.
Two setups deserve attention:
Setup 1: Support Reversal
Watch the $885–910 area.
Look for:
A strong 4-hour rejection.RSI recovery.A higher low.Increasing buying volume.
Setup 2: Breakout and Retest
Watch for a confirmed move above $956.
A successful retest of $940–956 could provide a more convincing entry opportunity.
Risk management remains essential. Position sizes should be determined by the distance to invalidation, not by excitement about potential upside.
What Could Make ZEC Stronger Long Term?
We believe investors should focus on five fundamental developments:
Growth in shielded transaction adoption.Sustainable network activity.Improving miner economics.Better ecosystem development.Stronger spot-market demand.
The limited supply and privacy focused technology provide an interesting foundation, but long term value depends on actual adoption and demand.
Is Zcash Worth Watching?
Our overall assessment is cautiously bullish over the longer term, but short-term caution is necessary.
ZEC has an interesting technological proposition, a capped supply, and a history of powerful price movements.
However, declining miner revenue, weak daily momentum, and high volatility mean that investors should remain disciplined.
The $890–900 region is important for the immediate structure, while $940–956 is the first major recovery zone.
Our key takeaway:
We don't need to catch the exact bottom. We need to recognize when the market begins confirming a reversal.
Zcash remains a cryptocurrency worth watching closely. The next move could be significant, but confirmation will matter more than speculation.
Stay patient. Watch the levels. Manage the risk.
Disclaimer: This article is for educational and informational purposes only. It is not financial advice or a recommendation to buy or sell ZEC. Market prices and technical levels are time sensitive and should be independently verified before making trading decisions.
#zec #LongTermAnalysis
ZCASH : THE NEXT BIG COMEBACK OR A WARNING SIGN?
Analyzing Zcash's Fundamentals, Mining Economics, Technical Structure & What's Next for Price
The Zcash market is entering an interesting phase.
After an extraordinary recovery and a powerful rally, ZEC is now experiencing a significant correction. While short-term momentum has weakened, its longer-term fundamentals and privacy-focused technology continue to make it one of the more interesting projects to watch in the cryptocurrency market.
But is this correction creating a buying opportunity, or is another leg down coming?
Let's break down the fundamentals, mining economics, technical indicators, and potential price scenarios.
A Strong Project Facing a Critical Market Test
Zcash (ZEC) is a privacy-focused cryptocurrency designed to enable shielded transactions using zero-knowledge cryptography.
Its maximum supply is capped at 21 million coins, similar to Bitcoin's $BTC monetary supply limit.
According to the November 14 market snapshot:
Market capitalization: Approximately $15.37 billion.Fully diluted valuation: Approximately $19.02 billion.Circulating supply: 16.96 million ZEC.Maximum supply: 21 million ZEC.Reference price in our TradingView screenshot: $904.72.
Approximately 80.8% of the maximum supply is already circulating.
This limited supply structure is an important part of Zcash's long term investment thesis. However, scarcity alone does not guarantee higher prices. Demand, adoption, liquidity, and investor confidence remain essential.
Mining Revenue: A Fundamental Warning Worth Watching
One of the most interesting indicators in our analysis is Zcash mining revenue.
The TradingView fundamentals dashboard shows:
Earlier miner revenue readings around $1.7M–$1.9M.Latest miner revenue around $1.35M.Fee share of miner revenue falling to approximately 0.05%.
This suggests that miner revenue has weakened during the observed period.
Why does this matter?
Mining economics are important because miners have operating costs, including electricity, hardware, and infrastructure. If revenue declines for an extended period, some miners may face pressure on profitability.
Another important observation is the extremely small contribution from transaction fees.
At approximately 0.05%, the fee share indicates that mining revenue remains overwhelmingly dependent on block rewards.
This is something investors should monitor closely.
However, declining miner revenue does not automatically mean miners are selling their holdings. Exchange deposits and miner wallet movements would need to confirm that.
The Technology and Ecosystem Story
Zcash's long term opportunity is closely connected to financial privacy.
Privacy is an important feature of digital financial infrastructure, particularly for users and institutions that require transaction confidentiality.
Its shielded transaction technology gives Zcash a distinct identity in the cryptocurrency market.
Network improvements and better wallet experiences could help strengthen adoption.
The important question is whether technological development translates into:
More shielded transactions.Greater network activity.More active users.Improved ecosystem participation.Sustainable demand for ZEC.
These are the metrics worth watching beyond price speculation.
Technical Analysis: Is ZEC Preparing for a Recovery?
The technical picture is mixed.
Our November 14 market data snapshots indicate:
Daily RSI around 32.Weekly RSI around 51.Price trading above the referenced 200-day moving average.High volatility and significant speculative positioning.
The daily RSI suggests that selling momentum is approaching oversold territory.
But remember:
Oversold does not mean the market must immediately reverse.
A bullish reversal needs confirmation through price structure, volume, and sustained buying pressure.
Important support levels
The first important support area is:
$890 – 900
If buyers defend this region and establish a higher low on the 4-hour chart, a relief rally could develop.
If this support fails, the next areas to watch are:
$850.$823.$805.
A sustained breakdown could open the door to a deeper correction.
Important resistance levels
For bulls, the first major challenge is:
$940–956
A successful recovery above this region would improve the short-term outlook.
Additional resistance and upside targets:
$991.$1,012.$1,048.$1,104.
A daily close above $956 followed by a successful retest would provide a stronger bullish confirmation than simply seeing an intraday price spike.
If ZEC holds $890–900, buyers return, and price reclaims $956, the market could attempt a recovery toward:
$991 → $1,012 → $1,048 → $1,104.
This is the scenario bulls want to see.
FOR now Sideways Consolidation
ZEC could remain trapped between approximately $890 and $990.
This would suggest that the market is searching for direction while buyers and sellers establish a new balance.
A period of consolidation could create a stronger foundation for the next move.
Bearish Continuation 👇
If ZEC loses $890 and establishes a daily close below approximately $879, the bullish recovery thesis becomes weaker.
The market could then revisit:
$850 → $823 → $805.
Investors should avoid treating every dip as an automatic buying opportunity.
MY Trading Approach: Patience Over Prediction
For a spot swing trading strategy, we prefer confirmation rather than chasing volatility.
Two setups deserve attention:
Setup 1: Support Reversal
Watch the $885–910 area.
Look for:
A strong 4-hour rejection.RSI recovery.A higher low.Increasing buying volume.
Setup 2: Breakout and Retest
Watch for a confirmed move above $956.
A successful retest of $940–956 could provide a more convincing entry opportunity.
Risk management remains essential. Position sizes should be determined by the distance to invalidation, not by excitement about potential upside.
What Could Make ZEC Stronger Long Term?
We believe investors should focus on five fundamental developments:
Growth in shielded transaction adoption.Sustainable network activity.Improving miner economics.Better ecosystem development.Stronger spot-market demand.
The limited supply and privacy focused technology provide an interesting foundation, but long term value depends on actual adoption and demand.
Is Zcash Worth Watching?
Our overall assessment is cautiously bullish over the longer term, but short-term caution is necessary.
ZEC has an interesting technological proposition, a capped supply, and a history of powerful price movements.
However, declining miner revenue, weak daily momentum, and high volatility mean that investors should remain disciplined.
The $890–900 region is important for the immediate structure, while $940–956 is the first major recovery zone.
Our key takeaway:
We don't need to catch the exact bottom. We need to recognize when the market begins confirming a reversal.
Zcash remains a cryptocurrency worth watching closely. The next move could be significant, but confirmation will matter more than speculation.
Stay patient. Watch the levels. Manage the risk.
Disclaimer: This article is for educational and informational purposes only. It is not financial advice or a recommendation to buy or sell ZEC. Market prices and technical levels are time sensitive and should be independently verified before making trading decisions.
#zec #LongTermAnalysis
The Zcash market is entering an interesting phase.
After an extraordinary recovery and a powerful rally, ZEC is now experiencing a significant correction. While short-term momentum has weakened, its longer-term fundamentals and privacy-focused technology continue to make it one of the more interesting projects to watch in the cryptocurrency market.
But is this correction creating a buying opportunity, or is another leg down coming?
Let's break down the fundamentals, mining economics, technical indicators, and potential price scenarios.
A Strong Project Facing a Critical Market Test
Zcash (ZEC) is a privacy-focused cryptocurrency designed to enable shielded transactions using zero-knowledge cryptography.
Its maximum supply is capped at 21 million coins, similar to Bitcoin's $BTC monetary supply limit.
According to the November 14 market snapshot:
Market capitalization: Approximately $15.37 billion.Fully diluted valuation: Approximately $19.02 billion.Circulating supply: 16.96 million ZEC.Maximum supply: 21 million ZEC.Reference price in our TradingView screenshot: $904.72.
Approximately 80.8% of the maximum supply is already circulating.
This limited supply structure is an important part of Zcash's long term investment thesis. However, scarcity alone does not guarantee higher prices. Demand, adoption, liquidity, and investor confidence remain essential.
Mining Revenue: A Fundamental Warning Worth Watching
One of the most interesting indicators in our analysis is Zcash mining revenue.
The TradingView fundamentals dashboard shows:
Earlier miner revenue readings around $1.7M–$1.9M.Latest miner revenue around $1.35M.Fee share of miner revenue falling to approximately 0.05%.
This suggests that miner revenue has weakened during the observed period.
Why does this matter?
Mining economics are important because miners have operating costs, including electricity, hardware, and infrastructure. If revenue declines for an extended period, some miners may face pressure on profitability.
Another important observation is the extremely small contribution from transaction fees.
At approximately 0.05%, the fee share indicates that mining revenue remains overwhelmingly dependent on block rewards.
This is something investors should monitor closely.
However, declining miner revenue does not automatically mean miners are selling their holdings. Exchange deposits and miner wallet movements would need to confirm that.
The Technology and Ecosystem Story
Zcash's long term opportunity is closely connected to financial privacy.
Privacy is an important feature of digital financial infrastructure, particularly for users and institutions that require transaction confidentiality.
Its shielded transaction technology gives Zcash a distinct identity in the cryptocurrency market.
Network improvements and better wallet experiences could help strengthen adoption.
The important question is whether technological development translates into:
More shielded transactions.Greater network activity.More active users.Improved ecosystem participation.Sustainable demand for ZEC.
These are the metrics worth watching beyond price speculation.
Technical Analysis: Is ZEC Preparing for a Recovery?
The technical picture is mixed.
Our November 14 market data snapshots indicate:
Daily RSI around 32.Weekly RSI around 51.Price trading above the referenced 200-day moving average.High volatility and significant speculative positioning.
The daily RSI suggests that selling momentum is approaching oversold territory.
But remember:
Oversold does not mean the market must immediately reverse.
A bullish reversal needs confirmation through price structure, volume, and sustained buying pressure.
Important support levels
The first important support area is:
$890 – 900
If buyers defend this region and establish a higher low on the 4-hour chart, a relief rally could develop.
If this support fails, the next areas to watch are:
$850.$823.$805.
A sustained breakdown could open the door to a deeper correction.
Important resistance levels
For bulls, the first major challenge is:
$940–956
A successful recovery above this region would improve the short-term outlook.
Additional resistance and upside targets:
$991.$1,012.$1,048.$1,104.
A daily close above $956 followed by a successful retest would provide a stronger bullish confirmation than simply seeing an intraday price spike.
If ZEC holds $890–900, buyers return, and price reclaims $956, the market could attempt a recovery toward:
$991 → $1,012 → $1,048 → $1,104.
This is the scenario bulls want to see.
FOR now Sideways Consolidation
ZEC could remain trapped between approximately $890 and $990.
This would suggest that the market is searching for direction while buyers and sellers establish a new balance.
A period of consolidation could create a stronger foundation for the next move.
Bearish Continuation 👇
If ZEC loses $890 and establishes a daily close below approximately $879, the bullish recovery thesis becomes weaker.
The market could then revisit:
$850 → $823 → $805.
Investors should avoid treating every dip as an automatic buying opportunity.
MY Trading Approach: Patience Over Prediction
For a spot swing trading strategy, we prefer confirmation rather than chasing volatility.
Two setups deserve attention:
Setup 1: Support Reversal
Watch the $885–910 area.
Look for:
A strong 4-hour rejection.RSI recovery.A higher low.Increasing buying volume.
Setup 2: Breakout and Retest
Watch for a confirmed move above $956.
A successful retest of $940–956 could provide a more convincing entry opportunity.
Risk management remains essential. Position sizes should be determined by the distance to invalidation, not by excitement about potential upside.
What Could Make ZEC Stronger Long Term?
We believe investors should focus on five fundamental developments:
Growth in shielded transaction adoption.Sustainable network activity.Improving miner economics.Better ecosystem development.Stronger spot-market demand.
The limited supply and privacy focused technology provide an interesting foundation, but long term value depends on actual adoption and demand.
Is Zcash Worth Watching?
Our overall assessment is cautiously bullish over the longer term, but short-term caution is necessary.
ZEC has an interesting technological proposition, a capped supply, and a history of powerful price movements.
However, declining miner revenue, weak daily momentum, and high volatility mean that investors should remain disciplined.
The $890–900 region is important for the immediate structure, while $940–956 is the first major recovery zone.
Our key takeaway:
We don't need to catch the exact bottom. We need to recognize when the market begins confirming a reversal.
Zcash remains a cryptocurrency worth watching closely. The next move could be significant, but confirmation will matter more than speculation.
Stay patient. Watch the levels. Manage the risk.
Disclaimer: This article is for educational and informational purposes only. It is not financial advice or a recommendation to buy or sell ZEC. Market prices and technical levels are time sensitive and should be independently verified before making trading decisions.
#zec #LongTermAnalysis
459
·
--
😂 THE BITCOIN DIP THEY WANTED… BUT WON'T BUY! 🟠
At $87,000, everyone was waiting for a Bitcoin $BTC correction.
“Give us a dip, and we'll buy!” they said. 👀
Now the dip is finally here… and suddenly everyone is scared. 📉
The truth? Most people don't buy when the market gives them an opportunity. They buy when FOMO takes over.
💡 Remember The biggest opportunities often come when market confidence is at its lowest.
Buy the fear? Or fear the dip? 🤔
#bitcoin #BTC #crypto #BuyTheDip #CryptoMarket
{spot}(BTCUSDT)
😂 THE BITCOIN DIP THEY WANTED… BUT WON'T BUY! 🟠
At $87,000, everyone was waiting for a Bitcoin $BTC correction.
“Give us a dip, and we'll buy!” they said. 👀
Now the dip is finally here… and suddenly everyone is scared. 📉
The truth? Most people don't buy when the market gives them an opportunity. They buy when FOMO takes over.
💡 Remember The biggest opportunities often come when market confidence is at its lowest.
Buy the fear? Or fear the dip? 🤔
#bitcoin #BTC #crypto #BuyTheDip #CryptoMarket
At $87,000, everyone was waiting for a Bitcoin $BTC correction.
“Give us a dip, and we'll buy!” they said. 👀
Now the dip is finally here… and suddenly everyone is scared. 📉
The truth? Most people don't buy when the market gives them an opportunity. They buy when FOMO takes over.
💡 Remember The biggest opportunities often come when market confidence is at its lowest.
Buy the fear? Or fear the dip? 🤔
#bitcoin #BTC #crypto #BuyTheDip #CryptoMarket

72
·
--
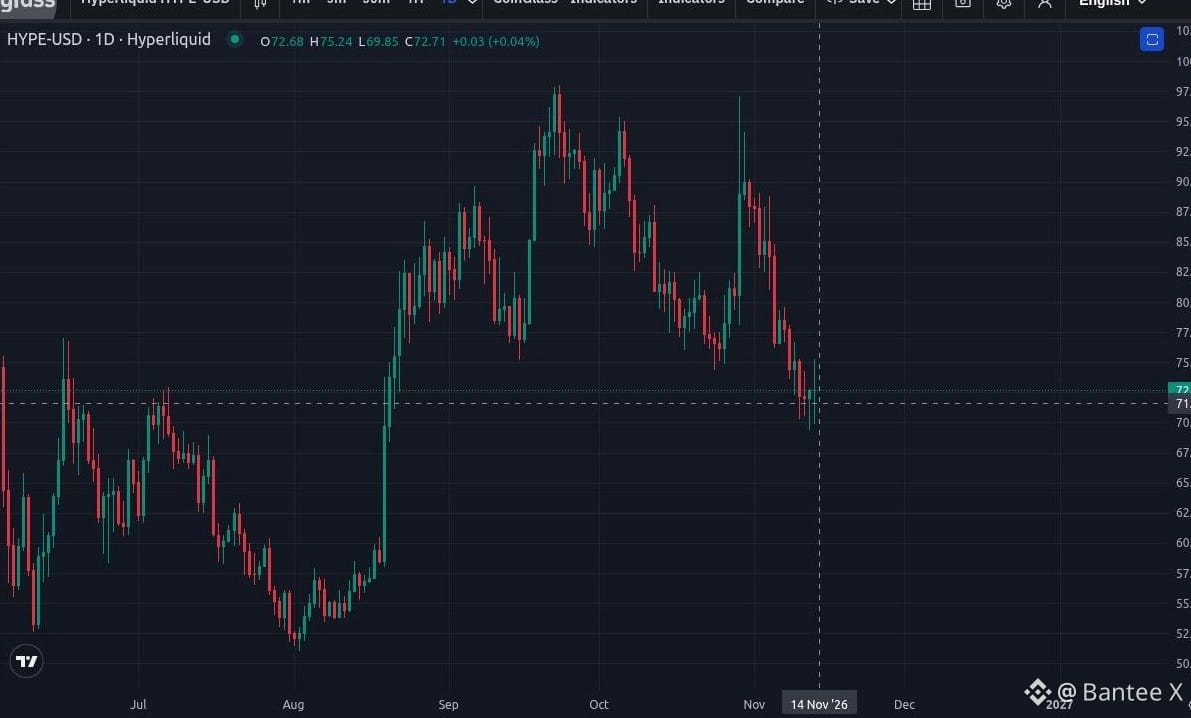
$HYPE has dropped approximately 17% over the past week, trading around $72.49 as of November 12. Despite recent listings on South Korea's Upbit and Bithumb, bullish momentum remains weak, with sellers continuing to dominate price action.
{spot}(HYPEUSDT)
🔎 What's Driving the Decline?
Two major HYPE holders reportedly sold approximately $109 million worth of tokens.
Binance reopened HYPE withdrawals, potentially increasing selling pressure.
Price failed to reclaim the $87–$89 resistance zone.
Weekly and daily technical indicators continue to show weakening momentum.
📉 KEY TECHNICAL LEVELS
$70.44: Immediate support and recent swing low.
$69.03: Critical weekly Fibonacci support and the most important level to watch.
$61.16: Next major downside target if $69 breaks.
$87–$89: Major resistance zone that bulls need to reclaim for a stronger recovery.
📈 WHAT TO EXPECT NEXT?
🟢 Bullish Scenario: If buyers successfully defend the $69–$70 zone, HYPE could stabilize and attempt a recovery. Increasing buying volume and improving RSI would strengthen this scenario.
🔴 Bearish Scenario: A decisive breakdown below $69 could trigger another wave of selling, potentially pushing HYPE toward $61.16.
⚠️ My TAKEAWAY
HYPE is approaching a crucial decision zone. Although some buying interest is emerging on the daily chart, the broader weekly momentum remains weak.
For now, patience is key. Watch how price reacts around $69 before considering any aggressive entries. A support hold with strong buying volume could create a recovery opportunity, while a confirmed breakdown would increase downside risk.
Trade smart. Manage risk. Never confuse a potential support zone with a guaranteed reversal.
#Hyperliquid #CryptoAnalysis #ALTCOİNS #trading
$HYPE has dropped approximately 17% over the past week, trading around $72.49 as of November 12. Despite recent listings on South Korea's Upbit and Bithumb, bullish momentum remains weak, with sellers continuing to dominate price action.
🔎 What's Driving the Decline?
Two major HYPE holders reportedly sold approximately $109 million worth of tokens.
Binance reopened HYPE withdrawals, potentially increasing selling pressure.
Price failed to reclaim the $87–$89 resistance zone.
Weekly and daily technical indicators continue to show weakening momentum.
📉 KEY TECHNICAL LEVELS
$70.44: Immediate support and recent swing low.
$69.03: Critical weekly Fibonacci support and the most important level to watch.
$61.16: Next major downside target if $69 breaks.
$87–$89: Major resistance zone that bulls need to reclaim for a stronger recovery.
📈 WHAT TO EXPECT NEXT?
🟢 Bullish Scenario: If buyers successfully defend the $69–$70 zone, HYPE could stabilize and attempt a recovery. Increasing buying volume and improving RSI would strengthen this scenario.
🔴 Bearish Scenario: A decisive breakdown below $69 could trigger another wave of selling, potentially pushing HYPE toward $61.16.
⚠️ My TAKEAWAY
HYPE is approaching a crucial decision zone. Although some buying interest is emerging on the daily chart, the broader weekly momentum remains weak.
For now, patience is key. Watch how price reacts around $69 before considering any aggressive entries. A support hold with strong buying volume could create a recovery opportunity, while a confirmed breakdown would increase downside risk.
Trade smart. Manage risk. Never confuse a potential support zone with a guaranteed reversal.
#Hyperliquid #CryptoAnalysis #ALTCOİNS #trading
🔎 What's Driving the Decline?
Two major HYPE holders reportedly sold approximately $109 million worth of tokens.
Binance reopened HYPE withdrawals, potentially increasing selling pressure.
Price failed to reclaim the $87–$89 resistance zone.
Weekly and daily technical indicators continue to show weakening momentum.
📉 KEY TECHNICAL LEVELS
$70.44: Immediate support and recent swing low.
$69.03: Critical weekly Fibonacci support and the most important level to watch.
$61.16: Next major downside target if $69 breaks.
$87–$89: Major resistance zone that bulls need to reclaim for a stronger recovery.
📈 WHAT TO EXPECT NEXT?
🟢 Bullish Scenario: If buyers successfully defend the $69–$70 zone, HYPE could stabilize and attempt a recovery. Increasing buying volume and improving RSI would strengthen this scenario.
🔴 Bearish Scenario: A decisive breakdown below $69 could trigger another wave of selling, potentially pushing HYPE toward $61.16.
⚠️ My TAKEAWAY
HYPE is approaching a crucial decision zone. Although some buying interest is emerging on the daily chart, the broader weekly momentum remains weak.
For now, patience is key. Watch how price reacts around $69 before considering any aggressive entries. A support hold with strong buying volume could create a recovery opportunity, while a confirmed breakdown would increase downside risk.
Trade smart. Manage risk. Never confuse a potential support zone with a guaranteed reversal.
#Hyperliquid #CryptoAnalysis #ALTCOİNS #trading

101
·
--
Bearish
📉 $XRP $900M Binance Inflow Raises Selling Concerns
Two Short Setups to Watch
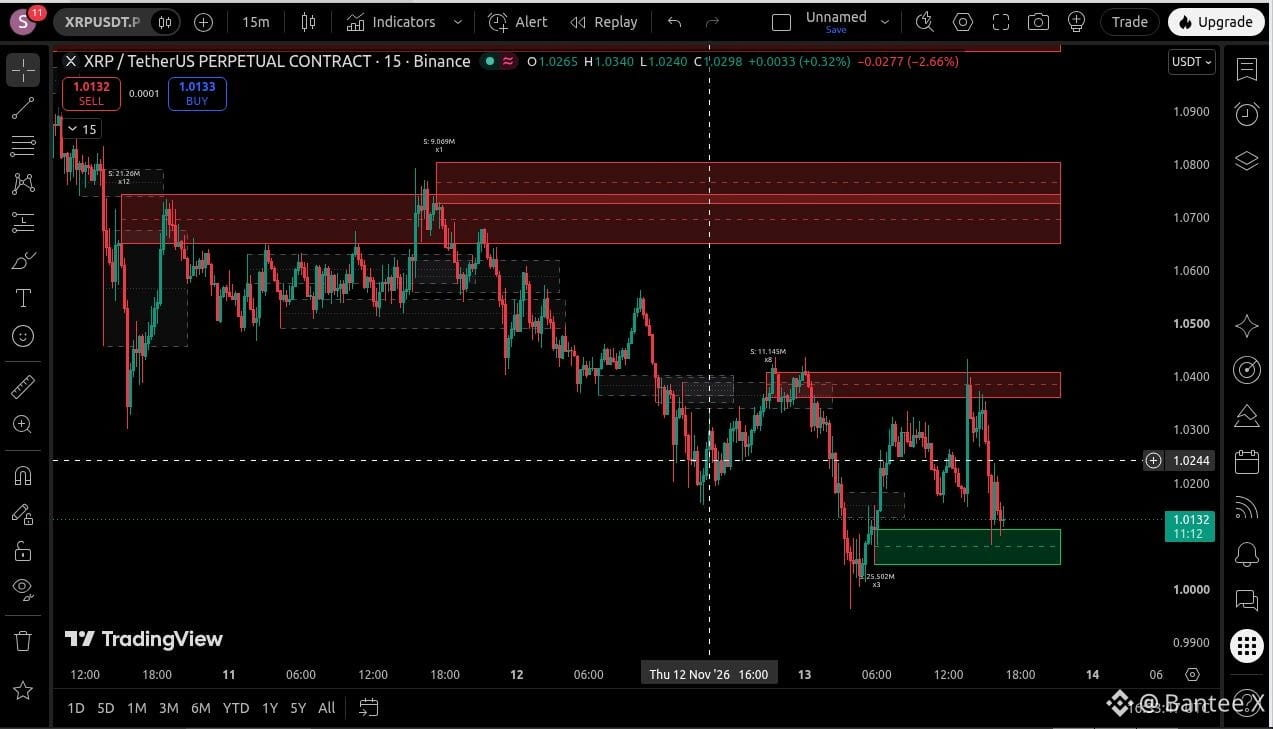
XRP remains under bearish pressure following the reported $900 million Binance inflow. The chart continues to show lower highs and lower lows, while price struggles to reclaim important resistance levels.
With sellers maintaining control, two potential short opportunities are worth monitoring.
Entry: $1.020 – $1.024 Stop Loss: $1.031
TP1: $1.011
TP2: $1.005
TP3: $0.99
Wait for XRP to bounce into the $1.020–$1.024 resistance zone and show a clear bearish rejection on the 15 minute chart.
Major Breakdown Below $0.986 (4H)
Potential SHORT Setup:
Entry: $0.985 – $0.990 only after confirmed breakdown and failed retest)Stop Loss: $1.017
TP1: $0.971 TP2: $0.950 TP3: $0.940
{future}(XRPUSDT)
Confirmation: Wait for a four hour 4h candle close below $0.986, followed by a failed attempt to reclaim this level.
Why Does the Bearish Setup Matter?
Bearish market structure with lower highs and lower lows.Significant reported Binance inflows of approximately $900 million.Previous support levels have been broken.Oversold RSI leaves room for a relief bounce, making confirmation essential.The $0.986 August swing low remains a critical structural support.
BUT I prefer waiting for a rejection around $1.020–$1.024 for the short term setup.
For the larger downside move, I would wait for a confirmed breakdown below $0.986 rather than anticipating it.
If $XRP reclaims $1.00 and sustains above it, reconsider the immediate bearish thesis. A recovery above $1.041 would further weaken the shortterm bearish setup.
⚠️ Risk no more than 1% of trading capital per trade.Avoid excessive leverage.Never chase a breakdown.Wait for candle-close confirmation.Calculate position size according to your stop-loss distance.
Disclaimer: The reported Binance inflows do not confirm actual selling. Cryptocurrency markets are highly volatile, and prices can change rapidly. Always conduct your own research and manage risk responsibly.
#BitcoinCoreDisclosesTorTrafficVulnerability #xrp
📉 $XRP $900M Binance Inflow Raises Selling Concerns
Two Short Setups to Watch
XRP remains under bearish pressure following the reported $900 million Binance inflow. The chart continues to show lower highs and lower lows, while price struggles to reclaim important resistance levels.
With sellers maintaining control, two potential short opportunities are worth monitoring.
Entry: $1.020 – $1.024 Stop Loss: $1.031
TP1: $1.011
TP2: $1.005
TP3: $0.99
Wait for XRP to bounce into the $1.020–$1.024 resistance zone and show a clear bearish rejection on the 15 minute chart.
Major Breakdown Below $0.986 (4H)
Potential SHORT Setup:
Entry: $0.985 – $0.990 only after confirmed breakdown and failed retest)Stop Loss: $1.017
TP1: $0.971 TP2: $0.950 TP3: $0.940
Confirmation: Wait for a four hour 4h candle close below $0.986, followed by a failed attempt to reclaim this level.
Why Does the Bearish Setup Matter?
Bearish market structure with lower highs and lower lows.Significant reported Binance inflows of approximately $900 million.Previous support levels have been broken.Oversold RSI leaves room for a relief bounce, making confirmation essential.The $0.986 August swing low remains a critical structural support.
BUT I prefer waiting for a rejection around $1.020–$1.024 for the short term setup.
For the larger downside move, I would wait for a confirmed breakdown below $0.986 rather than anticipating it.
If $XRP reclaims $1.00 and sustains above it, reconsider the immediate bearish thesis. A recovery above $1.041 would further weaken the shortterm bearish setup.
⚠️ Risk no more than 1% of trading capital per trade.Avoid excessive leverage.Never chase a breakdown.Wait for candle-close confirmation.Calculate position size according to your stop-loss distance.
Disclaimer: The reported Binance inflows do not confirm actual selling. Cryptocurrency markets are highly volatile, and prices can change rapidly. Always conduct your own research and manage risk responsibly.
#BitcoinCoreDisclosesTorTrafficVulnerability #xrp
Two Short Setups to Watch
XRP remains under bearish pressure following the reported $900 million Binance inflow. The chart continues to show lower highs and lower lows, while price struggles to reclaim important resistance levels.
With sellers maintaining control, two potential short opportunities are worth monitoring.
Entry: $1.020 – $1.024 Stop Loss: $1.031
TP1: $1.011
TP2: $1.005
TP3: $0.99
Wait for XRP to bounce into the $1.020–$1.024 resistance zone and show a clear bearish rejection on the 15 minute chart.
Major Breakdown Below $0.986 (4H)
Potential SHORT Setup:
Entry: $0.985 – $0.990 only after confirmed breakdown and failed retest)Stop Loss: $1.017
TP1: $0.971 TP2: $0.950 TP3: $0.940
Confirmation: Wait for a four hour 4h candle close below $0.986, followed by a failed attempt to reclaim this level.
Why Does the Bearish Setup Matter?
Bearish market structure with lower highs and lower lows.Significant reported Binance inflows of approximately $900 million.Previous support levels have been broken.Oversold RSI leaves room for a relief bounce, making confirmation essential.The $0.986 August swing low remains a critical structural support.
BUT I prefer waiting for a rejection around $1.020–$1.024 for the short term setup.
For the larger downside move, I would wait for a confirmed breakdown below $0.986 rather than anticipating it.
If $XRP reclaims $1.00 and sustains above it, reconsider the immediate bearish thesis. A recovery above $1.041 would further weaken the shortterm bearish setup.
⚠️ Risk no more than 1% of trading capital per trade.Avoid excessive leverage.Never chase a breakdown.Wait for candle-close confirmation.Calculate position size according to your stop-loss distance.
Disclaimer: The reported Binance inflows do not confirm actual selling. Cryptocurrency markets are highly volatile, and prices can change rapidly. Always conduct your own research and manage risk responsibly.
#BitcoinCoreDisclosesTorTrafficVulnerability #xrp
147
·
--
Bearish
$BTC DAILY FVG TESTED
BUYERS START SHOWING INTEREST!
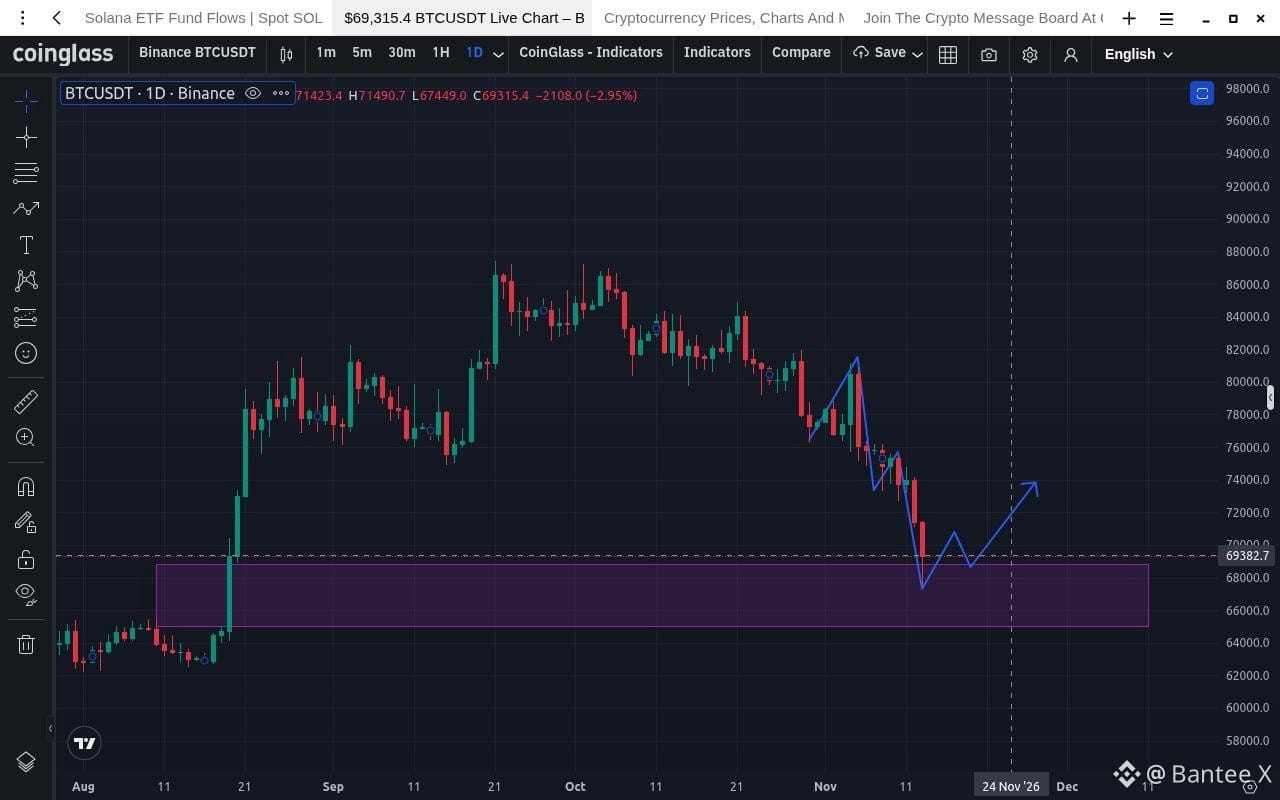
As discussed in our previous analysis, BTC has finally entered and tested the Daily FVG demand zone around $65K–$69K. We're now seeing early signs of buying momentum, making this an important area to watch for a potential recovery.
I'm planning a conditional LONG position, targeting $72,000+, where significant upside liquidity could attract price. My strict stop-loss will be placed below the recent low, around $67,000, subject to entry confirmation.
A strong bullish reaction and confirmation are essential before entering. If the support fails, I'll respect the stop-loss and avoid forcing the trade.
The opportunity is interesting, but risk management comes first. Let's see if BTC can turn this FVG into a launchpad for recovery! 👀
What's your view ? is $72K the next stop?
{future}(BTCUSDT)
#WhatWillDriveCryptoandStocks’NextRebound? #btc70k #TradeSignal
$BTC DAILY FVG TESTED
BUYERS START SHOWING INTEREST!
As discussed in our previous analysis, BTC has finally entered and tested the Daily FVG demand zone around $65K–$69K. We're now seeing early signs of buying momentum, making this an important area to watch for a potential recovery.
I'm planning a conditional LONG position, targeting $72,000+, where significant upside liquidity could attract price. My strict stop-loss will be placed below the recent low, around $67,000, subject to entry confirmation.
A strong bullish reaction and confirmation are essential before entering. If the support fails, I'll respect the stop-loss and avoid forcing the trade.
The opportunity is interesting, but risk management comes first. Let's see if BTC can turn this FVG into a launchpad for recovery! 👀
What's your view ? is $72K the next stop?
#WhatWillDriveCryptoandStocks’NextRebound? #btc70k #TradeSignal
BUYERS START SHOWING INTEREST!
As discussed in our previous analysis, BTC has finally entered and tested the Daily FVG demand zone around $65K–$69K. We're now seeing early signs of buying momentum, making this an important area to watch for a potential recovery.
I'm planning a conditional LONG position, targeting $72,000+, where significant upside liquidity could attract price. My strict stop-loss will be placed below the recent low, around $67,000, subject to entry confirmation.
A strong bullish reaction and confirmation are essential before entering. If the support fails, I'll respect the stop-loss and avoid forcing the trade.
The opportunity is interesting, but risk management comes first. Let's see if BTC can turn this FVG into a launchpad for recovery! 👀
What's your view ? is $72K the next stop?
#WhatWillDriveCryptoandStocks’NextRebound? #btc70k #TradeSignal
120
·
--
Bearish
🚨 BITCOIN FLASH CRASH📉🩸: BREAKING BELOW $70K & MASSIVE LONG LIQUIDATIONS! 📉
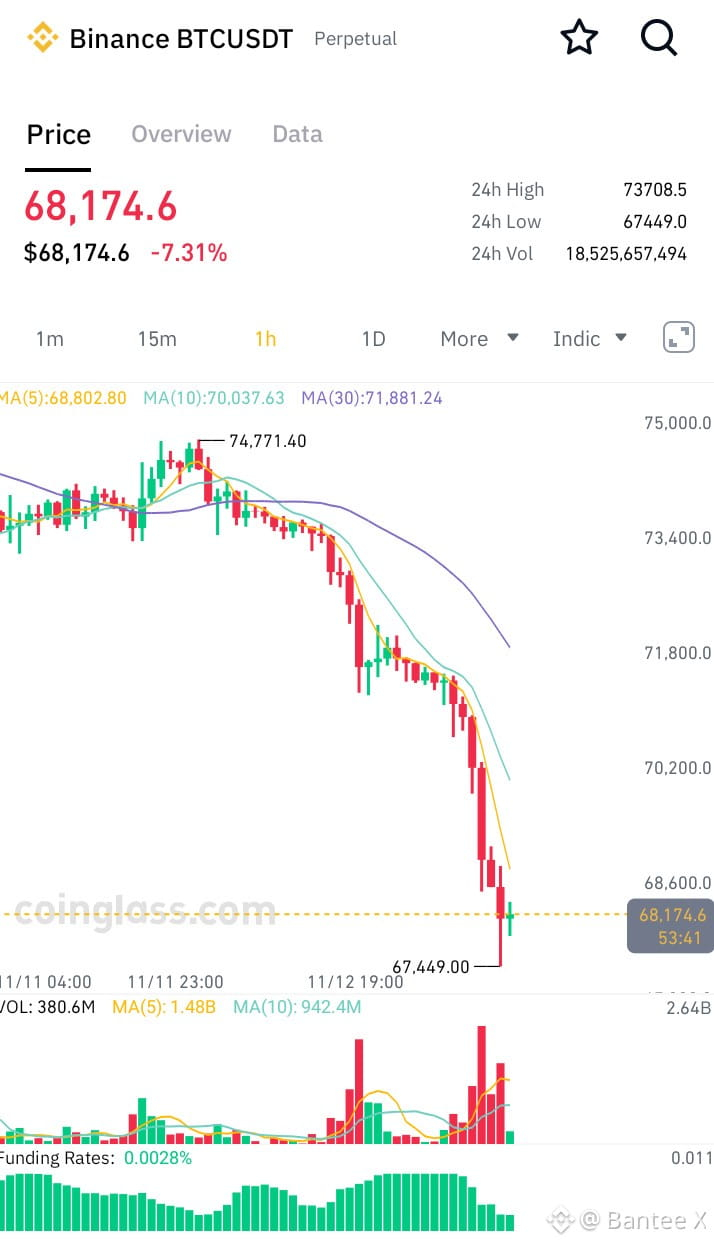
The market just experienced a brutal correction as Bitcoin sliced through the psychological $70,000 level for the first time since August, plunging down to a local low near $67,449 before attempting to stabilize around $68,174 -7.31% on the day🌐.
The cascading sell off triggered a massive flush in the derivatives market, wiping out over $750 million in long liquidations over the past 24 hours 📊.
What the Chart Tells Us 🔍
After failing to sustain momentum near the $74,771 high, price action broke down violently, slicing straight through moving average supports.
Volume Spike: The 1h chart shows massive red volume bars accompanying the flush, indicating panic selling and forced margin closures.
Current Status: Price is trying to bounce off the $67,449 swing low, but moving averages are steep overhead resistance.
🎯 Key Levels to Watch👀
Immediate Resistance: $70,000 – $70,037 Former support flipped to major supply 🧱
Dynamic MA(5) Resistance: ~$68,800 🛑
* Current Price Action Zone: $68,174 ⚡
* Critical Support Floor: $67,449 Recent flash crash low 🟢
🔥 When liquidations cascade past $750M, short-term volatility spikes significantly. While an oversold relief bounce is always possible after such a steep drop, the immediate market structure favors caution 🌐📉.
Are we seeing the ultimate flush before a reversal, or is a deeper test of support incoming? Drop your read below! 👇
$BTC
{future}(BTCUSDT)
#HuangExitNvidiaStrategyInFocus #btcdown
#BANTEEX
🚨 BITCOIN FLASH CRASH📉🩸: BREAKING BELOW $70K & MASSIVE LONG LIQUIDATIONS! 📉
The market just experienced a brutal correction as Bitcoin sliced through the psychological $70,000 level for the first time since August, plunging down to a local low near $67,449 before attempting to stabilize around $68,174 -7.31% on the day🌐.
The cascading sell off triggered a massive flush in the derivatives market, wiping out over $750 million in long liquidations over the past 24 hours 📊.
What the Chart Tells Us 🔍
After failing to sustain momentum near the $74,771 high, price action broke down violently, slicing straight through moving average supports.
Volume Spike: The 1h chart shows massive red volume bars accompanying the flush, indicating panic selling and forced margin closures.
Current Status: Price is trying to bounce off the $67,449 swing low, but moving averages are steep overhead resistance.
🎯 Key Levels to Watch👀
Immediate Resistance: $70,000 – $70,037 Former support flipped to major supply 🧱
Dynamic MA(5) Resistance: ~$68,800 🛑
* Current Price Action Zone: $68,174 ⚡
* Critical Support Floor: $67,449 Recent flash crash low 🟢
🔥 When liquidations cascade past $750M, short-term volatility spikes significantly. While an oversold relief bounce is always possible after such a steep drop, the immediate market structure favors caution 🌐📉.
Are we seeing the ultimate flush before a reversal, or is a deeper test of support incoming? Drop your read below! 👇
$BTC
#HuangExitNvidiaStrategyInFocus #btcdown
#BANTEEX
The market just experienced a brutal correction as Bitcoin sliced through the psychological $70,000 level for the first time since August, plunging down to a local low near $67,449 before attempting to stabilize around $68,174 -7.31% on the day🌐.
The cascading sell off triggered a massive flush in the derivatives market, wiping out over $750 million in long liquidations over the past 24 hours 📊.
What the Chart Tells Us 🔍
After failing to sustain momentum near the $74,771 high, price action broke down violently, slicing straight through moving average supports.
Volume Spike: The 1h chart shows massive red volume bars accompanying the flush, indicating panic selling and forced margin closures.
Current Status: Price is trying to bounce off the $67,449 swing low, but moving averages are steep overhead resistance.
🎯 Key Levels to Watch👀
Immediate Resistance: $70,000 – $70,037 Former support flipped to major supply 🧱
Dynamic MA(5) Resistance: ~$68,800 🛑
* Current Price Action Zone: $68,174 ⚡
* Critical Support Floor: $67,449 Recent flash crash low 🟢
🔥 When liquidations cascade past $750M, short-term volatility spikes significantly. While an oversold relief bounce is always possible after such a steep drop, the immediate market structure favors caution 🌐📉.
Are we seeing the ultimate flush before a reversal, or is a deeper test of support incoming? Drop your read below! 👇
$BTC
#HuangExitNvidiaStrategyInFocus #btcdown
#BANTEEX

100
·
--
Bullish
$DODOX Vertical Breakout Real Buying or Thin Order Book? 📊
{future}(DODOXUSDT)
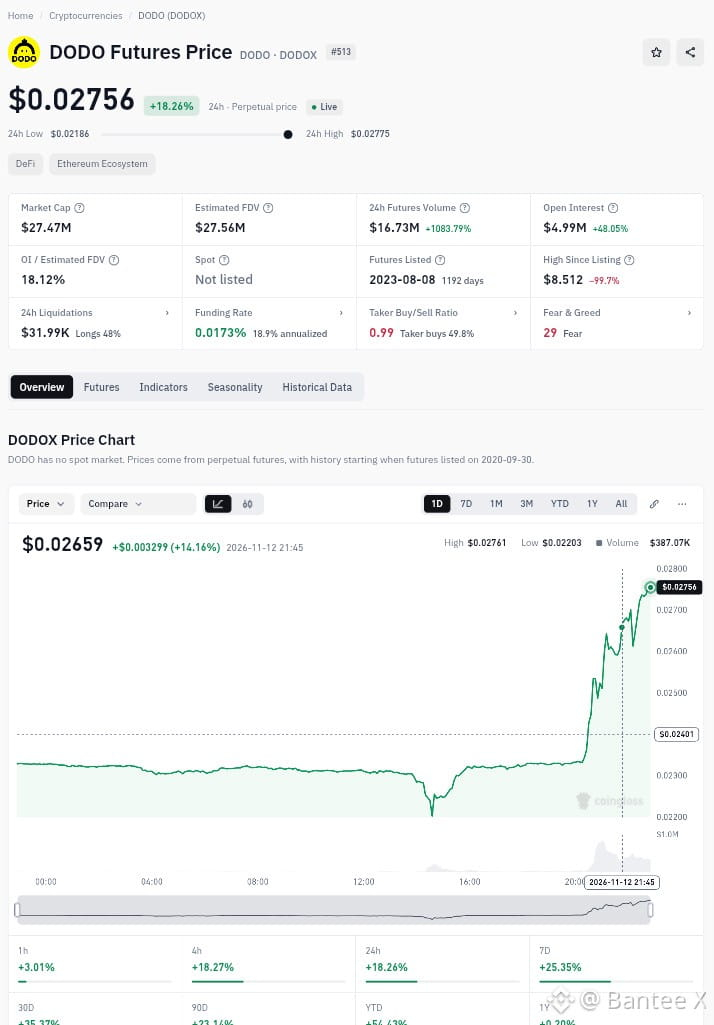
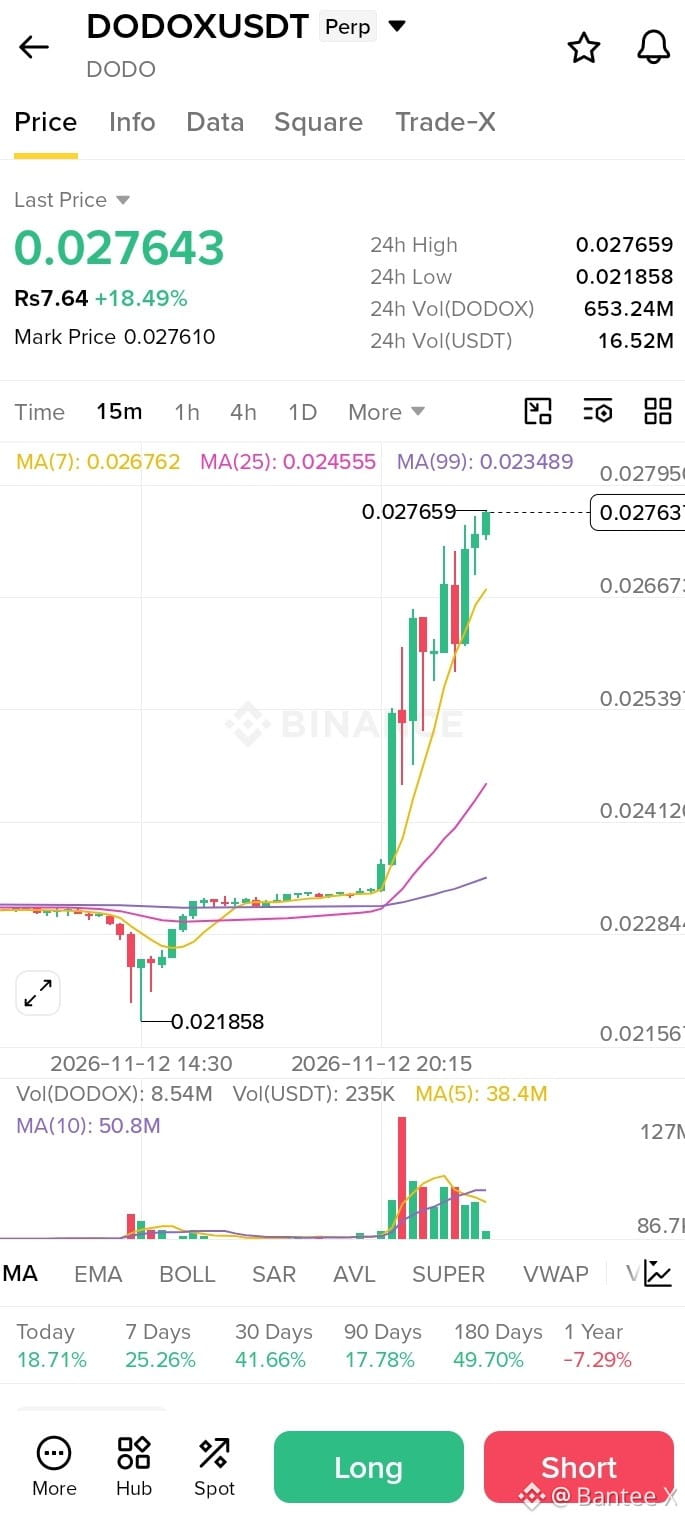
so DODOX is making massive waves with an impressive +18.26% surge in 24 hours, currently trading at $0.02756 after a breakout from its previous $0.0230–$0.0240 range 🌐. But beneath the green candles, we need to look closer at market mechanics 🧠.
The Bullish Case Why it pumped📈 🟢
Healthy Funding Rate: Funding sits low at 0.0173% 18.9% annualized, proving that longs are not overcrowded 🛡️.
Organic Buying: Total liquidations are minimal at just $31.99K, indicating this wasn't a forced short squeeze, but actual fresh capital entering the market 📈.
Volume Expansion: Futures volume exploded by over +1,083% alongside a +48% increase in Open Interest 4.99).
The Hidden Risks What to watch out for⚠️
No Spot Market: DODOX trades entirely on futures, meaning a thin order book can be easily manipulated by concentrated capital 📉.
Balanced Taker Ratio: The Taker Buy/Sell ratio sits at 0.99, showing that despite an 18% price hike, market buying remained balanced—classic behavior of a thin order book where price slips higher easily.
Macro Sentiment: With the Fear & Greed Index at 29 (extreme fear), this token is pumping against the broader market trend.
📍 Key Levels & Execution Plan 👀
Immediate Resistance: $0.02775 24h high
Next Target: $0.0300 🎯
Breakout Support Base: $0.0240 | Deeper Supports: $0.0230, $0.0220 🛡️
⚡ Trade Setup:
Long Momentum : Wait for a healthy retest around $0.0240–$0.0245. Stop loss below $0.0228, targeting $0.0278 and $0.0300. Avoid chasing directly at resistance! 🚀
Shortn if Reversal happen:Only consider if price rejects hard at $0.0278 – $0.0285 on declining volume. Stop loss above $0.0295, targeting $0.0240.
Invalidation ⛔ A 4H close below $0.0240 invalidates the breakout setup 🛑.
Manage your leverage tightly and protect your capital! What’s your play on DODOX, BanteeX family? Drop your thoughts below! 👇
#DODOX #CryptoAnalysis #DODOX/USDT #USJoblessClaimsRise
$DODOX Vertical Breakout Real Buying or Thin Order Book? 📊
so DODOX is making massive waves with an impressive +18.26% surge in 24 hours, currently trading at $0.02756 after a breakout from its previous $0.0230–$0.0240 range 🌐. But beneath the green candles, we need to look closer at market mechanics 🧠.
The Bullish Case Why it pumped📈 🟢
Healthy Funding Rate: Funding sits low at 0.0173% 18.9% annualized, proving that longs are not overcrowded 🛡️.
Organic Buying: Total liquidations are minimal at just $31.99K, indicating this wasn't a forced short squeeze, but actual fresh capital entering the market 📈.
Volume Expansion: Futures volume exploded by over +1,083% alongside a +48% increase in Open Interest 4.99).
The Hidden Risks What to watch out for⚠️
No Spot Market: DODOX trades entirely on futures, meaning a thin order book can be easily manipulated by concentrated capital 📉.
Balanced Taker Ratio: The Taker Buy/Sell ratio sits at 0.99, showing that despite an 18% price hike, market buying remained balanced—classic behavior of a thin order book where price slips higher easily.
Macro Sentiment: With the Fear & Greed Index at 29 (extreme fear), this token is pumping against the broader market trend.
📍 Key Levels & Execution Plan 👀
Immediate Resistance: $0.02775 24h high
Next Target: $0.0300 🎯
Breakout Support Base: $0.0240 | Deeper Supports: $0.0230, $0.0220 🛡️
⚡ Trade Setup:
Long Momentum : Wait for a healthy retest around $0.0240–$0.0245. Stop loss below $0.0228, targeting $0.0278 and $0.0300. Avoid chasing directly at resistance! 🚀
Shortn if Reversal happen:Only consider if price rejects hard at $0.0278 – $0.0285 on declining volume. Stop loss above $0.0295, targeting $0.0240.
Invalidation ⛔ A 4H close below $0.0240 invalidates the breakout setup 🛑.
Manage your leverage tightly and protect your capital! What’s your play on DODOX, BanteeX family? Drop your thoughts below! 👇
#DODOX #CryptoAnalysis #DODOX/USDT #USJoblessClaimsRise
so DODOX is making massive waves with an impressive +18.26% surge in 24 hours, currently trading at $0.02756 after a breakout from its previous $0.0230–$0.0240 range 🌐. But beneath the green candles, we need to look closer at market mechanics 🧠.
The Bullish Case Why it pumped📈 🟢
Healthy Funding Rate: Funding sits low at 0.0173% 18.9% annualized, proving that longs are not overcrowded 🛡️.
Organic Buying: Total liquidations are minimal at just $31.99K, indicating this wasn't a forced short squeeze, but actual fresh capital entering the market 📈.
Volume Expansion: Futures volume exploded by over +1,083% alongside a +48% increase in Open Interest 4.99).
The Hidden Risks What to watch out for⚠️
No Spot Market: DODOX trades entirely on futures, meaning a thin order book can be easily manipulated by concentrated capital 📉.
Balanced Taker Ratio: The Taker Buy/Sell ratio sits at 0.99, showing that despite an 18% price hike, market buying remained balanced—classic behavior of a thin order book where price slips higher easily.
Macro Sentiment: With the Fear & Greed Index at 29 (extreme fear), this token is pumping against the broader market trend.
📍 Key Levels & Execution Plan 👀
Immediate Resistance: $0.02775 24h high
Next Target: $0.0300 🎯
Breakout Support Base: $0.0240 | Deeper Supports: $0.0230, $0.0220 🛡️
⚡ Trade Setup:
Long Momentum : Wait for a healthy retest around $0.0240–$0.0245. Stop loss below $0.0228, targeting $0.0278 and $0.0300. Avoid chasing directly at resistance! 🚀
Shortn if Reversal happen:Only consider if price rejects hard at $0.0278 – $0.0285 on declining volume. Stop loss above $0.0295, targeting $0.0240.
Invalidation ⛔ A 4H close below $0.0240 invalidates the breakout setup 🛑.
Manage your leverage tightly and protect your capital! What’s your play on DODOX, BanteeX family? Drop your thoughts below! 👇
#DODOX #CryptoAnalysis #DODOX/USDT #USJoblessClaimsRise
127
·
--
Bearish
The crypto and stock markets are buzzing after rumors of Jensen Huang resigning from Nvidia. $NVDAB
{spot}(NVDABUSDT)
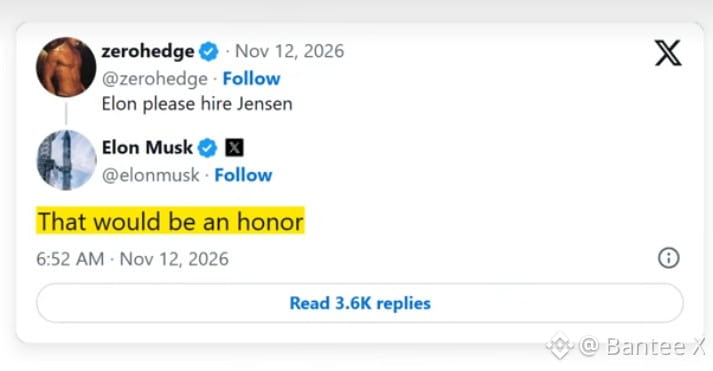
But before we panic, remember who this man is. Someone once asked Elon Musk, "Why don't you hire Jensen Huang?"
Musk’s reply? "It would be my honor."
Just think about that level of respect. Huang built Nvidia from a Denny's table in 1993 into a $5 trillion powerhouse. He cleaned toilets and washed dishes before changing the world with AI. Whether this news is real or just market panic, his legacy is unmatched. 👑💎
[One more interesting thing 👀](https://app.binance.com/uni-qr/cpos/34641024514217?r=BUW1XT3I&l=en&uco=R9Ayef6ik-DPyVzc08jqcg&uc=app_square_share_link&us=copylink)
#HuangExitNvidiaStrategyInFocus #ChipStocksExtendLossesAfterNvidiaCEOChange
The crypto and stock markets are buzzing after rumors of Jensen Huang resigning from Nvidia. $NVDAB
But before we panic, remember who this man is. Someone once asked Elon Musk, "Why don't you hire Jensen Huang?"
Musk’s reply? "It would be my honor."
Just think about that level of respect. Huang built Nvidia from a Denny's table in 1993 into a $5 trillion powerhouse. He cleaned toilets and washed dishes before changing the world with AI. Whether this news is real or just market panic, his legacy is unmatched. 👑💎
One more interesting thing 👀
#HuangExitNvidiaStrategyInFocus #ChipStocksExtendLossesAfterNvidiaCEOChange
But before we panic, remember who this man is. Someone once asked Elon Musk, "Why don't you hire Jensen Huang?"
Musk’s reply? "It would be my honor."
Just think about that level of respect. Huang built Nvidia from a Denny's table in 1993 into a $5 trillion powerhouse. He cleaned toilets and washed dishes before changing the world with AI. Whether this news is real or just market panic, his legacy is unmatched. 👑💎
One more interesting thing 👀
#HuangExitNvidiaStrategyInFocus #ChipStocksExtendLossesAfterNvidiaCEOChange
221
·
--
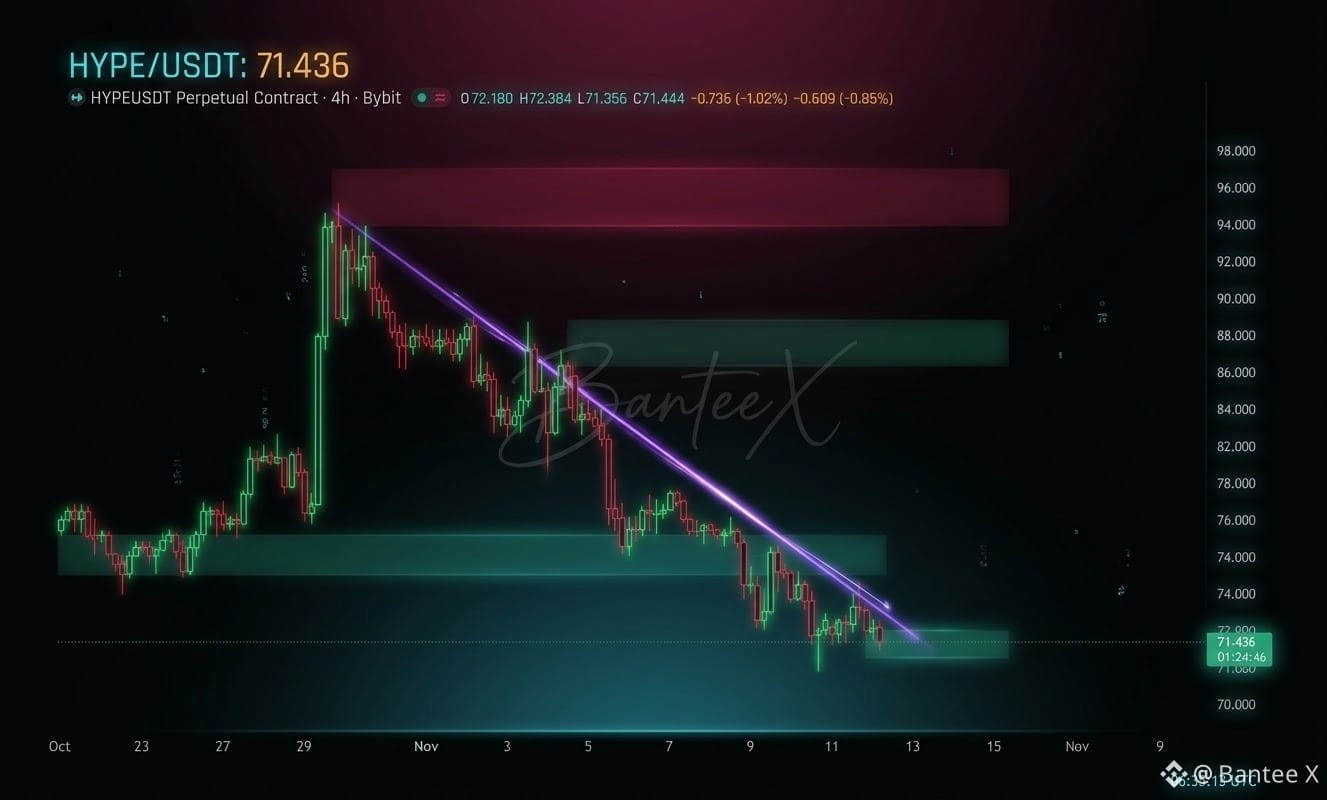
$HYPE Now trading around $71.44,HYPE is pressing directly into a major inflection point that will dictate its next directional move 🧠.
Since rejecting the $97 region, $HYPE has sliced through multiple historical support levels. While substantial downside liquidity has already been swept, bulls have yet to show the conviction needed to confirm a true trend reversal 🛡️. Price is now converging right at the $70–$72 demand zone as the descending trendline squeezes overhead resistance.
The $70–$72 i turning point
With price compressing between horizontal demand and trendline resistance, two clear paths are on the table:
Bullish Breakout If buyers defend $70–$72 and force a high volume 4H close above the descending trendline, we look for an immediate reclaim of $72.60, opening the door for a recovery toward $75–$76 and eventually $78 🚀.
If sellers reject the trendline and push
HYPE decisively below $70, downside momentum accelerates toward the $66 region, where a key daily Fair Value Gap (FVG) sits waiting 📉.
🎯 Key Levels to Watch 👀
Major Overhead Supply: $94.00 – $97.00 🧱
Higher Resistance Zone: $86.00 – $89.00 🛑
Secondary Upside Liquidity: $78.00 – $79.00 🎯
First Recovery Resistance: $75.00 – $76.00 📈
Immediate Reclaim Trigger: $72.60 ⚡
Critical Demand Zone: $70.00 – $72.00 🟢
Downside Breakdown Target: $66.00 (Daily FVG) 🛡️
{future}(HYPEUSDT)
$HYPE has cooled off heavily from $97 and is standing at a make-or-break floor around $70–$72 🌐⚡.
Right now, patience is our strongest edge. Keep your eyes locked on two triggers: the $70 support floor and a high-volume breakout above the descending trendline 💎📈.
Let the chart confirm who takes control before executing your setup!
What’s your move, BanteeX family? Are buyers defending $70–$72 for a bounce to $78, or are we heading down to fill the $66 FVG? Drop your thoughts below! 👇
#hypeusdt
#AnthropicRejectsIPODelayValuationinQuestion #TradFiForBeginners
$HYPE Now trading around $71.44,HYPE is pressing directly into a major inflection point that will dictate its next directional move 🧠.
Since rejecting the $97 region, $HYPE has sliced through multiple historical support levels. While substantial downside liquidity has already been swept, bulls have yet to show the conviction needed to confirm a true trend reversal 🛡️. Price is now converging right at the $70–$72 demand zone as the descending trendline squeezes overhead resistance.
The $70–$72 i turning point
With price compressing between horizontal demand and trendline resistance, two clear paths are on the table:
Bullish Breakout If buyers defend $70–$72 and force a high volume 4H close above the descending trendline, we look for an immediate reclaim of $72.60, opening the door for a recovery toward $75–$76 and eventually $78 🚀.
If sellers reject the trendline and push
HYPE decisively below $70, downside momentum accelerates toward the $66 region, where a key daily Fair Value Gap (FVG) sits waiting 📉.
🎯 Key Levels to Watch 👀
Major Overhead Supply: $94.00 – $97.00 🧱
Higher Resistance Zone: $86.00 – $89.00 🛑
Secondary Upside Liquidity: $78.00 – $79.00 🎯
First Recovery Resistance: $75.00 – $76.00 📈
Immediate Reclaim Trigger: $72.60 ⚡
Critical Demand Zone: $70.00 – $72.00 🟢
Downside Breakdown Target: $66.00 (Daily FVG) 🛡️
$HYPE has cooled off heavily from $97 and is standing at a make-or-break floor around $70–$72 🌐⚡.
Right now, patience is our strongest edge. Keep your eyes locked on two triggers: the $70 support floor and a high-volume breakout above the descending trendline 💎📈.
Let the chart confirm who takes control before executing your setup!
What’s your move, BanteeX family? Are buyers defending $70–$72 for a bounce to $78, or are we heading down to fill the $66 FVG? Drop your thoughts below! 👇
#hypeusdt
#AnthropicRejectsIPODelayValuationinQuestion #TradFiForBeginners
Since rejecting the $97 region, $HYPE has sliced through multiple historical support levels. While substantial downside liquidity has already been swept, bulls have yet to show the conviction needed to confirm a true trend reversal 🛡️. Price is now converging right at the $70–$72 demand zone as the descending trendline squeezes overhead resistance.
The $70–$72 i turning point
With price compressing between horizontal demand and trendline resistance, two clear paths are on the table:
Bullish Breakout If buyers defend $70–$72 and force a high volume 4H close above the descending trendline, we look for an immediate reclaim of $72.60, opening the door for a recovery toward $75–$76 and eventually $78 🚀.
If sellers reject the trendline and push
HYPE decisively below $70, downside momentum accelerates toward the $66 region, where a key daily Fair Value Gap (FVG) sits waiting 📉.
🎯 Key Levels to Watch 👀
Major Overhead Supply: $94.00 – $97.00 🧱
Higher Resistance Zone: $86.00 – $89.00 🛑
Secondary Upside Liquidity: $78.00 – $79.00 🎯
First Recovery Resistance: $75.00 – $76.00 📈
Immediate Reclaim Trigger: $72.60 ⚡
Critical Demand Zone: $70.00 – $72.00 🟢
Downside Breakdown Target: $66.00 (Daily FVG) 🛡️
$HYPE has cooled off heavily from $97 and is standing at a make-or-break floor around $70–$72 🌐⚡.
Right now, patience is our strongest edge. Keep your eyes locked on two triggers: the $70 support floor and a high-volume breakout above the descending trendline 💎📈.
Let the chart confirm who takes control before executing your setup!
What’s your move, BanteeX family? Are buyers defending $70–$72 for a bounce to $78, or are we heading down to fill the $66 FVG? Drop your thoughts below! 👇
#hypeusdt
#AnthropicRejectsIPODelayValuationinQuestion #TradFiForBeginners
149
·
--

Article
Grayscale Launches Zcash Campaign Amid ETF Outflows and Price Drop 🌐$ZEC Zcash Breakdown Below $1,000. Is $910 the Next Target?
Zcash is going through a pretty aggressive correction after losing its three-week trading range. The price has dropped below the psychological $1,000 level, and the overall market structure is currently favoring sellers.
But there's something interesting here...
ZEC's 4H RSI has dropped to 20.6, putting the asset deeply into oversold territory. This could create room for a short-term relief bounce, although there's still no confirmed reversal signal.
Let's take a closer look at what the chart is telling us.
What happened?
For almost three weeks, ZEC was trading inside a range between $1,120 and $1,358.
Buyers tried several times to push the price above the range, but every attempt was rejected.
Eventually, on November 10, sellers took control and pushed the price below $1,120 with significant selling volume.
From the November 6 rejection, ZEC dropped approximately 29% at its lowest point, touching $961.07.
The important thing here is that the previous support around $1,120-$1,125 has now turned into a major resistance zone.
Meanwhile, Grayscale announced its nationwide Zcash advertising campaign and committed $1 million toward ecosystem development.
However, despite these positive developments, ETF outflows have continued, and the market hasn't shown any meaningful buying response yet.
Technical picture 🖼️ 4H timeframe
Right now, the structure is bearish.
A few things stand out:
RSI is sitting around 20.6, indicating extreme selling pressure.RSI remains below its average near 29.9, so momentum hasn't shifted yet.The breakdown below $1,120 happened with strong selling volume.Price has lost two Fibonacci retracement levels.
Buyers haven't managed to reclaim any significant resistance.
Yes, an RSI this low can lead to a relief bounce, but I wouldn't consider it a buying signal on its own.
I'd rather see price action confirm that buyers are actually stepping in.
Key levels I'm watching 👀
$1,120 - $1,125 - Major resistance. Previous support, now a potential selling zone.
$1,011 👉 First level bulls need to reclaim.
$961 👉 Critical support and recent swing low.
$910 👉 Next downside target if $961 breaks.
These are the levels that could determine ZEC's next move.
If ZEC breaks below $961 with a confirmed 4H candle close and selling volume continues, I would be watching for a possible move toward $910.
Rather than chasing the breakdown, I'd prefer waiting for a retest of the broken $961 area.
Potential entry retest around $961-$975.
Target 1: $940.
Target 2: $915.
Invalidation: A strong recovery above the broken level.
Buy On the other hand, if buyers defend $961 and price starts showing a strong reaction with increasing volume, we could see a short-term recovery.
For this setup, I'd want to see ZEC reclaim $1,011 first.
Confirmation: Bullish reversal around support and recovery above $1,011.
Target 1: $1,045.
Target 2: $1,080.
Target 3: $1,120-$1,125.
Invalidation: Breakdown below the confirmed swing low.
Keep in mind that this would still be a countertrend bounce unless the broader resistance levels are reclaimed.
What about the bigger picture?
Grayscale's involvement is definitely interesting from a long-term perspective.
The advertising campaign, developer funding and ETF related initiatives could help improve Zcash's visibility and adoption.
However, there's a difference between positive announcements and actual capital entering the market.
For now, ETF outflows remain a concern.
I'd be watching daily ZCSH flows closely. A shift toward consistent inflows could provide a much stronger fundamental signal.
My current view on $ZEC is 📉
{spot}(ZECUSDT)
Short term is Bearish But it's possible to bounce on 1011📈
Long term Potentially bullish, depending on adoption and capital flows.
The market is deeply oversold, but oversold conditions alone aren't enough to justify a long position.
For now, $961 is the level bulls need to defend, while $1,011 is the first recovery level I'd like to see reclaimed.
If $961 fails, $910 becomes an important downside area.
Personally, I'd rather wait for confirmation than try to catch a falling knife.
Let's see whether buyers finally step in or sellers push ZEC toward $910.
What's your take on Zcash here?
Are we looking at a potential bottom, or is another leg down still ahead?
Disclaimer: This is my personal market analysis and a potential trading scenario, not financial advice. Always manage your risk and wait for confirmation before entering a trade.
#zec #zcash #CryptoAnalysis" #ZcashFallsBelow$1000ForFirstTimeSinceSeptember
Grayscale Launches Zcash Campaign Amid ETF Outflows and Price Drop 🌐
$ZEC Zcash Breakdown Below $1,000. Is $910 the Next Target?
Zcash is going through a pretty aggressive correction after losing its three-week trading range. The price has dropped below the psychological $1,000 level, and the overall market structure is currently favoring sellers.
But there's something interesting here...
ZEC's 4H RSI has dropped to 20.6, putting the asset deeply into oversold territory. This could create room for a short-term relief bounce, although there's still no confirmed reversal signal.
Let's take a closer look at what the chart is telling us.
What happened?
For almost three weeks, ZEC was trading inside a range between $1,120 and $1,358.
Buyers tried several times to push the price above the range, but every attempt was rejected.
Eventually, on November 10, sellers took control and pushed the price below $1,120 with significant selling volume.
From the November 6 rejection, ZEC dropped approximately 29% at its lowest point, touching $961.07.
The important thing here is that the previous support around $1,120-$1,125 has now turned into a major resistance zone.
Meanwhile, Grayscale announced its nationwide Zcash advertising campaign and committed $1 million toward ecosystem development.
However, despite these positive developments, ETF outflows have continued, and the market hasn't shown any meaningful buying response yet.
Technical picture 🖼️ 4H timeframe
Right now, the structure is bearish.
A few things stand out:
RSI is sitting around 20.6, indicating extreme selling pressure.RSI remains below its average near 29.9, so momentum hasn't shifted yet.The breakdown below $1,120 happened with strong selling volume.Price has lost two Fibonacci retracement levels.
Buyers haven't managed to reclaim any significant resistance.
Yes, an RSI this low can lead to a relief bounce, but I wouldn't consider it a buying signal on its own.
I'd rather see price action confirm that buyers are actually stepping in.
Key levels I'm watching 👀
$1,120 - $1,125 - Major resistance. Previous support, now a potential selling zone.
$1,011 👉 First level bulls need to reclaim.
$961 👉 Critical support and recent swing low.
$910 👉 Next downside target if $961 breaks.
These are the levels that could determine ZEC's next move.
If ZEC breaks below $961 with a confirmed 4H candle close and selling volume continues, I would be watching for a possible move toward $910.
Rather than chasing the breakdown, I'd prefer waiting for a retest of the broken $961 area.
Potential entry retest around $961-$975.
Target 1: $940.
Target 2: $915.
Invalidation: A strong recovery above the broken level.
Buy On the other hand, if buyers defend $961 and price starts showing a strong reaction with increasing volume, we could see a short-term recovery.
For this setup, I'd want to see ZEC reclaim $1,011 first.
Confirmation: Bullish reversal around support and recovery above $1,011.
Target 1: $1,045.
Target 2: $1,080.
Target 3: $1,120-$1,125.
Invalidation: Breakdown below the confirmed swing low.
Keep in mind that this would still be a countertrend bounce unless the broader resistance levels are reclaimed.
What about the bigger picture?
Grayscale's involvement is definitely interesting from a long-term perspective.
The advertising campaign, developer funding and ETF related initiatives could help improve Zcash's visibility and adoption.
However, there's a difference between positive announcements and actual capital entering the market.
For now, ETF outflows remain a concern.
I'd be watching daily ZCSH flows closely. A shift toward consistent inflows could provide a much stronger fundamental signal.
My current view on $ZEC is 📉
Short term is Bearish But it's possible to bounce on 1011📈
Long term Potentially bullish, depending on adoption and capital flows.
The market is deeply oversold, but oversold conditions alone aren't enough to justify a long position.
For now, $961 is the level bulls need to defend, while $1,011 is the first recovery level I'd like to see reclaimed.
If $961 fails, $910 becomes an important downside area.
Personally, I'd rather wait for confirmation than try to catch a falling knife.
Let's see whether buyers finally step in or sellers push ZEC toward $910.
What's your take on Zcash here?
Are we looking at a potential bottom, or is another leg down still ahead?
Disclaimer: This is my personal market analysis and a potential trading scenario, not financial advice. Always manage your risk and wait for confirmation before entering a trade.
#zec #zcash #CryptoAnalysis" #ZcashFallsBelow$1000ForFirstTimeSinceSeptember
Zcash is going through a pretty aggressive correction after losing its three-week trading range. The price has dropped below the psychological $1,000 level, and the overall market structure is currently favoring sellers.
But there's something interesting here...
ZEC's 4H RSI has dropped to 20.6, putting the asset deeply into oversold territory. This could create room for a short-term relief bounce, although there's still no confirmed reversal signal.
Let's take a closer look at what the chart is telling us.
What happened?
For almost three weeks, ZEC was trading inside a range between $1,120 and $1,358.
Buyers tried several times to push the price above the range, but every attempt was rejected.
Eventually, on November 10, sellers took control and pushed the price below $1,120 with significant selling volume.
From the November 6 rejection, ZEC dropped approximately 29% at its lowest point, touching $961.07.
The important thing here is that the previous support around $1,120-$1,125 has now turned into a major resistance zone.
Meanwhile, Grayscale announced its nationwide Zcash advertising campaign and committed $1 million toward ecosystem development.
However, despite these positive developments, ETF outflows have continued, and the market hasn't shown any meaningful buying response yet.
Technical picture 🖼️ 4H timeframe
Right now, the structure is bearish.
A few things stand out:
RSI is sitting around 20.6, indicating extreme selling pressure.RSI remains below its average near 29.9, so momentum hasn't shifted yet.The breakdown below $1,120 happened with strong selling volume.Price has lost two Fibonacci retracement levels.
Buyers haven't managed to reclaim any significant resistance.
Yes, an RSI this low can lead to a relief bounce, but I wouldn't consider it a buying signal on its own.
I'd rather see price action confirm that buyers are actually stepping in.
Key levels I'm watching 👀
$1,120 - $1,125 - Major resistance. Previous support, now a potential selling zone.
$1,011 👉 First level bulls need to reclaim.
$961 👉 Critical support and recent swing low.
$910 👉 Next downside target if $961 breaks.
These are the levels that could determine ZEC's next move.
If ZEC breaks below $961 with a confirmed 4H candle close and selling volume continues, I would be watching for a possible move toward $910.
Rather than chasing the breakdown, I'd prefer waiting for a retest of the broken $961 area.
Potential entry retest around $961-$975.
Target 1: $940.
Target 2: $915.
Invalidation: A strong recovery above the broken level.
Buy On the other hand, if buyers defend $961 and price starts showing a strong reaction with increasing volume, we could see a short-term recovery.
For this setup, I'd want to see ZEC reclaim $1,011 first.
Confirmation: Bullish reversal around support and recovery above $1,011.
Target 1: $1,045.
Target 2: $1,080.
Target 3: $1,120-$1,125.
Invalidation: Breakdown below the confirmed swing low.
Keep in mind that this would still be a countertrend bounce unless the broader resistance levels are reclaimed.
What about the bigger picture?
Grayscale's involvement is definitely interesting from a long-term perspective.
The advertising campaign, developer funding and ETF related initiatives could help improve Zcash's visibility and adoption.
However, there's a difference between positive announcements and actual capital entering the market.
For now, ETF outflows remain a concern.
I'd be watching daily ZCSH flows closely. A shift toward consistent inflows could provide a much stronger fundamental signal.
My current view on $ZEC is 📉
Short term is Bearish But it's possible to bounce on 1011📈
Long term Potentially bullish, depending on adoption and capital flows.
The market is deeply oversold, but oversold conditions alone aren't enough to justify a long position.
For now, $961 is the level bulls need to defend, while $1,011 is the first recovery level I'd like to see reclaimed.
If $961 fails, $910 becomes an important downside area.
Personally, I'd rather wait for confirmation than try to catch a falling knife.
Let's see whether buyers finally step in or sellers push ZEC toward $910.
What's your take on Zcash here?
Are we looking at a potential bottom, or is another leg down still ahead?
Disclaimer: This is my personal market analysis and a potential trading scenario, not financial advice. Always manage your risk and wait for confirmation before entering a trade.
#zec #zcash #CryptoAnalysis" #ZcashFallsBelow$1000ForFirstTimeSinceSeptember
486
·
--
Bearish
What do you think guys? 🤔
$ZEC is touching this support zone for the 3rd time now Support: $1,127 ❓
📍 Resistance: $1,375 – $1,400
📍 Mid resistance: $1,280 – $1,290
ZEC has been trading inside this range for a long time. Every time price comes to this level, it bounces. But the more a level gets tested, the weaker it becomes. 👀
In my view, this one can break. Below this support, a lot of liquidity has probably built up, and the market loves to go and grab it. 💧
If price holds $1,127 and shows a strong Bounce reaction, a move back towards $1,280 and then $1,375 is possible.
But If a 4H candle closes below $1,127, liquidity gets swept and the next target is the $1,080 – $1,040 zone.
⚠️ Don't catch the knife. Wait for confirmation o a 4H close or a clear reaction. Don't enter on emotions. 🎯
What's your view, bounce or break? Comment below 👇
#CPITestsDecemberRateOutlook
{future}(ZECUSDT)
#ZECUSDT
Not financial advice. DYOR.
What do you think guys? 🤔
$ZEC is touching this support zone for the 3rd time now Support: $1,127 ❓
📍 Resistance: $1,375 – $1,400
📍 Mid resistance: $1,280 – $1,290
ZEC has been trading inside this range for a long time. Every time price comes to this level, it bounces. But the more a level gets tested, the weaker it becomes. 👀
In my view, this one can break. Below this support, a lot of liquidity has probably built up, and the market loves to go and grab it. 💧
If price holds $1,127 and shows a strong Bounce reaction, a move back towards $1,280 and then $1,375 is possible.
But If a 4H candle closes below $1,127, liquidity gets swept and the next target is the $1,080 – $1,040 zone.
⚠️ Don't catch the knife. Wait for confirmation o a 4H close or a clear reaction. Don't enter on emotions. 🎯
What's your view, bounce or break? Comment below 👇
#CPITestsDecemberRateOutlook
#ZECUSDT
Not financial advice. DYOR.
$ZEC is touching this support zone for the 3rd time now Support: $1,127 ❓
📍 Resistance: $1,375 – $1,400
📍 Mid resistance: $1,280 – $1,290
ZEC has been trading inside this range for a long time. Every time price comes to this level, it bounces. But the more a level gets tested, the weaker it becomes. 👀
In my view, this one can break. Below this support, a lot of liquidity has probably built up, and the market loves to go and grab it. 💧
If price holds $1,127 and shows a strong Bounce reaction, a move back towards $1,280 and then $1,375 is possible.
But If a 4H candle closes below $1,127, liquidity gets swept and the next target is the $1,080 – $1,040 zone.
⚠️ Don't catch the knife. Wait for confirmation o a 4H close or a clear reaction. Don't enter on emotions. 🎯
What's your view, bounce or break? Comment below 👇
#CPITestsDecemberRateOutlook
#ZECUSDT
Not financial advice. DYOR.
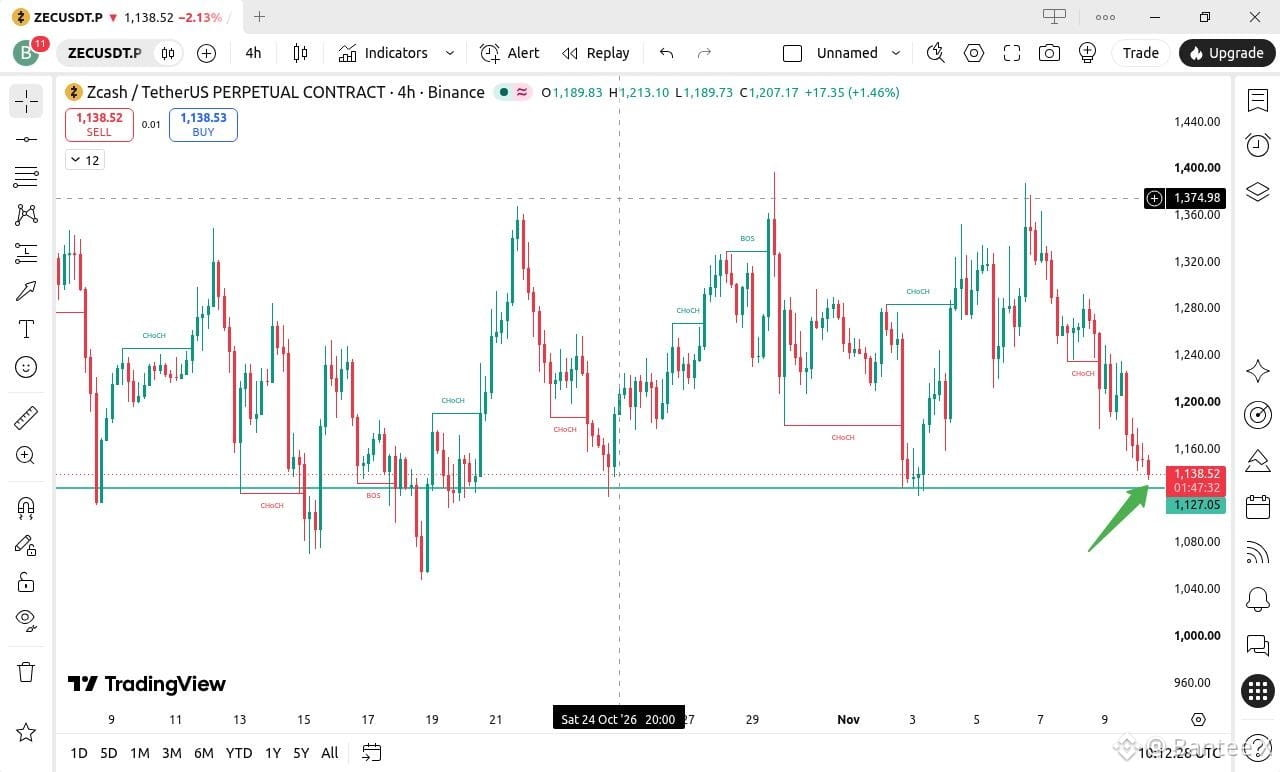
186
·
--
Bullish
$INIT has delivered a massive run from $0.130 to $0.220 and is now testing trader patience at the $0.200 support pivot 🌐⚡.
Avoid FOMO at resistance zones waiting for price to confirm a hold above $0.200 or waiting for a clean breakout past $0.237 provides a far safer risk to reward ratio 💎📈.
Keep your risk strictly defined and stay disciplined!
What's your read, BanteeX family? Are we bouncing off $0.200 for another run to $0.237, or pulling back deeper to $0.180 first? Drop your thoughts below! 👇
{spot}(INITUSDT)
#INIT #initusdt #CryptoAnalysis
$INIT has delivered a massive run from $0.130 to $0.220 and is now testing trader patience at the $0.200 support pivot 🌐⚡.
Avoid FOMO at resistance zones waiting for price to confirm a hold above $0.200 or waiting for a clean breakout past $0.237 provides a far safer risk to reward ratio 💎📈.
Keep your risk strictly defined and stay disciplined!
What's your read, BanteeX family? Are we bouncing off $0.200 for another run to $0.237, or pulling back deeper to $0.180 first? Drop your thoughts below! 👇
#INIT #initusdt #CryptoAnalysis
Avoid FOMO at resistance zones waiting for price to confirm a hold above $0.200 or waiting for a clean breakout past $0.237 provides a far safer risk to reward ratio 💎📈.
Keep your risk strictly defined and stay disciplined!
What's your read, BanteeX family? Are we bouncing off $0.200 for another run to $0.237, or pulling back deeper to $0.180 first? Drop your thoughts below! 👇
#INIT #initusdt #CryptoAnalysis
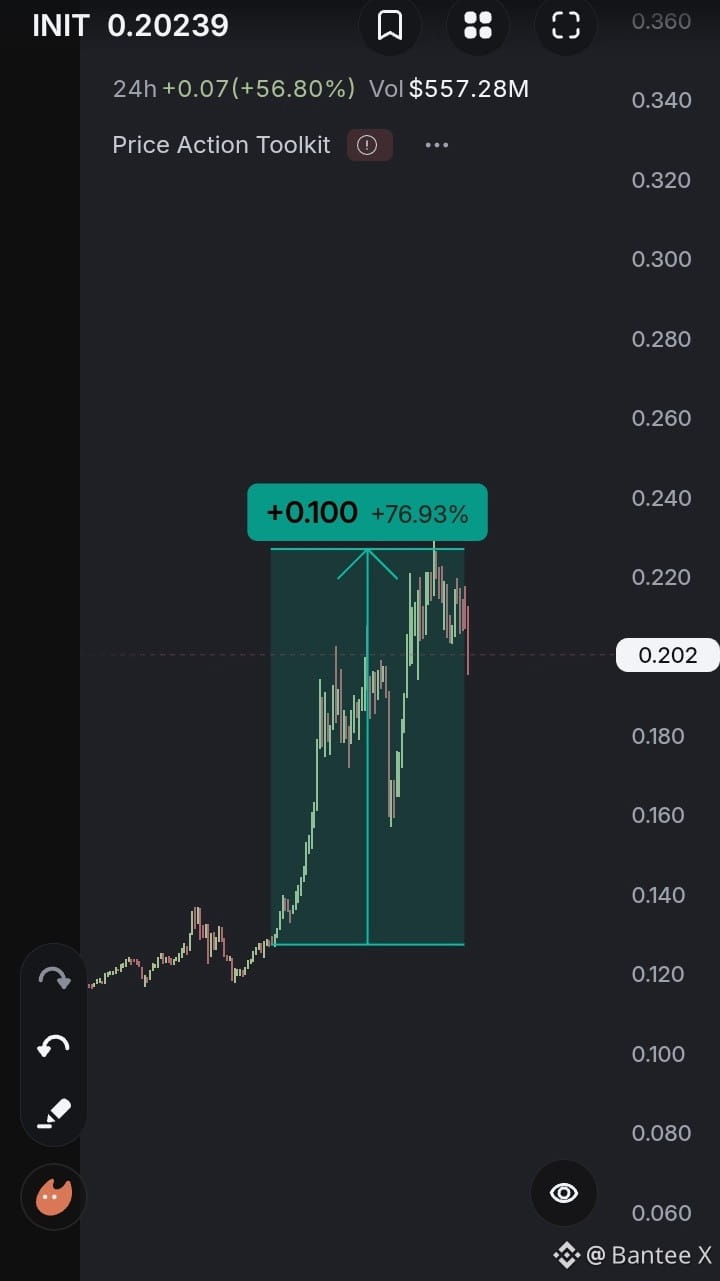
315
·
--

Article
Navigating Post Breakout Fatigue and Key Technical LevelsAfter a robust 19% rally from its mid-August lows, Bitcoin is currently experiencing post-breakout fatigue. Trading at approximately $74,584 on Tuesday morning, the leading cryptocurrency has broken below its rising trend channel and is now testing critical support zones.
For traders and investors, the current market structure demands patience. Here is a comprehensive breakdown of the technical setup, the scenarios that will dictate Bitcoin’s next major move, and the macroeconomic catalysts on the horizon.
The Technical Setup is Testing Critical Support
Bitcoin’s recent pullback has brought the price down to the 200 day moving average at $73,139, stabilizing just above the crucial 2025 low of $74,421.
While the weekly and quarterly charts still reflect an established broader uptrend forming a rounding bottom pattern for 2026 the short term momentum has clearly stalled. The price is currently trapped below key moving averages, including the 100-day ($77,526) and 20-day ($78,119) lines. Until Bitcoin can reclaim the $78,000 level, downward pressure remains a distinct possibility.
The Playbook is Three Scenarios to Watch
In technical analysis, reacting to price action is more reliable than predicting it. Based on daily closing prices, we have defined three distinct scenarios:
The Bullish Scenario Breakout:
A daily close above the September high at $87,397 would invalidate the current fatigue and trigger a new long-term buy signal. If this level is cleared, the immediate target shifts to the 2026 yearly high of $97,964.
🟡 The Current Status :
As long as daily closes remain between the previous week’s low ($73,477) and the September high $87,397 , the market is in a consolidation phase. Monday’s close at $75,258 keeps us firmly in this "wait and see" territory.
🔴 The Bearish Scenario Breakdown :
A daily close below $73,477 would signal that the recent rally is over. This would open the door to deeper corrections, targeting the $72,000 zone and potentially retesting the 2021 all-time high of $69,000 acting as support.
Macro Catalysts and Market Sentiment
Beyond the charts, Bitcoin remains highly sensitive to macroeconomic data and institutional flows. This week, the primary catalyst is the US Consumer Price Index (CPI) data. Looking ahead, the US Jobs Report on December 4 will be the next major volatility trigger.
Additionally, the market is still digesting the late October Binance security incident. While Binance has restored most withdrawals and updated its proof of reserves, the speed of full network recovery will continue to test overall crypto market sentiment.
The Long Term View: Institutional Optimism Remains
Despite short term technical fatigue, the broader institutional outlook for the end of 2026 remains highly optimistic. Recent revisions from major financial institutions show a bullish consensus:
Fundstrat (Tom Lee): $200,000 – $250,000 JPMorgan: $150,000 – $170,000 Bernstein: $125,000 Citigroup: $113,000 12-month target
These targets are driven by valuation models and expected ETF inflows, contrasting with the short term erm technical consolidation we see on the daily charts.
Bitcoin is at a technical crossroads. The broader uptrend is intact on the weekly timeframe, but short-term fatigue requires a defensive posture. Traders should monitor the $73,477 support and $87,397 resistance levels closely. Until a daily close breaks these boundaries, the market is telling us to wait for a clear directional signal 👀 $BTC
{future}(BTCUSDT)
#BitcoinFiveWeeklyLosses #LongTermGain
Navigating Post Breakout Fatigue and Key Technical Levels
After a robust 19% rally from its mid-August lows, Bitcoin is currently experiencing post-breakout fatigue. Trading at approximately $74,584 on Tuesday morning, the leading cryptocurrency has broken below its rising trend channel and is now testing critical support zones.
For traders and investors, the current market structure demands patience. Here is a comprehensive breakdown of the technical setup, the scenarios that will dictate Bitcoin’s next major move, and the macroeconomic catalysts on the horizon.
The Technical Setup is Testing Critical Support
Bitcoin’s recent pullback has brought the price down to the 200 day moving average at $73,139, stabilizing just above the crucial 2025 low of $74,421.
While the weekly and quarterly charts still reflect an established broader uptrend forming a rounding bottom pattern for 2026 the short term momentum has clearly stalled. The price is currently trapped below key moving averages, including the 100-day ($77,526) and 20-day ($78,119) lines. Until Bitcoin can reclaim the $78,000 level, downward pressure remains a distinct possibility.
The Playbook is Three Scenarios to Watch
In technical analysis, reacting to price action is more reliable than predicting it. Based on daily closing prices, we have defined three distinct scenarios:
The Bullish Scenario Breakout:
A daily close above the September high at $87,397 would invalidate the current fatigue and trigger a new long-term buy signal. If this level is cleared, the immediate target shifts to the 2026 yearly high of $97,964.
🟡 The Current Status :
As long as daily closes remain between the previous week’s low ($73,477) and the September high $87,397 , the market is in a consolidation phase. Monday’s close at $75,258 keeps us firmly in this "wait and see" territory.
🔴 The Bearish Scenario Breakdown :
A daily close below $73,477 would signal that the recent rally is over. This would open the door to deeper corrections, targeting the $72,000 zone and potentially retesting the 2021 all-time high of $69,000 acting as support.
Macro Catalysts and Market Sentiment
Beyond the charts, Bitcoin remains highly sensitive to macroeconomic data and institutional flows. This week, the primary catalyst is the US Consumer Price Index (CPI) data. Looking ahead, the US Jobs Report on December 4 will be the next major volatility trigger.
Additionally, the market is still digesting the late October Binance security incident. While Binance has restored most withdrawals and updated its proof of reserves, the speed of full network recovery will continue to test overall crypto market sentiment.
The Long Term View: Institutional Optimism Remains
Despite short term technical fatigue, the broader institutional outlook for the end of 2026 remains highly optimistic. Recent revisions from major financial institutions show a bullish consensus:
Fundstrat (Tom Lee): $200,000 – $250,000 JPMorgan: $150,000 – $170,000 Bernstein: $125,000 Citigroup: $113,000 12-month target
These targets are driven by valuation models and expected ETF inflows, contrasting with the short term erm technical consolidation we see on the daily charts.
Bitcoin is at a technical crossroads. The broader uptrend is intact on the weekly timeframe, but short-term fatigue requires a defensive posture. Traders should monitor the $73,477 support and $87,397 resistance levels closely. Until a daily close breaks these boundaries, the market is telling us to wait for a clear directional signal 👀 $BTC
#BitcoinFiveWeeklyLosses #LongTermGain
For traders and investors, the current market structure demands patience. Here is a comprehensive breakdown of the technical setup, the scenarios that will dictate Bitcoin’s next major move, and the macroeconomic catalysts on the horizon.
The Technical Setup is Testing Critical Support
Bitcoin’s recent pullback has brought the price down to the 200 day moving average at $73,139, stabilizing just above the crucial 2025 low of $74,421.
While the weekly and quarterly charts still reflect an established broader uptrend forming a rounding bottom pattern for 2026 the short term momentum has clearly stalled. The price is currently trapped below key moving averages, including the 100-day ($77,526) and 20-day ($78,119) lines. Until Bitcoin can reclaim the $78,000 level, downward pressure remains a distinct possibility.
The Playbook is Three Scenarios to Watch
In technical analysis, reacting to price action is more reliable than predicting it. Based on daily closing prices, we have defined three distinct scenarios:
The Bullish Scenario Breakout:
A daily close above the September high at $87,397 would invalidate the current fatigue and trigger a new long-term buy signal. If this level is cleared, the immediate target shifts to the 2026 yearly high of $97,964.
🟡 The Current Status :
As long as daily closes remain between the previous week’s low ($73,477) and the September high $87,397 , the market is in a consolidation phase. Monday’s close at $75,258 keeps us firmly in this "wait and see" territory.
🔴 The Bearish Scenario Breakdown :
A daily close below $73,477 would signal that the recent rally is over. This would open the door to deeper corrections, targeting the $72,000 zone and potentially retesting the 2021 all-time high of $69,000 acting as support.
Macro Catalysts and Market Sentiment
Beyond the charts, Bitcoin remains highly sensitive to macroeconomic data and institutional flows. This week, the primary catalyst is the US Consumer Price Index (CPI) data. Looking ahead, the US Jobs Report on December 4 will be the next major volatility trigger.
Additionally, the market is still digesting the late October Binance security incident. While Binance has restored most withdrawals and updated its proof of reserves, the speed of full network recovery will continue to test overall crypto market sentiment.
The Long Term View: Institutional Optimism Remains
Despite short term technical fatigue, the broader institutional outlook for the end of 2026 remains highly optimistic. Recent revisions from major financial institutions show a bullish consensus:
Fundstrat (Tom Lee): $200,000 – $250,000 JPMorgan: $150,000 – $170,000 Bernstein: $125,000 Citigroup: $113,000 12-month target
These targets are driven by valuation models and expected ETF inflows, contrasting with the short term erm technical consolidation we see on the daily charts.
Bitcoin is at a technical crossroads. The broader uptrend is intact on the weekly timeframe, but short-term fatigue requires a defensive posture. Traders should monitor the $73,477 support and $87,397 resistance levels closely. Until a daily close breaks these boundaries, the market is telling us to wait for a clear directional signal 👀 $BTC
#BitcoinFiveWeeklyLosses #LongTermGain
1
357
·
--
🚨 MICHAEL SAYLOR IS BUYING MORE BITCOIN!
His “Connecting the dots” post sparked speculation, and Strategy has now confirmed another purchase of 1,036 BTC worth approximately $81.9M, taking its total holdings to 850,364 $BTC . Interestingly, this comes while Bitcoin is trading around the company's average acquisition cost of $75,456. Despite market pressure, Strategy continues accumulating. Is this a sign of long-term conviction or a risky bet during volatility?
What’s your take, BANTEEX family? 👀
{future}(BTCUSDT)
#BitcoinFiveWeeklyLosses #MichaelSaylorBTC #strategy
🚨 MICHAEL SAYLOR IS BUYING MORE BITCOIN!
His “Connecting the dots” post sparked speculation, and Strategy has now confirmed another purchase of 1,036 BTC worth approximately $81.9M, taking its total holdings to 850,364 $BTC . Interestingly, this comes while Bitcoin is trading around the company's average acquisition cost of $75,456. Despite market pressure, Strategy continues accumulating. Is this a sign of long-term conviction or a risky bet during volatility?
What’s your take, BANTEEX family? 👀
#BitcoinFiveWeeklyLosses #MichaelSaylorBTC #strategy
His “Connecting the dots” post sparked speculation, and Strategy has now confirmed another purchase of 1,036 BTC worth approximately $81.9M, taking its total holdings to 850,364 $BTC . Interestingly, this comes while Bitcoin is trading around the company's average acquisition cost of $75,456. Despite market pressure, Strategy continues accumulating. Is this a sign of long-term conviction or a risky bet during volatility?
What’s your take, BANTEEX family? 👀
#BitcoinFiveWeeklyLosses #MichaelSaylorBTC #strategy
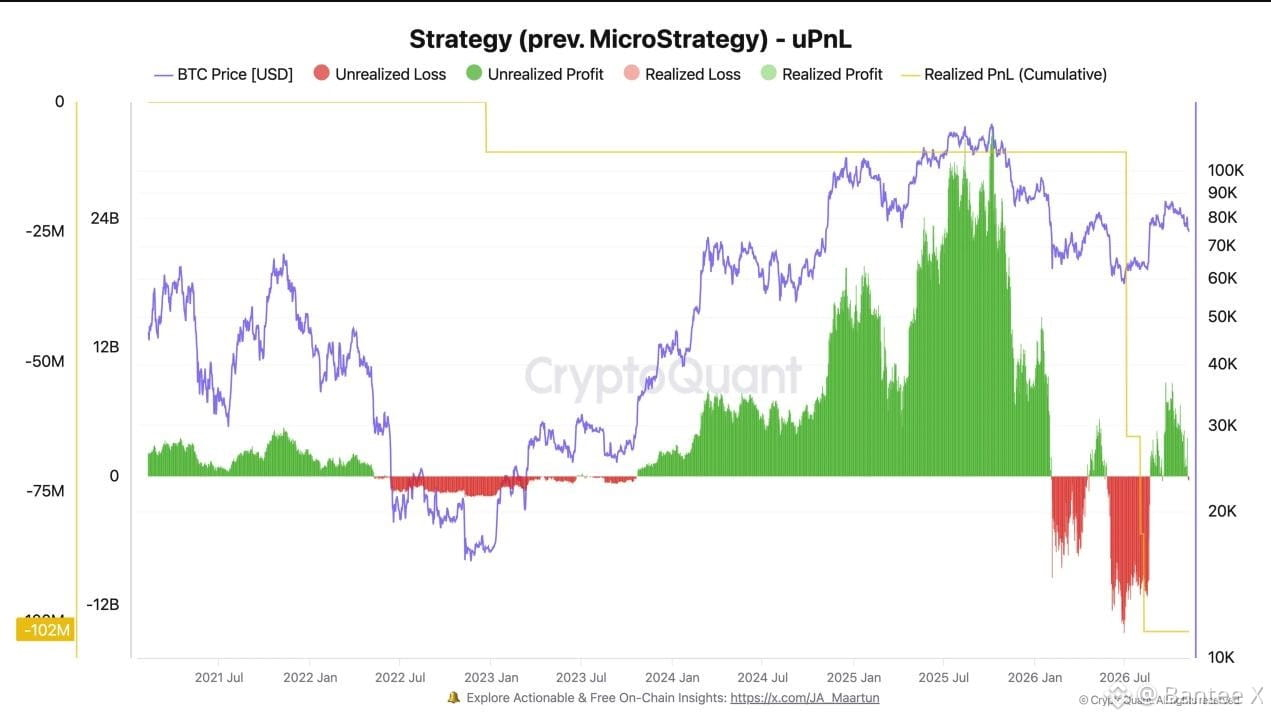

101
·
--
🚀 BNB Chain Takes the Crown in Daily Blockchain Activity! 👑
$BNB Chain is making serious moves! 🔥
{future}(BNBUSDT)
The network has recorded 4.86 MILLION daily active addresses, securing the #1 position among public blockchains.
📊 Here's how the competition looks:
🥇 BNB Chain: 4.86M
🥈 Solana: 1.97M
🥉 Ethereum: 535K
🔹 Base: 312K
💥 That's approximately 2.5x Solana's activity and 9x Ethereum's!
And here's what's interesting: BNB is showing massive network activity while its token trades around $684.
Is BNB Chain becoming the king of on chain activity? 👀
#bnb #BNBChain #Crypto #blockchain
🚀 BNB Chain Takes the Crown in Daily Blockchain Activity! 👑
$BNB Chain is making serious moves! 🔥
The network has recorded 4.86 MILLION daily active addresses, securing the #1 position among public blockchains.
📊 Here's how the competition looks:
🥇 BNB Chain: 4.86M
🥈 Solana: 1.97M
🥉 Ethereum: 535K
🔹 Base: 312K
💥 That's approximately 2.5x Solana's activity and 9x Ethereum's!
And here's what's interesting: BNB is showing massive network activity while its token trades around $684.
Is BNB Chain becoming the king of on chain activity? 👀
#bnb #BNBChain #Crypto #blockchain
$BNB Chain is making serious moves! 🔥
The network has recorded 4.86 MILLION daily active addresses, securing the #1 position among public blockchains.
📊 Here's how the competition looks:
🥇 BNB Chain: 4.86M
🥈 Solana: 1.97M
🥉 Ethereum: 535K
🔹 Base: 312K
💥 That's approximately 2.5x Solana's activity and 9x Ethereum's!
And here's what's interesting: BNB is showing massive network activity while its token trades around $684.
Is BNB Chain becoming the king of on chain activity? 👀
#bnb #BNBChain #Crypto #blockchain
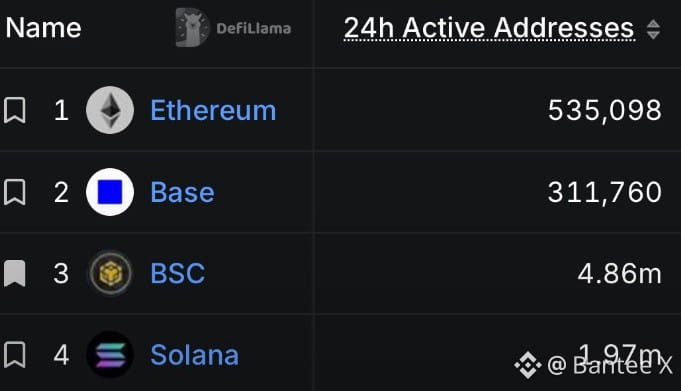
66
·
--
Verified
🚀 $HYPE After falling from its $97 – $98 high, HYPE is now trying to stabilize around the $72–$75 support zone. The upcoming Elysium L2 launch brings an important ecosystem development, but the 4H trend remains bearish. A reclaim of $75.20 could open a recovery toward $76.50–$78, while losing $72.47 may invite further downside. For now, patience is key let's wait for confirmation before considering a long.
Can $HYPE make a comeback? 👀
{future}(HYPEUSDT)
#Hyperliquid #Hyperliquid
🚀 $HYPE After falling from its $97 – $98 high, HYPE is now trying to stabilize around the $72–$75 support zone. The upcoming Elysium L2 launch brings an important ecosystem development, but the 4H trend remains bearish. A reclaim of $75.20 could open a recovery toward $76.50–$78, while losing $72.47 may invite further downside. For now, patience is key let's wait for confirmation before considering a long.
Can $HYPE make a comeback? 👀
#Hyperliquid #Hyperliquid
Can $HYPE make a comeback? 👀
#Hyperliquid #Hyperliquid
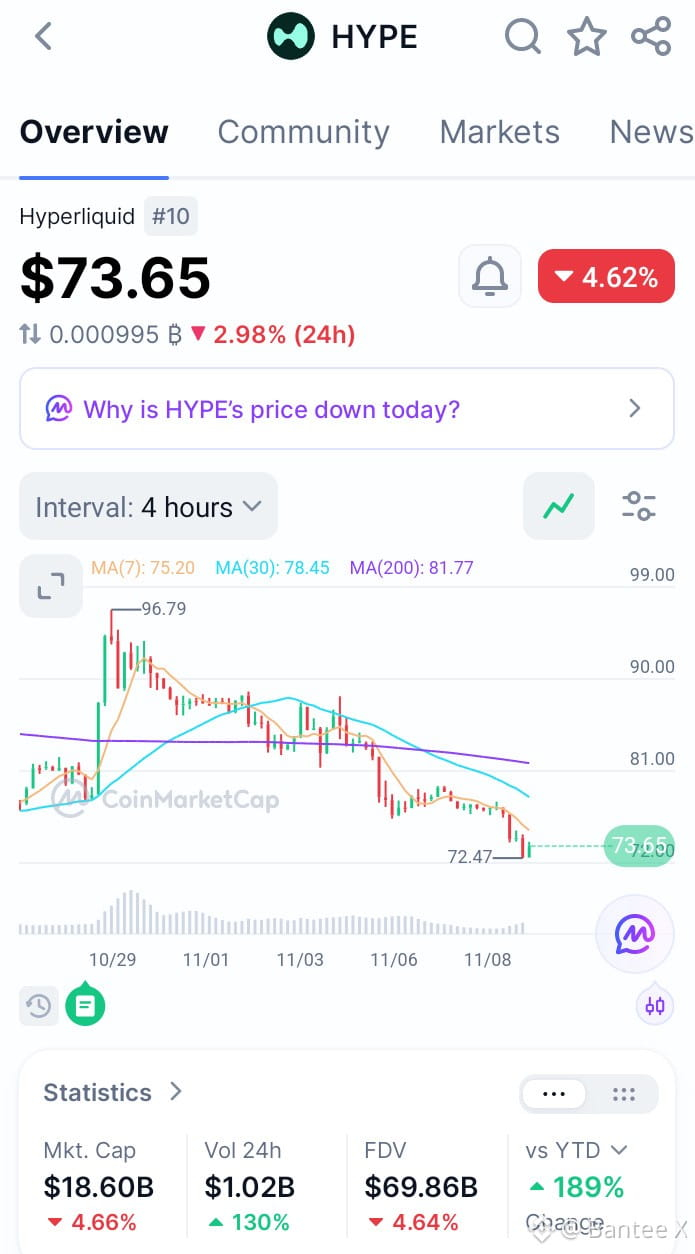


Wendy 🇻🇳
·
--
💛 BUILDING A WEB3 PROJECT? LET'S WORK TOGETHER
Hi everyone👋
After years of sharing crypto news, on-chain insights, and market research, I'm excited to explore new collaboration opportunities with Web3 teams.
I'm open to selected collaborations, including:
• Sponsored content & project introductions
• Educational articles & in-depth reviews
• Product launches & campaign coverage
• AMAs & community engagement
• Long-term content partnerships
I enjoy discovering interesting Web3 projects and creating content that helps people understand what teams are building.
📩 Founders, Marketing & BD teams: I'm open for collaboration and booking inquiries. Feel free to reach out via DM!
Looking forward to connecting with more Web3 builders💛
#BinanceSquare #Web3 $BTC $ETH $BNB
Hi everyone👋
After years of sharing crypto news, on-chain insights, and market research, I'm excited to explore new collaboration opportunities with Web3 teams.
I'm open to selected collaborations, including:
• Sponsored content & project introductions
• Educational articles & in-depth reviews
• Product launches & campaign coverage
• AMAs & community engagement
• Long-term content partnerships
I enjoy discovering interesting Web3 projects and creating content that helps people understand what teams are building.
📩 Founders, Marketing & BD teams: I'm open for collaboration and booking inquiries. Feel free to reach out via DM!
Looking forward to connecting with more Web3 builders💛
#BinanceSquare #Web3 $BTC $ETH $BNB
2
206
·
--
Bullish
$ETH Big long on going 📈
So guy's my long on open on $ETH ..
The reason is simple as you see in image ETH is currently touch there Daily support level and showing some recovery 💪 so my final Target 🎯 is 2,180$
let's see 😜 Don't Forgot to book your half position at 2124
And my stop loss ⛔ is on 2045 ...
Always protect your capital first ...
DYOR
{future}(ETHUSDT)
$ETH Big long on going 📈
So guy's my long on open on $ETH ..
The reason is simple as you see in image ETH is currently touch there Daily support level and showing some recovery 💪 so my final Target 🎯 is 2,180$
let's see 😜 Don't Forgot to book your half position at 2124
And my stop loss ⛔ is on 2045 ...
Always protect your capital first ...
DYOR
So guy's my long on open on $ETH ..
The reason is simple as you see in image ETH is currently touch there Daily support level and showing some recovery 💪 so my final Target 🎯 is 2,180$
let's see 😜 Don't Forgot to book your half position at 2124
And my stop loss ⛔ is on 2045 ...
Always protect your capital first ...
DYOR
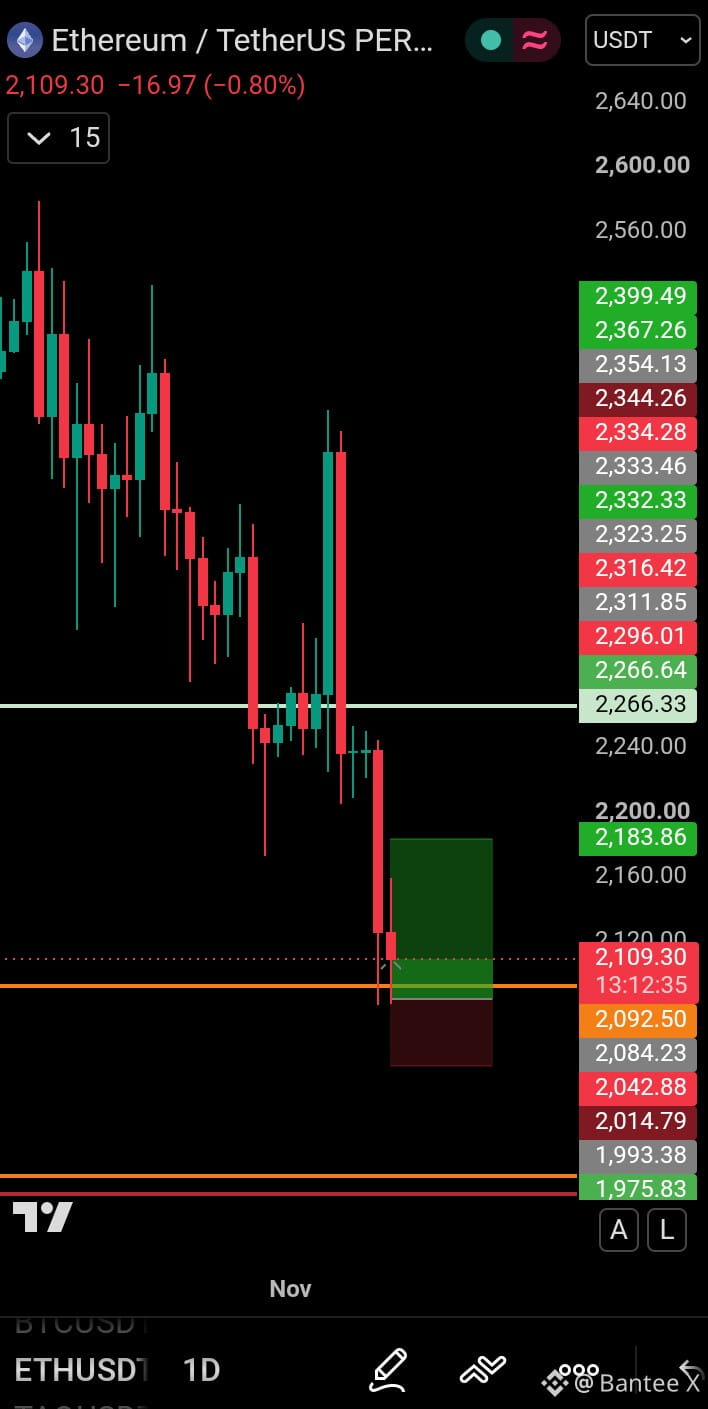
132
Log in to explore more content
Join global crypto users on Binance Square
⚡️ Get latest and useful information about crypto.
💬 Trusted by the world’s largest crypto exchange.
👍 Discover real insights from verified creators.
Email / Phone number
Trending Topics
CryptoSelloffTriggersMultipleWhaleLiquidations
60,903 views
800 Discussing
Crypto Liquidations Top $2B in 24 Hours as 329,000 Traders Are Wiped Out
Binance News
·29 Likes
·27.4k views
USSpotXRPETFsSeeLargestWeeklyOutflowIn8Months
85,177 views
987 Discussing
WillFOMCMinutesReinforceRateHikeExpectations?
14,194 views
325 Discussing