

Eric SJ
3.5k Posts

Eric SJ
 Square Verified+
Report
Block User
推特@sjbtc9丨内容输出:美股相关(科普和财报分析)、二级市场技术分析、Web3项目观点

Creator Awards 2024

原创之星
67 Following
56.6K+ Followers
140.7K+ Liked
3 Badges
Posts
All
Quotes
Videos
Live
PINNED
·
--
Attention all traders:
From now on, before making any trades, especially in the morning, I will post an intraday trend analysis for the assets we're targeting, usually BTC, ETH, and SOL.
The trading direction and analysis for the day will primarily follow this note, and the trend must remain consistent unless I explicitly indicate a direction change.
If there's a violation, I'll be sending out red envelopes for each infraction!
{future}(BTCUSDT)
Attention all traders:
From now on, before making any trades, especially in the morning, I will post an intraday trend analysis for the assets we're targeting, usually BTC, ETH, and SOL.
The trading direction and analysis for the day will primarily follow this note, and the trend must remain consistent unless I explicitly indicate a direction change.
If there's a violation, I'll be sending out red envelopes for each infraction!
From now on, before making any trades, especially in the morning, I will post an intraday trend analysis for the assets we're targeting, usually BTC, ETH, and SOL.
The trading direction and analysis for the day will primarily follow this note, and the trend must remain consistent unless I explicitly indicate a direction change.
If there's a violation, I'll be sending out red envelopes for each infraction!
4
15
5.8k
Trending
·
--

Article
Taking Binance Square as an example, let’s think about: What strategic value does a content community have for a platform?For an exchange, its product form is essentially a trading tool. At the peak of the domestic Internet era, someone once said: "A good product should be used and then gone."
However, when a platform has gone through the initial growth period of high expansion, especially when the industry is currently in the stage of transitioning from high growth to stock, good products should not be used and then gone.
So what strategic value does the Binance Square product have for Binance?
🗝️Article title
1. Discuss the rationality of Binance Square
2. Why is this a product moat that is difficult to replicate?
Taking Binance Square as an example, let’s think about: What strategic value does a content community have for a platform?
For an exchange, its product form is essentially a trading tool. At the peak of the domestic Internet era, someone once said: "A good product should be used and then gone."
However, when a platform has gone through the initial growth period of high expansion, especially when the industry is currently in the stage of transitioning from high growth to stock, good products should not be used and then gone.
So what strategic value does the Binance Square product have for Binance?
🗝️Article title
1. Discuss the rationality of Binance Square
2. Why is this a product moat that is difficult to replicate?
However, when a platform has gone through the initial growth period of high expansion, especially when the industry is currently in the stage of transitioning from high growth to stock, good products should not be used and then gone.
So what strategic value does the Binance Square product have for Binance?
🗝️Article title
1. Discuss the rationality of Binance Square
2. Why is this a product moat that is difficult to replicate?
42
13
916
3.3M
·
--
There’s a difference between on-chain and the secondary market: for the same order of magnitude—millions to ten-millions-level assets—
For Robinhood Chain, you basically can’t see what people call so-called support and resistance levels.
A 20M position can return to 5M in thirty minutes, and a 2M asset can also be ramped to 10M within thirty minutes.
But for assets in the millions to tens-of-millions range, on-chain is much, much better than the secondary market.
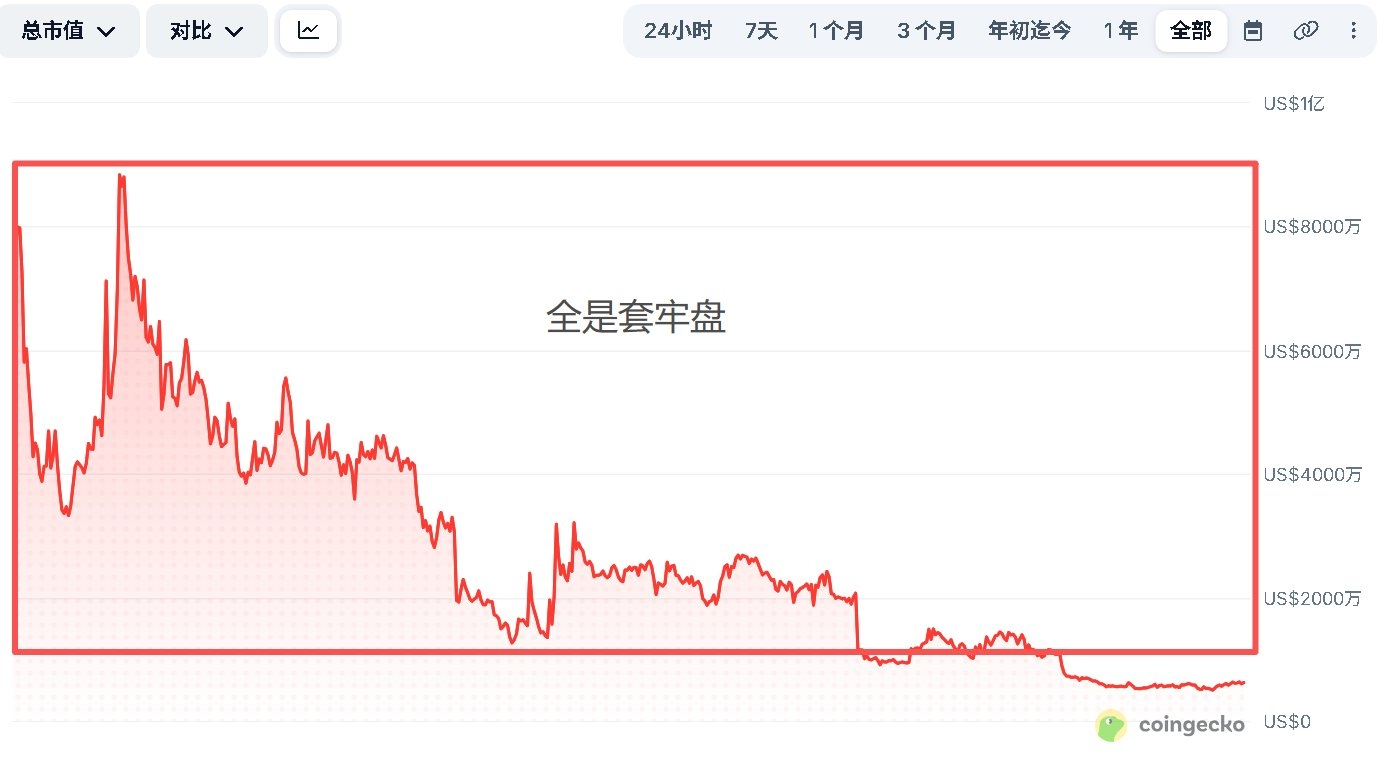
Because the latter most likely has a large trapped-fund supply—coming down from hundreds of millions to over a billion.
So on-chain vs the secondary market for selecting assets—the answer is very clear to me.
At the level of ten-million and below, the on-chain risk-reward is a bit higher.
But if it’s a market cap in the hundreds of millions, the secondary market is more稳妥.
What size of capital should go into what kind of pool to “fish”?
There’s a difference between on-chain and the secondary market: for the same order of magnitude—millions to ten-millions-level assets—
For Robinhood Chain, you basically can’t see what people call so-called support and resistance levels.
A 20M position can return to 5M in thirty minutes, and a 2M asset can also be ramped to 10M within thirty minutes.
But for assets in the millions to tens-of-millions range, on-chain is much, much better than the secondary market.
Because the latter most likely has a large trapped-fund supply—coming down from hundreds of millions to over a billion.
So on-chain vs the secondary market for selecting assets—the answer is very clear to me.
At the level of ten-million and below, the on-chain risk-reward is a bit higher.
But if it’s a market cap in the hundreds of millions, the secondary market is more稳妥.
What size of capital should go into what kind of pool to “fish”?
For Robinhood Chain, you basically can’t see what people call so-called support and resistance levels.
A 20M position can return to 5M in thirty minutes, and a 2M asset can also be ramped to 10M within thirty minutes.
But for assets in the millions to tens-of-millions range, on-chain is much, much better than the secondary market.
Because the latter most likely has a large trapped-fund supply—coming down from hundreds of millions to over a billion.
So on-chain vs the secondary market for selecting assets—the answer is very clear to me.
At the level of ten-million and below, the on-chain risk-reward is a bit higher.
But if it’s a market cap in the hundreds of millions, the secondary market is more稳妥.
What size of capital should go into what kind of pool to “fish”?
1
1
1.4k
·
--
Verified
This long medical-industry report of mine
If I had to recommend just one company, I would recommend Intuitive Surgical $ISRG.US
{stock_us}(ISRG.US)
Why?
Because it is almost like the [Apple of the medical field]
Robotics + healthcare is a market with both high certainty and ample room for imagination
According to estimates from third-party reports
[Intuitive Surgical’s share in the global surgical robotics market is close to 60%, and in sub-segments its share is even close to about 80%]
Its core product is a surgical system known as [da Vinci]
This is not a robot that performs fully autonomous surgeries—it assists surgeons during operations
Its business model is similar to Apple’s: it sells expensive equipment to customers first, and then it keeps charging around that equipment through consumables and after-sales service
So, Intuitive Surgical actually has three layers of revenue:
(1) Selling or leasing surgical robots
(2) As the number of procedures increases, it continues selling instruments and accessories
(3) Providing maintenance services to hospitals that already have the installed equipment
Among these, the parts that can generate long-term repeat revenue are the latter two
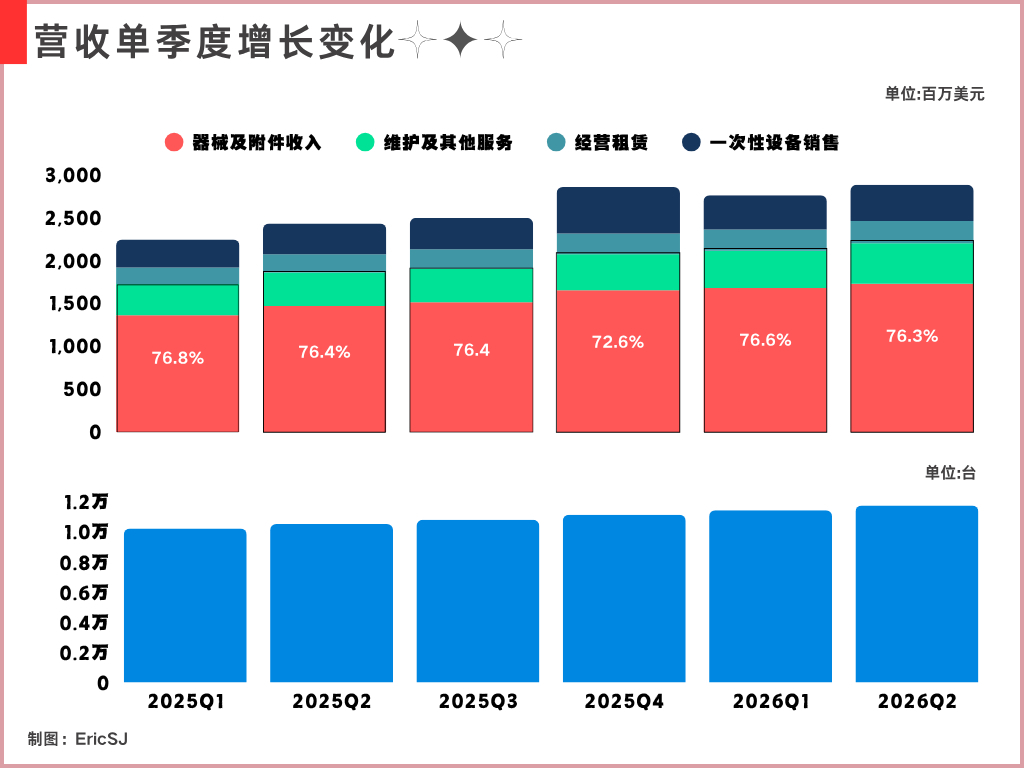
➠ In the most recent quarter, Intuitive Surgical achieved $2.892 billion in revenue, including $1.735 billion from instruments and accessories and $472 million from service revenue
That means instruments, accessories, and services together contribute about 76% of revenue, while revenue from selling robots alone accounts for only about 24%
As shown in Figure 1, it reflects Intuitive Surgical’s installation growth trend over the past six quarters and changes in its fee structure
The combined share of average revenue for both items remains above 75%, and installation volume growth is also steadily expanding
And what these later charging steps reflect is the workflow that customers build around the same system
That workflow itself is the moat—and an exceptionally clear one. Even if later competitors build a robot with parameters close to da Vinci, they can’t directly replace da Vinci
The entire business model is driven by a double-helix mechanism:
The more robots installed, the more doctors adopt the da Vinci system, and the higher the replacement cost later
The more robots installed, the more after-sales services and accessory consumables are needed
From the current market view, the W-bottom pattern formed on the daily chart is at a key resistance level, waiting for a confirmed breakout
That’s all for now. The above
This long medical-industry report of mine
If I had to recommend just one company, I would recommend Intuitive Surgical $ISRG.US
Why?
Because it is almost like the [Apple of the medical field]
Robotics + healthcare is a market with both high certainty and ample room for imagination
According to estimates from third-party reports
[Intuitive Surgical’s share in the global surgical robotics market is close to 60%, and in sub-segments its share is even close to about 80%]
Its core product is a surgical system known as [da Vinci]
This is not a robot that performs fully autonomous surgeries—it assists surgeons during operations
Its business model is similar to Apple’s: it sells expensive equipment to customers first, and then it keeps charging around that equipment through consumables and after-sales service
So, Intuitive Surgical actually has three layers of revenue:
(1) Selling or leasing surgical robots
(2) As the number of procedures increases, it continues selling instruments and accessories
(3) Providing maintenance services to hospitals that already have the installed equipment
Among these, the parts that can generate long-term repeat revenue are the latter two
➠ In the most recent quarter, Intuitive Surgical achieved $2.892 billion in revenue, including $1.735 billion from instruments and accessories and $472 million from service revenue
That means instruments, accessories, and services together contribute about 76% of revenue, while revenue from selling robots alone accounts for only about 24%
As shown in Figure 1, it reflects Intuitive Surgical’s installation growth trend over the past six quarters and changes in its fee structure
The combined share of average revenue for both items remains above 75%, and installation volume growth is also steadily expanding
And what these later charging steps reflect is the workflow that customers build around the same system
That workflow itself is the moat—and an exceptionally clear one. Even if later competitors build a robot with parameters close to da Vinci, they can’t directly replace da Vinci
The entire business model is driven by a double-helix mechanism:
The more robots installed, the more doctors adopt the da Vinci system, and the higher the replacement cost later
The more robots installed, the more after-sales services and accessory consumables are needed
From the current market view, the W-bottom pattern formed on the daily chart is at a key resistance level, waiting for a confirmed breakout
That’s all for now. The above
If I had to recommend just one company, I would recommend Intuitive Surgical $ISRG.US
Why?
Because it is almost like the [Apple of the medical field]
Robotics + healthcare is a market with both high certainty and ample room for imagination
According to estimates from third-party reports
[Intuitive Surgical’s share in the global surgical robotics market is close to 60%, and in sub-segments its share is even close to about 80%]
Its core product is a surgical system known as [da Vinci]
This is not a robot that performs fully autonomous surgeries—it assists surgeons during operations
Its business model is similar to Apple’s: it sells expensive equipment to customers first, and then it keeps charging around that equipment through consumables and after-sales service
So, Intuitive Surgical actually has three layers of revenue:
(1) Selling or leasing surgical robots
(2) As the number of procedures increases, it continues selling instruments and accessories
(3) Providing maintenance services to hospitals that already have the installed equipment
Among these, the parts that can generate long-term repeat revenue are the latter two
➠ In the most recent quarter, Intuitive Surgical achieved $2.892 billion in revenue, including $1.735 billion from instruments and accessories and $472 million from service revenue
That means instruments, accessories, and services together contribute about 76% of revenue, while revenue from selling robots alone accounts for only about 24%
As shown in Figure 1, it reflects Intuitive Surgical’s installation growth trend over the past six quarters and changes in its fee structure
The combined share of average revenue for both items remains above 75%, and installation volume growth is also steadily expanding
And what these later charging steps reflect is the workflow that customers build around the same system
That workflow itself is the moat—and an exceptionally clear one. Even if later competitors build a robot with parameters close to da Vinci, they can’t directly replace da Vinci
The entire business model is driven by a double-helix mechanism:
The more robots installed, the more doctors adopt the da Vinci system, and the higher the replacement cost later
The more robots installed, the more after-sales services and accessory consumables are needed
From the current market view, the W-bottom pattern formed on the daily chart is at a key resistance level, waiting for a confirmed breakout
That’s all for now. The above
Eric SJ
·
--
Who actually profits from the value of the healthcare industry?
Recently, as I was sorting through the healthcare industry, I found that I had two misconceptions about this sector in the past:
(1) Simply treating the number of patients as the market.
(2) Simply treating the approval of an innovative drug as a drug company’s moat.
And these two misconceptions aren’t unique to me. While I’m browsing the Snowball community, I’ve found that many investors holding Eli Lilly, AstraZeneca, and investors who are paying attention to the pharmaceutical sector generally share similar understandings.
But for a drug, from the time it’s proposed as a concept in a lab to when it truly enters patients’ bodies, it has to go through a whole series of steps—clinical trials, manufacturing, diagnosis, cold-chain delivery, insurance reimbursement, and pharmacy dispensing, among others. If any one step gets stuck, the theoretical market size can never turn into real-world usage scenarios.
(1) Simply treating the number of patients as the market.
(2) Simply treating the approval of an innovative drug as a drug company’s moat.
And these two misconceptions aren’t unique to me. While I’m browsing the Snowball community, I’ve found that many investors holding Eli Lilly, AstraZeneca, and investors who are paying attention to the pharmaceutical sector generally share similar understandings.
But for a drug, from the time it’s proposed as a concept in a lab to when it truly enters patients’ bodies, it has to go through a whole series of steps—clinical trials, manufacturing, diagnosis, cold-chain delivery, insurance reimbursement, and pharmacy dispensing, among others. If any one step gets stuck, the theoretical market size can never turn into real-world usage scenarios.
ISRGUS+0.50%
1.9k
·
--
What trashy and counterfeit market trends are starting on the market right now
Can this really be called an End-of-the-World war machine?
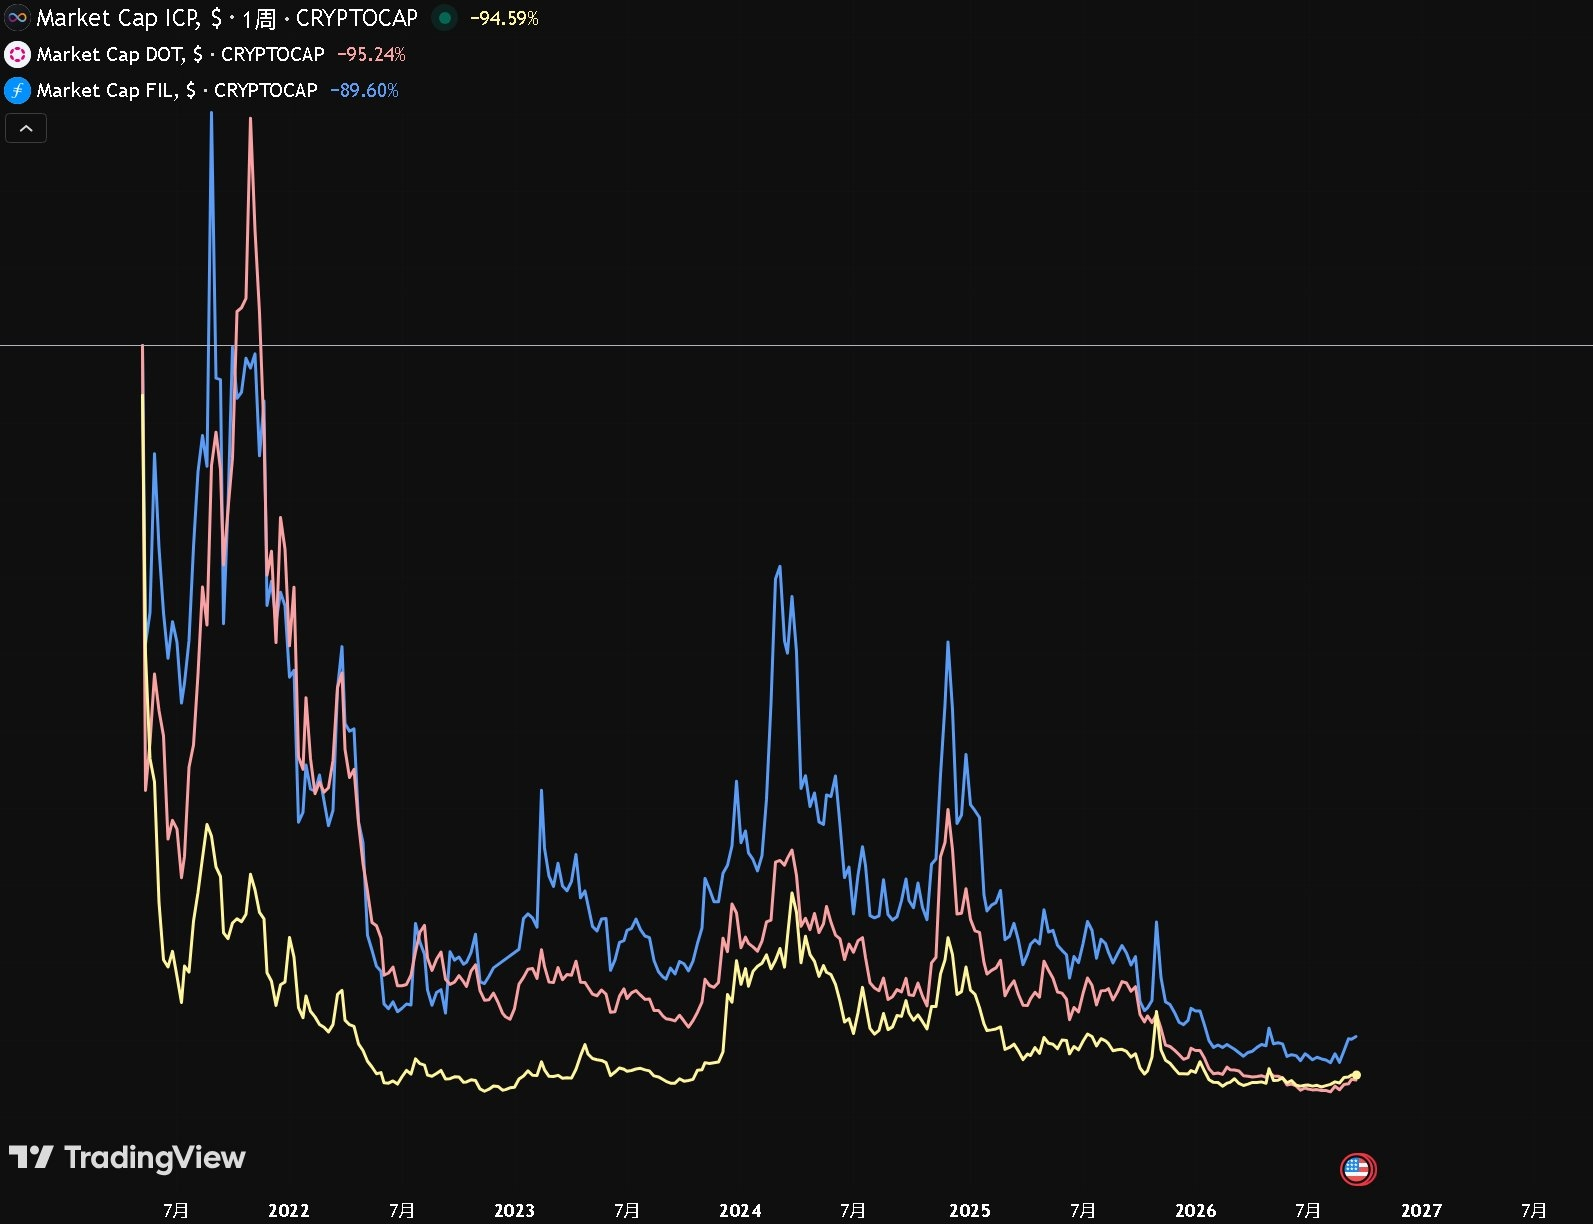
A real End-of-the-World war machine—I only recognize these three $DOT $FIL $ICP
If I have to add one more, it would be the legendary $EOS from days gone by (now it has been converted into $A)
In the last two rounds, every counterfeit coin faces these four ancient true gods—it’s like a minor vs a major
They all have a few common traits:
(1)All were once in the top ten by market cap
(2)A large number of holders
(3)Top-tier narratives
(4)God-tier lineups
What trashy and counterfeit market trends are starting on the market right now
Can this really be called an End-of-the-World war machine?
A real End-of-the-World war machine—I only recognize these three $DOT $FIL $ICP
If I have to add one more, it would be the legendary $EOS from days gone by (now it has been converted into $A)
In the last two rounds, every counterfeit coin faces these four ancient true gods—it’s like a minor vs a major
They all have a few common traits:
(1)All were once in the top ten by market cap
(2)A large number of holders
(3)Top-tier narratives
(4)God-tier lineups
Can this really be called an End-of-the-World war machine?
A real End-of-the-World war machine—I only recognize these three $DOT $FIL $ICP
If I have to add one more, it would be the legendary $EOS from days gone by (now it has been converted into $A)
In the last two rounds, every counterfeit coin faces these four ancient true gods—it’s like a minor vs a major
They all have a few common traits:
(1)All were once in the top ten by market cap
(2)A large number of holders
(3)Top-tier narratives
(4)God-tier lineups
6
4
6.7k
·
--
Verified
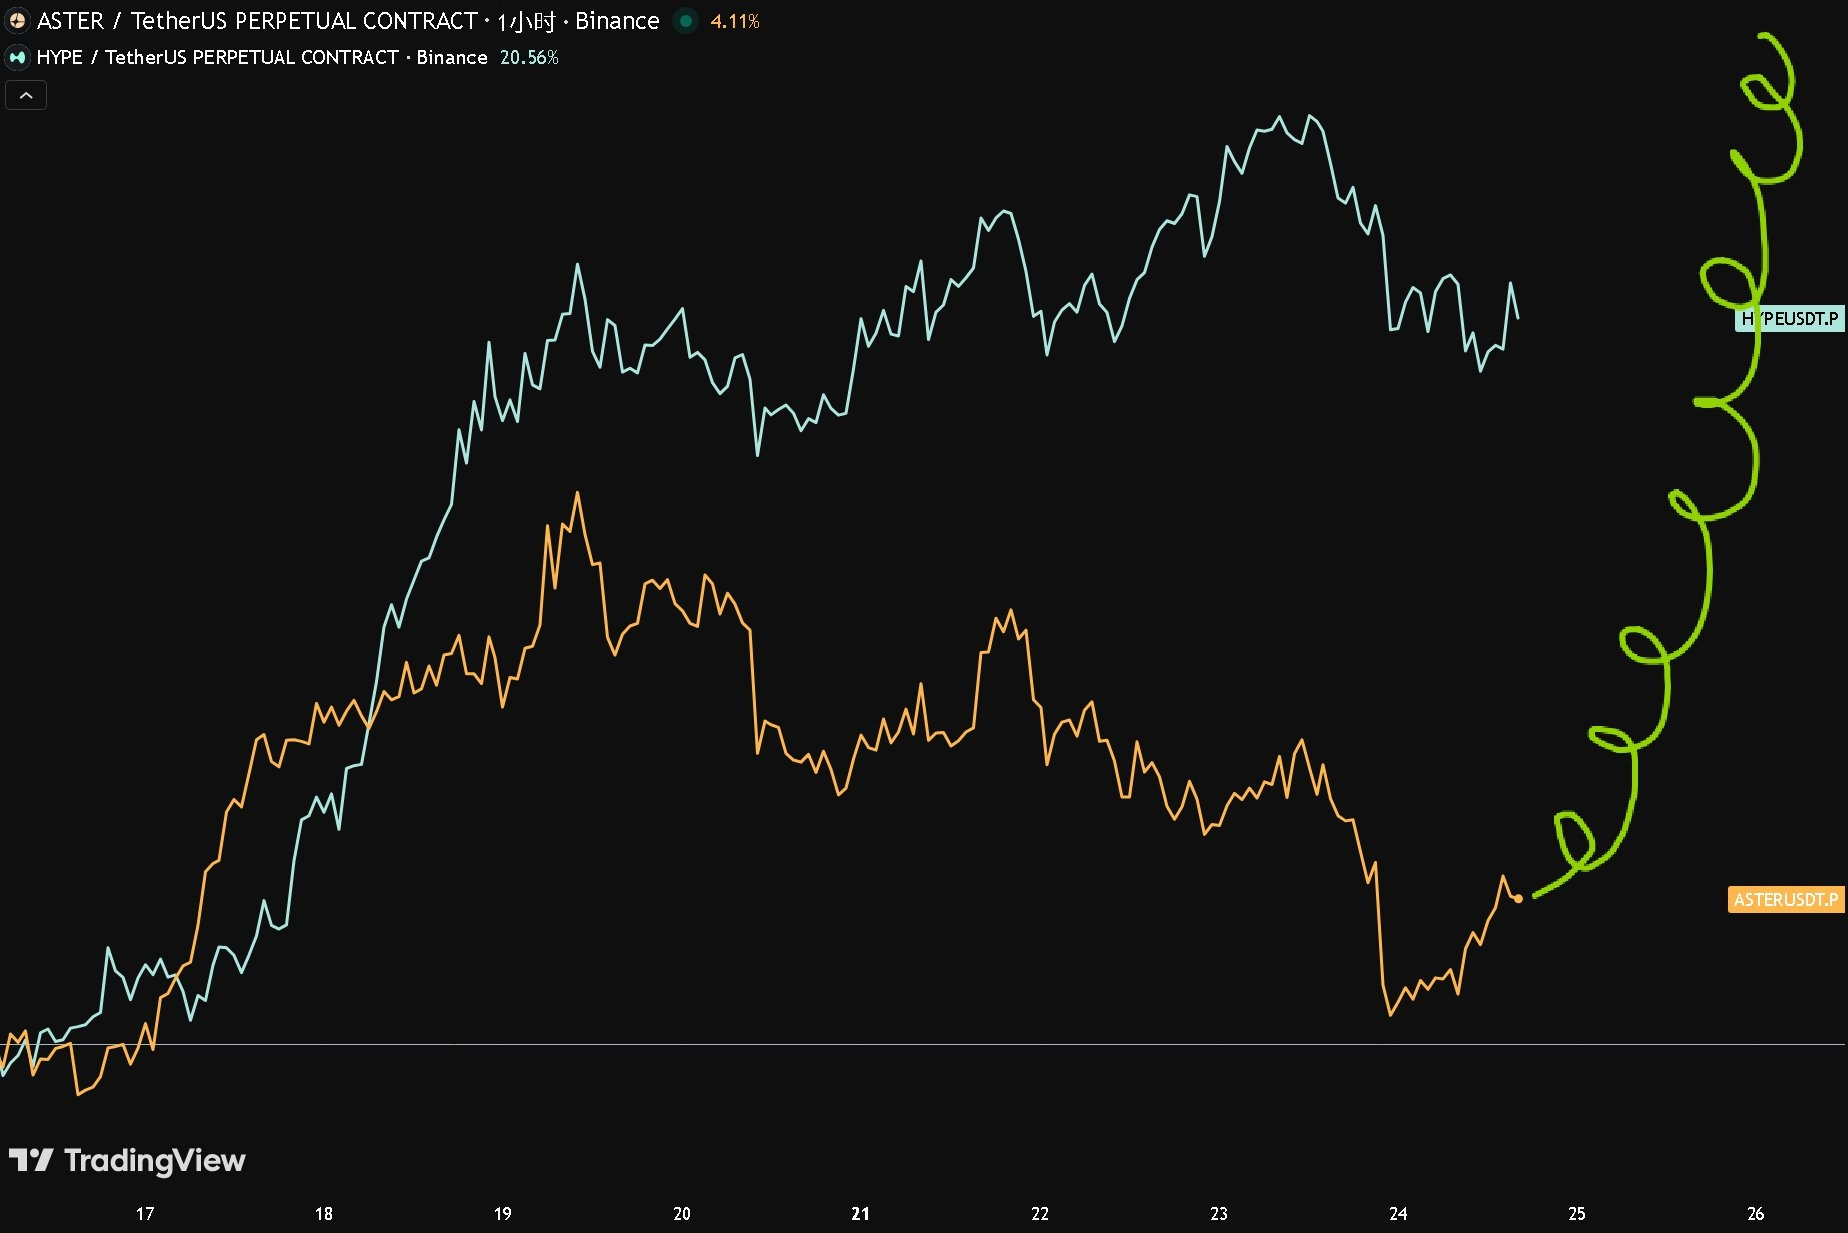
$HYPE Surprisingly, it got listed on Binance spot
{future}(HYPEUSDT)
Now that it’s come to this, $ASTER only has [Spiral ascent and take profit. Make everyone follow.] left as a way to break the deadlock
{future}(ASTERUSDT)
Otherwise, tomorrow $LIT will also be listed
$HYPE Surprisingly, it got listed on Binance spot
Now that it’s come to this, $ASTER only has [Spiral ascent and take profit. Make everyone follow.] left as a way to break the deadlock
Otherwise, tomorrow $LIT will also be listed
Now that it’s come to this, $ASTER only has [Spiral ascent and take profit. Make everyone follow.] left as a way to break the deadlock
Otherwise, tomorrow $LIT will also be listed
1
2
2.6k
·
--
Verified

Article
Who actually profits from the value of the healthcare industry?Recently, as I was sorting through the healthcare industry, I found that I had two misconceptions about this sector in the past:
(1) Simply treating the number of patients as the market.
(2) Simply treating the approval of an innovative drug as a drug company’s moat.
And these two misconceptions aren’t unique to me. While I’m browsing the Snowball community, I’ve found that many investors holding Eli Lilly, AstraZeneca, and investors who are paying attention to the pharmaceutical sector generally share similar understandings.
But for a drug, from the time it’s proposed as a concept in a lab to when it truly enters patients’ bodies, it has to go through a whole series of steps—clinical trials, manufacturing, diagnosis, cold-chain delivery, insurance reimbursement, and pharmacy dispensing, among others. If any one step gets stuck, the theoretical market size can never turn into real-world usage scenarios.
Who actually profits from the value of the healthcare industry?
Recently, as I was sorting through the healthcare industry, I found that I had two misconceptions about this sector in the past:
(1) Simply treating the number of patients as the market.
(2) Simply treating the approval of an innovative drug as a drug company’s moat.
And these two misconceptions aren’t unique to me. While I’m browsing the Snowball community, I’ve found that many investors holding Eli Lilly, AstraZeneca, and investors who are paying attention to the pharmaceutical sector generally share similar understandings.
But for a drug, from the time it’s proposed as a concept in a lab to when it truly enters patients’ bodies, it has to go through a whole series of steps—clinical trials, manufacturing, diagnosis, cold-chain delivery, insurance reimbursement, and pharmacy dispensing, among others. If any one step gets stuck, the theoretical market size can never turn into real-world usage scenarios.
(1) Simply treating the number of patients as the market.
(2) Simply treating the approval of an innovative drug as a drug company’s moat.
And these two misconceptions aren’t unique to me. While I’m browsing the Snowball community, I’ve found that many investors holding Eli Lilly, AstraZeneca, and investors who are paying attention to the pharmaceutical sector generally share similar understandings.
But for a drug, from the time it’s proposed as a concept in a lab to when it truly enters patients’ bodies, it has to go through a whole series of steps—clinical trials, manufacturing, diagnosis, cold-chain delivery, insurance reimbursement, and pharmacy dispensing, among others. If any one step gets stuck, the theoretical market size can never turn into real-world usage scenarios.
1
1.9k
·
--

Article
Stock tokenization is just the beginning—how many people have noticed on-chain dividends?The excitement around the Robinhood Chain further drives certainty and scale in crypto-stock markets. What we’re seeing in this space right now is: you can buy stocks on-chain, but the most mainstream adoption is still the crypto-stock liquidity pool for issuing new assets (memes).
The DeFi portfolio strategy originally expected was temporarily put aside.
But once stocks enter the chain, there’s an even more certain piece of the market that very few people talk about—dividends.
The idea of splitting out the future returns a target can generate and trading them separately in advance has been done in Web3 before. It’s just that now the two areas are intersecting: with underlying technology (on-chain dividend distribution) to support it, this will naturally happen on-chain.
Stock tokenization is just the beginning—how many people have noticed on-chain dividends?
The excitement around the Robinhood Chain further drives certainty and scale in crypto-stock markets. What we’re seeing in this space right now is: you can buy stocks on-chain, but the most mainstream adoption is still the crypto-stock liquidity pool for issuing new assets (memes).
The DeFi portfolio strategy originally expected was temporarily put aside.
But once stocks enter the chain, there’s an even more certain piece of the market that very few people talk about—dividends.
The idea of splitting out the future returns a target can generate and trading them separately in advance has been done in Web3 before. It’s just that now the two areas are intersecting: with underlying technology (on-chain dividend distribution) to support it, this will naturally happen on-chain.
The DeFi portfolio strategy originally expected was temporarily put aside.
But once stocks enter the chain, there’s an even more certain piece of the market that very few people talk about—dividends.
The idea of splitting out the future returns a target can generate and trading them separately in advance has been done in Web3 before. It’s just that now the two areas are intersecting: with underlying technology (on-chain dividend distribution) to support it, this will naturally happen on-chain.
1
4
2k
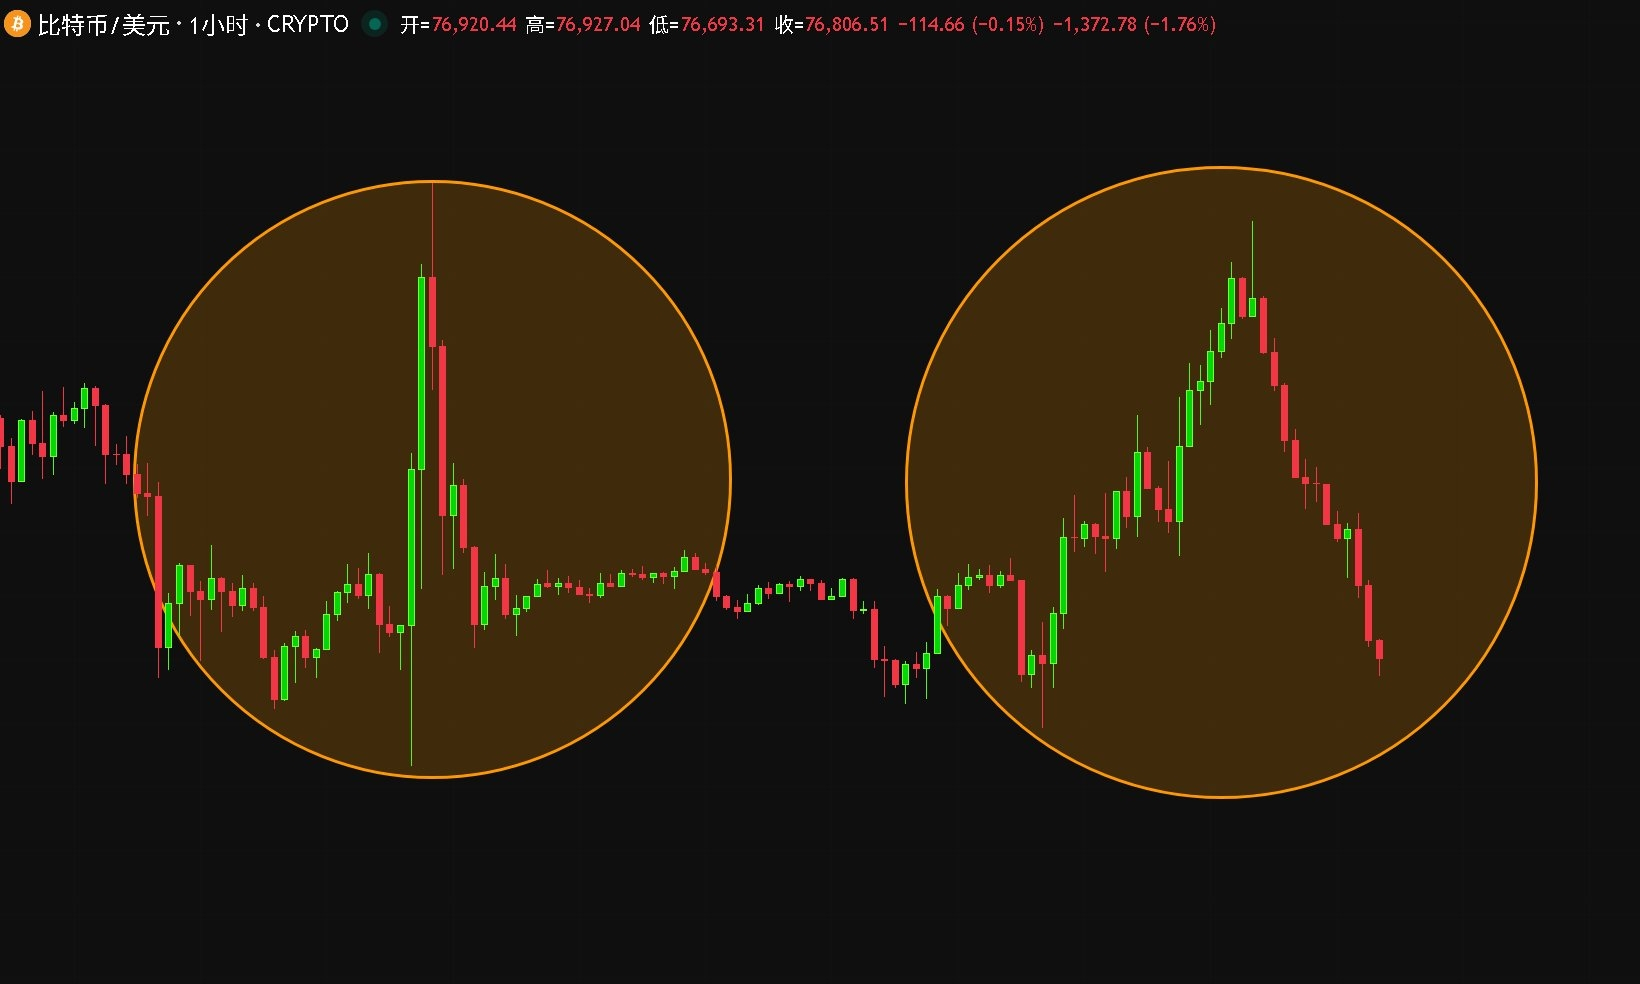
·
--
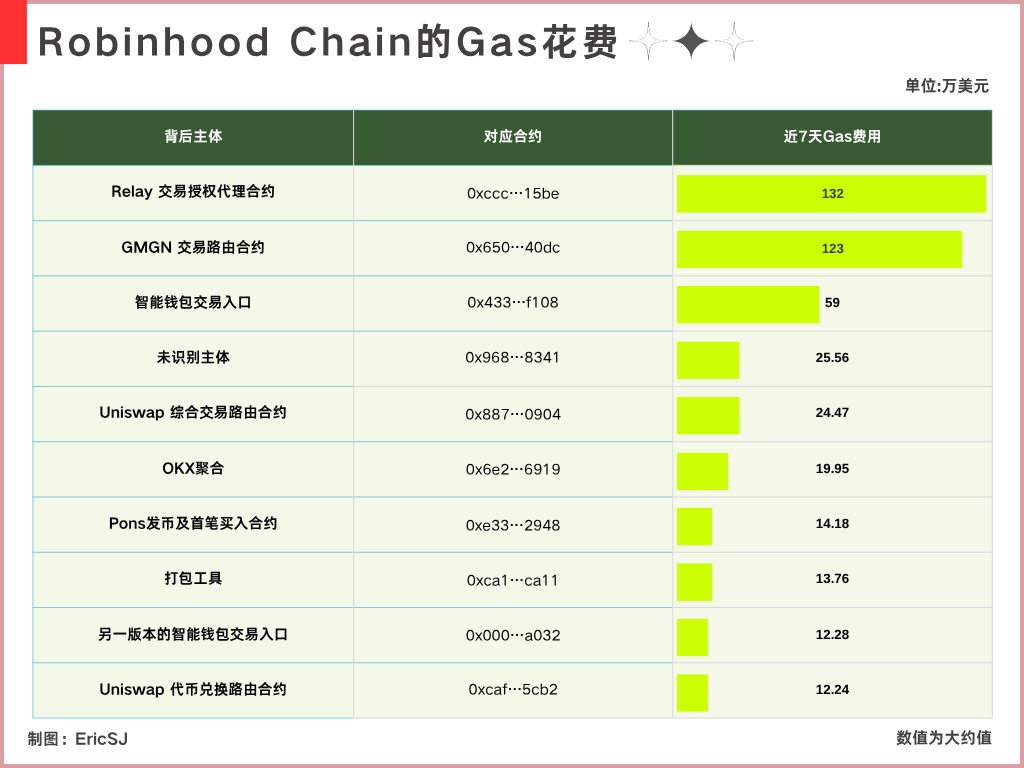
Over the past week, the Gas fees collected by the Robinhood Chain were about around 8M
I pulled the top ten wallets by Gas spend
I also cross-checked the underlying entities behind the corresponding addresses and made this table
FOMO @fomo and the #1 Relay @RelayProtocol have a verified integration relationship
The 2nd place is GMGN
The 3rd is the AA Wallet’s calls
This made me think of two “old friends”
UniversalX and Particle $PARTI
{future}(PARTIUSDT)
UX, in the previous round, could be considered an “MVP” for a truly full-chain terminal application
The former, as a transaction terminal, is similar to today’s fomo; the latter, as infrastructure, is similar to today’s Relay
Now I can still see many KOLs and smaller players hanging with UX branding
Whenever someone posts about how fast fomo transactions are (sometimes even when it lags and is annoying), UX pops into my mind involuntarily
It’s the same story: solving the problem that users shouldn’t be aware of the chain
For users who have used UX, it isn’t exactly surprising
But right now, there just isn’t much noise in the market
Even it’s hard to make sense of its current status—if it has stopped, there are still occasional movements; if it hasn’t stopped, then this stretch of on-chain market activity has barely moved
From my perspective, UX back then truly秒-killed many other products in terms of the full-chain trading experience
The only annoying part is that AA’s costs are very difficult to bring down from the source
Even today, in terms of experience, it’s still better than many applications doing cross-chain integrations
But there’s simply no noise
The technical direction hasn’t been disproven, and no rug pull has appeared
It just quietly stepped out of the spotlight and into the background—no official announcement of the finale, and no official announcement of a second show
The audience in the stands doesn’t really understand why
......
Over the past week, the Gas fees collected by the Robinhood Chain were about around 8M
I pulled the top ten wallets by Gas spend
I also cross-checked the underlying entities behind the corresponding addresses and made this table
FOMO @fomo and the #1 Relay @RelayProtocol have a verified integration relationship
The 2nd place is GMGN
The 3rd is the AA Wallet’s calls
This made me think of two “old friends”
UniversalX and Particle $PARTI
UX, in the previous round, could be considered an “MVP” for a truly full-chain terminal application
The former, as a transaction terminal, is similar to today’s fomo; the latter, as infrastructure, is similar to today’s Relay
Now I can still see many KOLs and smaller players hanging with UX branding
Whenever someone posts about how fast fomo transactions are (sometimes even when it lags and is annoying), UX pops into my mind involuntarily
It’s the same story: solving the problem that users shouldn’t be aware of the chain
For users who have used UX, it isn’t exactly surprising
But right now, there just isn’t much noise in the market
Even it’s hard to make sense of its current status—if it has stopped, there are still occasional movements; if it hasn’t stopped, then this stretch of on-chain market activity has barely moved
From my perspective, UX back then truly秒-killed many other products in terms of the full-chain trading experience
The only annoying part is that AA’s costs are very difficult to bring down from the source
Even today, in terms of experience, it’s still better than many applications doing cross-chain integrations
But there’s simply no noise
The technical direction hasn’t been disproven, and no rug pull has appeared
It just quietly stepped out of the spotlight and into the background—no official announcement of the finale, and no official announcement of a second show
The audience in the stands doesn’t really understand why
......
I pulled the top ten wallets by Gas spend
I also cross-checked the underlying entities behind the corresponding addresses and made this table
FOMO @fomo and the #1 Relay @RelayProtocol have a verified integration relationship
The 2nd place is GMGN
The 3rd is the AA Wallet’s calls
This made me think of two “old friends”
UniversalX and Particle $PARTI
UX, in the previous round, could be considered an “MVP” for a truly full-chain terminal application
The former, as a transaction terminal, is similar to today’s fomo; the latter, as infrastructure, is similar to today’s Relay
Now I can still see many KOLs and smaller players hanging with UX branding
Whenever someone posts about how fast fomo transactions are (sometimes even when it lags and is annoying), UX pops into my mind involuntarily
It’s the same story: solving the problem that users shouldn’t be aware of the chain
For users who have used UX, it isn’t exactly surprising
But right now, there just isn’t much noise in the market
Even it’s hard to make sense of its current status—if it has stopped, there are still occasional movements; if it hasn’t stopped, then this stretch of on-chain market activity has barely moved
From my perspective, UX back then truly秒-killed many other products in terms of the full-chain trading experience
The only annoying part is that AA’s costs are very difficult to bring down from the source
Even today, in terms of experience, it’s still better than many applications doing cross-chain integrations
But there’s simply no noise
The technical direction hasn’t been disproven, and no rug pull has appeared
It just quietly stepped out of the spotlight and into the background—no official announcement of the finale, and no official announcement of a second show
The audience in the stands doesn’t really understand why
......
1
1
2
12.1k
·
--
Verified

Article
Adobe chooses to earn less—what exactly is it betting on?Adobe’s latest earnings report is most notable for 1 billion monthly active users and a record quarterly revenue high of $6.76 billion. Operating cash flow reached $2.52 billion as well, setting a new record for the third fiscal quarter.
But overall, when you combine this earnings report with the guidance, it’s fair to say it’s a mixed bag of good and bad news:
Adobe’s forecast for fourth-quarter revenue is $6.8 billion to $6.85 billion.
This quarter already reached $6.76 billion, meaning next quarter is expected to increase only $40 million to $90 million quarter over quarter. If you take the midpoint, that’s an increase of roughly $65 million.
A $65 million increase may not sound like nothing for a company with quarterly revenue approaching $7 billion, but it’s indeed only a small portion—especially when you put the third and fourth quarters from the past two years side by side and realize that this incremental expectation is quite conservative.
Adobe chooses to earn less—what exactly is it betting on?
Adobe’s latest earnings report is most notable for 1 billion monthly active users and a record quarterly revenue high of $6.76 billion. Operating cash flow reached $2.52 billion as well, setting a new record for the third fiscal quarter.
But overall, when you combine this earnings report with the guidance, it’s fair to say it’s a mixed bag of good and bad news:
Adobe’s forecast for fourth-quarter revenue is $6.8 billion to $6.85 billion.
This quarter already reached $6.76 billion, meaning next quarter is expected to increase only $40 million to $90 million quarter over quarter. If you take the midpoint, that’s an increase of roughly $65 million.
A $65 million increase may not sound like nothing for a company with quarterly revenue approaching $7 billion, but it’s indeed only a small portion—especially when you put the third and fourth quarters from the past two years side by side and realize that this incremental expectation is quite conservative.
But overall, when you combine this earnings report with the guidance, it’s fair to say it’s a mixed bag of good and bad news:
Adobe’s forecast for fourth-quarter revenue is $6.8 billion to $6.85 billion.
This quarter already reached $6.76 billion, meaning next quarter is expected to increase only $40 million to $90 million quarter over quarter. If you take the midpoint, that’s an increase of roughly $65 million.
A $65 million increase may not sound like nothing for a company with quarterly revenue approaching $7 billion, but it’s indeed only a small portion—especially when you put the third and fourth quarters from the past two years side by side and realize that this incremental expectation is quite conservative.
3
1
2.4k
·
--

Article
RWA Track: US Treasury Yield at 4%—Why Can Reinsurance Offer 10%+?The reinsurance track is one of the few concepts that’s relatively new in this round. The current market size is still not large; even combining the two main existing projects, the market size (user deposits) still hasn’t broken one billion.
Several sub-concepts within RWA can arguably be considered the MVPs of this cycle; their scale is growing rapidly. But when I looked at the business models of the issuers behind these projects, I realized something else: for RWA, scale is indeed important, but how widely it is distributed—and whether the issuer (protocol) can truly make money—are what really matter.
Only when the distribution is broad enough or the returns are verifiable can the issuer’s business model be considered a good one.
RWA Track: US Treasury Yield at 4%—Why Can Reinsurance Offer 10%+?
The reinsurance track is one of the few concepts that’s relatively new in this round. The current market size is still not large; even combining the two main existing projects, the market size (user deposits) still hasn’t broken one billion.
Several sub-concepts within RWA can arguably be considered the MVPs of this cycle; their scale is growing rapidly. But when I looked at the business models of the issuers behind these projects, I realized something else: for RWA, scale is indeed important, but how widely it is distributed—and whether the issuer (protocol) can truly make money—are what really matter.
Only when the distribution is broad enough or the returns are verifiable can the issuer’s business model be considered a good one.
Several sub-concepts within RWA can arguably be considered the MVPs of this cycle; their scale is growing rapidly. But when I looked at the business models of the issuers behind these projects, I realized something else: for RWA, scale is indeed important, but how widely it is distributed—and whether the issuer (protocol) can truly make money—are what really matter.
Only when the distribution is broad enough or the returns are verifiable can the issuer’s business model be considered a good one.
2
1.6k
·
--
Verified
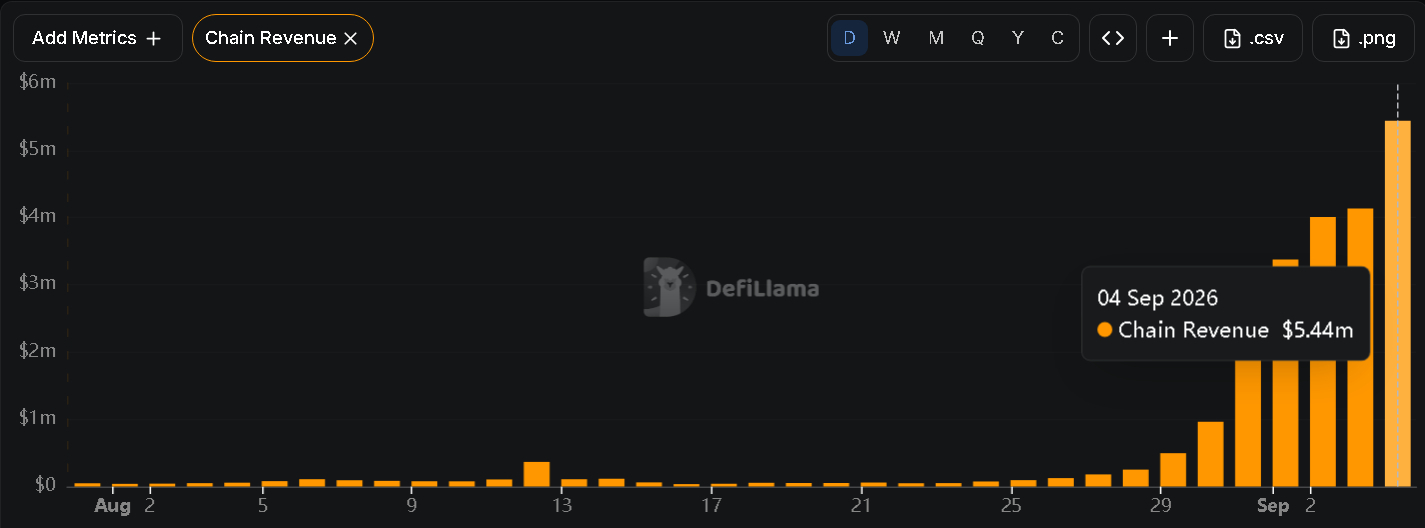
The activity on Robinhood Chain has pushed up its unit gas price
At the same time, it has also brought its daily revenue to $5M (after deducting the 10% shared with Arbitrum)
Fun fact: Base has never reached this level of revenue at any point in the past
RB’s current daily chain revenue is even three times Base’s peak revenue
If it can maintain daily revenue of $2.5M going forward
Then each quarter it will contribute more than $200 million in revenue to Robinhood $HOOD
What does that mean?
Robinhood’s transaction business generated a total of $776 million in revenue last quarter
➠"Of which, revenue from options was $342 million, event contracts (prediction markets) $156 million, stocks $129 million, and crypto trading revenue $100 million"
If Robinhood Chain can really sustain an average daily revenue of $2.5 million, then compared with last quarter’s business scale on a static basis
It would surpass event contracts, stocks, and crypto trading, ranking only behind options
Even this portion of revenue could account for more than 15% of Robinhood’s total revenue last quarter
And I think the change Robinhood Chain brings to Robinhood
Is that it expands this revenue boundary beyond the Robinhood App
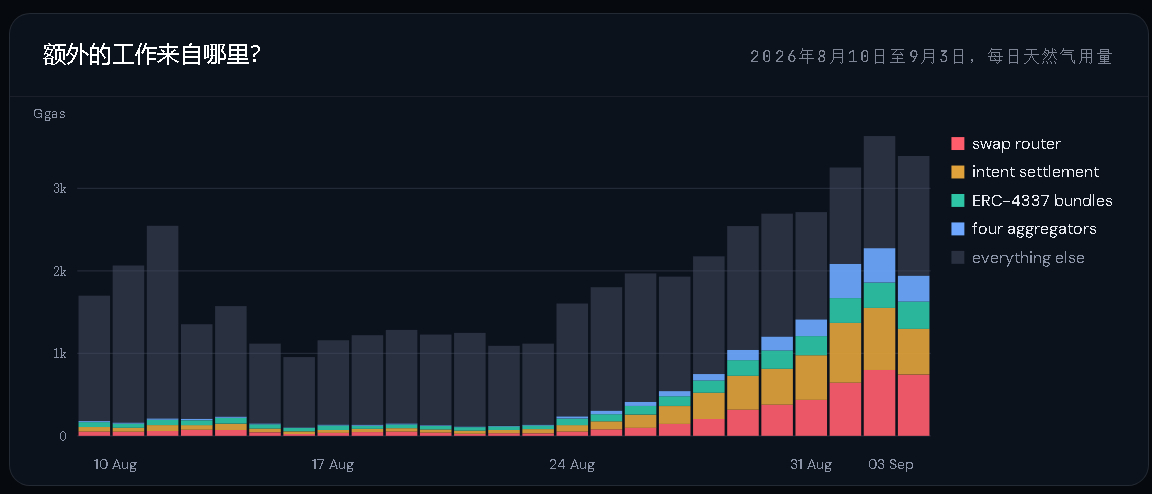
As for the largest current source of on-chain gas, I just came across a research article, and the findings (Figure 2) can roughly infer that:
Many transactions are not initiated through the Robinhood App, and the users behind them may even have never registered a Robinhood account
At Robinhood’s previous latest earnings call, Vlad @vladtenev said
"I think reaching $1 trillion is going to be very, very difficult. No financial company has ever reached a market cap of $1 trillion yet, but I think it is achievable"
And among the several growth paths he listed afterward, Robinhood Chain was one of them
The revenue Robinhood Chain is generating now may be the first financial signal that this new story is starting to be realized
The activity on Robinhood Chain has pushed up its unit gas price
At the same time, it has also brought its daily revenue to $5M (after deducting the 10% shared with Arbitrum)
Fun fact: Base has never reached this level of revenue at any point in the past
RB’s current daily chain revenue is even three times Base’s peak revenue
If it can maintain daily revenue of $2.5M going forward
Then each quarter it will contribute more than $200 million in revenue to Robinhood $HOOD
What does that mean?
Robinhood’s transaction business generated a total of $776 million in revenue last quarter
➠"Of which, revenue from options was $342 million, event contracts (prediction markets) $156 million, stocks $129 million, and crypto trading revenue $100 million"
If Robinhood Chain can really sustain an average daily revenue of $2.5 million, then compared with last quarter’s business scale on a static basis
It would surpass event contracts, stocks, and crypto trading, ranking only behind options
Even this portion of revenue could account for more than 15% of Robinhood’s total revenue last quarter
And I think the change Robinhood Chain brings to Robinhood
Is that it expands this revenue boundary beyond the Robinhood App
As for the largest current source of on-chain gas, I just came across a research article, and the findings (Figure 2) can roughly infer that:
Many transactions are not initiated through the Robinhood App, and the users behind them may even have never registered a Robinhood account
At Robinhood’s previous latest earnings call, Vlad @vladtenev said
"I think reaching $1 trillion is going to be very, very difficult. No financial company has ever reached a market cap of $1 trillion yet, but I think it is achievable"
And among the several growth paths he listed afterward, Robinhood Chain was one of them
The revenue Robinhood Chain is generating now may be the first financial signal that this new story is starting to be realized
At the same time, it has also brought its daily revenue to $5M (after deducting the 10% shared with Arbitrum)
Fun fact: Base has never reached this level of revenue at any point in the past
RB’s current daily chain revenue is even three times Base’s peak revenue
If it can maintain daily revenue of $2.5M going forward
Then each quarter it will contribute more than $200 million in revenue to Robinhood $HOOD
What does that mean?
Robinhood’s transaction business generated a total of $776 million in revenue last quarter
➠"Of which, revenue from options was $342 million, event contracts (prediction markets) $156 million, stocks $129 million, and crypto trading revenue $100 million"
If Robinhood Chain can really sustain an average daily revenue of $2.5 million, then compared with last quarter’s business scale on a static basis
It would surpass event contracts, stocks, and crypto trading, ranking only behind options
Even this portion of revenue could account for more than 15% of Robinhood’s total revenue last quarter
And I think the change Robinhood Chain brings to Robinhood
Is that it expands this revenue boundary beyond the Robinhood App
As for the largest current source of on-chain gas, I just came across a research article, and the findings (Figure 2) can roughly infer that:
Many transactions are not initiated through the Robinhood App, and the users behind them may even have never registered a Robinhood account
At Robinhood’s previous latest earnings call, Vlad @vladtenev said
"I think reaching $1 trillion is going to be very, very difficult. No financial company has ever reached a market cap of $1 trillion yet, but I think it is achievable"
And among the several growth paths he listed afterward, Robinhood Chain was one of them
The revenue Robinhood Chain is generating now may be the first financial signal that this new story is starting to be realized
2
5.1k
·
--
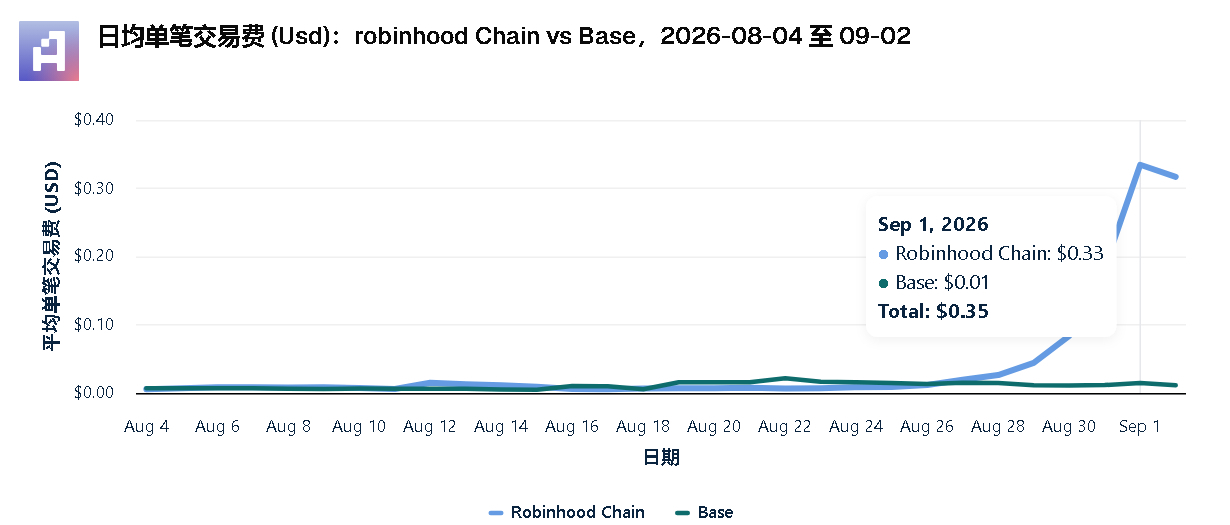
Everyone’s saying: “Oh my goodness, Robinhood Chain’s per-transaction chain-level fees hit a new high—4 million!”
I’m seriously—what the hell
Over the past two months, RB’s average fee per transaction has increased by 5,562%, 55x!
Even Jesus would be moved to tears
But in reality, during use, it’s not just 0.33 U per transaction
From what I’ve been using lately
A few tenths of a U is the baseline, around one or one-something U is normal, two or three U is a bit much, and above 5 U sometimes happens
This is one way to make an ultra-noble chain—so noble it’s expensive
This isn’t gas an L2 should have at all; Ethereum mainnet’s gas is cheaper than this CS
$ETH : Broke something—did I become an L2?
{future}(ETHUSDT)
Over on the other side, Arbitrum is probably laughing its mouth off: they put a vampire up front and then take their cut in the back
I thought I’d be getting a blood pack, but what I ended up with was a blood pool
When are we fast-forwarding to the stage of “All under heaven are tired of RB”?
Everyone’s saying: “Oh my goodness, Robinhood Chain’s per-transaction chain-level fees hit a new high—4 million!”
I’m seriously—what the hell
Over the past two months, RB’s average fee per transaction has increased by 5,562%, 55x!
Even Jesus would be moved to tears
But in reality, during use, it’s not just 0.33 U per transaction
From what I’ve been using lately
A few tenths of a U is the baseline, around one or one-something U is normal, two or three U is a bit much, and above 5 U sometimes happens
This is one way to make an ultra-noble chain—so noble it’s expensive
This isn’t gas an L2 should have at all; Ethereum mainnet’s gas is cheaper than this CS
$ETH : Broke something—did I become an L2?
Over on the other side, Arbitrum is probably laughing its mouth off: they put a vampire up front and then take their cut in the back
I thought I’d be getting a blood pack, but what I ended up with was a blood pool
When are we fast-forwarding to the stage of “All under heaven are tired of RB”?
I’m seriously—what the hell
Over the past two months, RB’s average fee per transaction has increased by 5,562%, 55x!
Even Jesus would be moved to tears
But in reality, during use, it’s not just 0.33 U per transaction
From what I’ve been using lately
A few tenths of a U is the baseline, around one or one-something U is normal, two or three U is a bit much, and above 5 U sometimes happens
This is one way to make an ultra-noble chain—so noble it’s expensive
This isn’t gas an L2 should have at all; Ethereum mainnet’s gas is cheaper than this CS
$ETH : Broke something—did I become an L2?
Over on the other side, Arbitrum is probably laughing its mouth off: they put a vampire up front and then take their cut in the back
I thought I’d be getting a blood pack, but what I ended up with was a blood pool
When are we fast-forwarding to the stage of “All under heaven are tired of RB”?
1
1
4.3k
·
--
Verified
This content pulls back the curtain on some so-called “buyback” design projects.
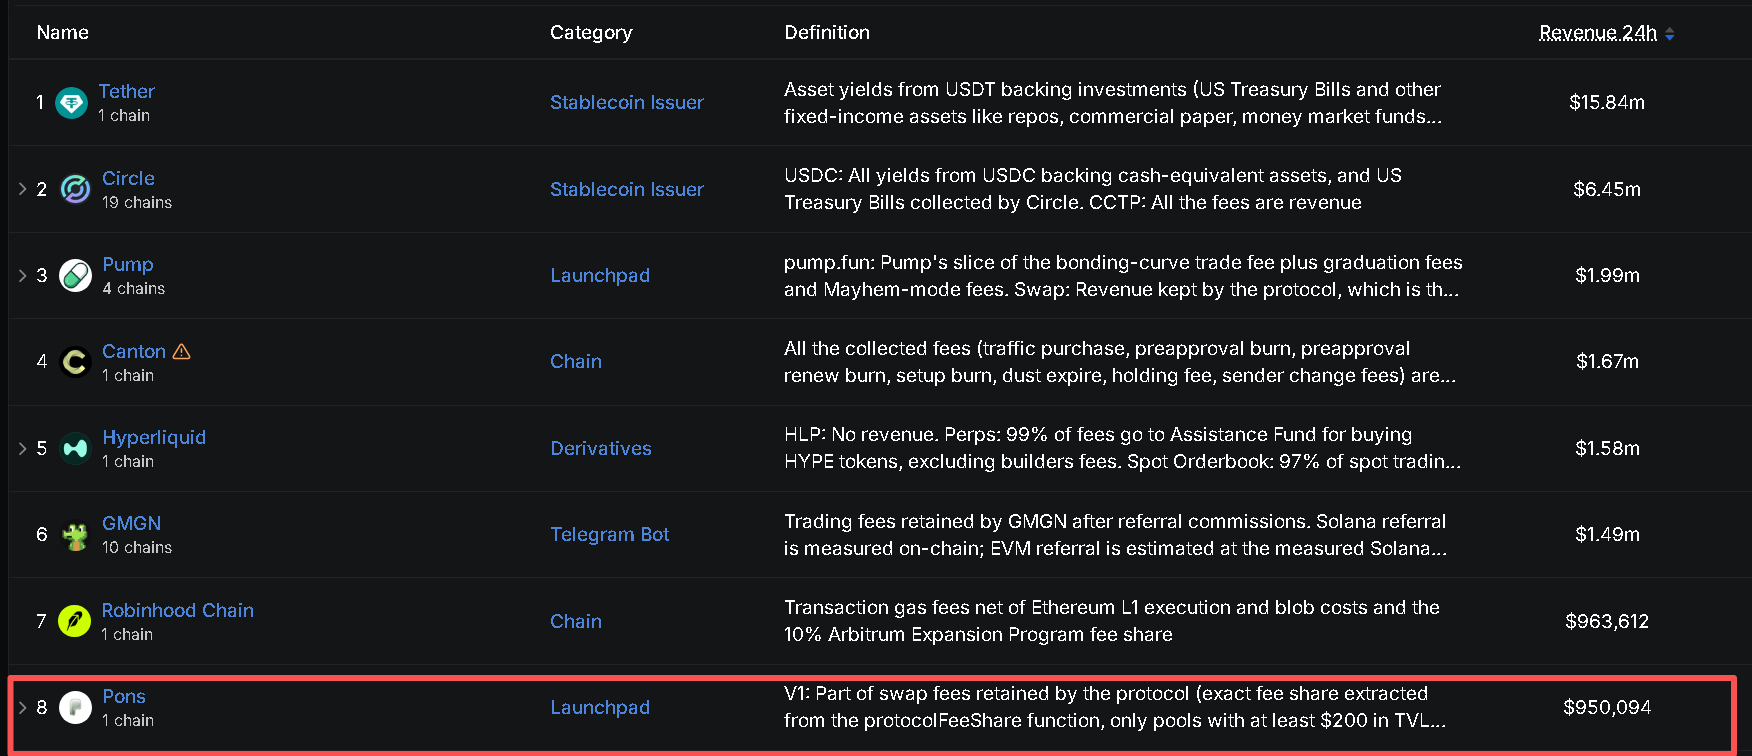
In the past 24H, Pons’s on-chain revenue was $950,000.
It’s almost the same as the entire Robinhood Chain’s revenue.
With a dramatic lead—80% of its revenue is used to buy back $PONS.
Its market cap has also reached 250 million.
After Hyperliquid, the market has started discussing buyback mechanisms again due to a certain protocol.
But it overlooks the most important prerequisite:
Creating revenue.
Fun fact: $OP actually has a buyback mechanism, but it has already stopped buying back for months.
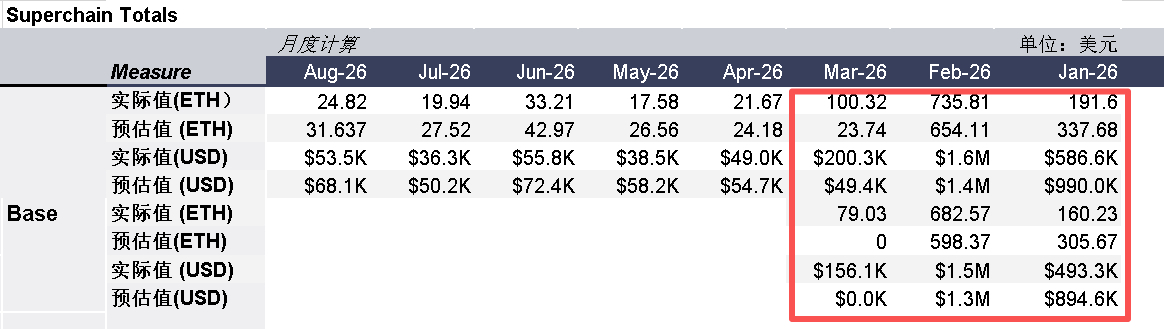
It’s not because the governance layer stopped the buyback—in fact, the original buyback plan already included a preset condition:
➠ If the revenue generated by the Optimism Collective in a given month is less than $200,000, the buyback for that month is paused and carried over to the next month.
Base has stopped contributing revenue since it no longer continues within the SuperChain framework.
As a result, the revenue contributed to Optimism from the entire SuperChain is under $200,000 in a single month (see Figure 2).
Base stops contributing = $OP revenue is not enough = buybacks stop.
If this Robinhood Chain phase were using the Optimism tech stack, the situation would be entirely different—unfortunately, it isn’t.
And just a few days ago, another well-known project, Ethena, also released a revenue buyback plan. As it stands, it is very likely to be approved.
I saw a media outlet saying, “Ethena will use 95% of its revenue for buybacks.”
But this is actually a very serious piece of misinformation, and it can easily mislead people who come across it.
Because it doesn’t explain the buyback conditions.
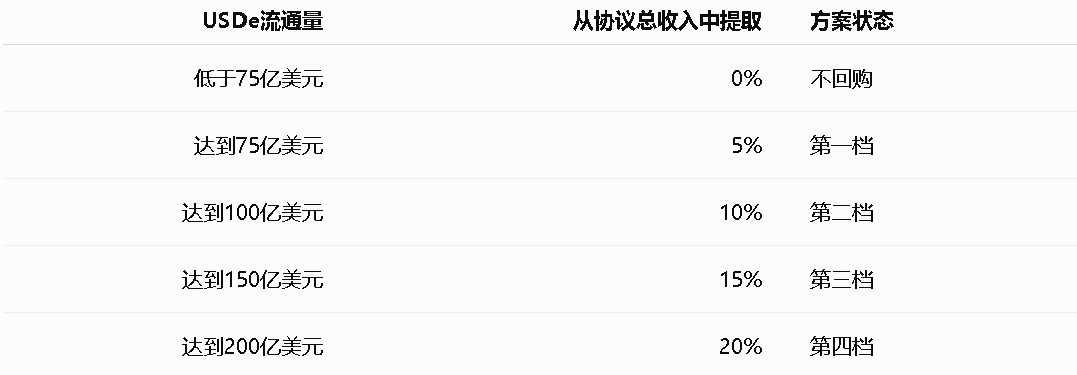
Like Optimism, its buyback is also conditional. The “95%” here refers to the buyback ratio of the foundation’s revenue.
But the precondition is that $USDE must reach a specific circulating supply level; in practice, the actual percentage is much lower (see Figure 3).
➠ Also, the trigger uses the USDe 14-day average circulating supply, which prevents buybacks from starting immediately after a single large mint pushes supply briefly over the threshold.
Has it done buybacks? Yes, but with conditions—and the threshold isn’t low.
What does that mean?
To put it simply: with USDe’s current circulating supply at 4 billion, to reach the first-tier buyback threshold, you’d need to nearly double it.
Here’s the full path:
USDe size → Ethena generates total revenue → extract 5% to 20% by tiers (Figure 3) → go into the foundation → then, and only then, buy back 95% of ENA.
All I can say is: the “real value” of $HYPE and $PONS is still increasing.
This content pulls back the curtain on some so-called “buyback” design projects.
In the past 24H, Pons’s on-chain revenue was $950,000.
It’s almost the same as the entire Robinhood Chain’s revenue.
With a dramatic lead—80% of its revenue is used to buy back $PONS.
Its market cap has also reached 250 million.
After Hyperliquid, the market has started discussing buyback mechanisms again due to a certain protocol.
But it overlooks the most important prerequisite:
Creating revenue.
Fun fact: $OP actually has a buyback mechanism, but it has already stopped buying back for months.
It’s not because the governance layer stopped the buyback—in fact, the original buyback plan already included a preset condition:
➠ If the revenue generated by the Optimism Collective in a given month is less than $200,000, the buyback for that month is paused and carried over to the next month.
Base has stopped contributing revenue since it no longer continues within the SuperChain framework.
As a result, the revenue contributed to Optimism from the entire SuperChain is under $200,000 in a single month (see Figure 2).
Base stops contributing = $OP revenue is not enough = buybacks stop.
If this Robinhood Chain phase were using the Optimism tech stack, the situation would be entirely different—unfortunately, it isn’t.
And just a few days ago, another well-known project, Ethena, also released a revenue buyback plan. As it stands, it is very likely to be approved.
I saw a media outlet saying, “Ethena will use 95% of its revenue for buybacks.”
But this is actually a very serious piece of misinformation, and it can easily mislead people who come across it.
Because it doesn’t explain the buyback conditions.
Like Optimism, its buyback is also conditional. The “95%” here refers to the buyback ratio of the foundation’s revenue.
But the precondition is that $USDE must reach a specific circulating supply level; in practice, the actual percentage is much lower (see Figure 3).
➠ Also, the trigger uses the USDe 14-day average circulating supply, which prevents buybacks from starting immediately after a single large mint pushes supply briefly over the threshold.
Has it done buybacks? Yes, but with conditions—and the threshold isn’t low.
What does that mean?
To put it simply: with USDe’s current circulating supply at 4 billion, to reach the first-tier buyback threshold, you’d need to nearly double it.
Here’s the full path:
USDe size → Ethena generates total revenue → extract 5% to 20% by tiers (Figure 3) → go into the foundation → then, and only then, buy back 95% of ENA.
All I can say is: the “real value” of $HYPE and $PONS is still increasing.
In the past 24H, Pons’s on-chain revenue was $950,000.
It’s almost the same as the entire Robinhood Chain’s revenue.
With a dramatic lead—80% of its revenue is used to buy back $PONS.
Its market cap has also reached 250 million.
After Hyperliquid, the market has started discussing buyback mechanisms again due to a certain protocol.
But it overlooks the most important prerequisite:
Creating revenue.
Fun fact: $OP actually has a buyback mechanism, but it has already stopped buying back for months.
It’s not because the governance layer stopped the buyback—in fact, the original buyback plan already included a preset condition:
➠ If the revenue generated by the Optimism Collective in a given month is less than $200,000, the buyback for that month is paused and carried over to the next month.
Base has stopped contributing revenue since it no longer continues within the SuperChain framework.
As a result, the revenue contributed to Optimism from the entire SuperChain is under $200,000 in a single month (see Figure 2).
Base stops contributing = $OP revenue is not enough = buybacks stop.
If this Robinhood Chain phase were using the Optimism tech stack, the situation would be entirely different—unfortunately, it isn’t.
And just a few days ago, another well-known project, Ethena, also released a revenue buyback plan. As it stands, it is very likely to be approved.
I saw a media outlet saying, “Ethena will use 95% of its revenue for buybacks.”
But this is actually a very serious piece of misinformation, and it can easily mislead people who come across it.
Because it doesn’t explain the buyback conditions.
Like Optimism, its buyback is also conditional. The “95%” here refers to the buyback ratio of the foundation’s revenue.
But the precondition is that $USDE must reach a specific circulating supply level; in practice, the actual percentage is much lower (see Figure 3).
➠ Also, the trigger uses the USDe 14-day average circulating supply, which prevents buybacks from starting immediately after a single large mint pushes supply briefly over the threshold.
Has it done buybacks? Yes, but with conditions—and the threshold isn’t low.
What does that mean?
To put it simply: with USDe’s current circulating supply at 4 billion, to reach the first-tier buyback threshold, you’d need to nearly double it.
Here’s the full path:
USDe size → Ethena generates total revenue → extract 5% to 20% by tiers (Figure 3) → go into the foundation → then, and only then, buy back 95% of ENA.
All I can say is: the “real value” of $HYPE and $PONS is still increasing.
1
2
7.4k
·
--
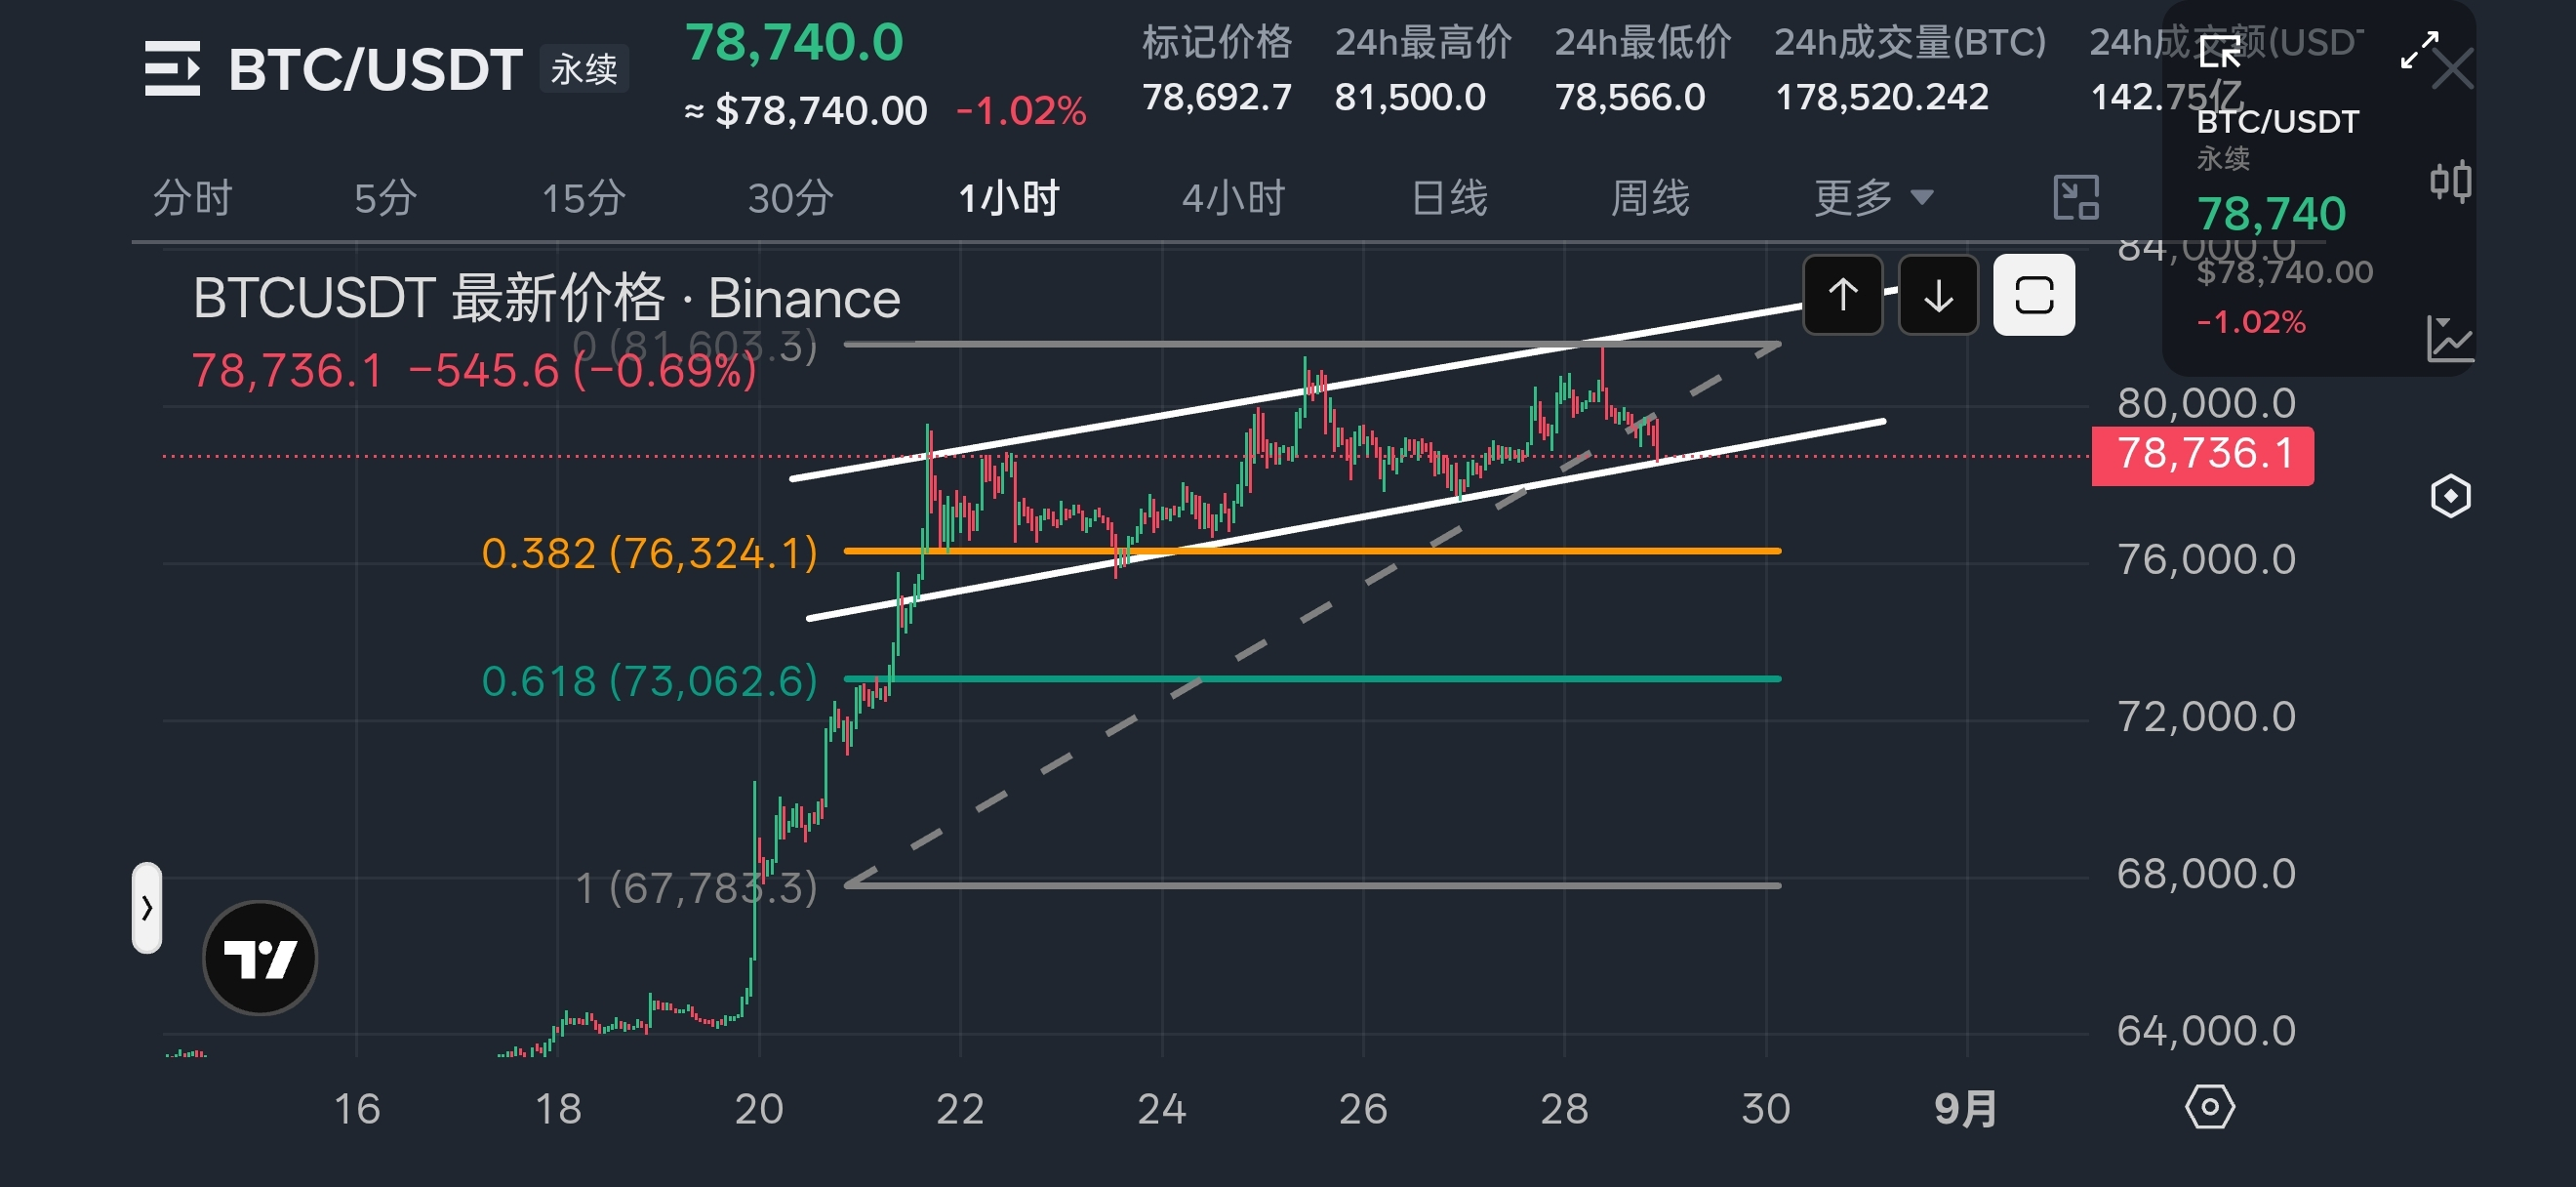
Ah today during the day the big pie $BTC once again failed to break the 80,000 integer mark
It came down after just bumping the lower edge of the upward channel
Hopefully this pullback support holds
Otherwise, dropping another 2,000 points can be seen in the short term
Ah today during the day the big pie $BTC once again failed to break the 80,000 integer mark
It came down after just bumping the lower edge of the upward channel
Hopefully this pullback support holds
Otherwise, dropping another 2,000 points can be seen in the short term
It came down after just bumping the lower edge of the upward channel
Hopefully this pullback support holds
Otherwise, dropping another 2,000 points can be seen in the short term
Eric SJ
·
--
A somewhat unfortunate phenomenon
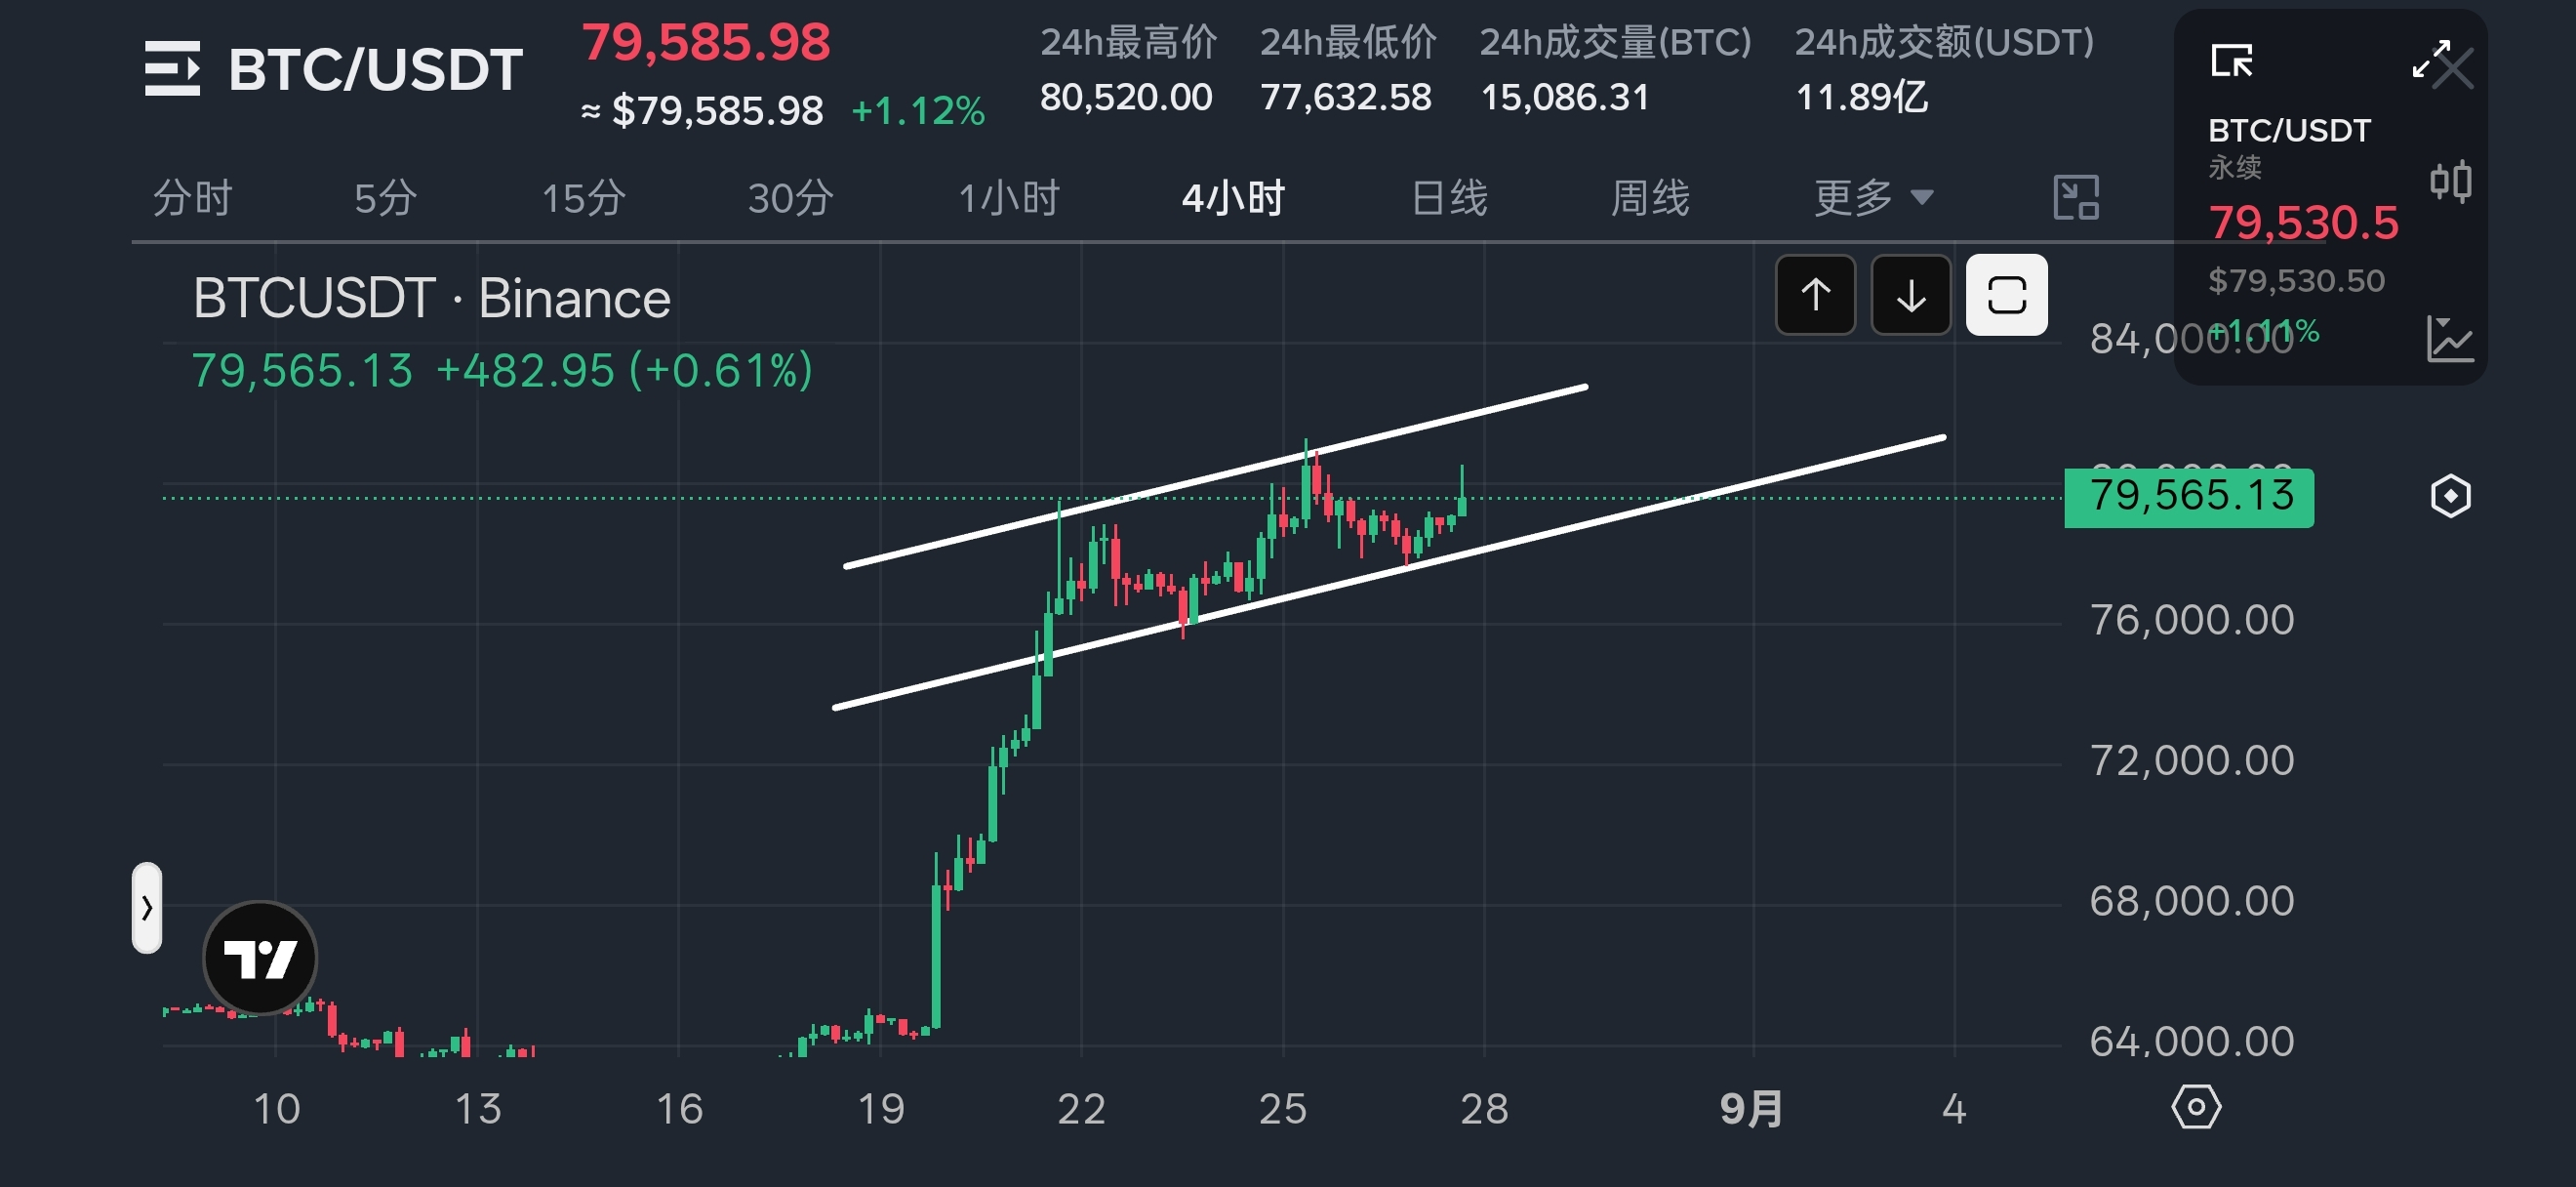
$BTC Just re-charged and broke through the 80,000 integer level a moment ago, but it dropped again without holding steady
And this time the peak didn’t even reach the previous short-term high 😨
$BTC Just re-charged and broke through the 80,000 integer level a moment ago, but it dropped again without holding steady
And this time the peak didn’t even reach the previous short-term high 😨
1
2
3.4k
·
--
Verified

Article
Are there more people buying GPUs—and are there more people using GPUs too?This time, Nvidia's $NVDA earnings report achieved a year-over-year doubling in both revenue and gross profit.
When a company's quarterly revenue is nearing $100 billion and can still double year over year, there's really not much point in continuing to discuss whether demand is strong.
I think the change in profit quality is what needs to be parsed after a company of this size releases its quarterly earnings report.
At Nvidia, it’s really about finding a few data points in the earnings report to solve this problem: given revenue at this scale, how much profit does it need to give up to the supply chain?
Are there more people buying GPUs—and are there more people using GPUs too?
This time, Nvidia's $NVDA earnings report achieved a year-over-year doubling in both revenue and gross profit.
When a company's quarterly revenue is nearing $100 billion and can still double year over year, there's really not much point in continuing to discuss whether demand is strong.
I think the change in profit quality is what needs to be parsed after a company of this size releases its quarterly earnings report.
At Nvidia, it’s really about finding a few data points in the earnings report to solve this problem: given revenue at this scale, how much profit does it need to give up to the supply chain?
When a company's quarterly revenue is nearing $100 billion and can still double year over year, there's really not much point in continuing to discuss whether demand is strong.
I think the change in profit quality is what needs to be parsed after a company of this size releases its quarterly earnings report.
At Nvidia, it’s really about finding a few data points in the earnings report to solve this problem: given revenue at this scale, how much profit does it need to give up to the supply chain?
2.9k
·
--
A somewhat unfortunate phenomenon
$BTC Just re-charged and broke through the 80,000 integer level a moment ago, but it dropped again without holding steady
{future}(BTCUSDT)
And this time the peak didn’t even reach the previous short-term high 😨
A somewhat unfortunate phenomenon
$BTC Just re-charged and broke through the 80,000 integer level a moment ago, but it dropped again without holding steady
And this time the peak didn’t even reach the previous short-term high 😨
$BTC Just re-charged and broke through the 80,000 integer level a moment ago, but it dropped again without holding steady
And this time the peak didn’t even reach the previous short-term high 😨
1
1
3k
·
--
Verified
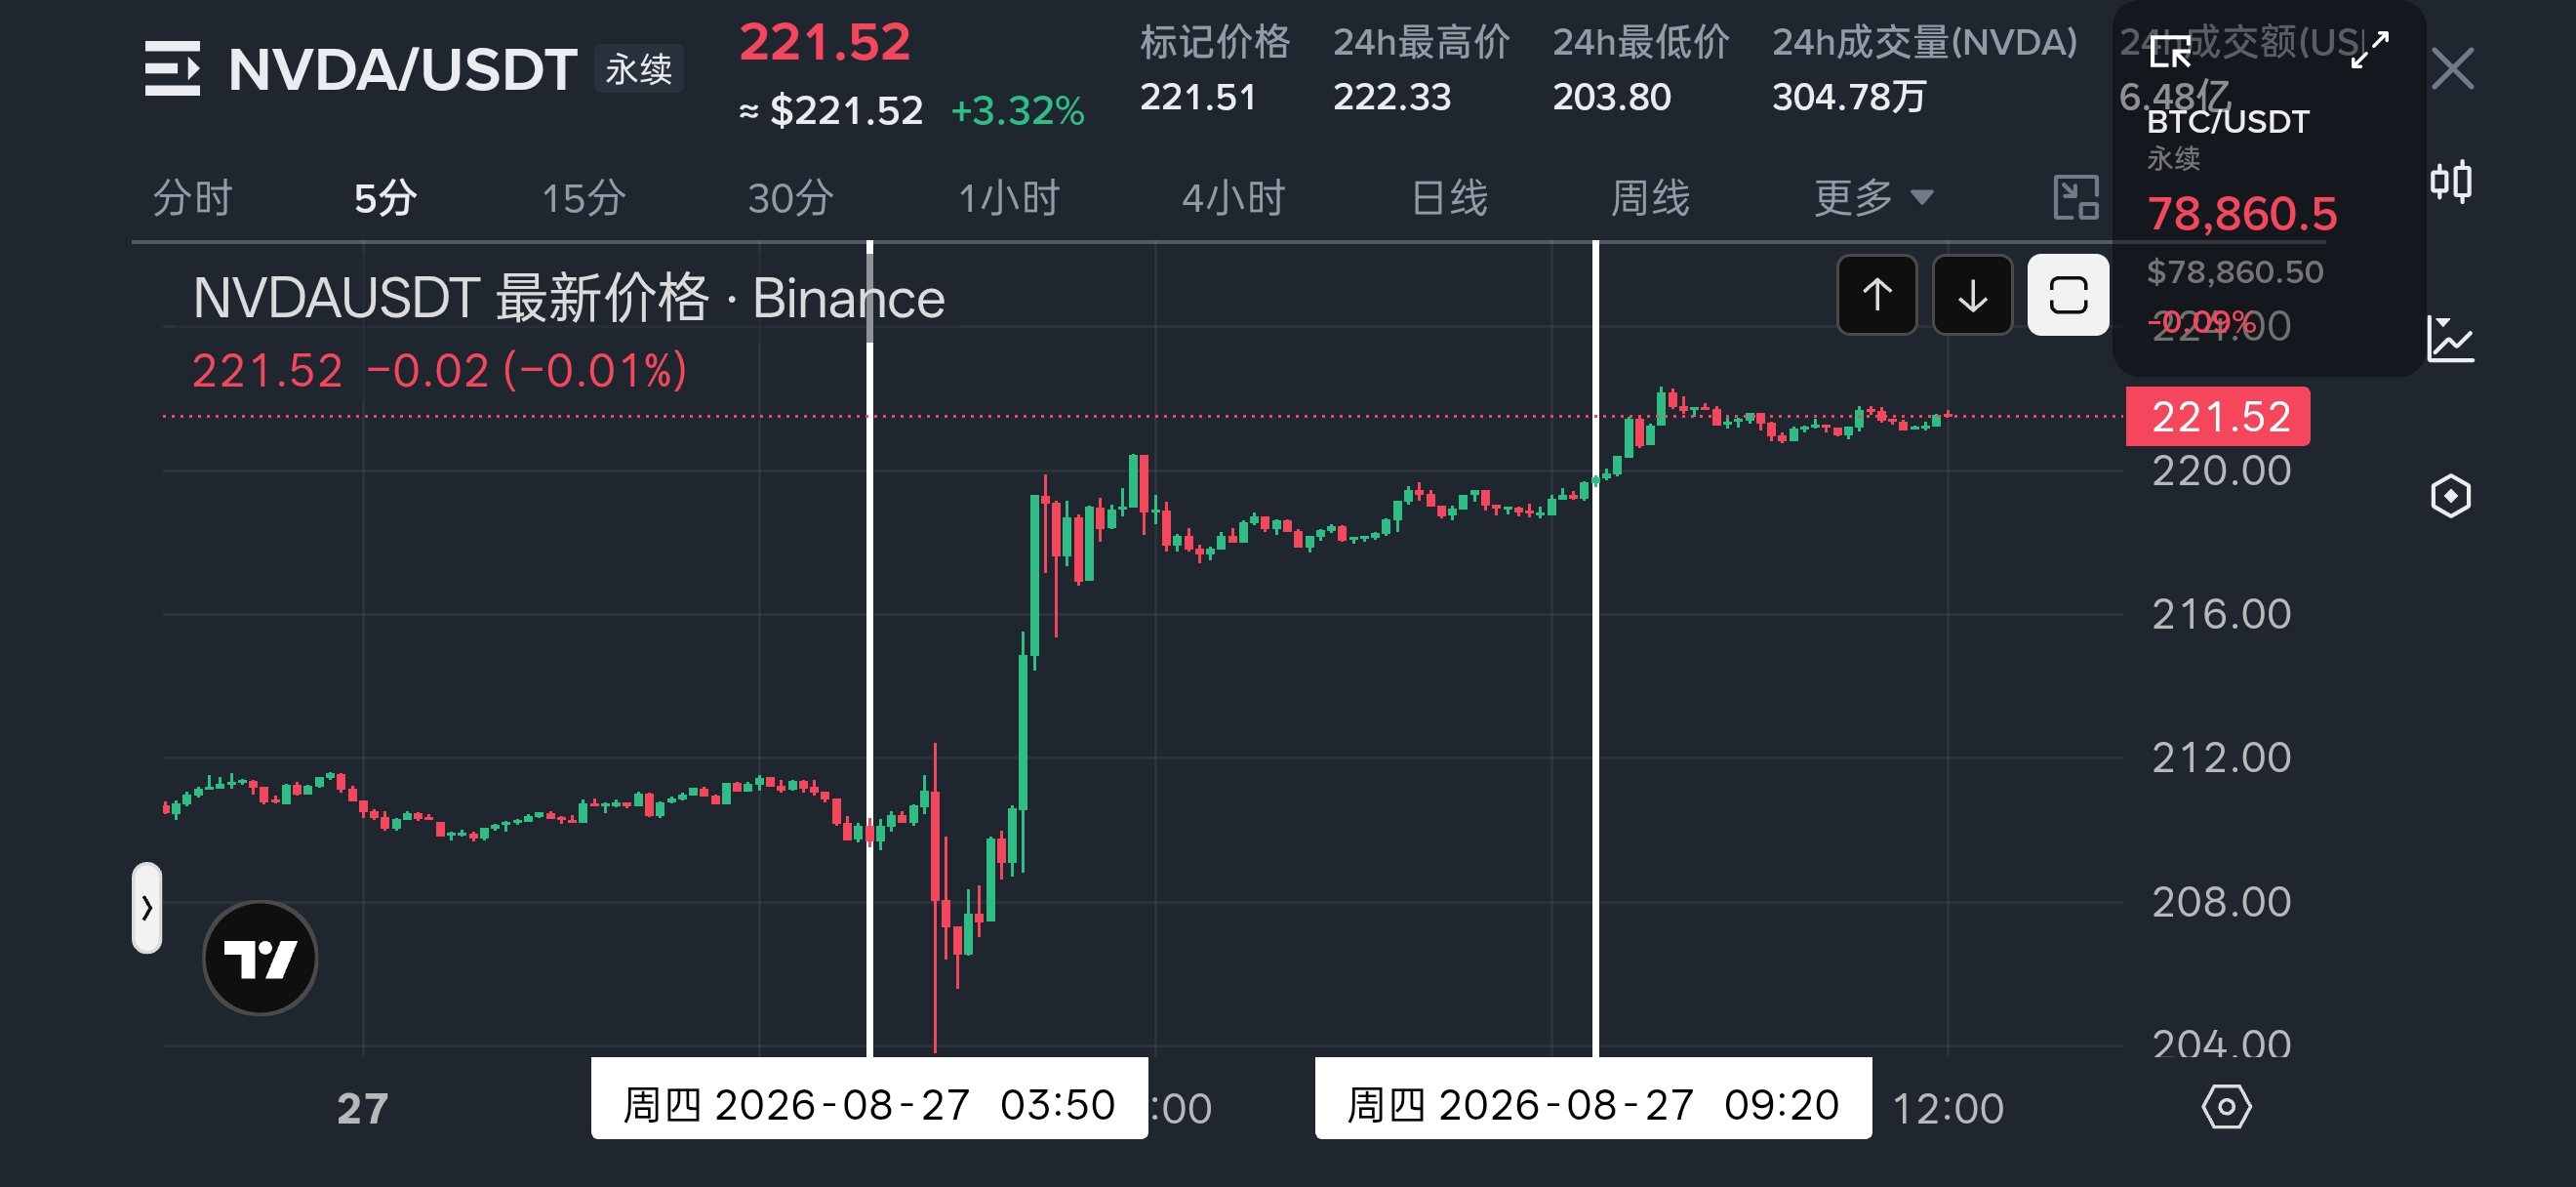
Nvidia’s latest earnings report for $NVDA showed revenue up 106% year over year and gross profit up 113% year over year.
Yet after-hours trading, the stock fell for a while.
But soon after the earnings call began, it quickly turned upward.
Based on the order in which information was disclosed afterward, we can attribute the two phases of the chart roughly to two different sets of data the market received.
1. The after-hours drop may have been caused by Nvidia’s guidance for next quarter’s gross margin being slightly below market expectations.
(Nvidia expects next quarter’s gross margin to be about 74%, slightly lower than the market’s 74.77%.)
For a company whose valuation depends heavily on growth quality,
having revenue come in above expectations but gross margin decline is the most obvious negative signal for the market right after the report.
In addition, at the start of the earnings call, management also said: due to rising memory prices, gross margin could fall further in the fourth quarter.
However, this data suggests that gross-margin pressure may last longer—but since it was disclosed only during the call, it can’t explain the first segment of the decline immediately after the earnings release.
2. The subsequent rebound is easier to understand.
Nvidia expects FY2028 revenue growth of about 70%, whereas the pre-report market consensus was only around 44%.
That is a significant beat versus market expectations.
And combined with the factors affecting gross margin, this is still a forecast constrained by supply limits.
There is also a direct quote from the call. Before the official assumption of 70% growth, there’s an assumption that is not constrained by supply:
“Customer-provided guidance points to Nvidia achieving nearly double-digit growth in the next fiscal year.”
In other words, based on the demand forecasts provided by customers, market demand—at least in theory—could support Nvidia achieving nearly double-digit growth in the next fiscal year.
But the company’s current overall supply capacity can only support growth of roughly 70%.
Judging from the after-hours price action, the market’s better-than-expected long-term growth ability temporarily outweighed the negative impact of falling gross margins.
That said, this is only a quick interpretation based on cross-checking the after-hours chart, initial earnings-release data, and transcript information from the earnings call.
It’s not a complete view of this earnings report.
Including what changes have occurred in Nvidia’s business structure, which customers are driving the growth, and what costs may be required to support growth in the next stage.
More later~
Nvidia’s latest earnings report for $NVDA showed revenue up 106% year over year and gross profit up 113% year over year.
Yet after-hours trading, the stock fell for a while.
But soon after the earnings call began, it quickly turned upward.
Based on the order in which information was disclosed afterward, we can attribute the two phases of the chart roughly to two different sets of data the market received.
1. The after-hours drop may have been caused by Nvidia’s guidance for next quarter’s gross margin being slightly below market expectations.
(Nvidia expects next quarter’s gross margin to be about 74%, slightly lower than the market’s 74.77%.)
For a company whose valuation depends heavily on growth quality,
having revenue come in above expectations but gross margin decline is the most obvious negative signal for the market right after the report.
In addition, at the start of the earnings call, management also said: due to rising memory prices, gross margin could fall further in the fourth quarter.
However, this data suggests that gross-margin pressure may last longer—but since it was disclosed only during the call, it can’t explain the first segment of the decline immediately after the earnings release.
2. The subsequent rebound is easier to understand.
Nvidia expects FY2028 revenue growth of about 70%, whereas the pre-report market consensus was only around 44%.
That is a significant beat versus market expectations.
And combined with the factors affecting gross margin, this is still a forecast constrained by supply limits.
There is also a direct quote from the call. Before the official assumption of 70% growth, there’s an assumption that is not constrained by supply:
“Customer-provided guidance points to Nvidia achieving nearly double-digit growth in the next fiscal year.”
In other words, based on the demand forecasts provided by customers, market demand—at least in theory—could support Nvidia achieving nearly double-digit growth in the next fiscal year.
But the company’s current overall supply capacity can only support growth of roughly 70%.
Judging from the after-hours price action, the market’s better-than-expected long-term growth ability temporarily outweighed the negative impact of falling gross margins.
That said, this is only a quick interpretation based on cross-checking the after-hours chart, initial earnings-release data, and transcript information from the earnings call.
It’s not a complete view of this earnings report.
Including what changes have occurred in Nvidia’s business structure, which customers are driving the growth, and what costs may be required to support growth in the next stage.
More later~
Yet after-hours trading, the stock fell for a while.
But soon after the earnings call began, it quickly turned upward.
Based on the order in which information was disclosed afterward, we can attribute the two phases of the chart roughly to two different sets of data the market received.
1. The after-hours drop may have been caused by Nvidia’s guidance for next quarter’s gross margin being slightly below market expectations.
(Nvidia expects next quarter’s gross margin to be about 74%, slightly lower than the market’s 74.77%.)
For a company whose valuation depends heavily on growth quality,
having revenue come in above expectations but gross margin decline is the most obvious negative signal for the market right after the report.
In addition, at the start of the earnings call, management also said: due to rising memory prices, gross margin could fall further in the fourth quarter.
However, this data suggests that gross-margin pressure may last longer—but since it was disclosed only during the call, it can’t explain the first segment of the decline immediately after the earnings release.
2. The subsequent rebound is easier to understand.
Nvidia expects FY2028 revenue growth of about 70%, whereas the pre-report market consensus was only around 44%.
That is a significant beat versus market expectations.
And combined with the factors affecting gross margin, this is still a forecast constrained by supply limits.
There is also a direct quote from the call. Before the official assumption of 70% growth, there’s an assumption that is not constrained by supply:
“Customer-provided guidance points to Nvidia achieving nearly double-digit growth in the next fiscal year.”
In other words, based on the demand forecasts provided by customers, market demand—at least in theory—could support Nvidia achieving nearly double-digit growth in the next fiscal year.
But the company’s current overall supply capacity can only support growth of roughly 70%.
Judging from the after-hours price action, the market’s better-than-expected long-term growth ability temporarily outweighed the negative impact of falling gross margins.
That said, this is only a quick interpretation based on cross-checking the after-hours chart, initial earnings-release data, and transcript information from the earnings call.
It’s not a complete view of this earnings report.
Including what changes have occurred in Nvidia’s business structure, which customers are driving the growth, and what costs may be required to support growth in the next stage.
More later~
1
3.1k
·
--
Verified
Montreal Bank $BMO.US Q3 earnings report shows a year-on-year net profit decline of -25%
But that doesn’t necessarily mean its operations deteriorated. Adjusted net profit increased 19% year-on-year, and adjusted earnings per share grew 22%
This suggests that there were one-off factors affecting the reported accounting profit this time, rather than any core deterioration in profitability.
As for this one-off factor, after the earnings report came out, not many people talked about it—but the answer was disclosed as early as two or three months ago.
That’s also why the market didn’t really discuss much about this earnings report.
(What the market mainstream mainly discussed was that the adjusted data still indicates the core business is healthy, and then they moved on.)
First, this one-off factor is due to the sale of two businesses: transportation finance and vendor finance.
The former provides financing loans to the transportation industry, while the latter provides financing loans to various manufacturers and suppliers.
And this divestment isn’t a simple small-scale adjustment—it involves a loan and lease asset portfolio of about CAD 14.5 billion.
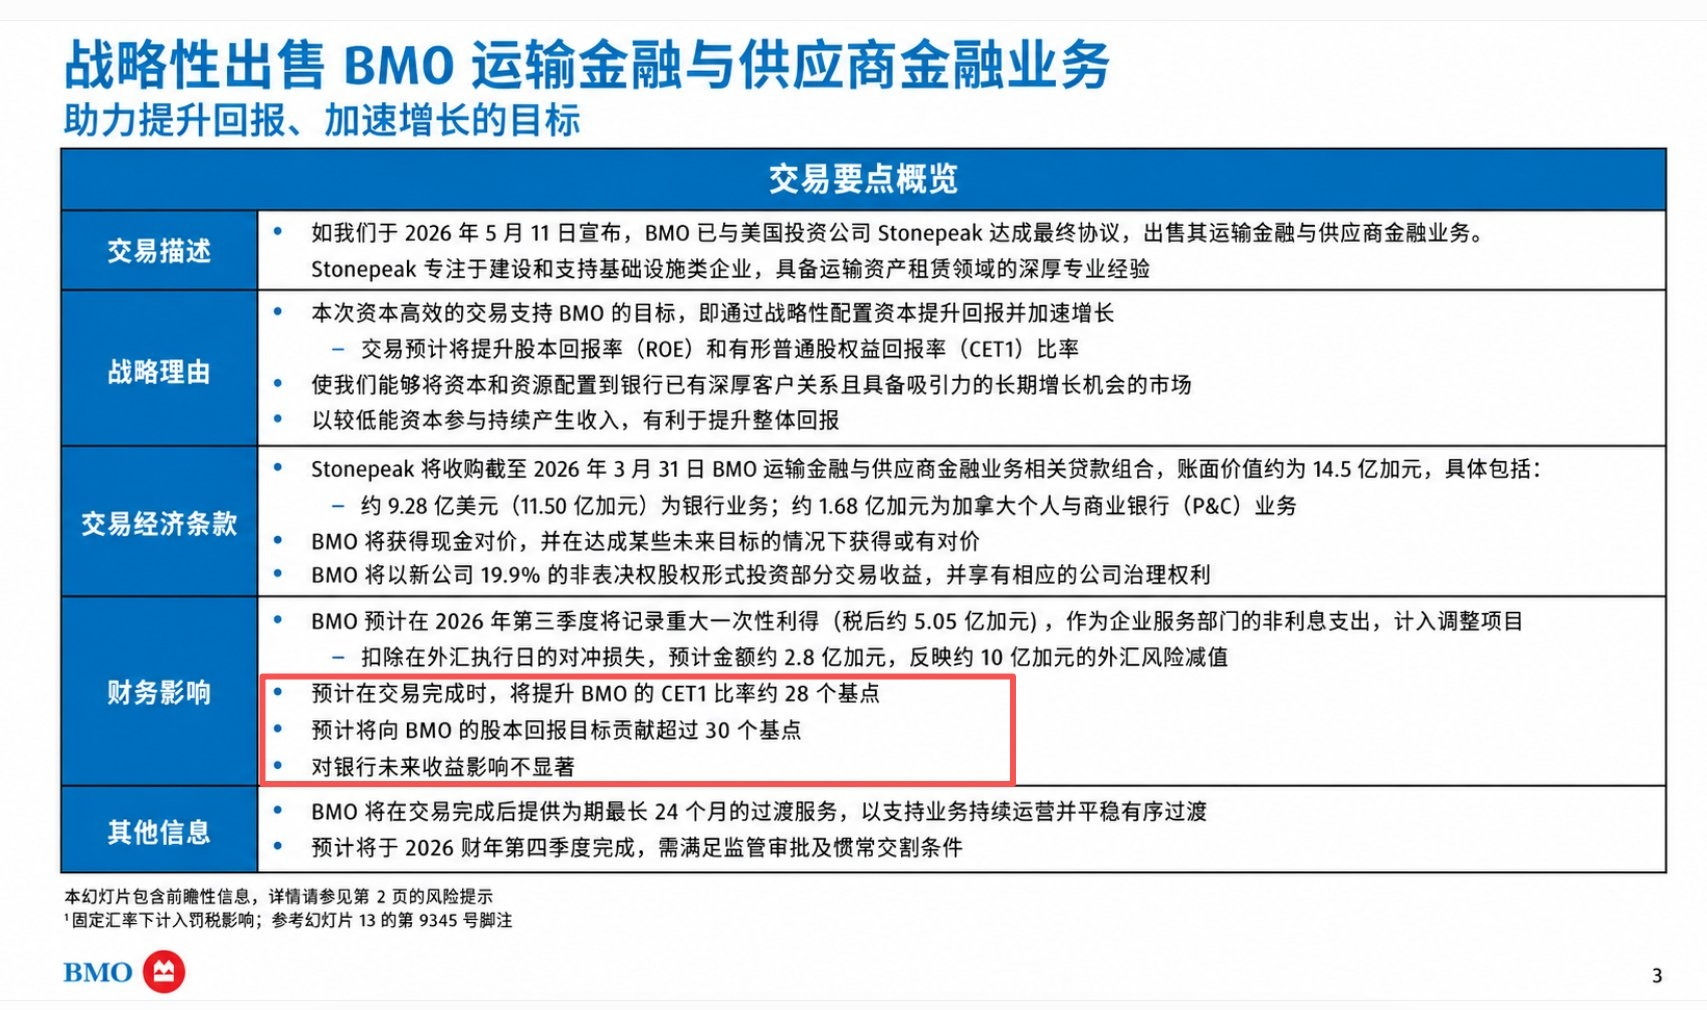
In an official filing before that (in May), the impact of this transaction was already explained.
➠ Let me boil it down to one point: this sale has a short-term negative impact on the profit numbers reported for the period, while it improves return on equity in the long run.
How to understand it? For example, suppose Montreal Bank invests one million. Because it has a diverse product mix, the total revenue generated across different products is spread out.
Now it sells two products. The products themselves aren’t necessarily problematic, but the profit generated per unit may be relatively lower compared with other products.
So by “reducing the denominator,” the return on [invested yield] improves—that’s the underlying logic of this transaction.
In the company’s filing, it also stated that this transaction would contribute 30 basis points to return on equity.
Also, BMO isn’t completely exiting these two businesses.
After the transaction closes, BMO will still retain about 19.9% equity in the new company.
That means it doesn’t believe the business has no value, nor is it abandoning this market entirely.
Instead, it participates in a different way: previously it held the products and underlying assets itself while bearing the corresponding capital usage.
Now, through an equity investment approach, it continues to share in future business growth, thereby reducing its own capital pressure.
In practice, this not only optimizes its own “product mix,” but also preserves part of the revenue stream from the original product channels.
Montreal Bank $BMO.US Q3 earnings report shows a year-on-year net profit decline of -25%
But that doesn’t necessarily mean its operations deteriorated. Adjusted net profit increased 19% year-on-year, and adjusted earnings per share grew 22%
This suggests that there were one-off factors affecting the reported accounting profit this time, rather than any core deterioration in profitability.
As for this one-off factor, after the earnings report came out, not many people talked about it—but the answer was disclosed as early as two or three months ago.
That’s also why the market didn’t really discuss much about this earnings report.
(What the market mainstream mainly discussed was that the adjusted data still indicates the core business is healthy, and then they moved on.)
First, this one-off factor is due to the sale of two businesses: transportation finance and vendor finance.
The former provides financing loans to the transportation industry, while the latter provides financing loans to various manufacturers and suppliers.
And this divestment isn’t a simple small-scale adjustment—it involves a loan and lease asset portfolio of about CAD 14.5 billion.
In an official filing before that (in May), the impact of this transaction was already explained.
➠ Let me boil it down to one point: this sale has a short-term negative impact on the profit numbers reported for the period, while it improves return on equity in the long run.
How to understand it? For example, suppose Montreal Bank invests one million. Because it has a diverse product mix, the total revenue generated across different products is spread out.
Now it sells two products. The products themselves aren’t necessarily problematic, but the profit generated per unit may be relatively lower compared with other products.
So by “reducing the denominator,” the return on [invested yield] improves—that’s the underlying logic of this transaction.
In the company’s filing, it also stated that this transaction would contribute 30 basis points to return on equity.
Also, BMO isn’t completely exiting these two businesses.
After the transaction closes, BMO will still retain about 19.9% equity in the new company.
That means it doesn’t believe the business has no value, nor is it abandoning this market entirely.
Instead, it participates in a different way: previously it held the products and underlying assets itself while bearing the corresponding capital usage.
Now, through an equity investment approach, it continues to share in future business growth, thereby reducing its own capital pressure.
In practice, this not only optimizes its own “product mix,” but also preserves part of the revenue stream from the original product channels.
But that doesn’t necessarily mean its operations deteriorated. Adjusted net profit increased 19% year-on-year, and adjusted earnings per share grew 22%
This suggests that there were one-off factors affecting the reported accounting profit this time, rather than any core deterioration in profitability.
As for this one-off factor, after the earnings report came out, not many people talked about it—but the answer was disclosed as early as two or three months ago.
That’s also why the market didn’t really discuss much about this earnings report.
(What the market mainstream mainly discussed was that the adjusted data still indicates the core business is healthy, and then they moved on.)
First, this one-off factor is due to the sale of two businesses: transportation finance and vendor finance.
The former provides financing loans to the transportation industry, while the latter provides financing loans to various manufacturers and suppliers.
And this divestment isn’t a simple small-scale adjustment—it involves a loan and lease asset portfolio of about CAD 14.5 billion.
In an official filing before that (in May), the impact of this transaction was already explained.
➠ Let me boil it down to one point: this sale has a short-term negative impact on the profit numbers reported for the period, while it improves return on equity in the long run.
How to understand it? For example, suppose Montreal Bank invests one million. Because it has a diverse product mix, the total revenue generated across different products is spread out.
Now it sells two products. The products themselves aren’t necessarily problematic, but the profit generated per unit may be relatively lower compared with other products.
So by “reducing the denominator,” the return on [invested yield] improves—that’s the underlying logic of this transaction.
In the company’s filing, it also stated that this transaction would contribute 30 basis points to return on equity.
Also, BMO isn’t completely exiting these two businesses.
After the transaction closes, BMO will still retain about 19.9% equity in the new company.
That means it doesn’t believe the business has no value, nor is it abandoning this market entirely.
Instead, it participates in a different way: previously it held the products and underlying assets itself while bearing the corresponding capital usage.
Now, through an equity investment approach, it continues to share in future business growth, thereby reducing its own capital pressure.
In practice, this not only optimizes its own “product mix,” but also preserves part of the revenue stream from the original product channels.
BMOUS-1.43%
3
7
2.4k
Log in to explore more content
Join global crypto users on Binance Square
⚡️ Get latest and useful information about crypto.
💬 Trusted by the world’s largest crypto exchange.
👍 Discover real insights from verified creators.
Email / Phone number
Trending Topics
EtherGains70.9%InQ3
405 views
53 Discussing
#EtherGains70.9%InQ3
Ethereum delivered a powerful Q3 performance, gaining around 70.9% and drawing renewed attention from crypto traders. The strong quarterly move highlights increased momentum and market interest around $ETH .
Yahoo Finance +1
#ETH #Ethereum #Crypto #ETHUSDT💰
$ETH
Tayrish
·0 Likes
·4 views
US10YearYieldNears5.3%
20,263 views
284 Discussing
DollarIndexHitsHighestSinceMay2025
87 views
27 Discussing