

TokenScan SD
274 Posts

TokenScan SD
Report
Block User
BP-268858A34D3A : Crypto Analyzer,web3 tool builder and security Token Analyze 🔥
Open Trade
Occasional Trader
4.4 Years
81 Following
31 Followers
66 Liked
Posts
Portfolio
All
Quotes
Videos
·
--
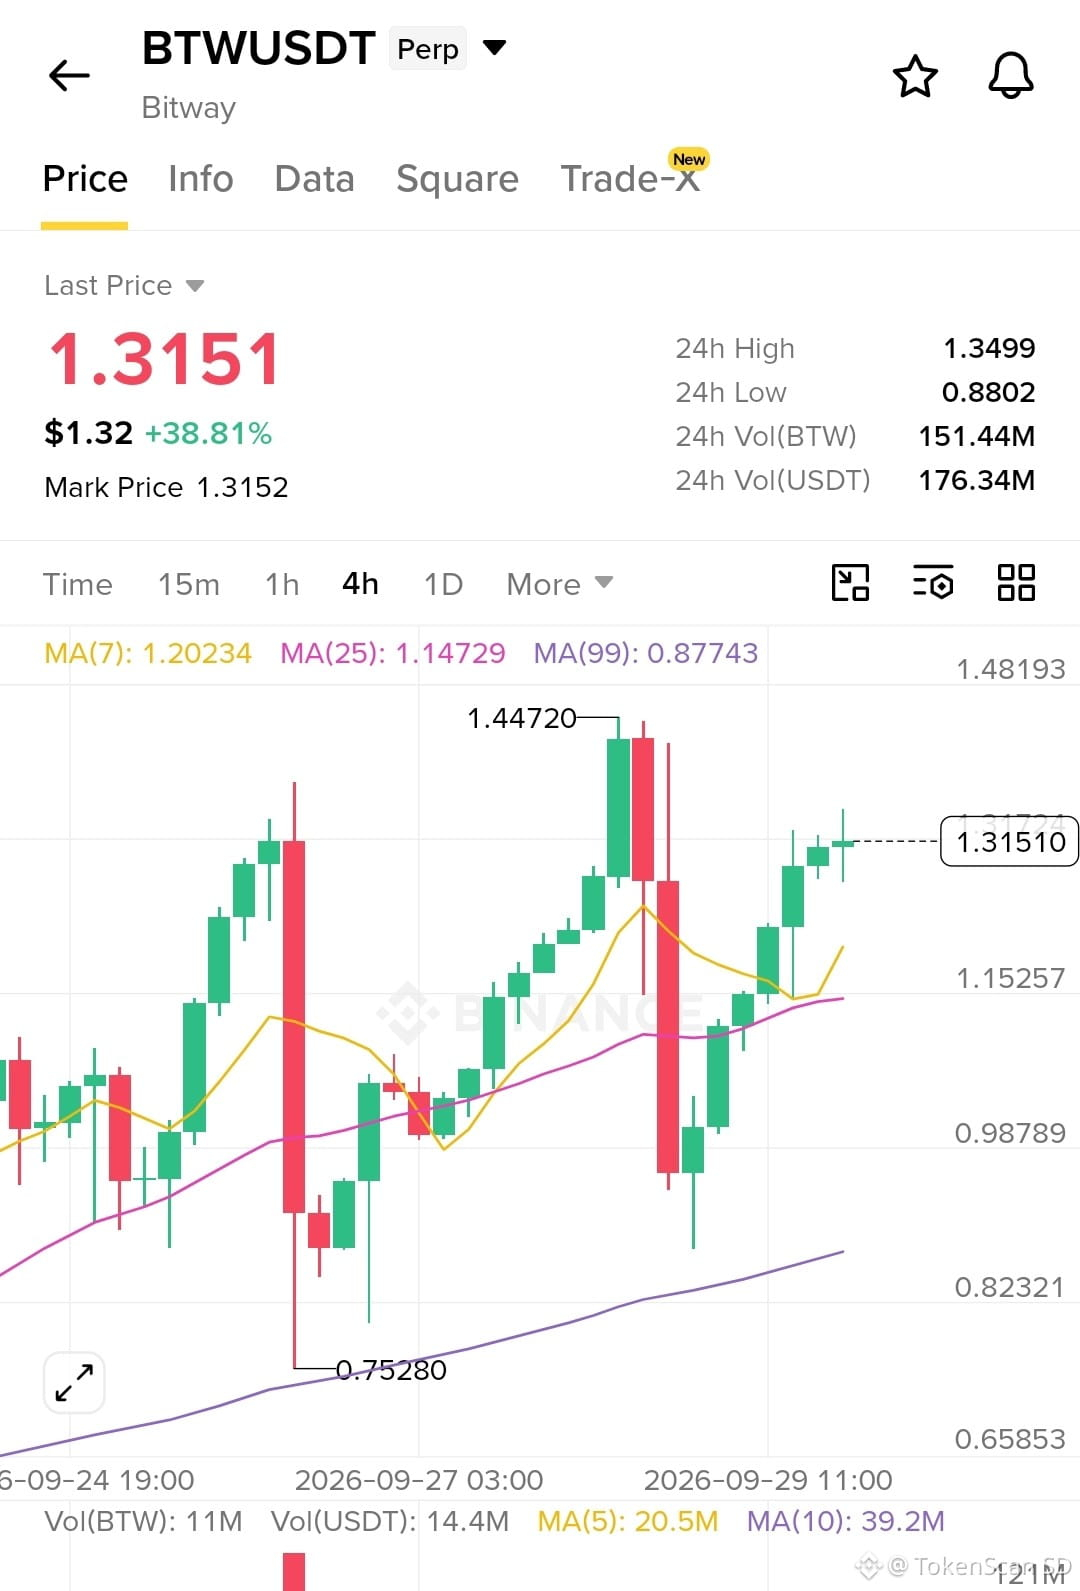
I want to disclaimer for 🚨 TOP 1 gainers the pattern is WOW 😋🤔
Short after confirmation (safer) with order market only :
👉Entry: area 1,40-1,45, near the previous high 1,4472, and only if rejection appears (long upper wick or red candle)
👉Stop loss: above 1,50
Target: 1,15 (near MA25) then 1,00
Risk/reward: around 1:3 to the first target
#DYOR🟢
$BTW
{future}(BTWUSDT)
I want to disclaimer for 🚨 TOP 1 gainers the pattern is WOW 😋🤔
Short after confirmation (safer) with order market only :
👉Entry: area 1,40-1,45, near the previous high 1,4472, and only if rejection appears (long upper wick or red candle)
👉Stop loss: above 1,50
Target: 1,15 (near MA25) then 1,00
Risk/reward: around 1:3 to the first target
#DYOR🟢
$BTW
Short after confirmation (safer) with order market only :
👉Entry: area 1,40-1,45, near the previous high 1,4472, and only if rejection appears (long upper wick or red candle)
👉Stop loss: above 1,50
Target: 1,15 (near MA25) then 1,00
Risk/reward: around 1:3 to the first target
#DYOR🟢
$BTW
753
·
--
#EarningsSeason
📌 $MU Micron is 😋
It’s like a “memory” factory for servers and AI. The more AI products, the more sales it gets 🤑
Before we continue, let’s look at the quick data first 👇
🚨 Price: ±$1,070 (up ±553% in 1 year)
👉 Market cap: ±$1.2 trillion
👉 Yesterday’s report: EPS $25.11 vs estimate $20.98 (beat 19.7%), revenue $41.46B vs estimate $35.91B
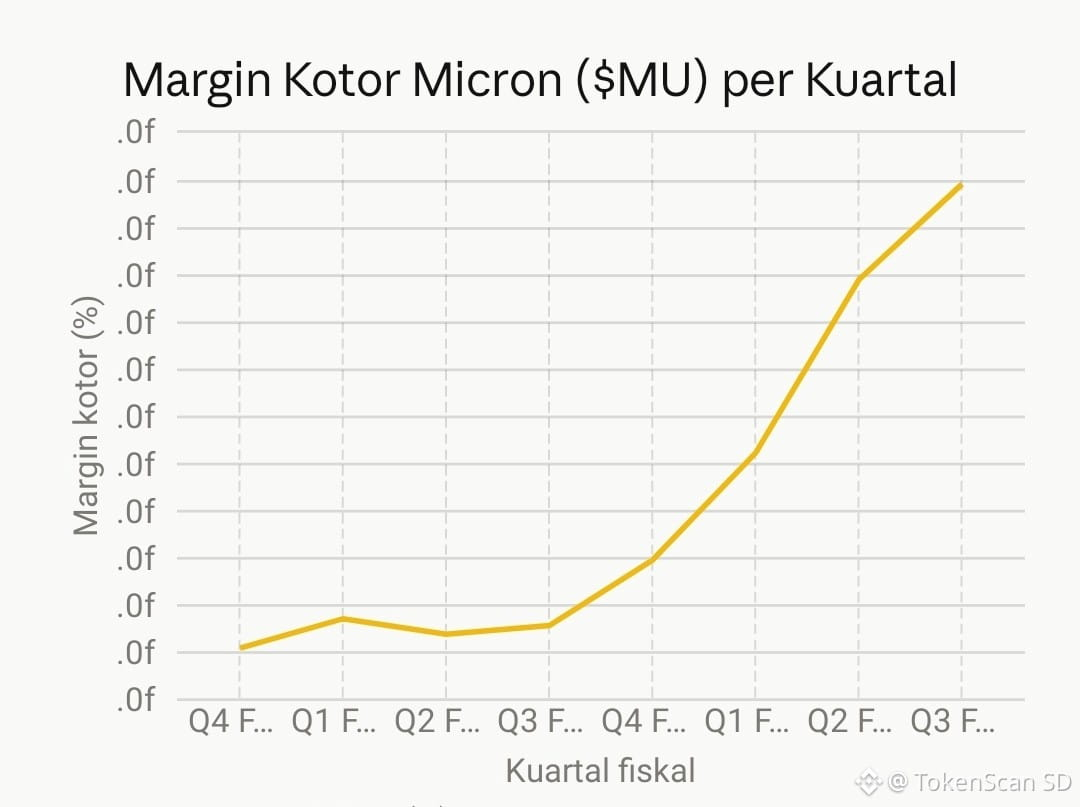
👉 Last quarter gross margin: 84.6% (a year ago only ±38%)
👉 Analysts’ Q4 estimates: revenue $57.2B (up ±38%), EPS $35.47
👉 Average analyst price target: ±$1,550 (58 Buy, 10 Hold, 2 Sell)
Margin has risen almost 2.4x in 2 years. The question is: is there still room to go up? 🤔🤔🤔
This is just my assumption as a trader:
👉 BEARISH IN THE SHORT TERM.
The price has already risen ±14.7% in a month leading up to the report, meaning good news has already been priced in. The market expects the margin to break 86%. If the results are only “in line with expectations,” the correction could happen quickly. It’s like a test score of 84 trying to become 86—the higher it is, the harder it is to climb. right or not 😁
And my position plan: “I won’t enter first 🔎🔎.” I’ll wait for the market’s reaction after the report comes out, then decide next steps. What about you?
⚠️ Not financial advice. DYOR.
#EarningsSeason #MU $MUB $MU
{future}(MUUSDT)
#EarningsSeason
📌 $MU Micron is 😋
It’s like a “memory” factory for servers and AI. The more AI products, the more sales it gets 🤑
Before we continue, let’s look at the quick data first 👇
🚨 Price: ±$1,070 (up ±553% in 1 year)
👉 Market cap: ±$1.2 trillion
👉 Yesterday’s report: EPS $25.11 vs estimate $20.98 (beat 19.7%), revenue $41.46B vs estimate $35.91B
👉 Last quarter gross margin: 84.6% (a year ago only ±38%)
👉 Analysts’ Q4 estimates: revenue $57.2B (up ±38%), EPS $35.47
👉 Average analyst price target: ±$1,550 (58 Buy, 10 Hold, 2 Sell)
Margin has risen almost 2.4x in 2 years. The question is: is there still room to go up? 🤔🤔🤔
This is just my assumption as a trader:
👉 BEARISH IN THE SHORT TERM.
The price has already risen ±14.7% in a month leading up to the report, meaning good news has already been priced in. The market expects the margin to break 86%. If the results are only “in line with expectations,” the correction could happen quickly. It’s like a test score of 84 trying to become 86—the higher it is, the harder it is to climb. right or not 😁
And my position plan: “I won’t enter first 🔎🔎.” I’ll wait for the market’s reaction after the report comes out, then decide next steps. What about you?
⚠️ Not financial advice. DYOR.
#EarningsSeason #MU $MUB $MU
📌 $MU Micron is 😋
It’s like a “memory” factory for servers and AI. The more AI products, the more sales it gets 🤑
Before we continue, let’s look at the quick data first 👇
🚨 Price: ±$1,070 (up ±553% in 1 year)
👉 Market cap: ±$1.2 trillion
👉 Yesterday’s report: EPS $25.11 vs estimate $20.98 (beat 19.7%), revenue $41.46B vs estimate $35.91B
👉 Last quarter gross margin: 84.6% (a year ago only ±38%)
👉 Analysts’ Q4 estimates: revenue $57.2B (up ±38%), EPS $35.47
👉 Average analyst price target: ±$1,550 (58 Buy, 10 Hold, 2 Sell)
Margin has risen almost 2.4x in 2 years. The question is: is there still room to go up? 🤔🤔🤔
This is just my assumption as a trader:
👉 BEARISH IN THE SHORT TERM.
The price has already risen ±14.7% in a month leading up to the report, meaning good news has already been priced in. The market expects the margin to break 86%. If the results are only “in line with expectations,” the correction could happen quickly. It’s like a test score of 84 trying to become 86—the higher it is, the harder it is to climb. right or not 😁
And my position plan: “I won’t enter first 🔎🔎.” I’ll wait for the market’s reaction after the report comes out, then decide next steps. What about you?
⚠️ Not financial advice. DYOR.
#EarningsSeason #MU $MUB $MU
199
·
--
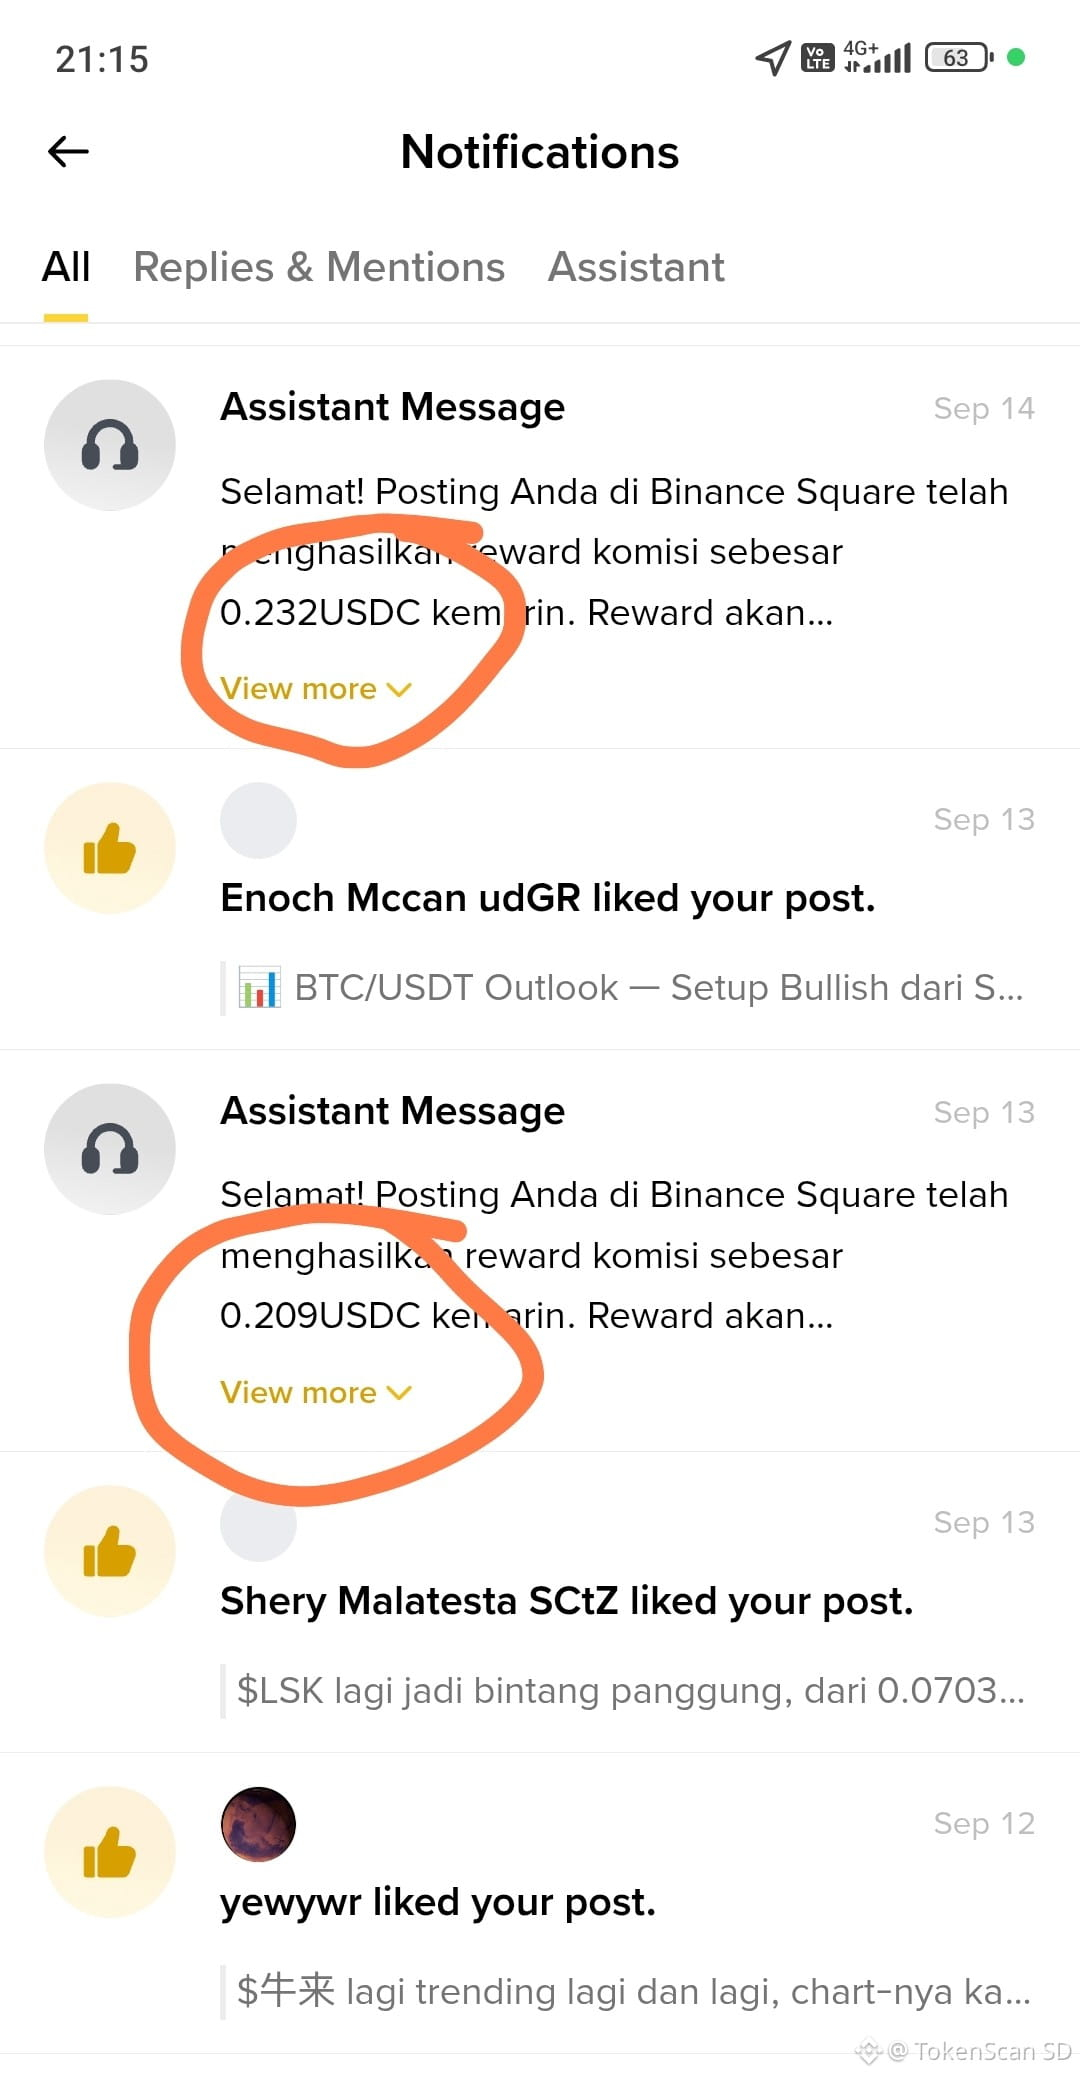
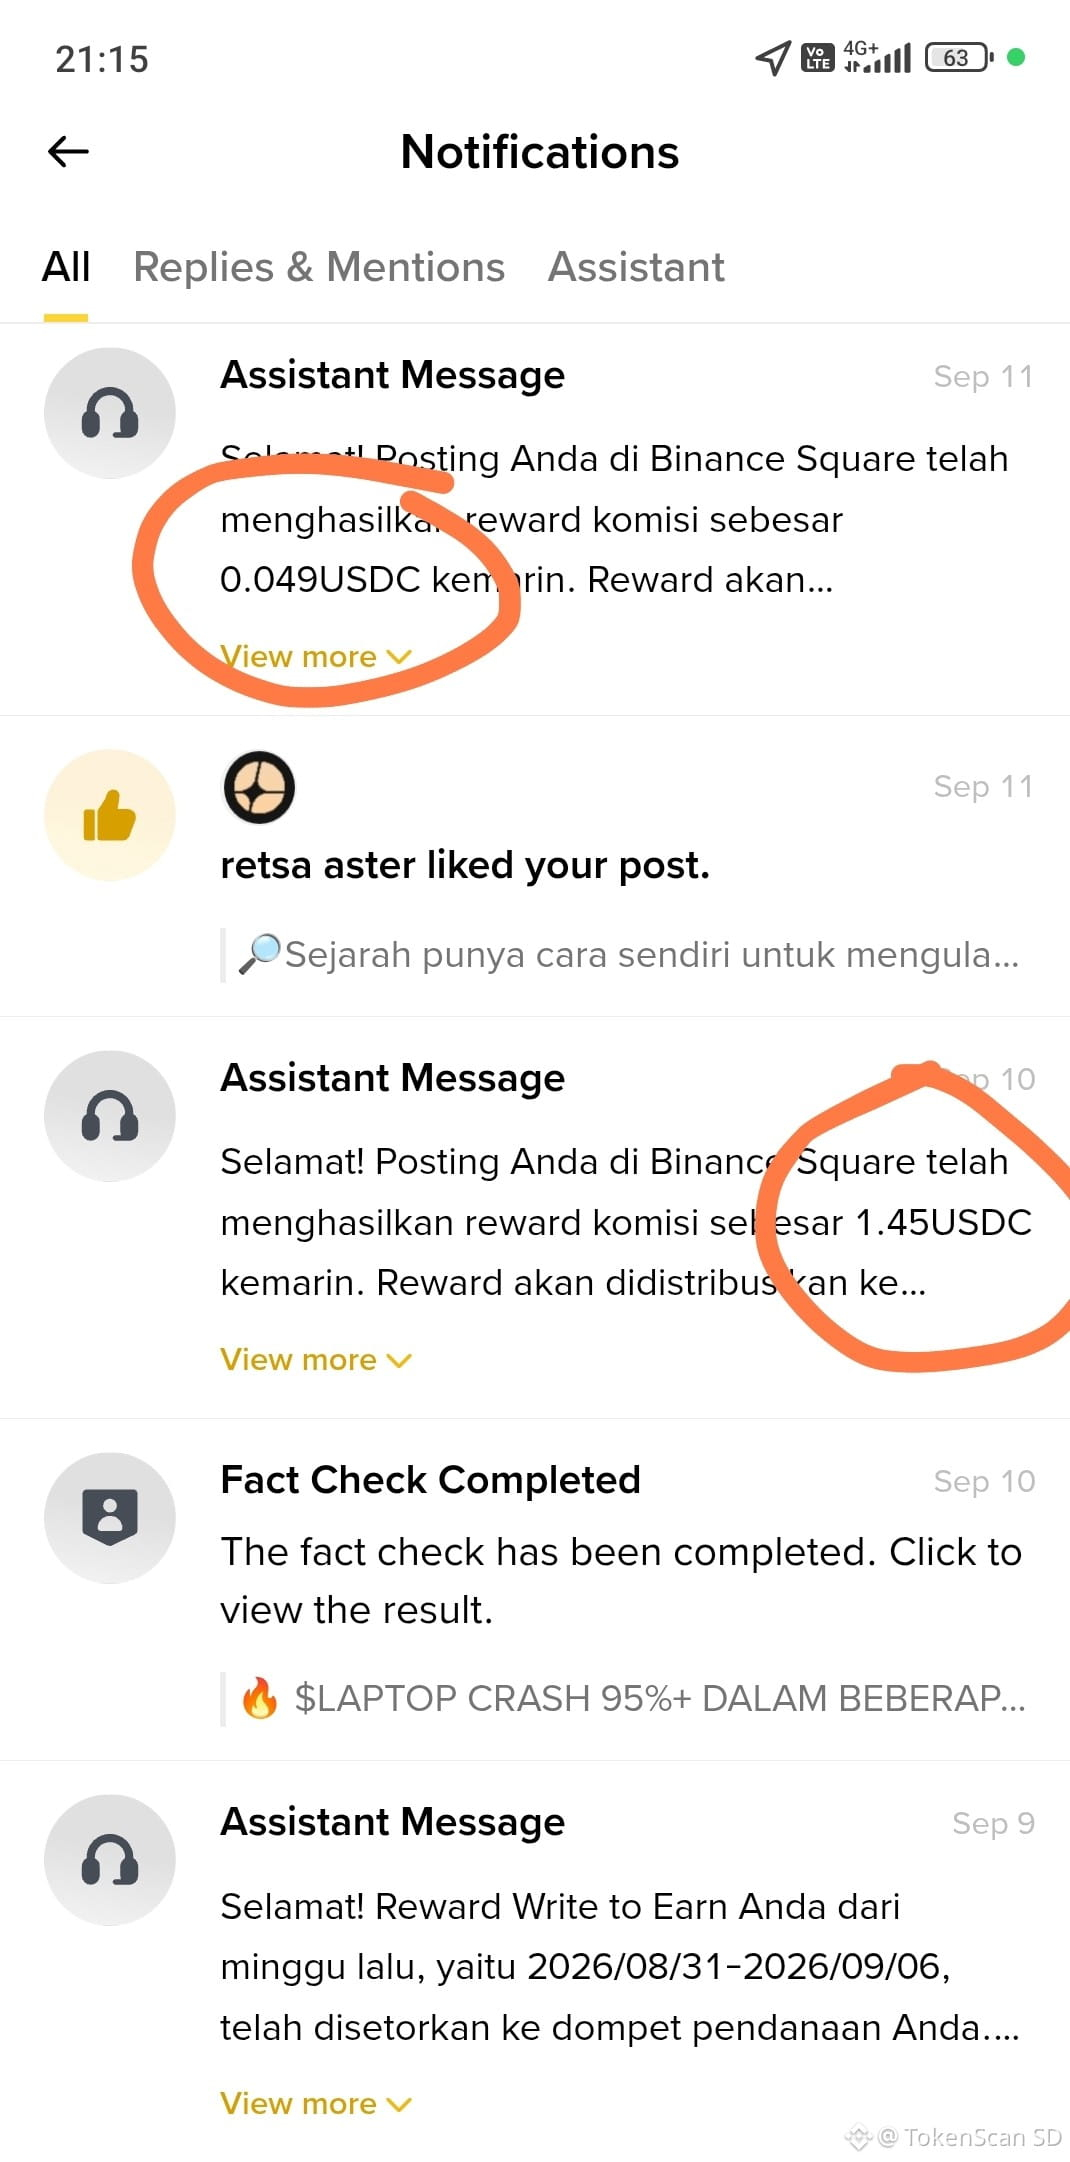
I don't know , , , why my reward not landing ? Can be here to explain ? @Binance_Square_Official
I don't know , , , why my reward not landing ? Can be here to explain ? @Binance Square Official
70
·
--
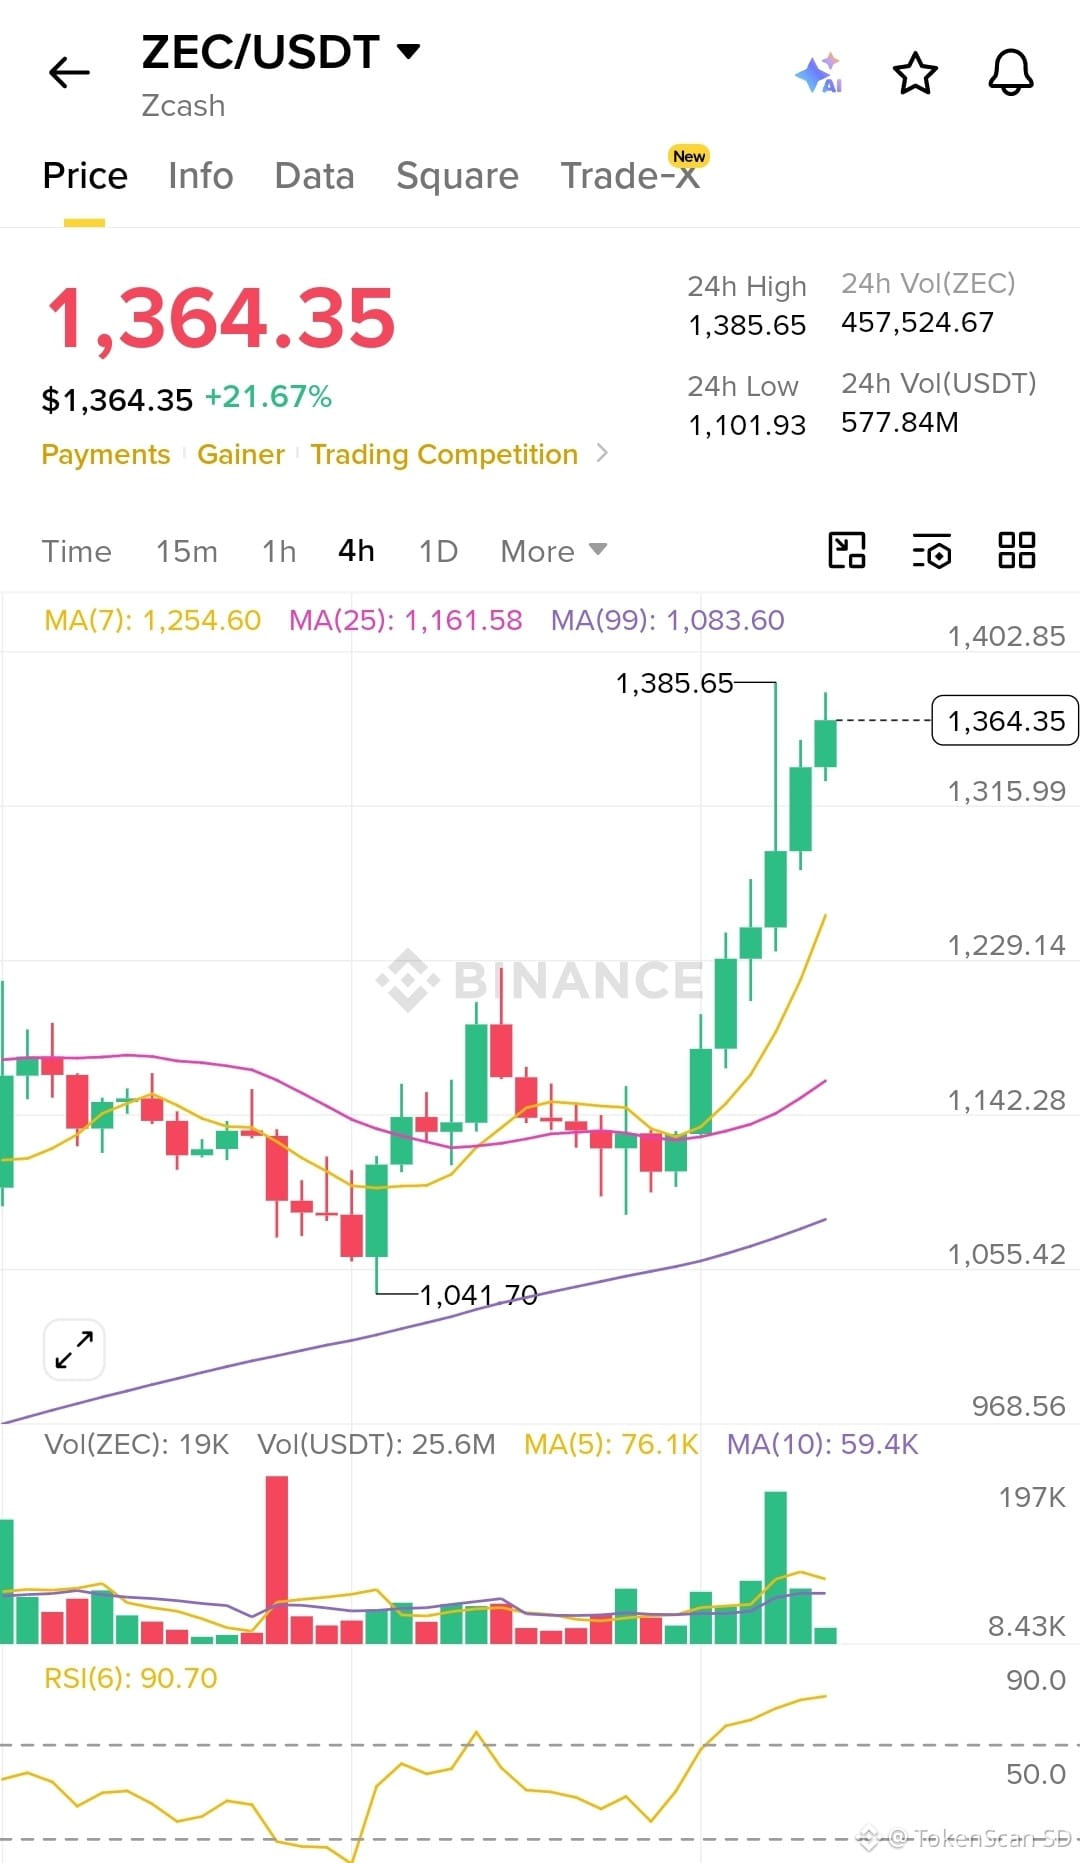
$ZEC makes no sense on the 4-hour chart.
A few candles ago, the price was still hovering around the 1.040 area. Trading volume was quiet; MA7, MA25, and MA99 are still like barriers that need to be fought slowly, step by step. Then suddenly the market decides it’s not going to play slowly anymore.
Green candles start appearing one by one, then getting higher—thicker. The volume of ZEC and USDT also explodes. The price doesn’t just break through the three moving averages—it leaves them behind beneath it by an ever-increasing distance. MA(7) is now at 1.254, MA(25) at 1.161, and MA(99) at 1.083. Current price is 1.364, and it briefly printed a high of 1.385.
In the last 24 hours, ZEC is already +21.67%. Low 1.101, high 1.385. USDT volume is 577 million. This isn’t ordinary movement. This feels like a short squeeze plus fundamental momentum meeting at one point.
But the chart is also honest. RSI(6) is already 90.70. That’s a level that almost never holds for long without a pause. The last candle has started showing slight rejection in the 1.385 area. Volume is still strong, but the candle body isn’t as wide as before.
So the story now has two possible next paths:
If momentum is still being held up by buyers and volume doesn’t immediately die, the 1.400 zone could become the next psychological target.
If RSI starts to fall and the 4-hour candle closes weak, a normal pullback to the MA7 area (around 1.250) or even deeper into the 1.220s is a very reasonable scenario.
This isn’t a chart that’s “calmly rising.” It’s a sprinting chart. A beautiful sprint—but a sprint still needs breath.
Do you see $ZEC still has the energy to continue, or is it time to rest first?
$ZEC
{future}(ZECUSDT)
#Zcash #analisateknikal
$ZEC makes no sense on the 4-hour chart.
A few candles ago, the price was still hovering around the 1.040 area. Trading volume was quiet; MA7, MA25, and MA99 are still like barriers that need to be fought slowly, step by step. Then suddenly the market decides it’s not going to play slowly anymore.
Green candles start appearing one by one, then getting higher—thicker. The volume of ZEC and USDT also explodes. The price doesn’t just break through the three moving averages—it leaves them behind beneath it by an ever-increasing distance. MA(7) is now at 1.254, MA(25) at 1.161, and MA(99) at 1.083. Current price is 1.364, and it briefly printed a high of 1.385.
In the last 24 hours, ZEC is already +21.67%. Low 1.101, high 1.385. USDT volume is 577 million. This isn’t ordinary movement. This feels like a short squeeze plus fundamental momentum meeting at one point.
But the chart is also honest. RSI(6) is already 90.70. That’s a level that almost never holds for long without a pause. The last candle has started showing slight rejection in the 1.385 area. Volume is still strong, but the candle body isn’t as wide as before.
So the story now has two possible next paths:
If momentum is still being held up by buyers and volume doesn’t immediately die, the 1.400 zone could become the next psychological target.
If RSI starts to fall and the 4-hour candle closes weak, a normal pullback to the MA7 area (around 1.250) or even deeper into the 1.220s is a very reasonable scenario.
This isn’t a chart that’s “calmly rising.” It’s a sprinting chart. A beautiful sprint—but a sprint still needs breath.
Do you see $ZEC still has the energy to continue, or is it time to rest first?
$ZEC
#Zcash #analisateknikal
A few candles ago, the price was still hovering around the 1.040 area. Trading volume was quiet; MA7, MA25, and MA99 are still like barriers that need to be fought slowly, step by step. Then suddenly the market decides it’s not going to play slowly anymore.
Green candles start appearing one by one, then getting higher—thicker. The volume of ZEC and USDT also explodes. The price doesn’t just break through the three moving averages—it leaves them behind beneath it by an ever-increasing distance. MA(7) is now at 1.254, MA(25) at 1.161, and MA(99) at 1.083. Current price is 1.364, and it briefly printed a high of 1.385.
In the last 24 hours, ZEC is already +21.67%. Low 1.101, high 1.385. USDT volume is 577 million. This isn’t ordinary movement. This feels like a short squeeze plus fundamental momentum meeting at one point.
But the chart is also honest. RSI(6) is already 90.70. That’s a level that almost never holds for long without a pause. The last candle has started showing slight rejection in the 1.385 area. Volume is still strong, but the candle body isn’t as wide as before.
So the story now has two possible next paths:
If momentum is still being held up by buyers and volume doesn’t immediately die, the 1.400 zone could become the next psychological target.
If RSI starts to fall and the 4-hour candle closes weak, a normal pullback to the MA7 area (around 1.250) or even deeper into the 1.220s is a very reasonable scenario.
This isn’t a chart that’s “calmly rising.” It’s a sprinting chart. A beautiful sprint—but a sprint still needs breath.
Do you see $ZEC still has the energy to continue, or is it time to rest first?
$ZEC
#Zcash #analisateknikal
945
·
--
🚨 ARC MAINNET OFFICIALLY GOES LIVE TODAY (16 Sep 2026) — But Be Careful, Many Get Rugpulled!
Today, Circle (the issuer of USDC) officially launched Arc mainnet — a Layer-1 chain backed by big names like BlackRock, Visa, Mastercard, and DTCC. Big money immediately flows in from various chains: Robinhood Chain, Solana, BNB Chain — everyone rushing over to feel the “heat” of a new meme coin on this chain.
But why do so many get rugpulled? Here are the key facts:
1️⃣ Arc doesn’t have its own native token. Gas fees are paid using USDC directly. So there’s no official “ARC token” for people to hold — what circulates are community-made meme tokens built on top of Arc.
2️⃣ There are 18+ new launchpads competing to be “Pump.fun’s Arc” (examples: archemistdotfun, arcpad_meme, Arguspad, etc.). Because they’re so new, many haven’t been tested yet — easy to misuse for rugpulls.
3️⃣ The “busy” volume before the official mainnet live was from testnet/private environments, opened only to hundreds of institutions & ecosystem partners. So when the public mainnet finally opens — everyone pours in at the same time, causing chaos, and fake/low-quality tokens sneak in amid the hype.
In short: Big institutions enter Arc for serious settlement & infrastructure. But on the surface (in those meme launchpads), what’s happening is basically the same as usual — FOMO, hype, and then many end up as rugpull fodder.
⚠️ If you want to try out a new chain: don’t go all-in on a brand-new token with no track record — check the contract first (locked liquidity? can it mint arbitrarily?), and treat the funds used for testing as “learning costs,” not an investment.
I personally tried buying one of the memes there for testing — and got rugpulled right away 😅. Luckily it was only a small amount to try it out. A lot of people on X have shared similar stories too.
DYOR always! New chain = opportunity, but also a trap field for those rushing in. 🙏
#ArcMainnet #Circle's #USDC #Memecoins__ #CryptoSD $SOL
{spot}(SOLUSDT)
🚨 ARC MAINNET OFFICIALLY GOES LIVE TODAY (16 Sep 2026) — But Be Careful, Many Get Rugpulled!
Today, Circle (the issuer of USDC) officially launched Arc mainnet — a Layer-1 chain backed by big names like BlackRock, Visa, Mastercard, and DTCC. Big money immediately flows in from various chains: Robinhood Chain, Solana, BNB Chain — everyone rushing over to feel the “heat” of a new meme coin on this chain.
But why do so many get rugpulled? Here are the key facts:
1️⃣ Arc doesn’t have its own native token. Gas fees are paid using USDC directly. So there’s no official “ARC token” for people to hold — what circulates are community-made meme tokens built on top of Arc.
2️⃣ There are 18+ new launchpads competing to be “Pump.fun’s Arc” (examples: archemistdotfun, arcpad_meme, Arguspad, etc.). Because they’re so new, many haven’t been tested yet — easy to misuse for rugpulls.
3️⃣ The “busy” volume before the official mainnet live was from testnet/private environments, opened only to hundreds of institutions & ecosystem partners. So when the public mainnet finally opens — everyone pours in at the same time, causing chaos, and fake/low-quality tokens sneak in amid the hype.
In short: Big institutions enter Arc for serious settlement & infrastructure. But on the surface (in those meme launchpads), what’s happening is basically the same as usual — FOMO, hype, and then many end up as rugpull fodder.
⚠️ If you want to try out a new chain: don’t go all-in on a brand-new token with no track record — check the contract first (locked liquidity? can it mint arbitrarily?), and treat the funds used for testing as “learning costs,” not an investment.
I personally tried buying one of the memes there for testing — and got rugpulled right away 😅. Luckily it was only a small amount to try it out. A lot of people on X have shared similar stories too.
DYOR always! New chain = opportunity, but also a trap field for those rushing in. 🙏
#ArcMainnet #Circle's #USDC #Memecoins__ #CryptoSD $SOL
Today, Circle (the issuer of USDC) officially launched Arc mainnet — a Layer-1 chain backed by big names like BlackRock, Visa, Mastercard, and DTCC. Big money immediately flows in from various chains: Robinhood Chain, Solana, BNB Chain — everyone rushing over to feel the “heat” of a new meme coin on this chain.
But why do so many get rugpulled? Here are the key facts:
1️⃣ Arc doesn’t have its own native token. Gas fees are paid using USDC directly. So there’s no official “ARC token” for people to hold — what circulates are community-made meme tokens built on top of Arc.
2️⃣ There are 18+ new launchpads competing to be “Pump.fun’s Arc” (examples: archemistdotfun, arcpad_meme, Arguspad, etc.). Because they’re so new, many haven’t been tested yet — easy to misuse for rugpulls.
3️⃣ The “busy” volume before the official mainnet live was from testnet/private environments, opened only to hundreds of institutions & ecosystem partners. So when the public mainnet finally opens — everyone pours in at the same time, causing chaos, and fake/low-quality tokens sneak in amid the hype.
In short: Big institutions enter Arc for serious settlement & infrastructure. But on the surface (in those meme launchpads), what’s happening is basically the same as usual — FOMO, hype, and then many end up as rugpull fodder.
⚠️ If you want to try out a new chain: don’t go all-in on a brand-new token with no track record — check the contract first (locked liquidity? can it mint arbitrarily?), and treat the funds used for testing as “learning costs,” not an investment.
I personally tried buying one of the memes there for testing — and got rugpulled right away 😅. Luckily it was only a small amount to try it out. A lot of people on X have shared similar stories too.
DYOR always! New chain = opportunity, but also a trap field for those rushing in. 🙏
#ArcMainnet #Circle's #USDC #Memecoins__ #CryptoSD $SOL

263
·
--
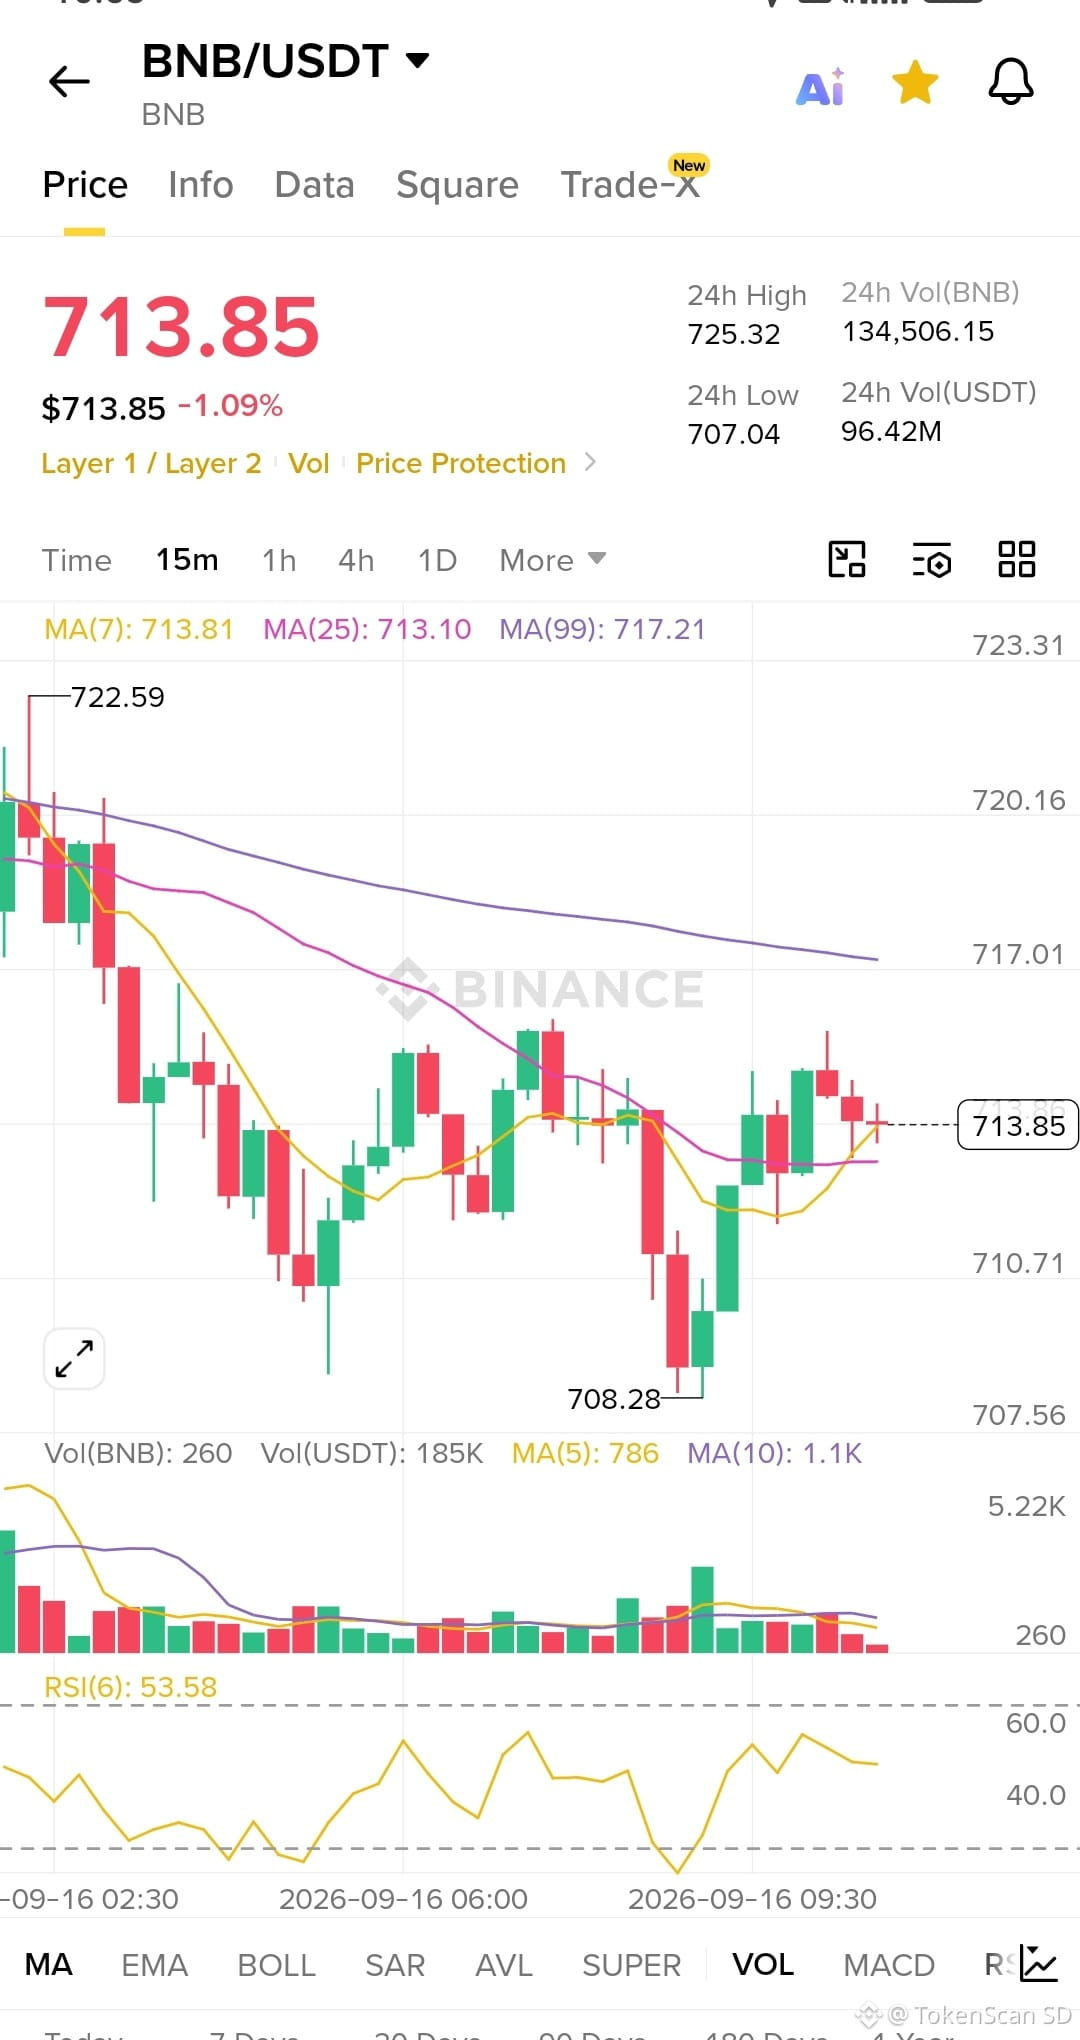
🚀 $BNB LONG SETUP — Multi TF (15m • 1H • 4H) 🚀
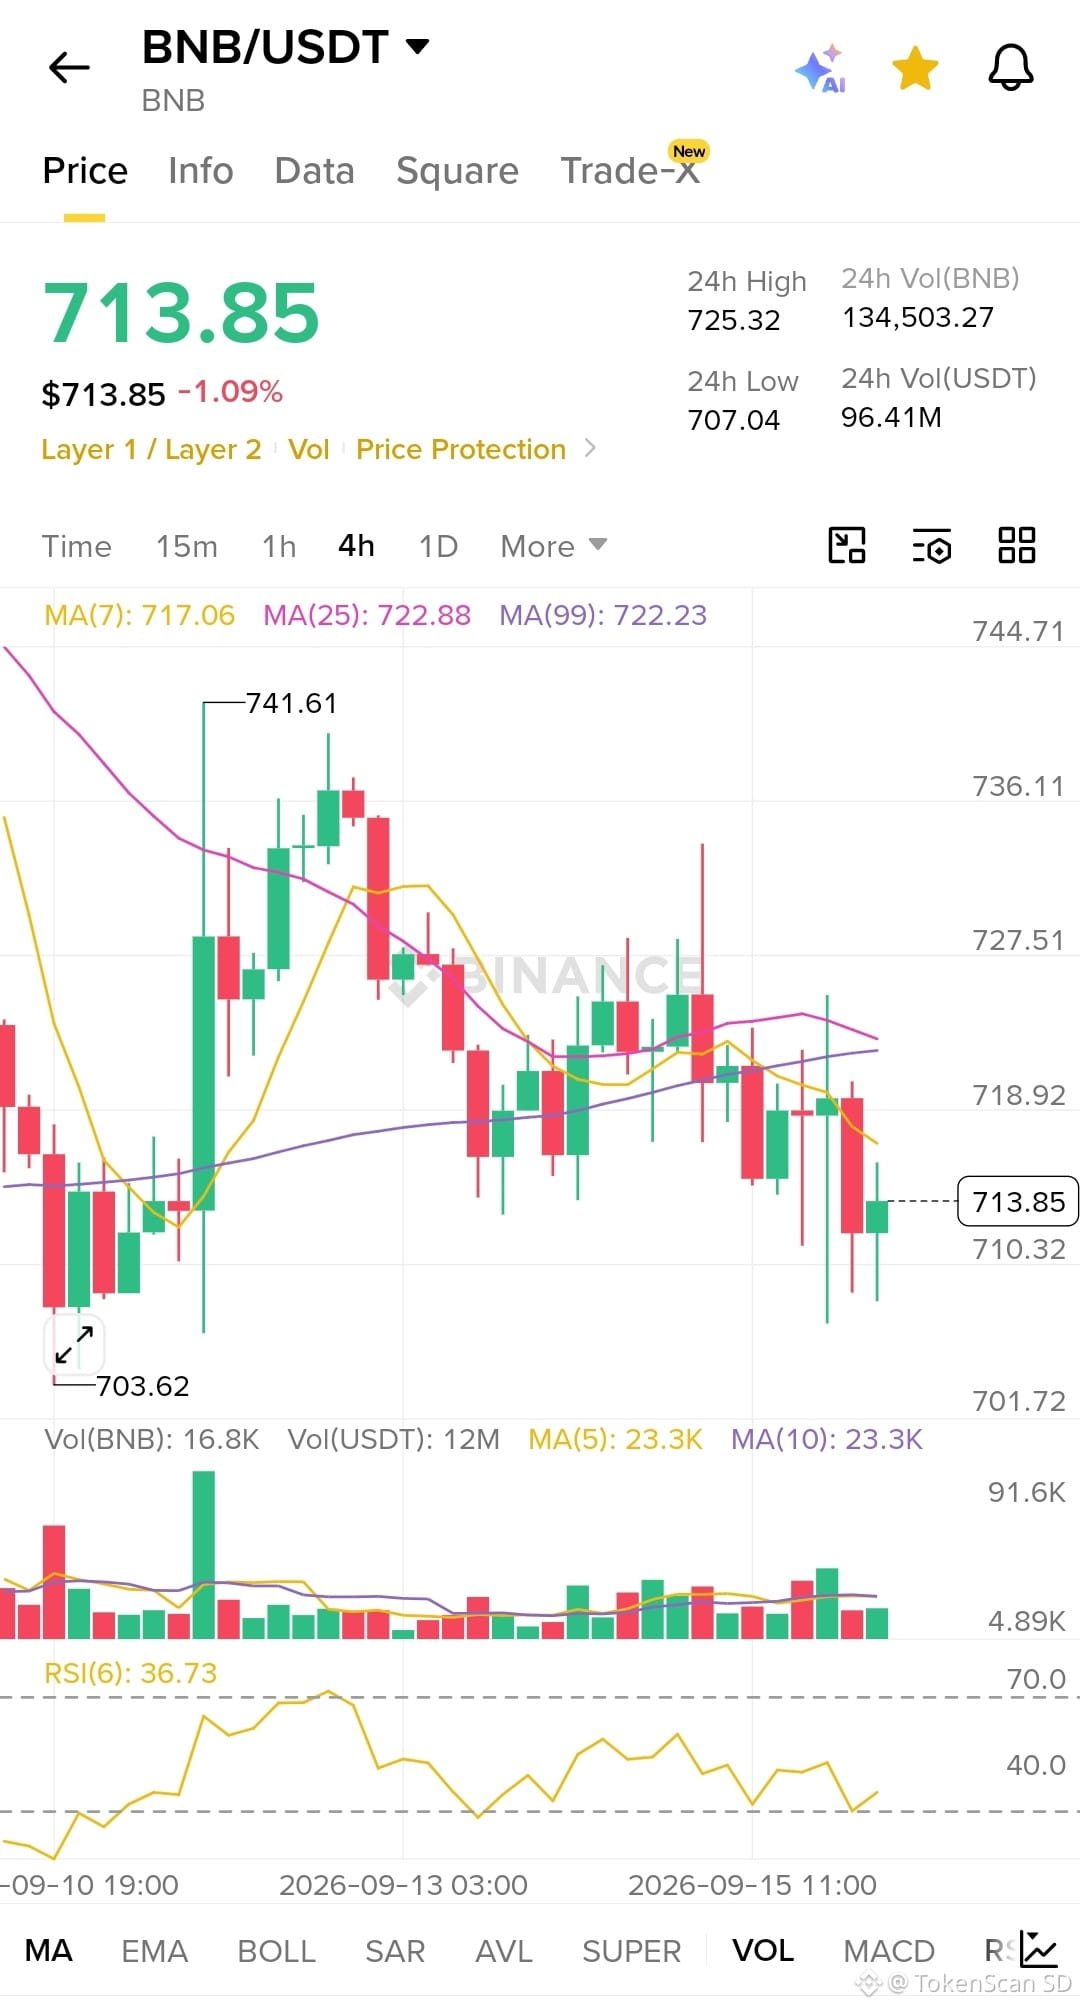
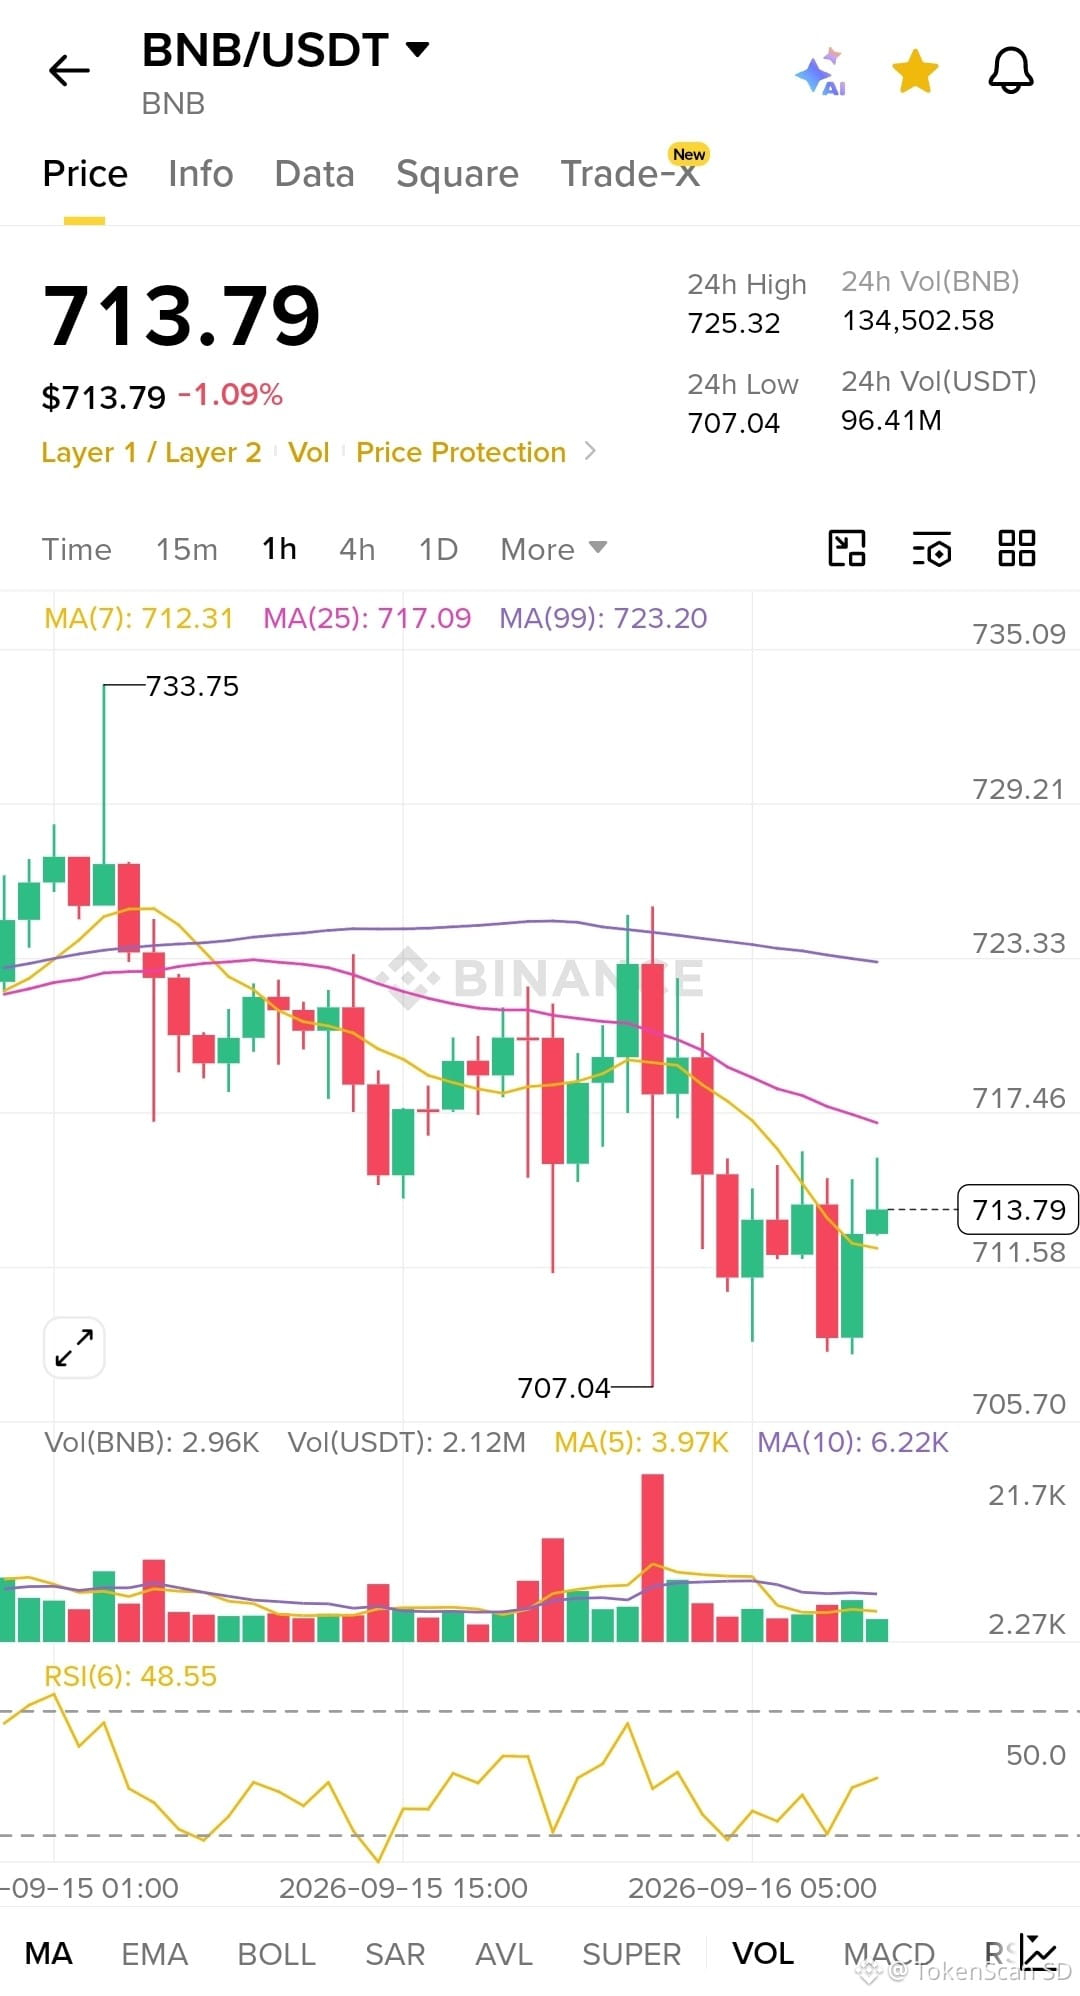
💰 Price ~713.8 | 24h 📉 -1.09%
🔻 Low: 707.0 / 703.6
🔺 Resistance: 717 – 723
📊 4H RSI 36.7 oversold, bounce from 703.6
📊 1H still below MA25 717
📊 15m holds 708 + RSI 53 = scalp long, not a breakout
✅ Long Setup
🎯 Entry: 708 – 711 (retest the low)
🛑 SL: 702.8
🥇 TP1: 717
🥈 TP2: 722 – 723
🥉 TP3: 725.3
⚠️ Don’t chase at 713–715
❌ Invalid: 1H close below 707
⚡ DYOR. Not mandatory signal. SL is mandatory. ⚡
$BNB
{spot}(BNBUSDT)
#BNBUSDT #bnb #Long #Signal 🔥📈
🚀 $BNB LONG SETUP — Multi TF (15m • 1H • 4H) 🚀
💰 Price ~713.8 | 24h 📉 -1.09%
🔻 Low: 707.0 / 703.6
🔺 Resistance: 717 – 723
📊 4H RSI 36.7 oversold, bounce from 703.6
📊 1H still below MA25 717
📊 15m holds 708 + RSI 53 = scalp long, not a breakout
✅ Long Setup
🎯 Entry: 708 – 711 (retest the low)
🛑 SL: 702.8
🥇 TP1: 717
🥈 TP2: 722 – 723
🥉 TP3: 725.3
⚠️ Don’t chase at 713–715
❌ Invalid: 1H close below 707
⚡ DYOR. Not mandatory signal. SL is mandatory. ⚡
$BNB
#BNBUSDT #bnb #Long #Signal 🔥📈
💰 Price ~713.8 | 24h 📉 -1.09%
🔻 Low: 707.0 / 703.6
🔺 Resistance: 717 – 723
📊 4H RSI 36.7 oversold, bounce from 703.6
📊 1H still below MA25 717
📊 15m holds 708 + RSI 53 = scalp long, not a breakout
✅ Long Setup
🎯 Entry: 708 – 711 (retest the low)
🛑 SL: 702.8
🥇 TP1: 717
🥈 TP2: 722 – 723
🥉 TP3: 725.3
⚠️ Don’t chase at 713–715
❌ Invalid: 1H close below 707
⚡ DYOR. Not mandatory signal. SL is mandatory. ⚡
$BNB
#BNBUSDT #bnb #Long #Signal 🔥📈
1
124
·
--
Bearish
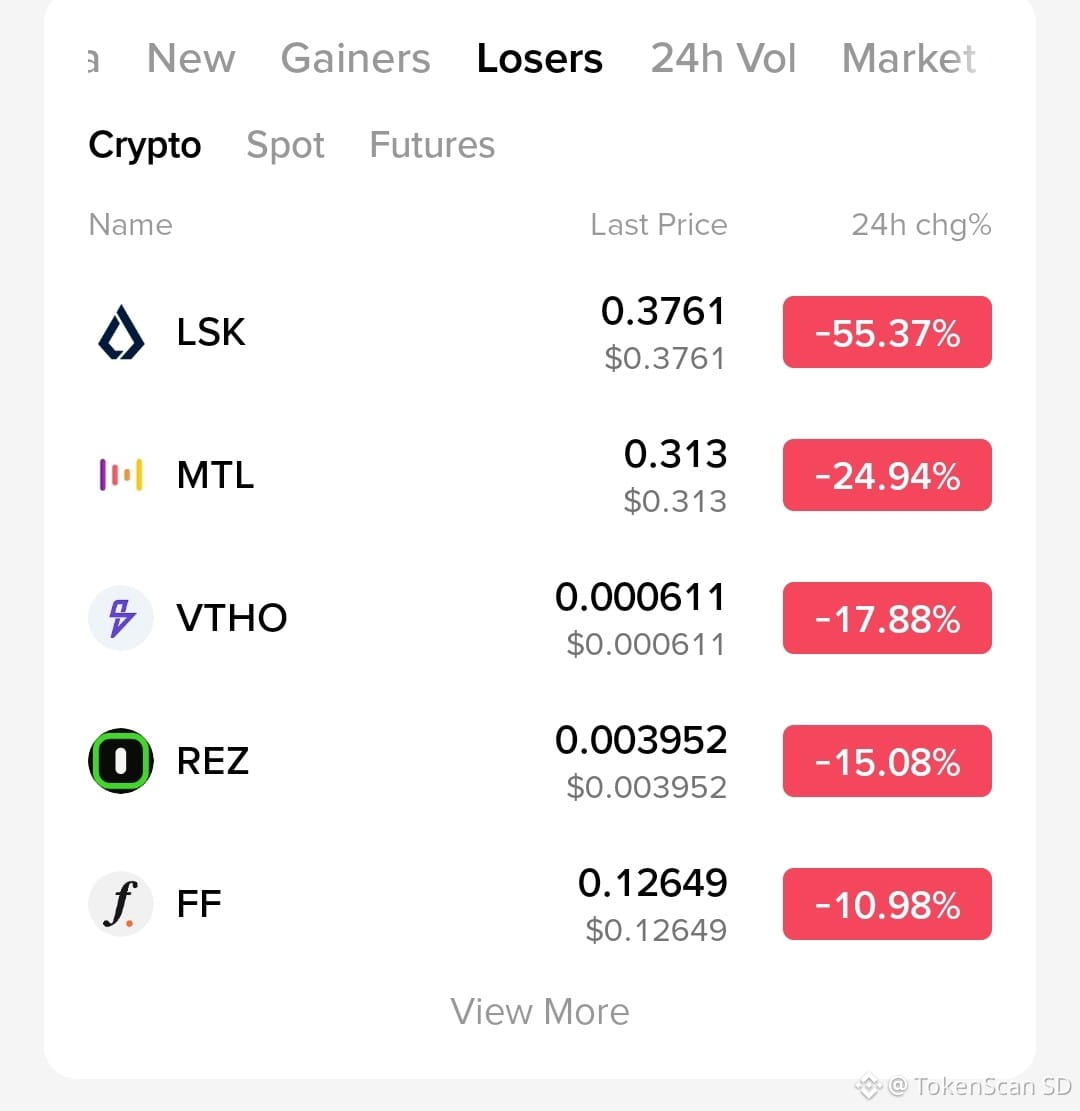
Gainer yesterday, loser today.
LSK +78% → −55%.
VTHO +18% → −18%.
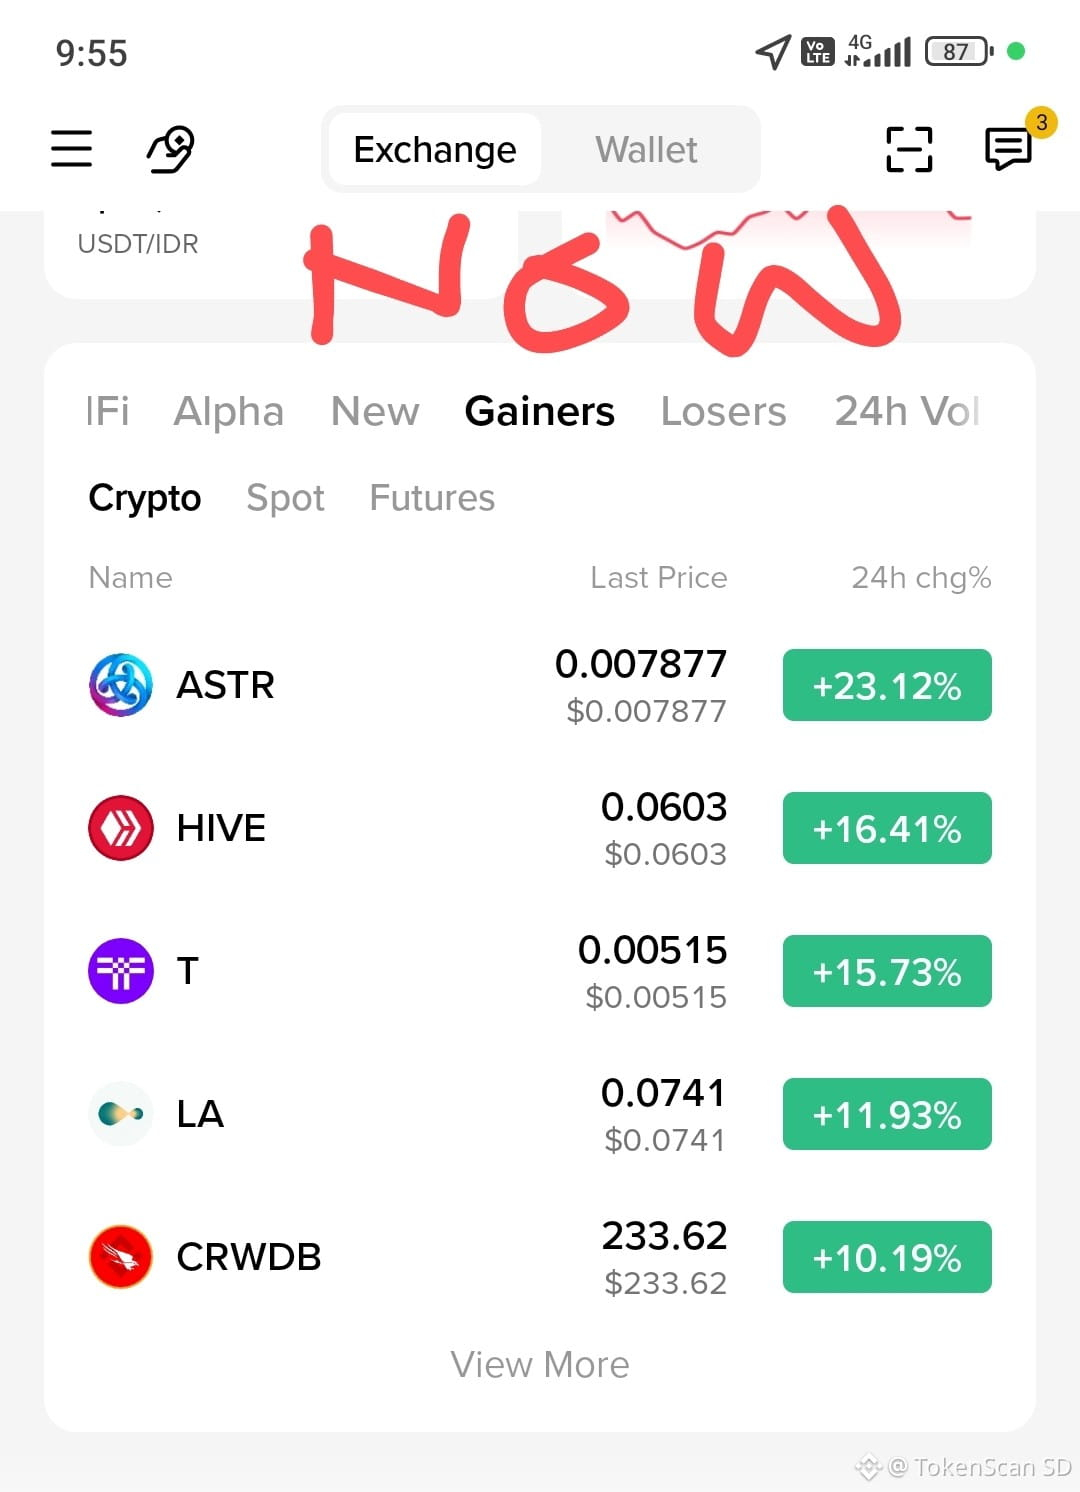
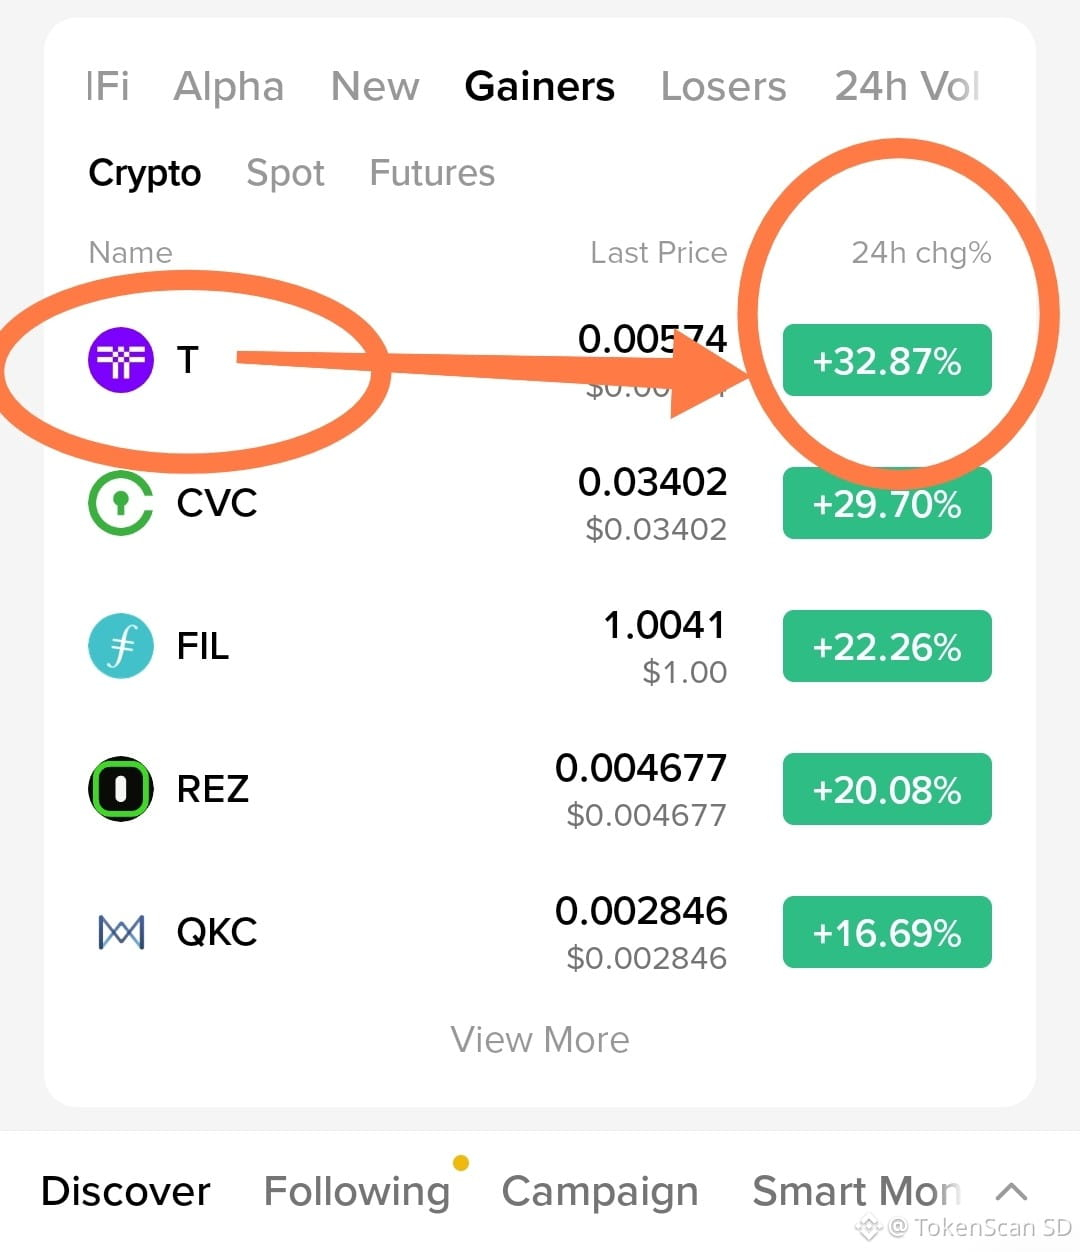
Current gainers: ASTR, HIVE, T, LA, CRWDB.
Can today’s gainers become tomorrow’s losers?👀?
Can today’s gainer become yesterday’s loser?
NFA. DYOR.
Volatility is real.
#gainersandlosers #Binance
$ASTR
{spot}(ASTRUSDT)
$HIVE
{spot}(HIVEUSDT)
$T
{spot}(TUSDT)
Gainer yesterday, loser today.
LSK +78% → −55%.
VTHO +18% → −18%.
Current gainers: ASTR, HIVE, T, LA, CRWDB.
Can today’s gainers become tomorrow’s losers?👀?
Can today’s gainer become yesterday’s loser?
NFA. DYOR.
Volatility is real.
#gainersandlosers #Binance
$ASTR
$HIVE
$T
LSK +78% → −55%.
VTHO +18% → −18%.
Current gainers: ASTR, HIVE, T, LA, CRWDB.
Can today’s gainers become tomorrow’s losers?👀?
Can today’s gainer become yesterday’s loser?
NFA. DYOR.
Volatility is real.
#gainersandlosers #Binance
$ASTR
$HIVE
$T
282
·
--
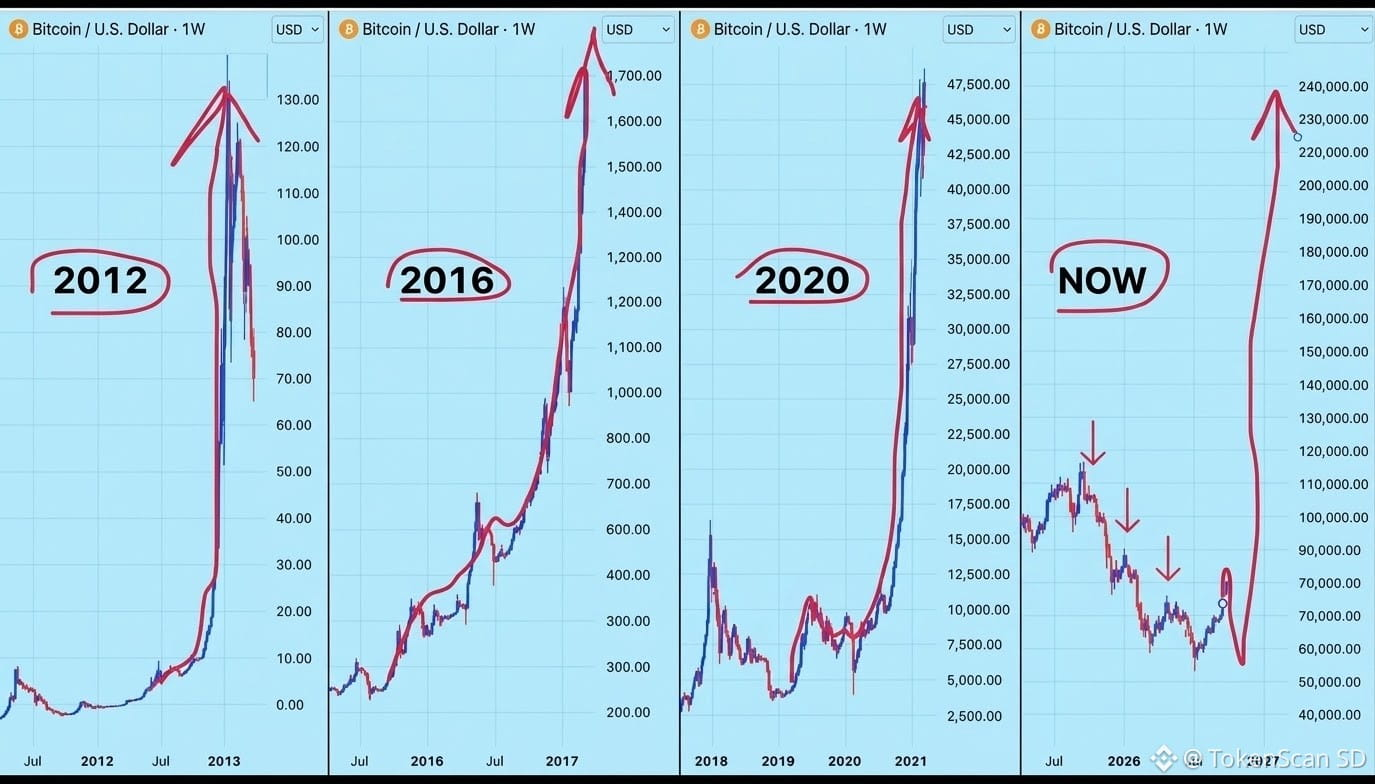
This is not a chart.
This is a zoomed-in photocopy of fate.
Left: 2012, people are still asking “is that money or digital rocks?”
Middle: 2016, people are just learning FOMO.
2020: people are just learning institutions.
Right: 2026, people are just learning to get tired.
The three red arrows in the NOW panel are not a “it’s finished” sign.
It’s the quietest phase at the party.
The lights are still on, the music is still there, but the ones who were dancing have already gone home.
What’s drawn pushing the move to $230K–$240K is not a promise. It’s rhyme.
Bitcoin likes to mess with people using a four-year rhythm,
then in the new cycle it slowly reduces the percentages so that those waiting for x100 end up disappointed,
and those waiting for “it’s dead” also get disappointed.
Price now is ~ $78K.
ATH last time was ~ $126K.
Last summer’s low was ~ $58K.
We’re not in the month yet. We’re also not in the graveyard yet.
If you post this, post it as a reminder of patterns,
not as an airline ticket to $240K.
Because Bitcoin’s cycle is faithful.
But it never promises to stay faithful with the exact same numbers.
#BTC #BitcoinCycle #Halving #HODL
$BTC
{future}(BTCUSDT)
This is not a chart.
This is a zoomed-in photocopy of fate.
Left: 2012, people are still asking “is that money or digital rocks?”
Middle: 2016, people are just learning FOMO.
2020: people are just learning institutions.
Right: 2026, people are just learning to get tired.
The three red arrows in the NOW panel are not a “it’s finished” sign.
It’s the quietest phase at the party.
The lights are still on, the music is still there, but the ones who were dancing have already gone home.
What’s drawn pushing the move to $230K–$240K is not a promise. It’s rhyme.
Bitcoin likes to mess with people using a four-year rhythm,
then in the new cycle it slowly reduces the percentages so that those waiting for x100 end up disappointed,
and those waiting for “it’s dead” also get disappointed.
Price now is ~ $78K.
ATH last time was ~ $126K.
Last summer’s low was ~ $58K.
We’re not in the month yet. We’re also not in the graveyard yet.
If you post this, post it as a reminder of patterns,
not as an airline ticket to $240K.
Because Bitcoin’s cycle is faithful.
But it never promises to stay faithful with the exact same numbers.
#BTC #BitcoinCycle #Halving #HODL
$BTC
This is a zoomed-in photocopy of fate.
Left: 2012, people are still asking “is that money or digital rocks?”
Middle: 2016, people are just learning FOMO.
2020: people are just learning institutions.
Right: 2026, people are just learning to get tired.
The three red arrows in the NOW panel are not a “it’s finished” sign.
It’s the quietest phase at the party.
The lights are still on, the music is still there, but the ones who were dancing have already gone home.
What’s drawn pushing the move to $230K–$240K is not a promise. It’s rhyme.
Bitcoin likes to mess with people using a four-year rhythm,
then in the new cycle it slowly reduces the percentages so that those waiting for x100 end up disappointed,
and those waiting for “it’s dead” also get disappointed.
Price now is ~ $78K.
ATH last time was ~ $126K.
Last summer’s low was ~ $58K.
We’re not in the month yet. We’re also not in the graveyard yet.
If you post this, post it as a reminder of patterns,
not as an airline ticket to $240K.
Because Bitcoin’s cycle is faithful.
But it never promises to stay faithful with the exact same numbers.
#BTC #BitcoinCycle #Halving #HODL
$BTC
125
·
--
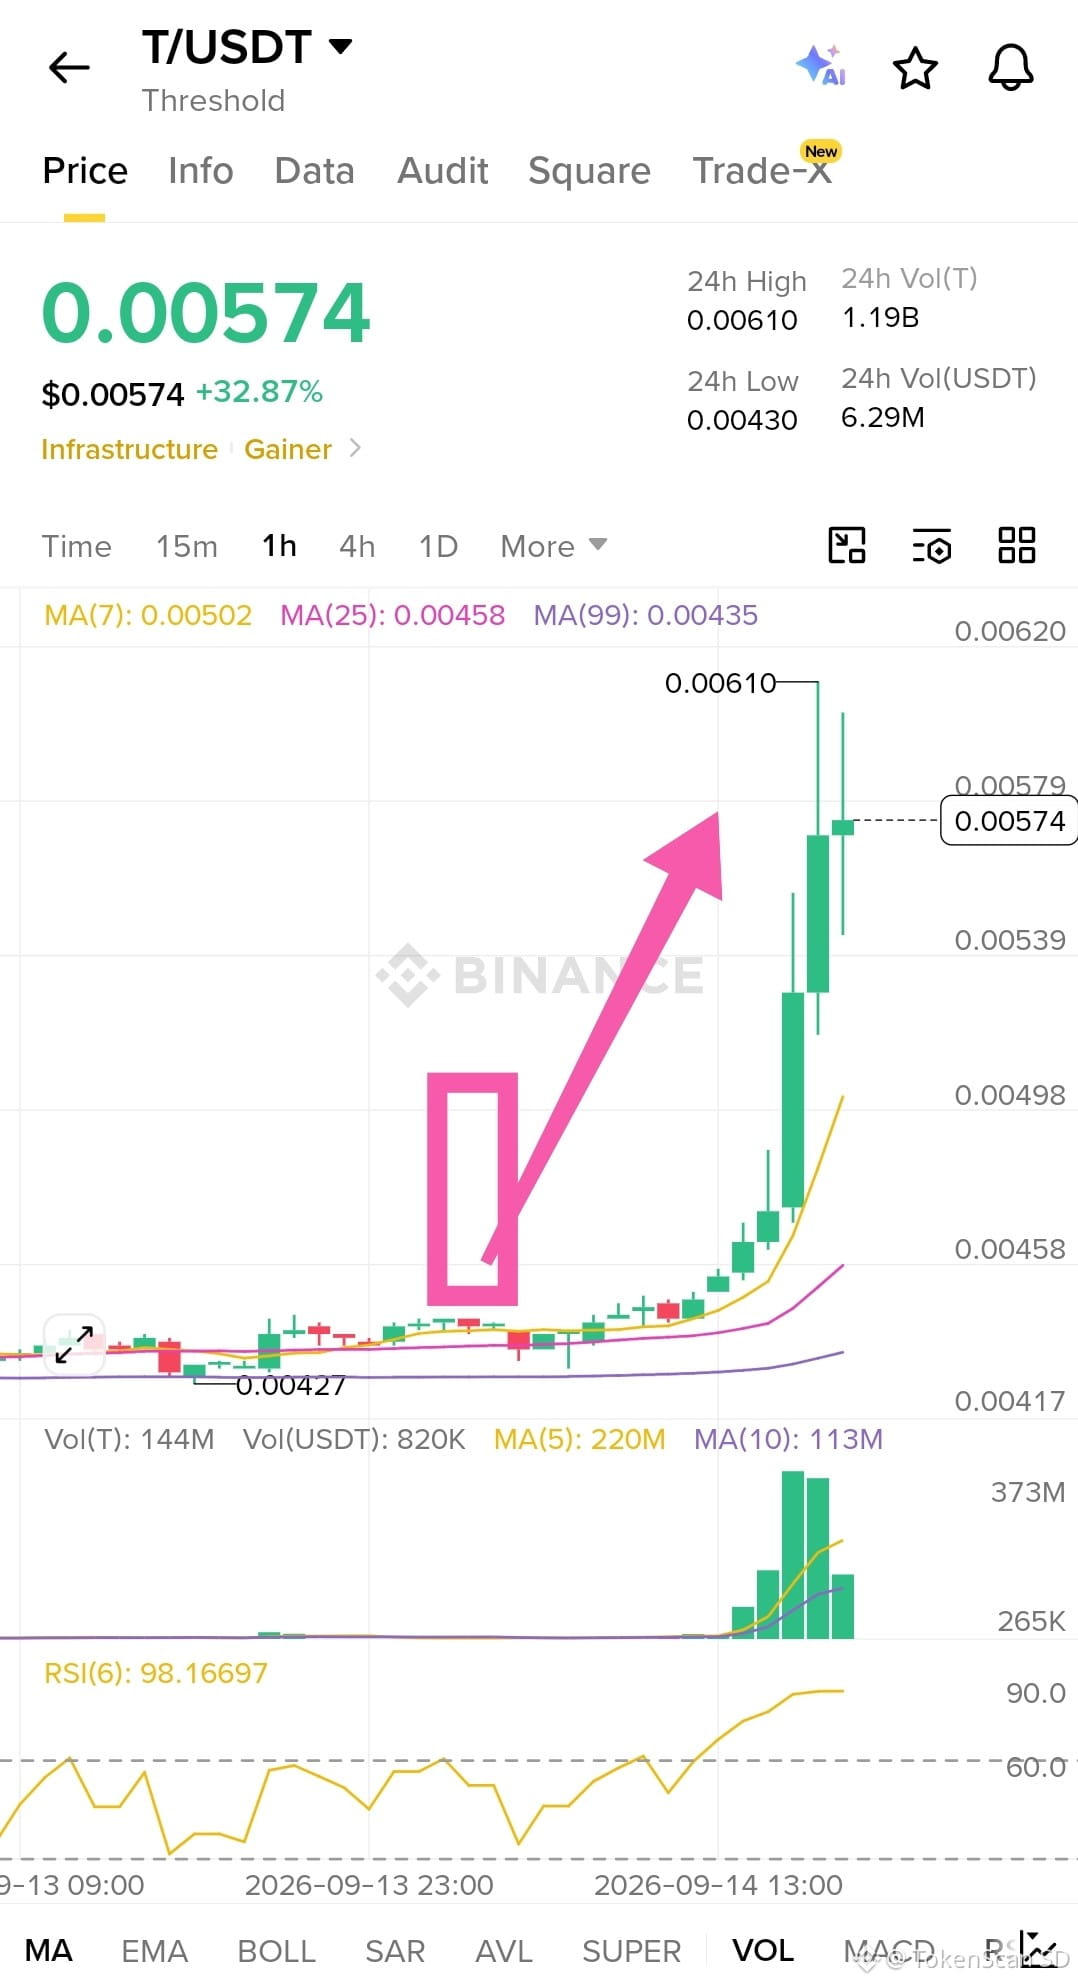
T just came out of the “sleeping token” mode.
1H bullish structure. Volume confirms. MA lines are aligned.
But RSI is almost breaking the channel.
Signal: BUY ON DIP.
Wait for the price to drop until it touches MA7.
If it bounces from there + volume is still there for breath → continue.
If MA25 is broken through like tissue paper → step back, don’t date a falling knife.
Crypto is a race.
The one chasing at the finish line is usually the one who runs out of breath first.
#TUSDT #ThresholdCrypto #tBTC #gainersandlosers #analisateknikal
Not financial advice. If your capital gets wiped out, don’t tag me in your dreams.
$T
{spot}(TUSDT)
T just came out of the “sleeping token” mode.
1H bullish structure. Volume confirms. MA lines are aligned.
But RSI is almost breaking the channel.
Signal: BUY ON DIP.
Wait for the price to drop until it touches MA7.
If it bounces from there + volume is still there for breath → continue.
If MA25 is broken through like tissue paper → step back, don’t date a falling knife.
Crypto is a race.
The one chasing at the finish line is usually the one who runs out of breath first.
#TUSDT #ThresholdCrypto #tBTC #gainersandlosers #analisateknikal
Not financial advice. If your capital gets wiped out, don’t tag me in your dreams.
$T
1H bullish structure. Volume confirms. MA lines are aligned.
But RSI is almost breaking the channel.
Signal: BUY ON DIP.
Wait for the price to drop until it touches MA7.
If it bounces from there + volume is still there for breath → continue.
If MA25 is broken through like tissue paper → step back, don’t date a falling knife.
Crypto is a race.
The one chasing at the finish line is usually the one who runs out of breath first.
#TUSDT #ThresholdCrypto #tBTC #gainersandlosers #analisateknikal
Not financial advice. If your capital gets wiped out, don’t tag me in your dreams.
$T
121
·
--
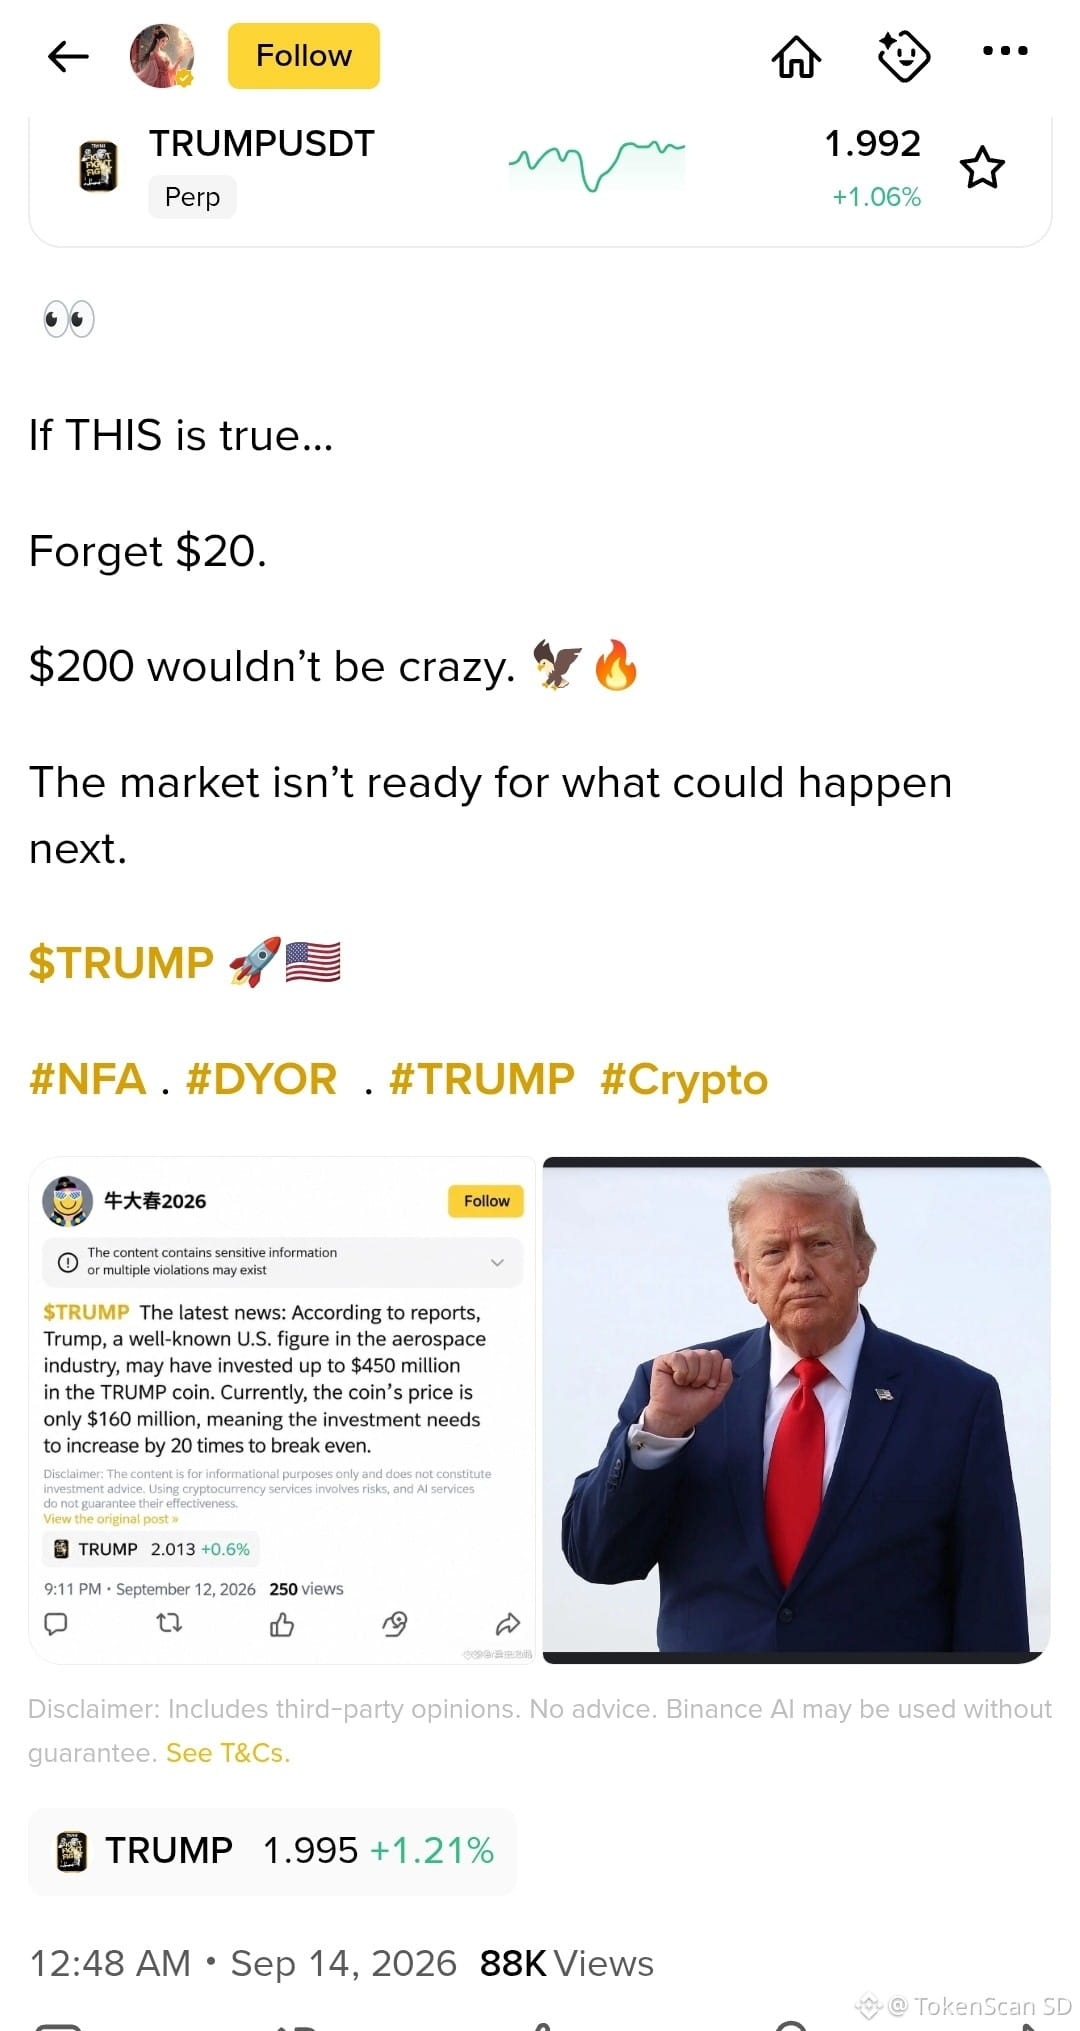
Is the news about $TRUMP true or a hoax? Please tell me! If it’s true, I want to go all in 🤣
$TRUMP
{future}(TRUMPUSDT)
Is the news about $TRUMP true or a hoax? Please tell me! If it’s true, I want to go all in 🤣
$TRUMP
$TRUMP
1
3
6k
·
--
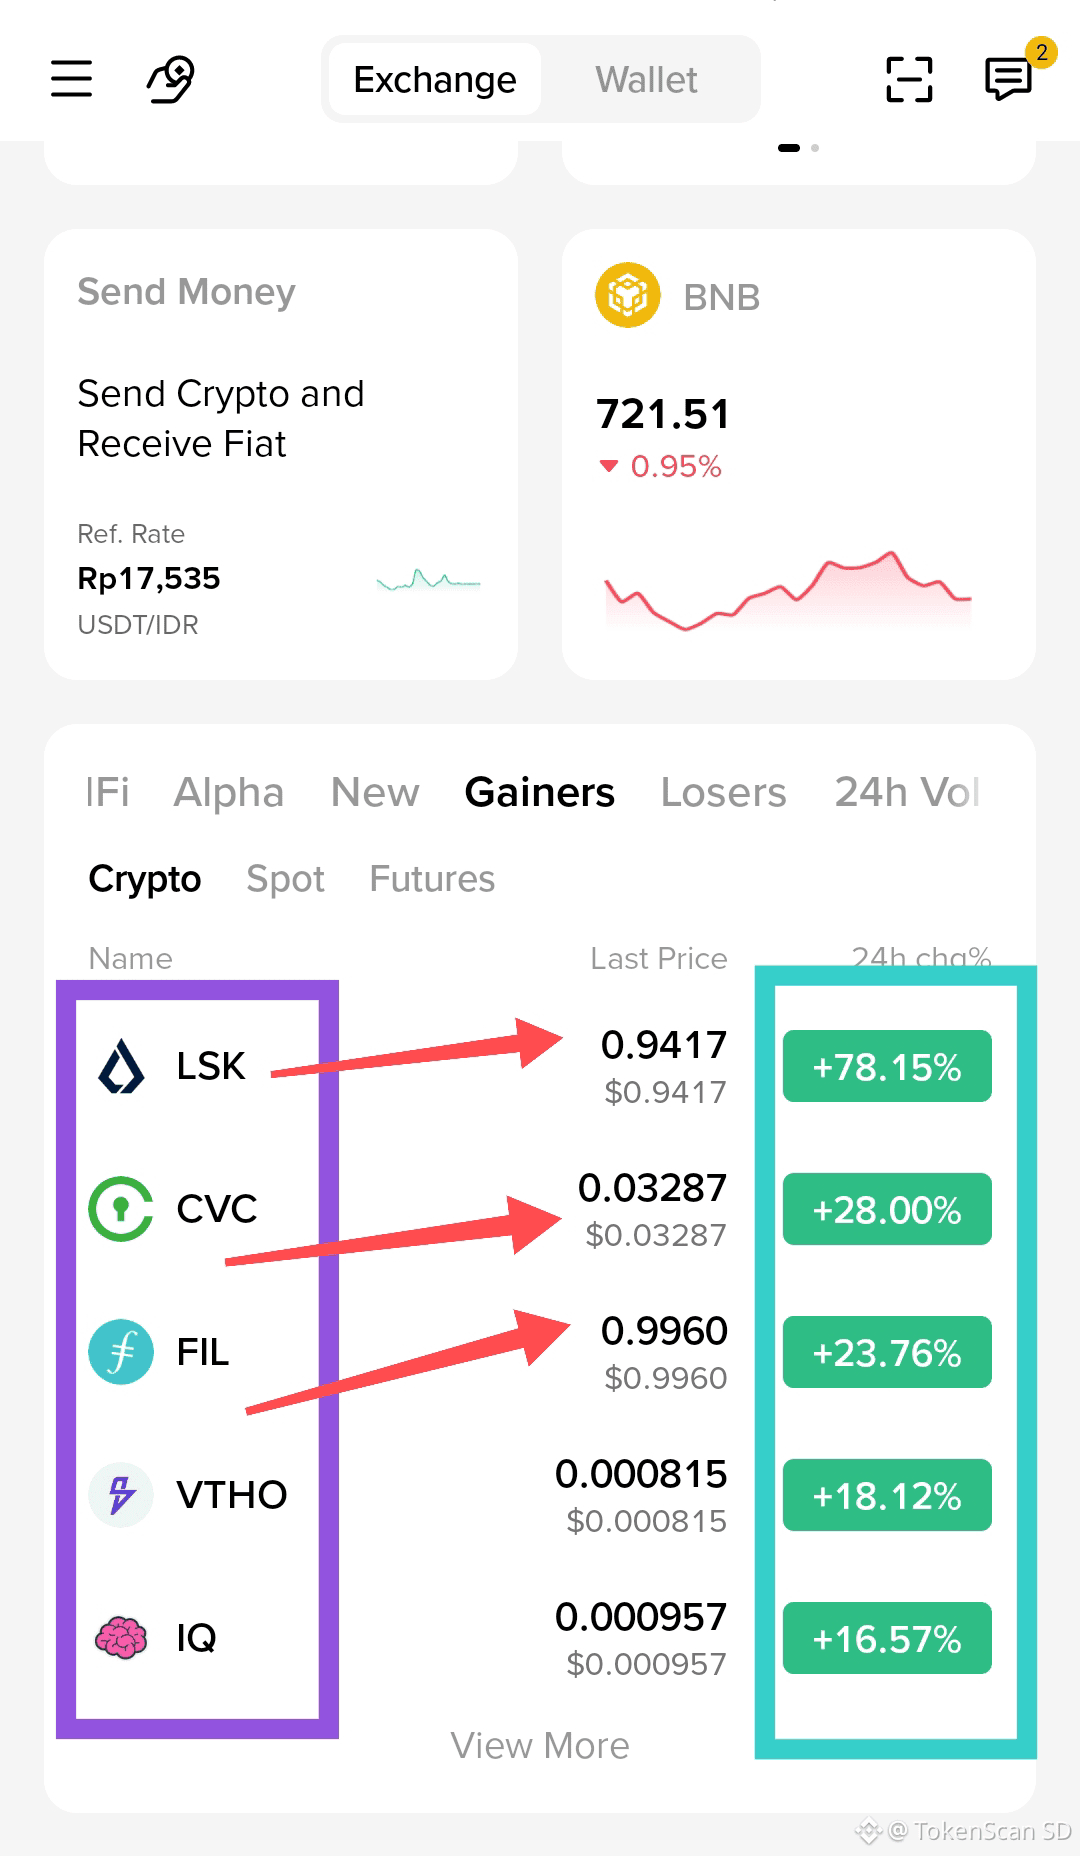
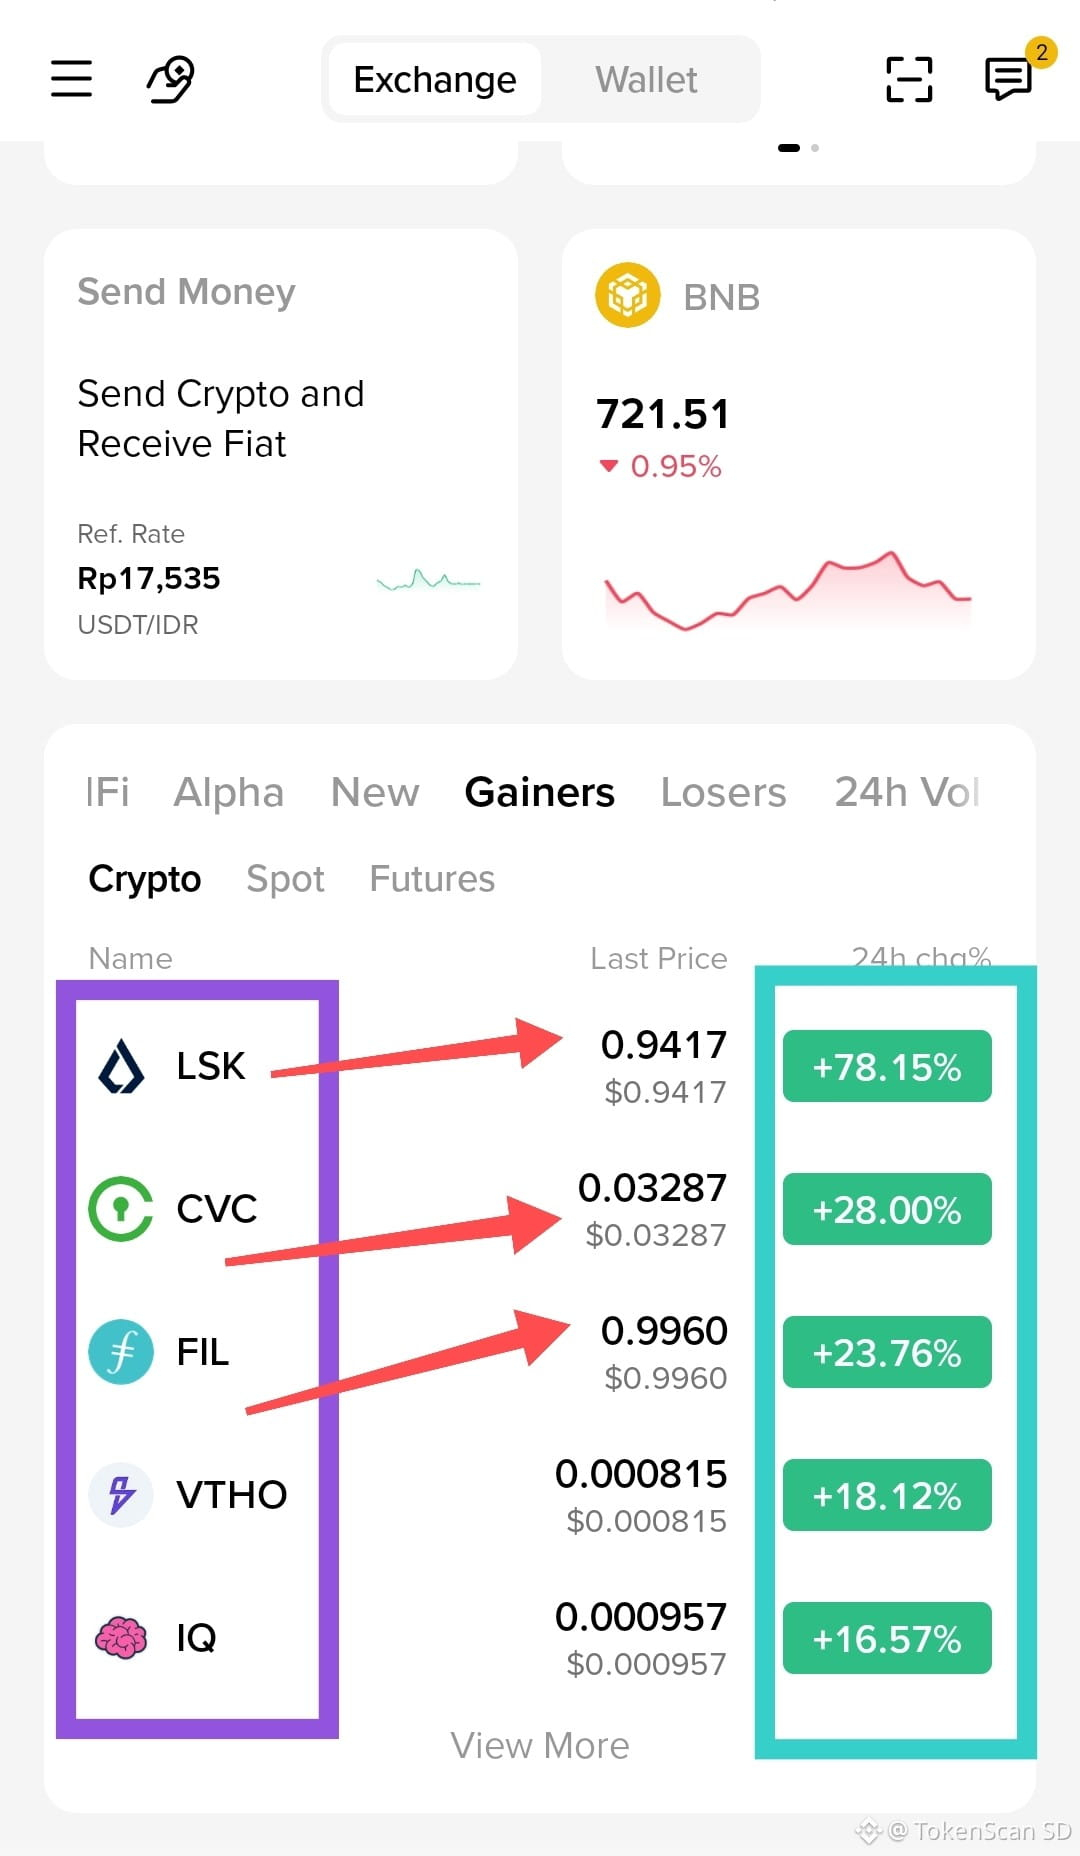
🔥 TOP 3 GAINERS BINANCE TODAY
#1 LSK (Lisk) — $0.9417 (+78.15%) 🚀
Still standing strong at the top, guys! LSK has consistently held the #1 top gainer position for 2 straight days. The momentum is really steady.
#2 CVC (Civic) — $0.03287 (+28.00%) 📈
Following in second place with a 28% rise within 24 hours.
#3 FIL (Filecoin) — $0.9960 (+23.76%) ⚡
Completing today’s podium, almost breaking $1.
⚠️ Remember, guys, DYOR — pumps like this are usually extremely volatile; don’t FOMO without checking the fundamentals first.
#Binance #TopGainer #LSKUSDT #CryptoTrends2024 #dyor
$LSK
{spot}(LSKUSDT)
$CVC
{future}(CVCUSDT)
$FIL
{future}(FILUSDT)
🔥 TOP 3 GAINERS BINANCE TODAY
#1 LSK (Lisk) — $0.9417 (+78.15%) 🚀
Still standing strong at the top, guys! LSK has consistently held the #1 top gainer position for 2 straight days. The momentum is really steady.
#2 CVC (Civic) — $0.03287 (+28.00%) 📈
Following in second place with a 28% rise within 24 hours.
#3 FIL (Filecoin) — $0.9960 (+23.76%) ⚡
Completing today’s podium, almost breaking $1.
⚠️ Remember, guys, DYOR — pumps like this are usually extremely volatile; don’t FOMO without checking the fundamentals first.
#Binance #TopGainer #LSKUSDT #CryptoTrends2024 #dyor
$LSK
$CVC
$FIL
#1 LSK (Lisk) — $0.9417 (+78.15%) 🚀
Still standing strong at the top, guys! LSK has consistently held the #1 top gainer position for 2 straight days. The momentum is really steady.
#2 CVC (Civic) — $0.03287 (+28.00%) 📈
Following in second place with a 28% rise within 24 hours.
#3 FIL (Filecoin) — $0.9960 (+23.76%) ⚡
Completing today’s podium, almost breaking $1.
⚠️ Remember, guys, DYOR — pumps like this are usually extremely volatile; don’t FOMO without checking the fundamentals first.
#Binance #TopGainer #LSKUSDT #CryptoTrends2024 #dyor
$LSK
$CVC
$FIL
752
·
--
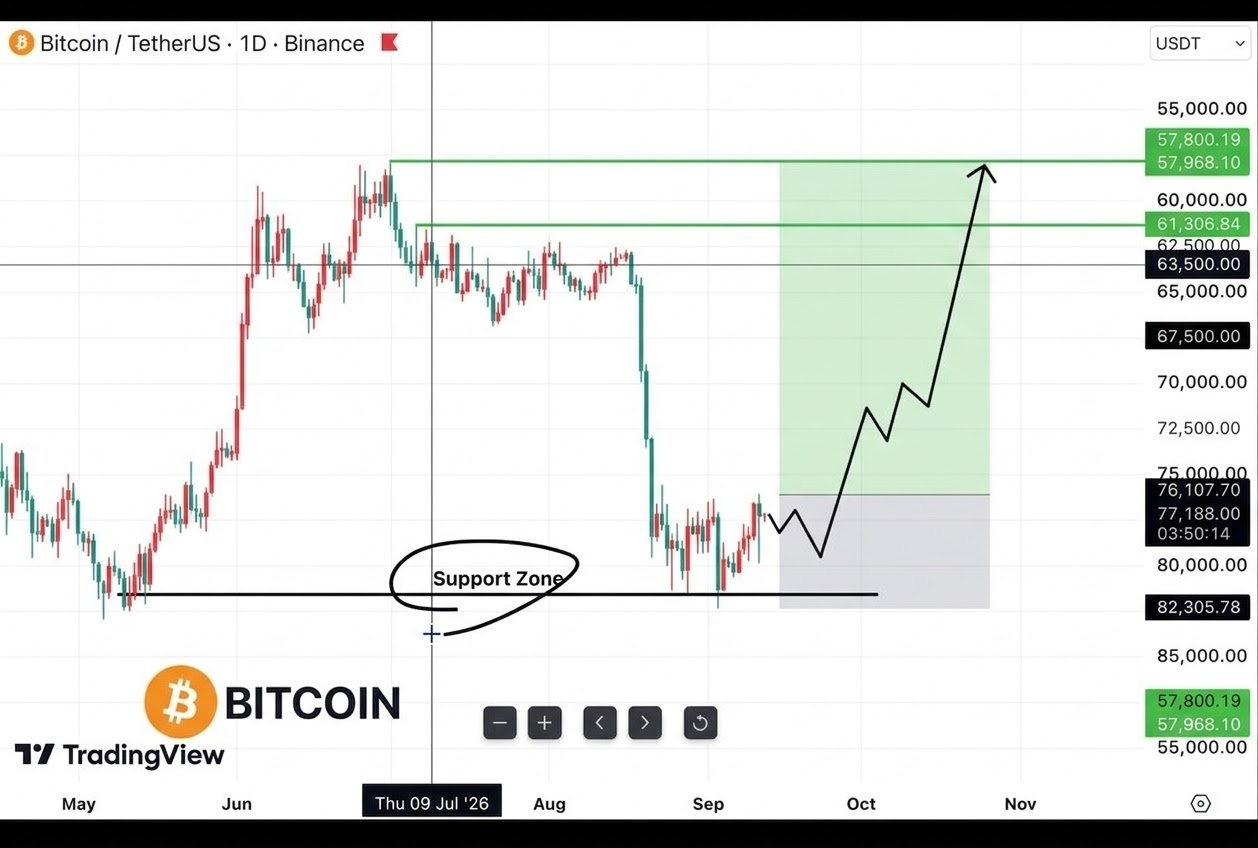
📊 BTC/USDT Outlook — Bullish Setup from the Support Zone
Bitcoin is currently consolidating in a Support Zone that has been tested several times. If this support remains solid, there is a chance for a reversal toward the resistance area at 61,300 and then onward to the 57,800–58,000 zone as the next target.
A higher-low structure has begun forming after yesterday’s sharp correction—an indication of potential medium-term uptrend if volume supports it.
⚠️ This is a technical projection, not a buy/sell signal. Always cross-check with a risk scanner before executing & do your own research (DYOR).
#Bitcoin #BTC #cryptoindonesia #TokenScanSD
$BTC
{spot}(BTCUSDT)
📊 BTC/USDT Outlook — Bullish Setup from the Support Zone
Bitcoin is currently consolidating in a Support Zone that has been tested several times. If this support remains solid, there is a chance for a reversal toward the resistance area at 61,300 and then onward to the 57,800–58,000 zone as the next target.
A higher-low structure has begun forming after yesterday’s sharp correction—an indication of potential medium-term uptrend if volume supports it.
⚠️ This is a technical projection, not a buy/sell signal. Always cross-check with a risk scanner before executing & do your own research (DYOR).
#Bitcoin #BTC #cryptoindonesia #TokenScanSD
$BTC
Bitcoin is currently consolidating in a Support Zone that has been tested several times. If this support remains solid, there is a chance for a reversal toward the resistance area at 61,300 and then onward to the 57,800–58,000 zone as the next target.
A higher-low structure has begun forming after yesterday’s sharp correction—an indication of potential medium-term uptrend if volume supports it.
⚠️ This is a technical projection, not a buy/sell signal. Always cross-check with a risk scanner before executing & do your own research (DYOR).
#Bitcoin #BTC #cryptoindonesia #TokenScanSD
$BTC
2
1.1k
·
--
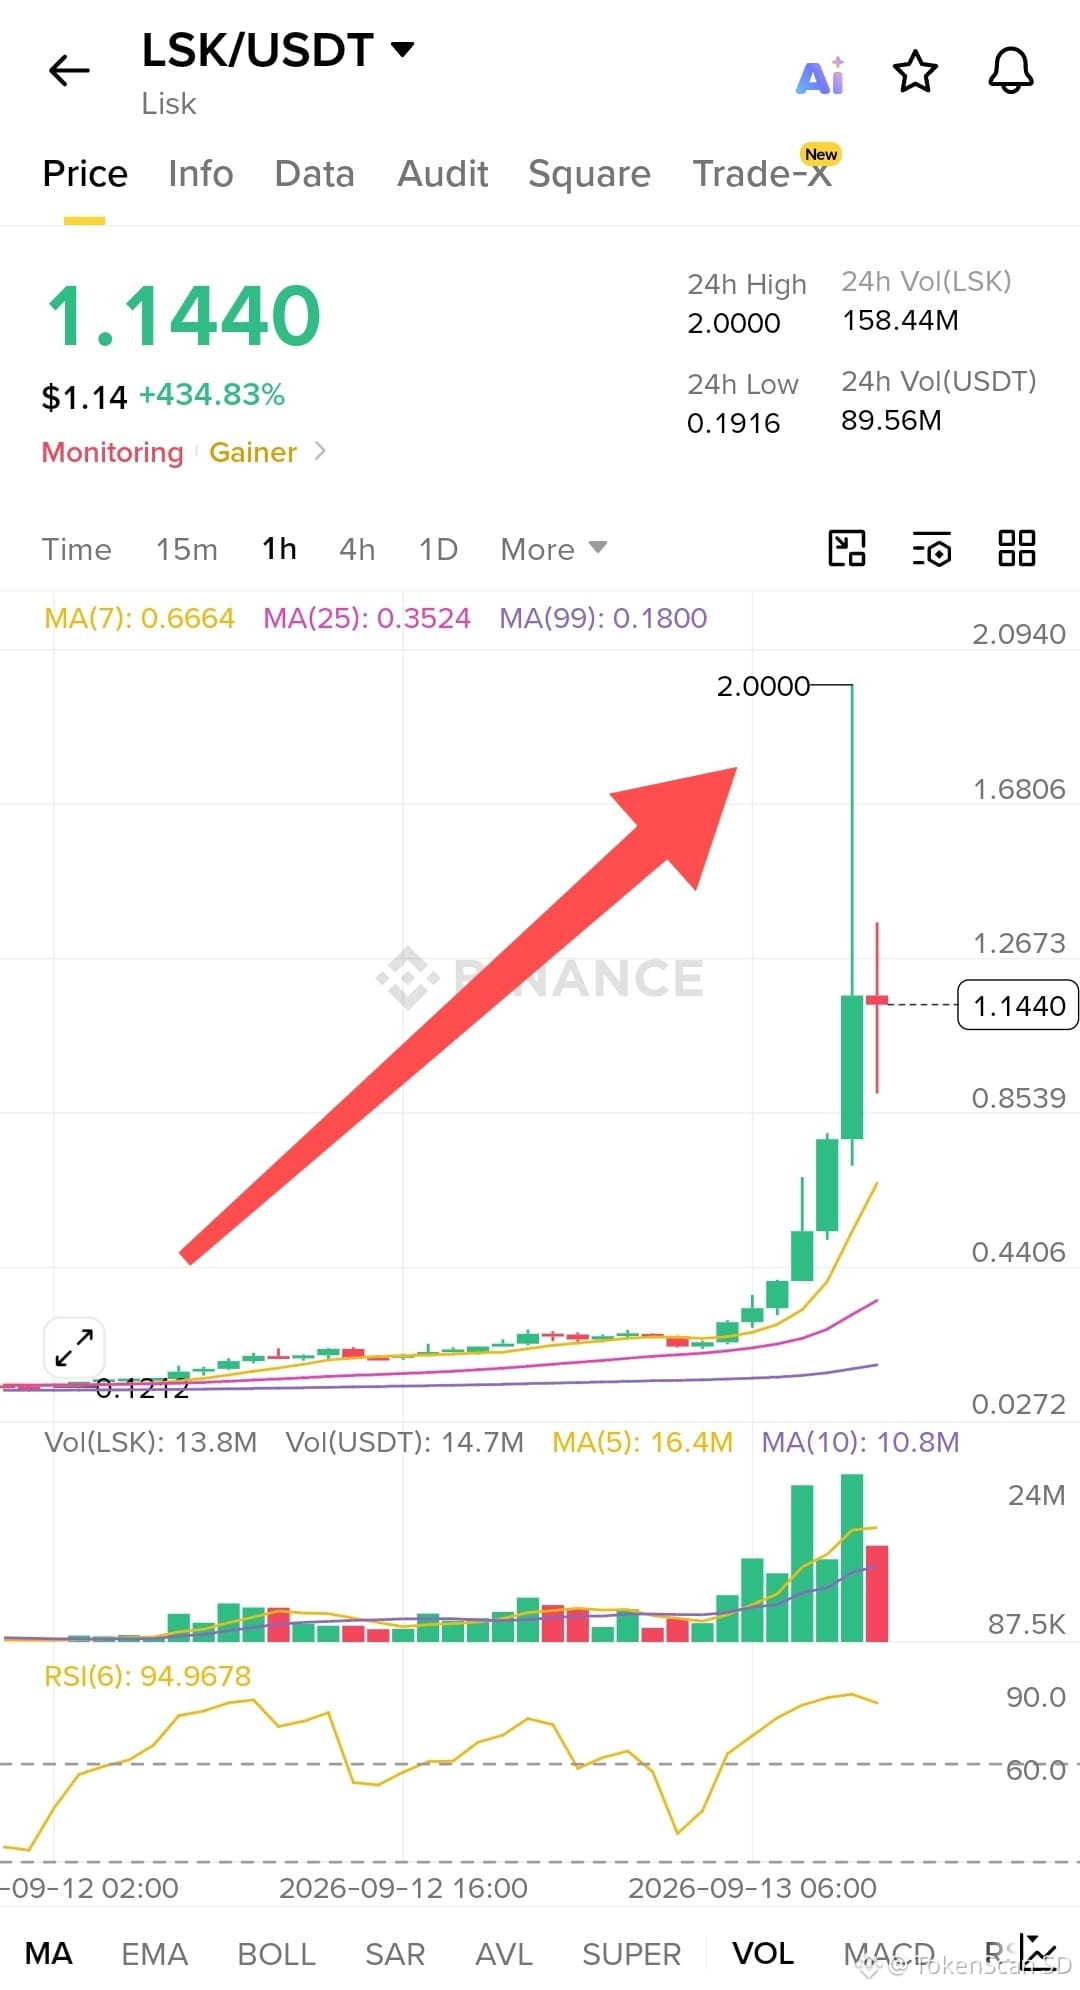
What do you think about the LSK coin?
LSK was 0.12 earlier, briefly hit 2.00, now it’s 1.05. Up +434% in a day.
Not “Lisk season.”
It’s an old coin the market suddenly remembered.
The key points:
Wick to 2.00 = someone sold to those who were late
RSI 95 = breathing on your neck, not the start of the party
Last volume is red = lots of activity, then someone left
Price is still above MA7 0.66, so the short-term trend hasn’t broken yet
The rise is vertical. The foundation is thin.
If it holds at 1.00, it’s still alive.
If it breaks to 0.66, the party has already paid for catering.
Don’t buy just because it’s green.
Don’t marry a coin that just woke up.
DYOR. Not financial advice.
$LSK
{future}(LSKUSDT)
What do you think about the LSK coin?
LSK was 0.12 earlier, briefly hit 2.00, now it’s 1.05. Up +434% in a day.
Not “Lisk season.”
It’s an old coin the market suddenly remembered.
The key points:
Wick to 2.00 = someone sold to those who were late
RSI 95 = breathing on your neck, not the start of the party
Last volume is red = lots of activity, then someone left
Price is still above MA7 0.66, so the short-term trend hasn’t broken yet
The rise is vertical. The foundation is thin.
If it holds at 1.00, it’s still alive.
If it breaks to 0.66, the party has already paid for catering.
Don’t buy just because it’s green.
Don’t marry a coin that just woke up.
DYOR. Not financial advice.
$LSK
LSK was 0.12 earlier, briefly hit 2.00, now it’s 1.05. Up +434% in a day.
Not “Lisk season.”
It’s an old coin the market suddenly remembered.
The key points:
Wick to 2.00 = someone sold to those who were late
RSI 95 = breathing on your neck, not the start of the party
Last volume is red = lots of activity, then someone left
Price is still above MA7 0.66, so the short-term trend hasn’t broken yet
The rise is vertical. The foundation is thin.
If it holds at 1.00, it’s still alive.
If it breaks to 0.66, the party has already paid for catering.
Don’t buy just because it’s green.
Don’t marry a coin that just woke up.
DYOR. Not financial advice.
$LSK
1.1k
·
--
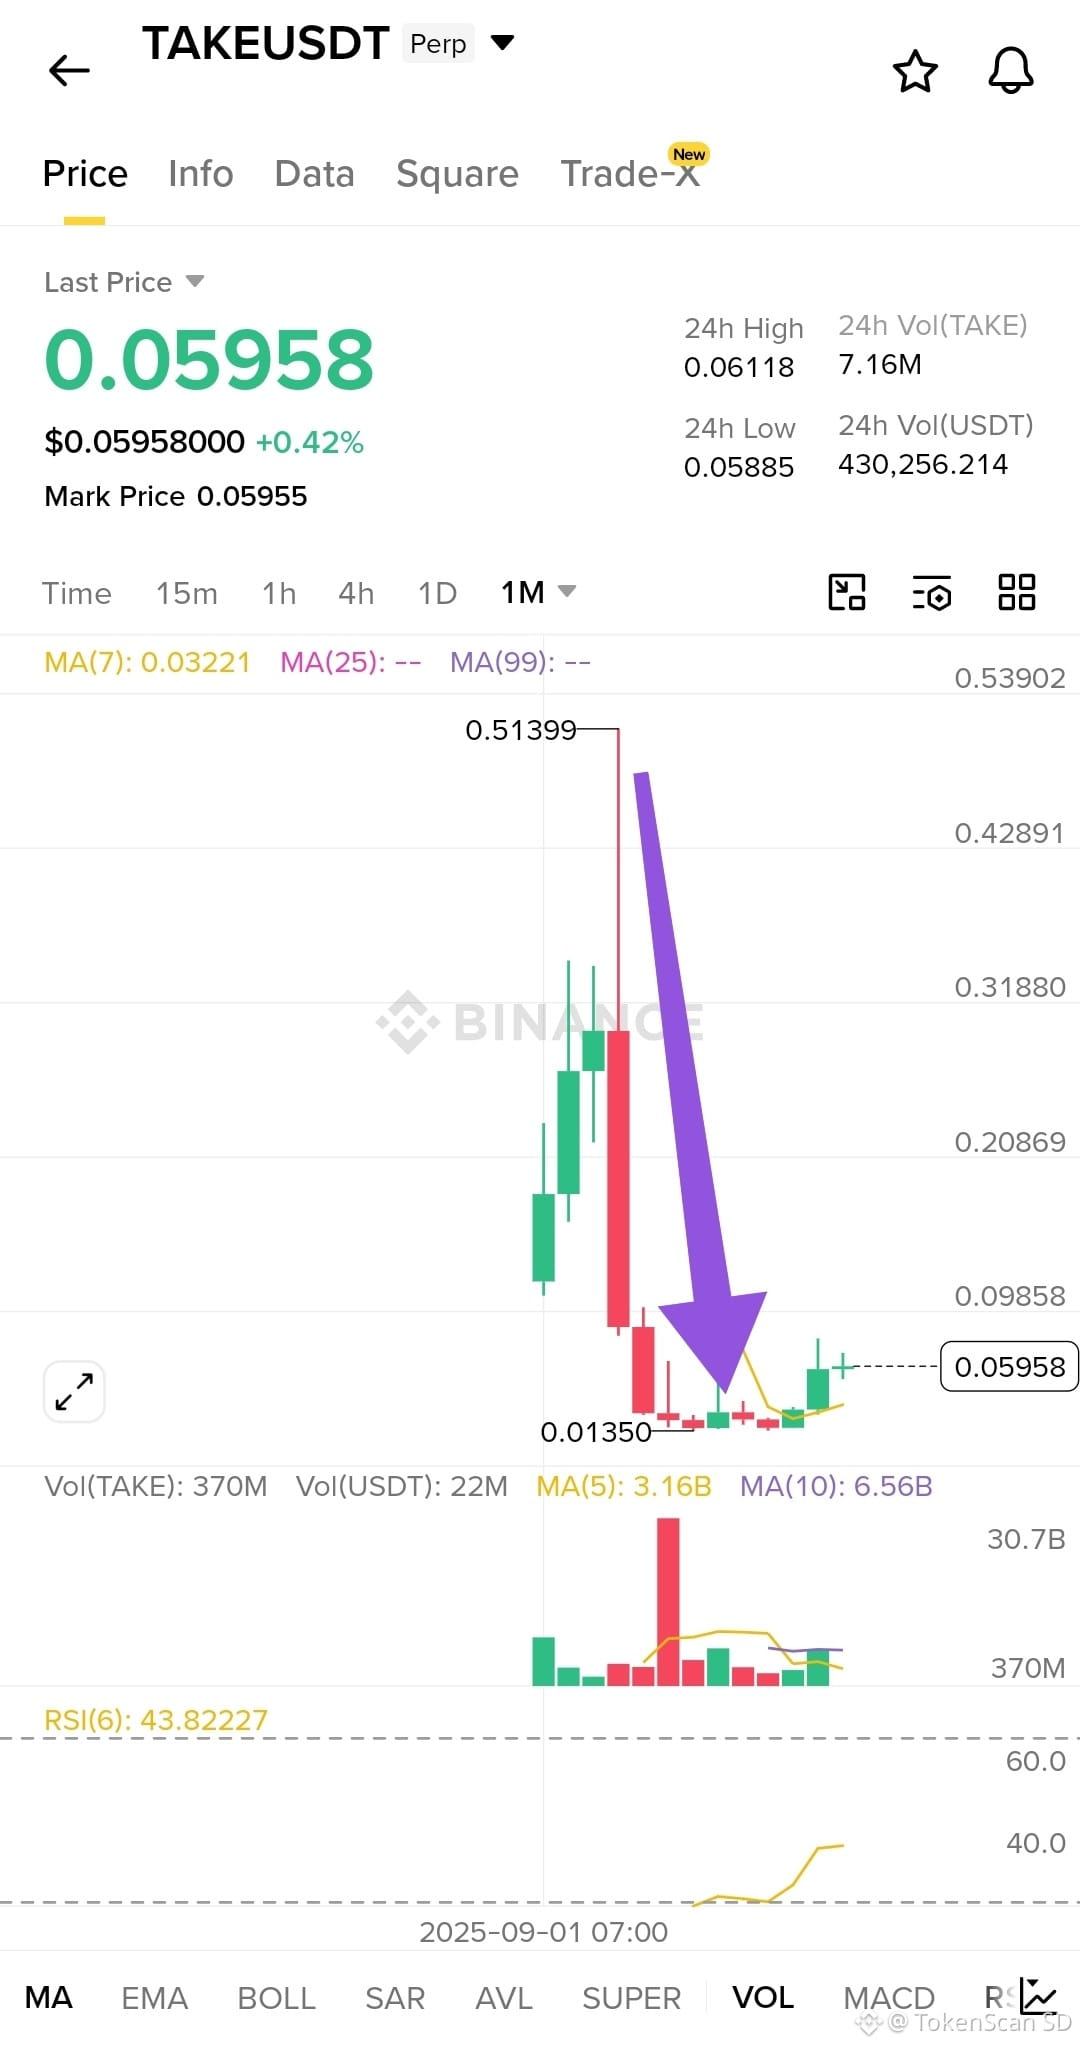
🚨All altcoins will be like this eventually
Not a threat. This is a pattern that has repeated.
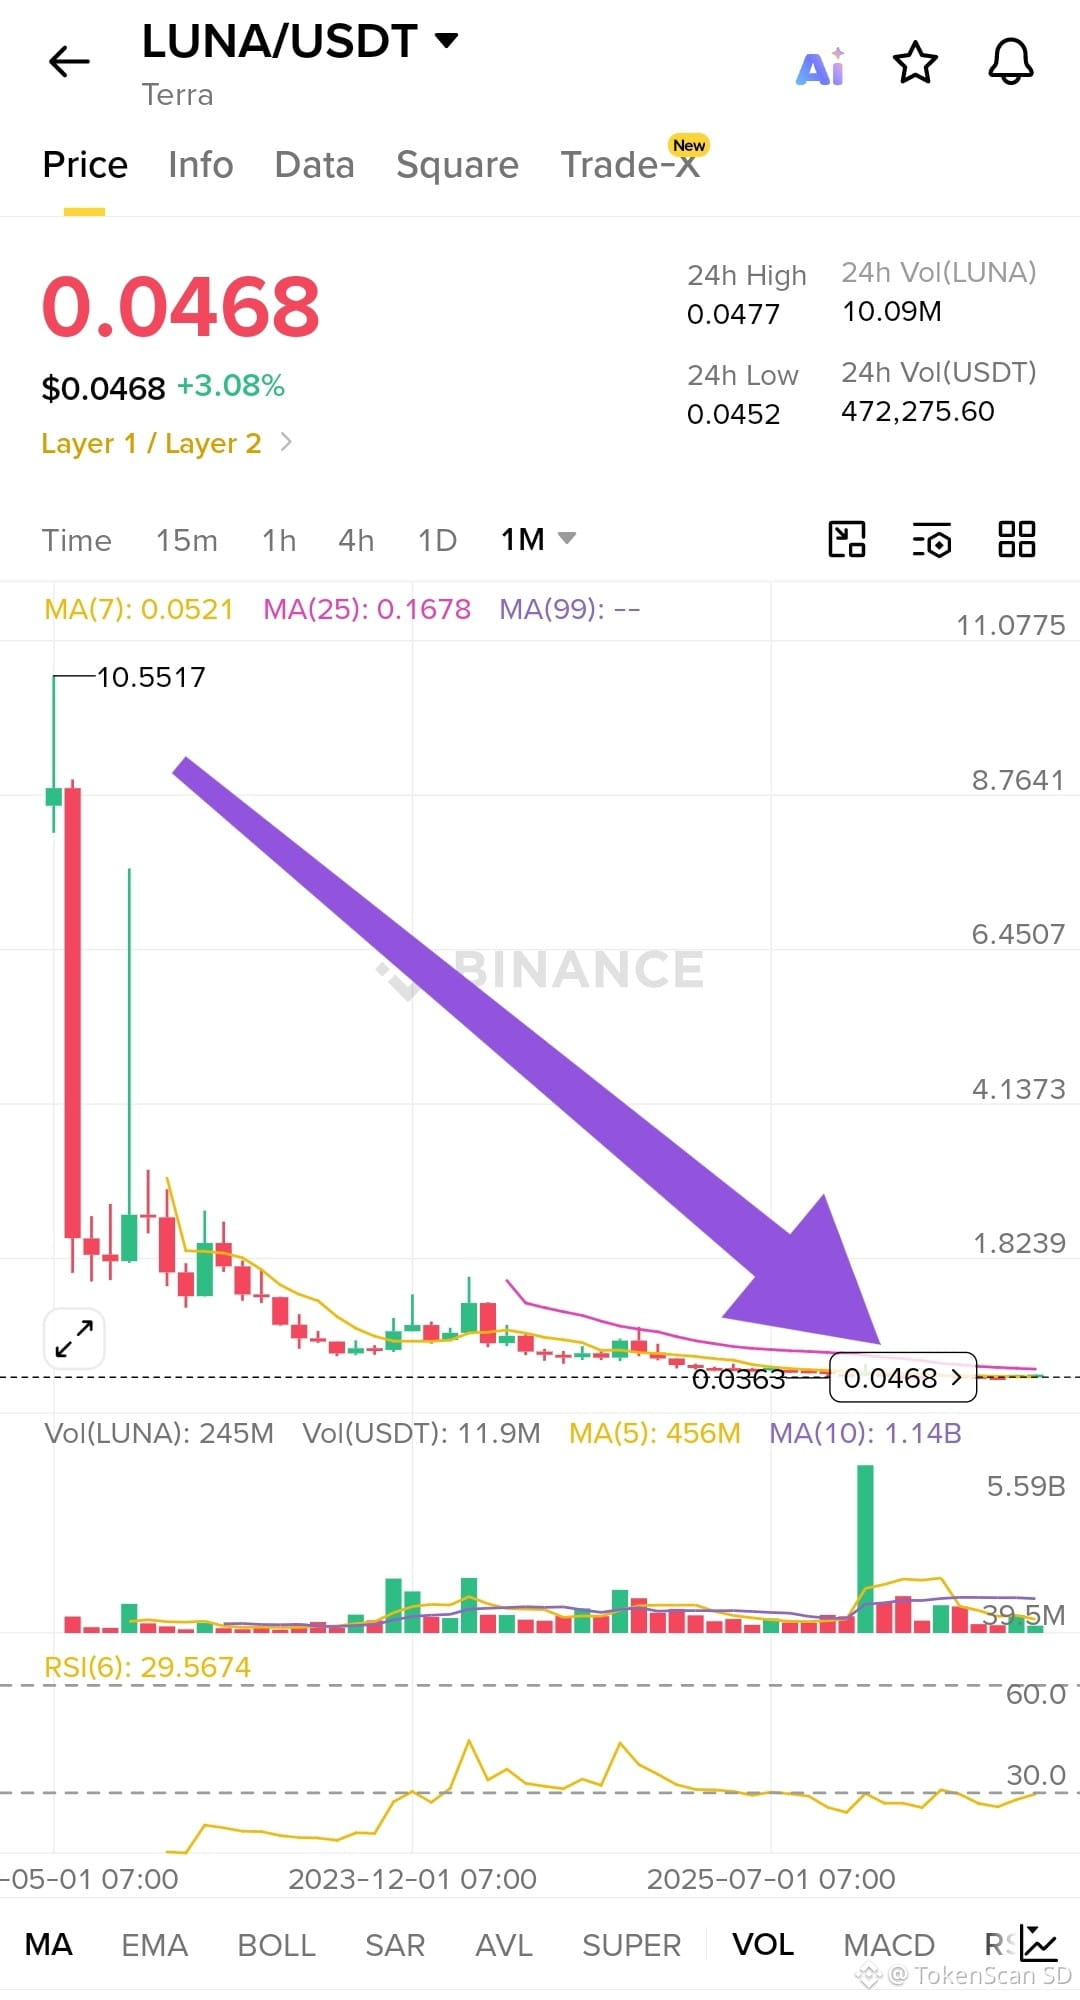
1. LUNA
It once hit 10.55. Now it’s 0.04668.
From the peak to here, the monthly chart only goes one way: down, down, then flat at the bottom. There’s still volume, RSI is low, and green price +3% today. That’s not a comeback. It’s dust that’s still moving.
2. TAKE
Peak at 0.513. Fell to 0.01350. Now it’s 0.05958.
It goes up a bit after being smashed, and people start calling it “recovery.” But it’s still far from the ATH. One big red candle is enough to erase the narrative.
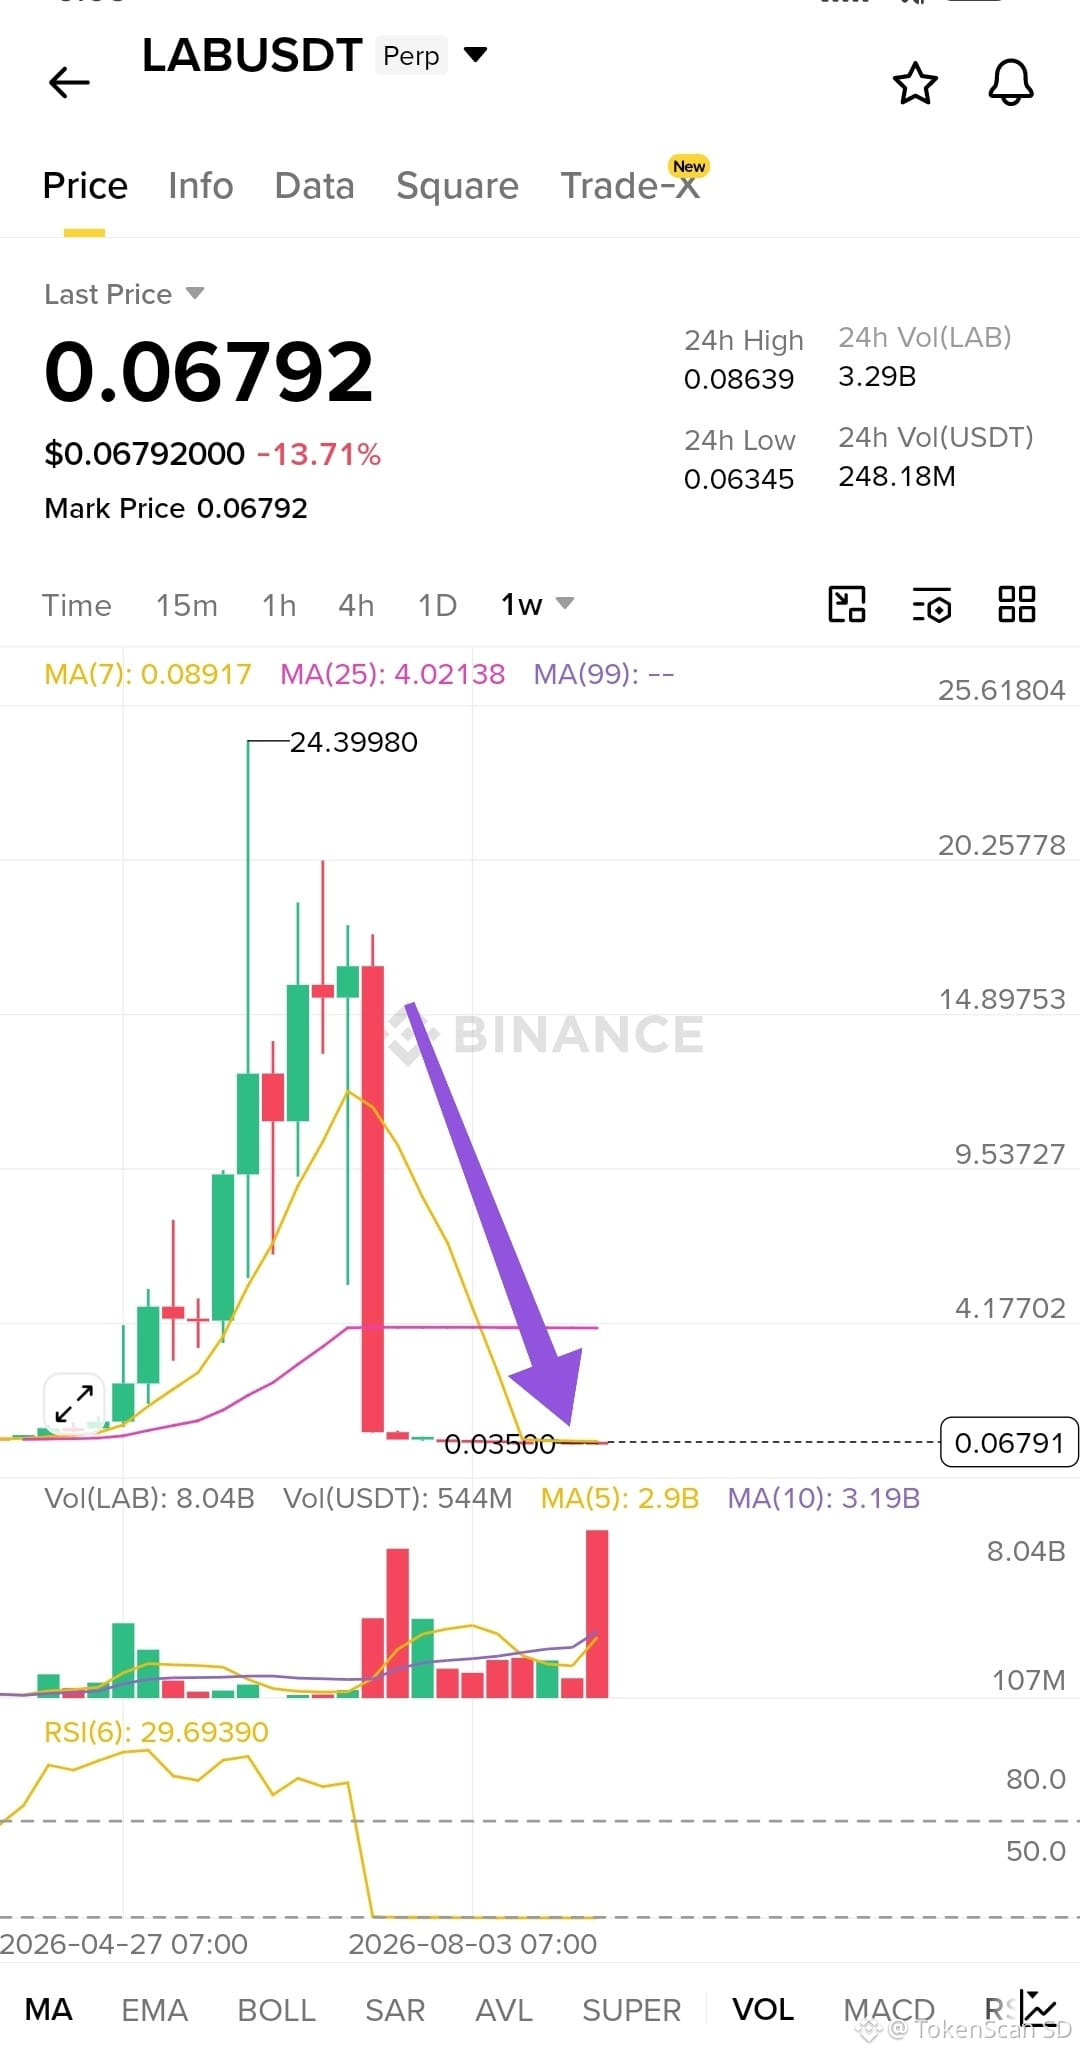
3. LAB
Faster story.
Climbed to 24.39, then got cut down. Now 0.0678, down 13.7% in a day.
RSI is in a weak zone. Big volume on the red candle. This isn’t a “dip”; it’s distribution that’s already finished.
Three charts, one template ☕
👉New narrative
👉Price rockets
👉Liquidity comes in
👉Smart money exits
👉The chart turns into an arrow to the bottom-right
What’s left holding the bag, waiting
“for the next cycle”
Bitcoin can recover because it’s an index of network trust.
Most major altcoins don’t have that. They have moments, timelines, KOLs, and expiration dates.
What looks “alive” today may just be waiting for the right time to die.
Later, the charts will look like these three: a peak on the left, the needle on the bottom-right, and the caption “still early.”
Not that there’s no pump,
There is—but Brief.
After that, the market does the same thing to the next names.
Don’t read this chart as a buy signal.
Read it as a reminder ☝️that in crypto, the damaging time comes late—and those who know when to be done end up helping themselves.
DYOR. Not financial advice.
#story #altcoins
$LUNA
{spot}(LUNAUSDT)
$TAKE
{future}(TAKEUSDT)
$LAB
{future}(LABUSDT)
🚨All altcoins will be like this eventually
Not a threat. This is a pattern that has repeated.
1. LUNA
It once hit 10.55. Now it’s 0.04668.
From the peak to here, the monthly chart only goes one way: down, down, then flat at the bottom. There’s still volume, RSI is low, and green price +3% today. That’s not a comeback. It’s dust that’s still moving.
2. TAKE
Peak at 0.513. Fell to 0.01350. Now it’s 0.05958.
It goes up a bit after being smashed, and people start calling it “recovery.” But it’s still far from the ATH. One big red candle is enough to erase the narrative.
3. LAB
Faster story.
Climbed to 24.39, then got cut down. Now 0.0678, down 13.7% in a day.
RSI is in a weak zone. Big volume on the red candle. This isn’t a “dip”; it’s distribution that’s already finished.
Three charts, one template ☕
👉New narrative
👉Price rockets
👉Liquidity comes in
👉Smart money exits
👉The chart turns into an arrow to the bottom-right
What’s left holding the bag, waiting
“for the next cycle”
Bitcoin can recover because it’s an index of network trust.
Most major altcoins don’t have that. They have moments, timelines, KOLs, and expiration dates.
What looks “alive” today may just be waiting for the right time to die.
Later, the charts will look like these three: a peak on the left, the needle on the bottom-right, and the caption “still early.”
Not that there’s no pump,
There is—but Brief.
After that, the market does the same thing to the next names.
Don’t read this chart as a buy signal.
Read it as a reminder ☝️that in crypto, the damaging time comes late—and those who know when to be done end up helping themselves.
DYOR. Not financial advice.
#story #altcoins
$LUNA
$TAKE
$LAB
Not a threat. This is a pattern that has repeated.
1. LUNA
It once hit 10.55. Now it’s 0.04668.
From the peak to here, the monthly chart only goes one way: down, down, then flat at the bottom. There’s still volume, RSI is low, and green price +3% today. That’s not a comeback. It’s dust that’s still moving.
2. TAKE
Peak at 0.513. Fell to 0.01350. Now it’s 0.05958.
It goes up a bit after being smashed, and people start calling it “recovery.” But it’s still far from the ATH. One big red candle is enough to erase the narrative.
3. LAB
Faster story.
Climbed to 24.39, then got cut down. Now 0.0678, down 13.7% in a day.
RSI is in a weak zone. Big volume on the red candle. This isn’t a “dip”; it’s distribution that’s already finished.
Three charts, one template ☕
👉New narrative
👉Price rockets
👉Liquidity comes in
👉Smart money exits
👉The chart turns into an arrow to the bottom-right
What’s left holding the bag, waiting
“for the next cycle”
Bitcoin can recover because it’s an index of network trust.
Most major altcoins don’t have that. They have moments, timelines, KOLs, and expiration dates.
What looks “alive” today may just be waiting for the right time to die.
Later, the charts will look like these three: a peak on the left, the needle on the bottom-right, and the caption “still early.”
Not that there’s no pump,
There is—but Brief.
After that, the market does the same thing to the next names.
Don’t read this chart as a buy signal.
Read it as a reminder ☝️that in crypto, the damaging time comes late—and those who know when to be done end up helping themselves.
DYOR. Not financial advice.
#story #altcoins
$LUNA
$TAKE
$LAB
932
·
--
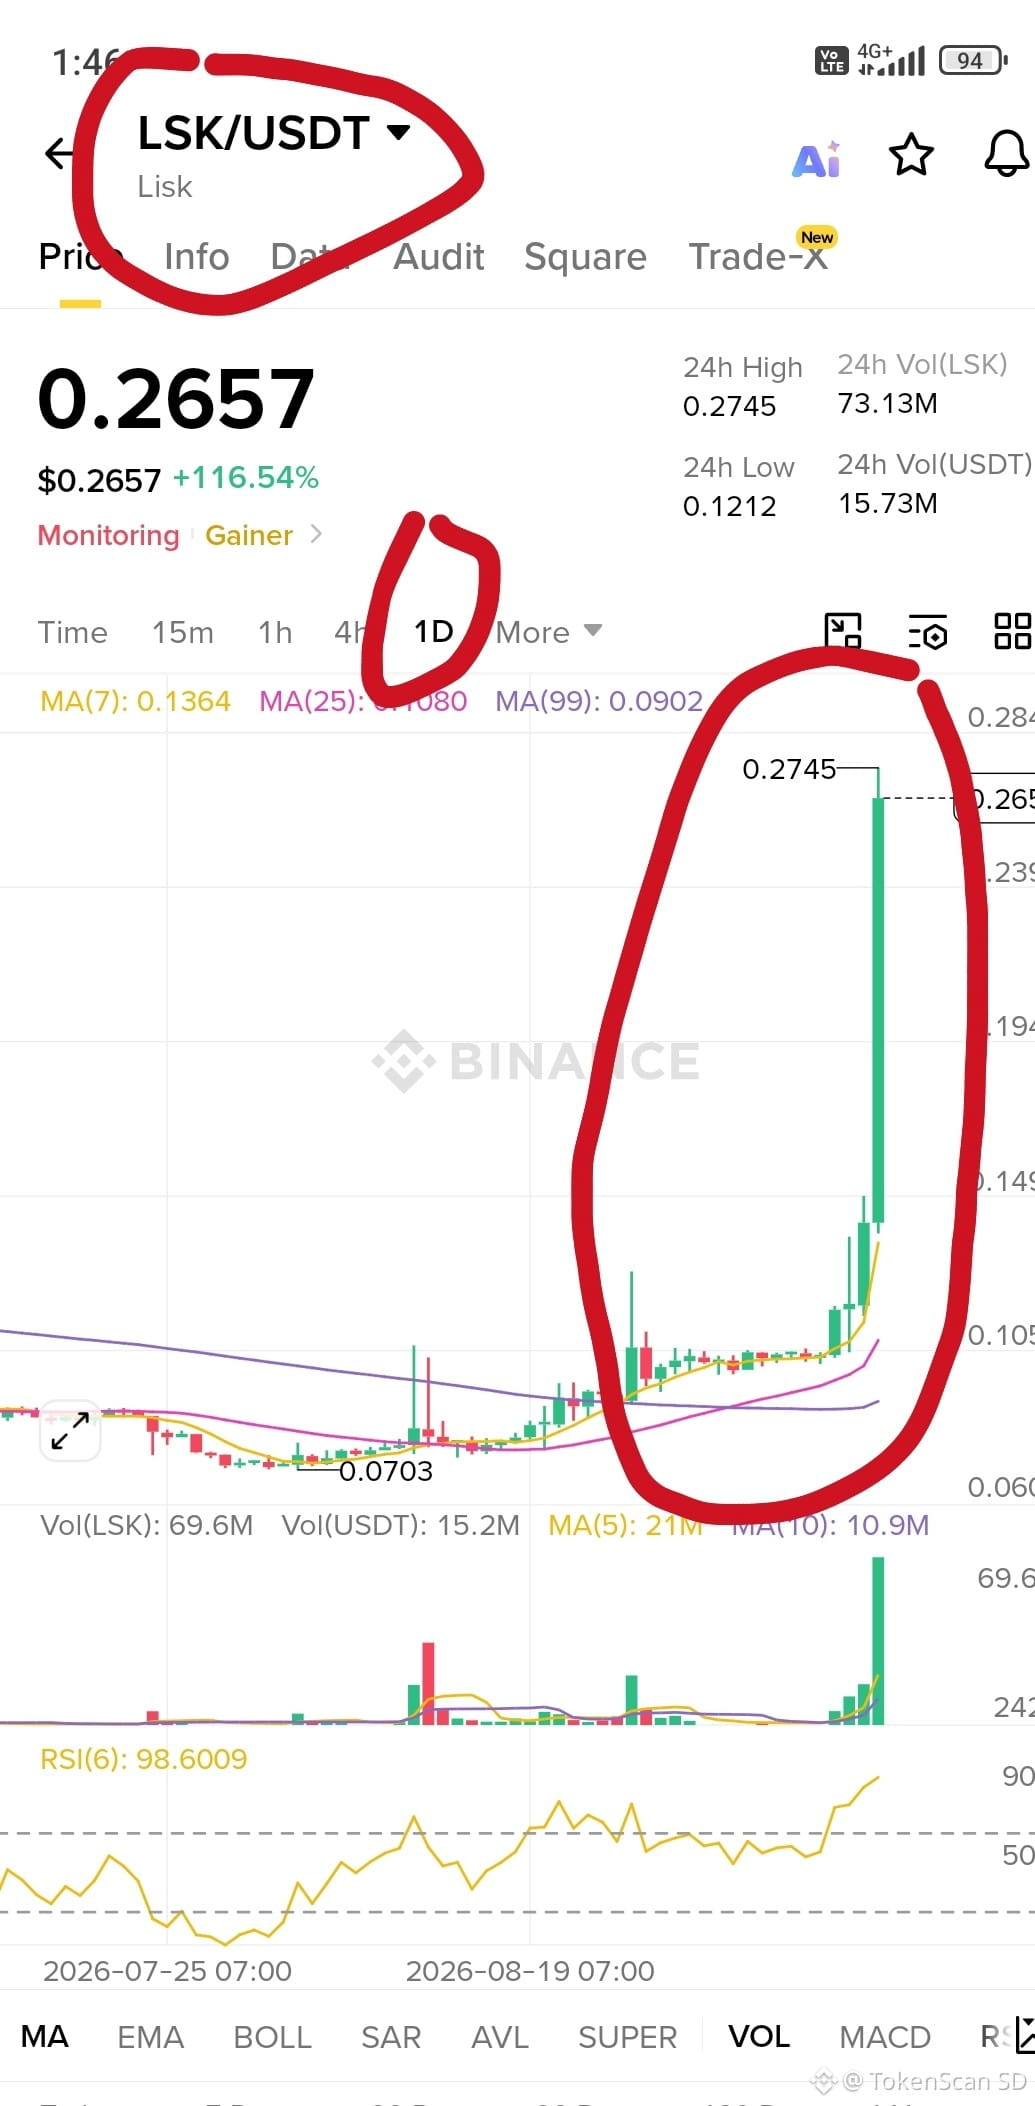
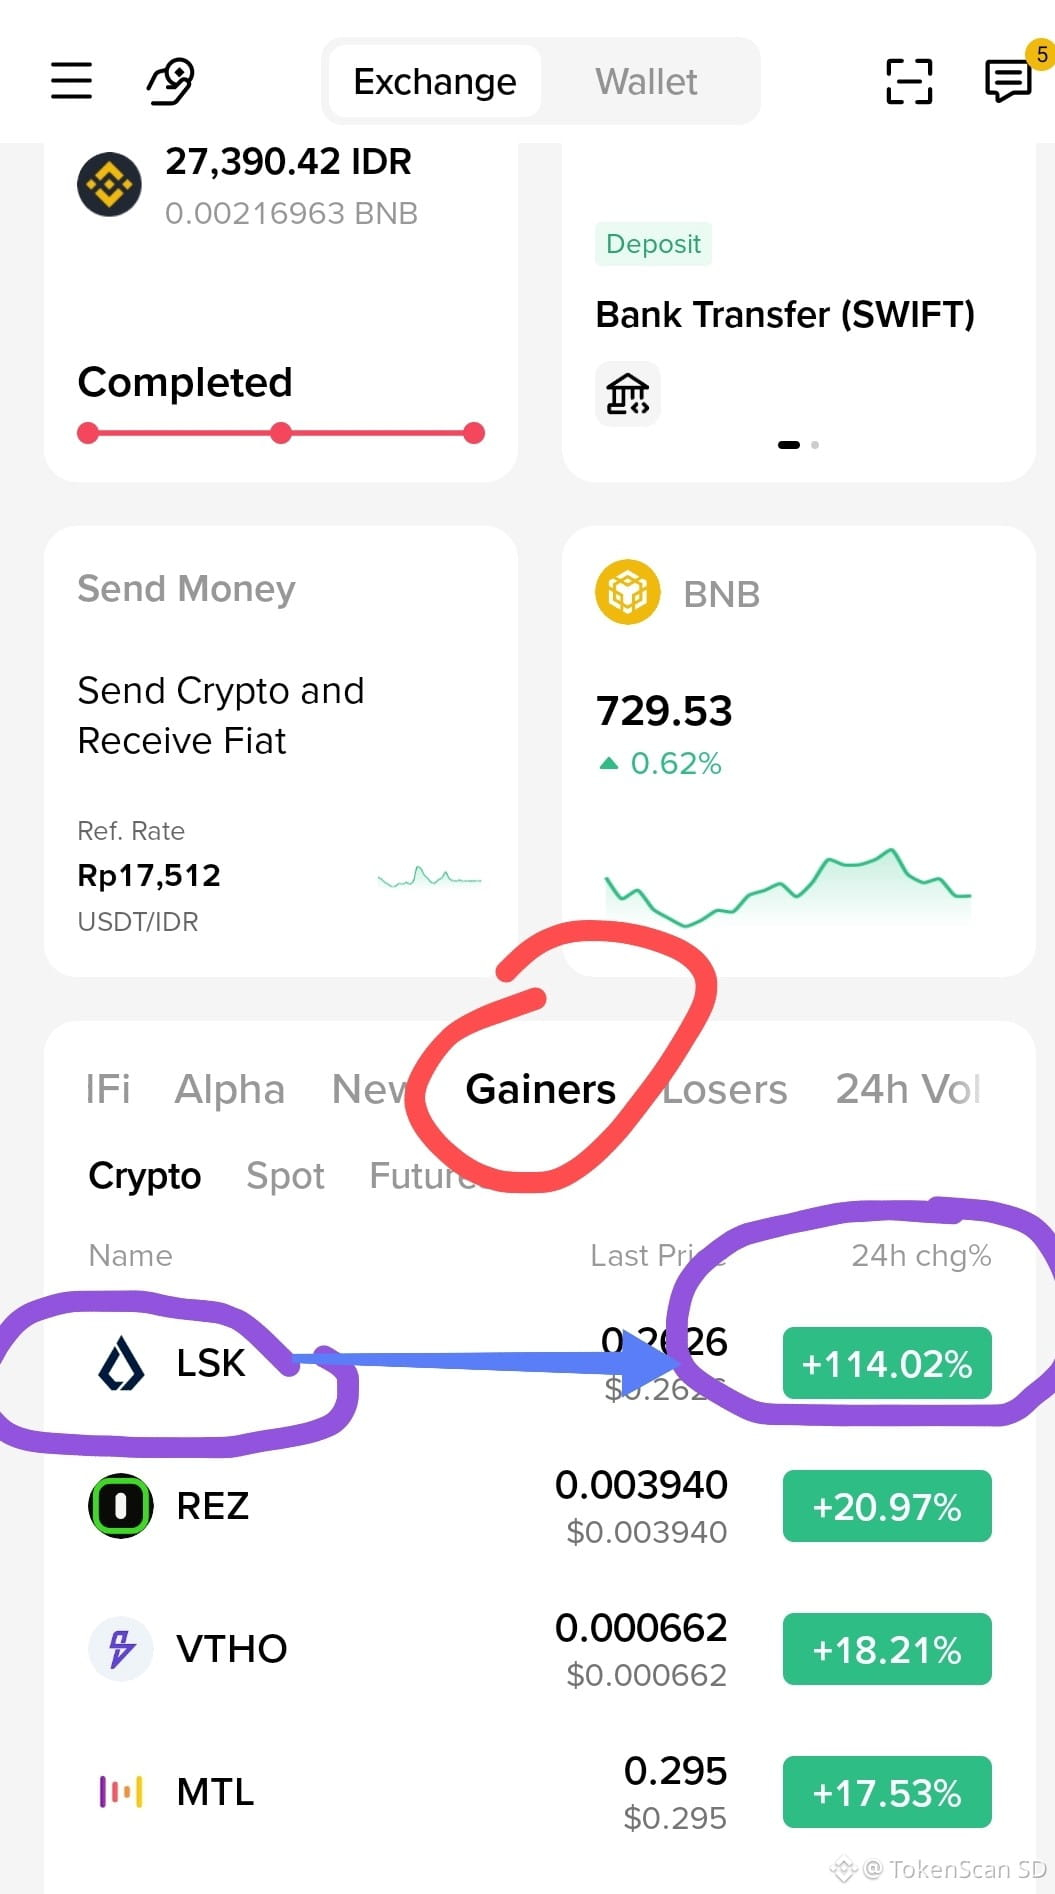
$LSK just became a stage star, from 0.0703 rocketing to 0.2745, green fireworks +116%! Entering the #1 Gainers list, beating REZ, VTHO—everyone else move aside.
But take a look at the RSI... 98.6! This isn’t overbought anymore, it’s already 'over-everything' 🥵 The long green candle is like a rocket with no brakes, and the volume suddenly exploded while the price is already up in the sky.
Realistically: a pump this wild rarely comes down smoothly. Those who got in late usually become the cushion for those who sold first. If you’re not in yet, better sit tight and watch the drama from the audience seats. Chasing a green candle with RSI this high is like jumping onto a train that has already left the station 😅 DYOR, don’t just go in on pure hype
NOTE : RSI 98.6, already extreme overbought, +116% in a day. Entry now (long or short) is equally high risk. Wait for reversal signals first before taking a position. DYOR.
$LSK
{future}(LSKUSDT)
$LSK just became a stage star, from 0.0703 rocketing to 0.2745, green fireworks +116%! Entering the #1 Gainers list, beating REZ, VTHO—everyone else move aside.
But take a look at the RSI... 98.6! This isn’t overbought anymore, it’s already 'over-everything' 🥵 The long green candle is like a rocket with no brakes, and the volume suddenly exploded while the price is already up in the sky.
Realistically: a pump this wild rarely comes down smoothly. Those who got in late usually become the cushion for those who sold first. If you’re not in yet, better sit tight and watch the drama from the audience seats. Chasing a green candle with RSI this high is like jumping onto a train that has already left the station 😅 DYOR, don’t just go in on pure hype
NOTE : RSI 98.6, already extreme overbought, +116% in a day. Entry now (long or short) is equally high risk. Wait for reversal signals first before taking a position. DYOR.
$LSK
But take a look at the RSI... 98.6! This isn’t overbought anymore, it’s already 'over-everything' 🥵 The long green candle is like a rocket with no brakes, and the volume suddenly exploded while the price is already up in the sky.
Realistically: a pump this wild rarely comes down smoothly. Those who got in late usually become the cushion for those who sold first. If you’re not in yet, better sit tight and watch the drama from the audience seats. Chasing a green candle with RSI this high is like jumping onto a train that has already left the station 😅 DYOR, don’t just go in on pure hype
NOTE : RSI 98.6, already extreme overbought, +116% in a day. Entry now (long or short) is equally high risk. Wait for reversal signals first before taking a position. DYOR.
$LSK
1
1.8k
·
--
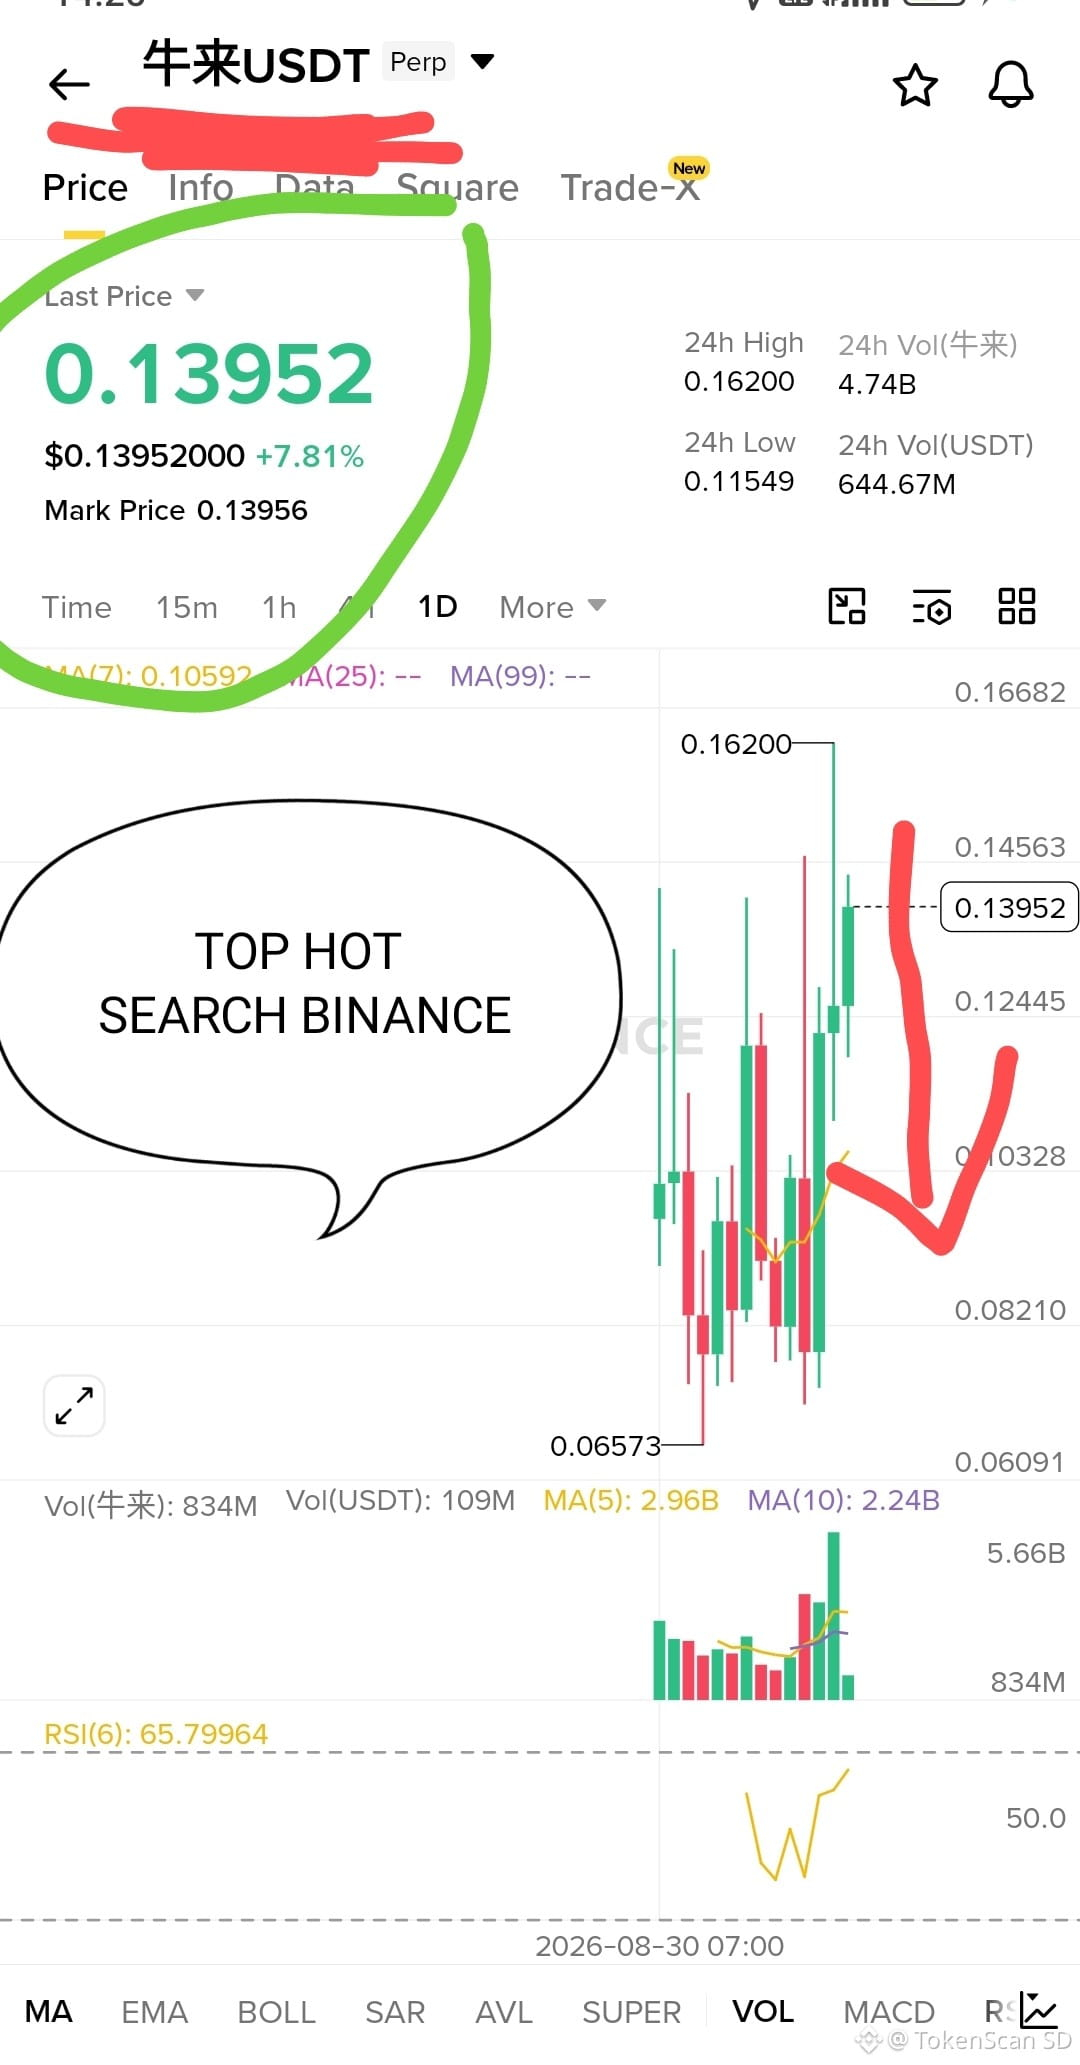
$牛来 still trending, trending again and again,
charts like someone who just got dumped—goes straight to the gym.
From 0.16 got smashed, to 0.11 embraced, now 0.139 again looking up.
Big volume, RSI 65, hot search Binance.
The red pattern on the right looks like a slanted checkmark — “it’s already down, now it’s time to go up… or it gets hit again”.
Conclusion 👉 there is momentum, but this is still a meme cash-cow. Could be rendang, could be satay, could also be meat that’s already gone bad.
Go ahead. Don’t go all-in.
DYOR NFA!
#MEME #crypto #niulai
$牛来
{spot}(牛来USDT)
$牛来 still trending, trending again and again,
charts like someone who just got dumped—goes straight to the gym.
From 0.16 got smashed, to 0.11 embraced, now 0.139 again looking up.
Big volume, RSI 65, hot search Binance.
The red pattern on the right looks like a slanted checkmark — “it’s already down, now it’s time to go up… or it gets hit again”.
Conclusion 👉 there is momentum, but this is still a meme cash-cow. Could be rendang, could be satay, could also be meat that’s already gone bad.
Go ahead. Don’t go all-in.
DYOR NFA!
#MEME #crypto #niulai
$牛来
charts like someone who just got dumped—goes straight to the gym.
From 0.16 got smashed, to 0.11 embraced, now 0.139 again looking up.
Big volume, RSI 65, hot search Binance.
The red pattern on the right looks like a slanted checkmark — “it’s already down, now it’s time to go up… or it gets hit again”.
Conclusion 👉 there is momentum, but this is still a meme cash-cow. Could be rendang, could be satay, could also be meat that’s already gone bad.
Go ahead. Don’t go all-in.
DYOR NFA!
#MEME #crypto #niulai
$牛来
1
772
·
--
😂 "Nasib Artis Dadakan": The One Who Became a Top Gainer Star Yesterday Is Now Caught Sitting in the Top Losers
Is the title being dramatic? But take a look at this data—this really happened:
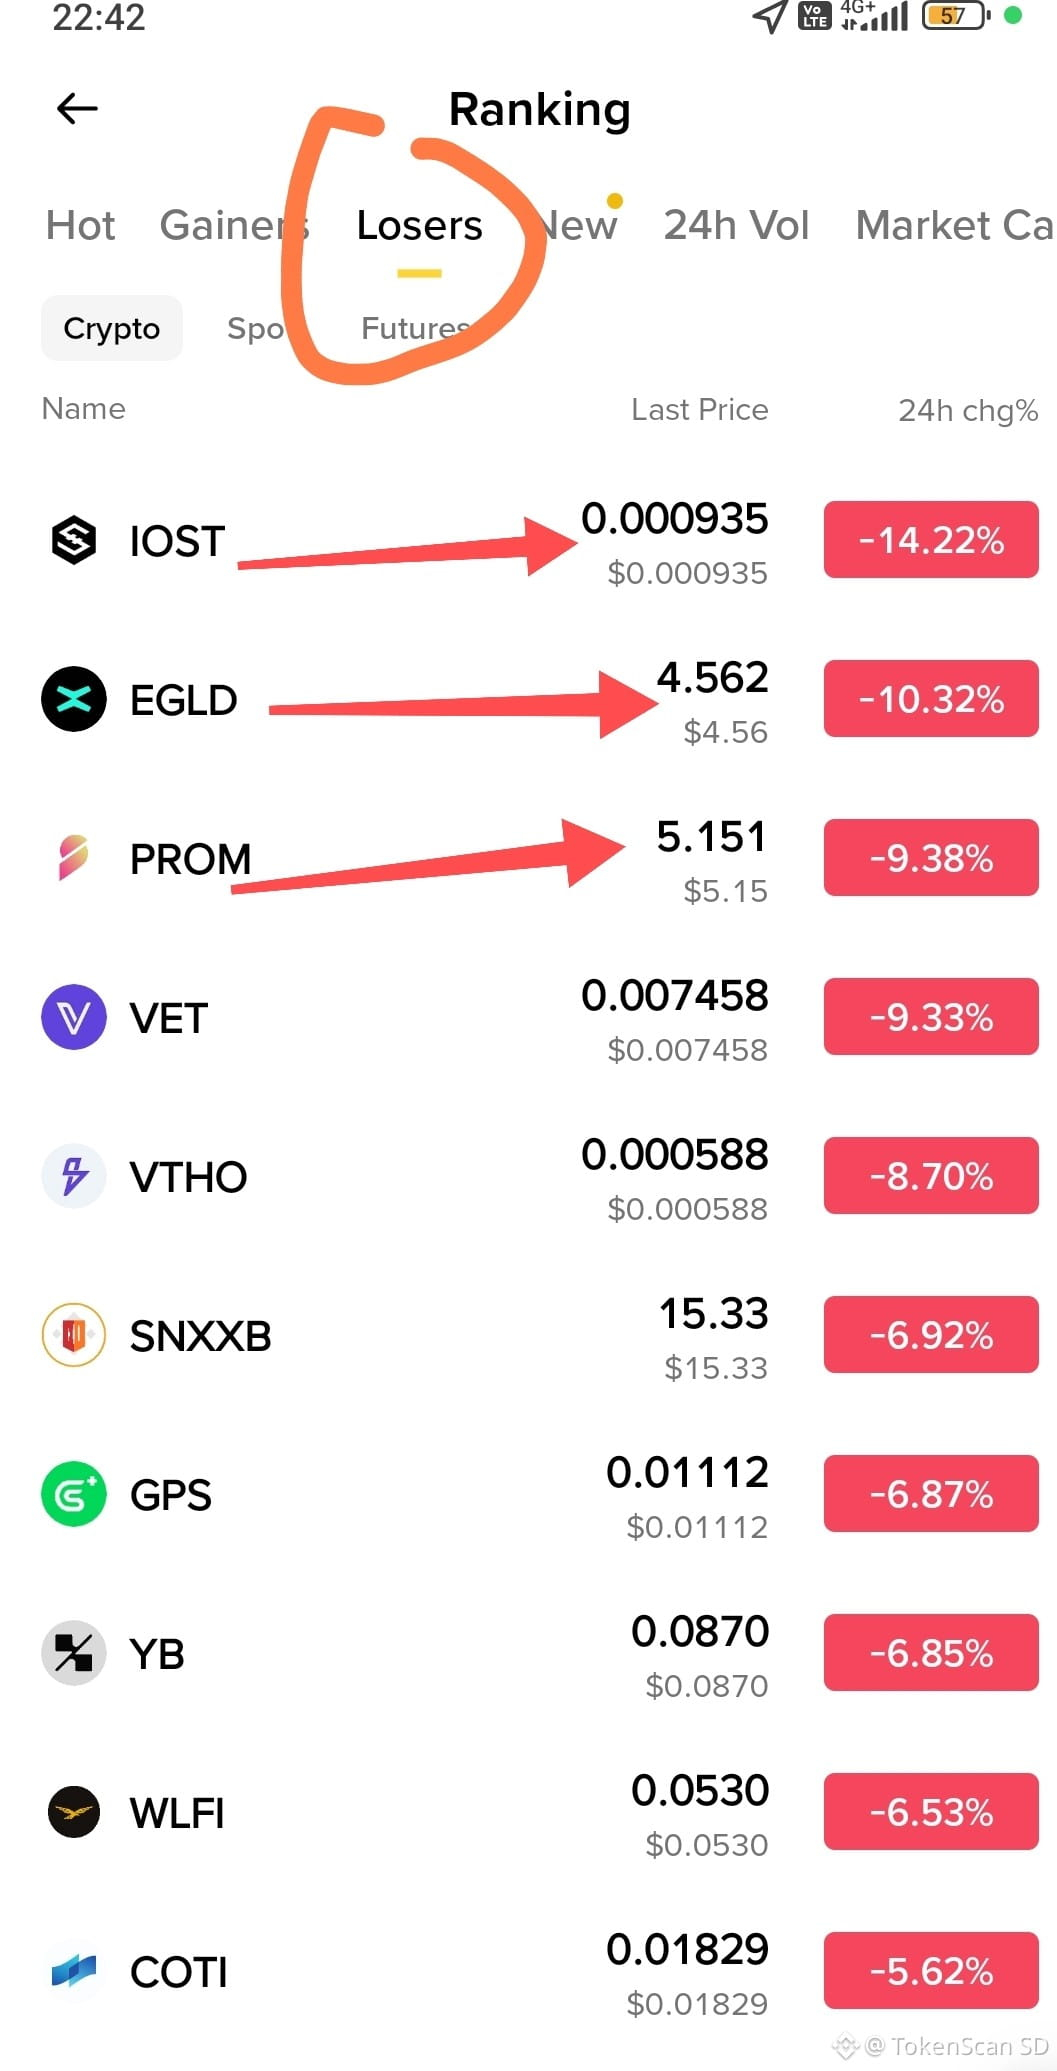
🏆 The day before yesterday, VTHO went viral in the Top Gainers—jumping up to +57% in a single day. People were talking about, "Wow, huge profit, right." At that time, I even said: its RSI is already 87 (severely overbought); usually after this, there’s a sharp correction.
📉 Now? VTHO is sitting in the Top LOSERS, -8.70%. EGLD, which was also in the Top Gainers yesterday (+10%), is now plunging too, -10.32%.
It’s like a soap opera plot: "From the Stage of Honor to an Uninvited Comeback" 🎭
Let’s break down today’s losers lineup, in a fresh and weird version:
🥇 IOST -14.22% → The champion of today’s losers. Like someone who just won the lottery and then his wallet disappears again the next day.
🥈 EGLD -10.32% → Even though yesterday it became a group’s pride. Now it’s like, "Oh right, it was you—the one who was making noise yesterday?"
🥉 PROM -9.38% → A proud name "Prometheus," but the fire went out first today.
VET -9.33%, VTHO -8.70% → A duo of "one-management artists" who went up on stage together, and also stepped off the stage together.
$IOST
{spot}(IOSTUSDT)
$EGLD
{future}(EGLDUSDT)
$PROM
{future}(PROMUSDT)
#TopLosers #EdukasiCrypto #VTHO.24小时交易策略 #EGLD
😂 "Nasib Artis Dadakan": The One Who Became a Top Gainer Star Yesterday Is Now Caught Sitting in the Top Losers
Is the title being dramatic? But take a look at this data—this really happened:
🏆 The day before yesterday, VTHO went viral in the Top Gainers—jumping up to +57% in a single day. People were talking about, "Wow, huge profit, right." At that time, I even said: its RSI is already 87 (severely overbought); usually after this, there’s a sharp correction.
📉 Now? VTHO is sitting in the Top LOSERS, -8.70%. EGLD, which was also in the Top Gainers yesterday (+10%), is now plunging too, -10.32%.
It’s like a soap opera plot: "From the Stage of Honor to an Uninvited Comeback" 🎭
Let’s break down today’s losers lineup, in a fresh and weird version:
🥇 IOST -14.22% → The champion of today’s losers. Like someone who just won the lottery and then his wallet disappears again the next day.
🥈 EGLD -10.32% → Even though yesterday it became a group’s pride. Now it’s like, "Oh right, it was you—the one who was making noise yesterday?"
🥉 PROM -9.38% → A proud name "Prometheus," but the fire went out first today.
VET -9.33%, VTHO -8.70% → A duo of "one-management artists" who went up on stage together, and also stepped off the stage together.
$IOST
$EGLD
$PROM
#TopLosers #EdukasiCrypto #VTHO.24小时交易策略 #EGLD
Is the title being dramatic? But take a look at this data—this really happened:
🏆 The day before yesterday, VTHO went viral in the Top Gainers—jumping up to +57% in a single day. People were talking about, "Wow, huge profit, right." At that time, I even said: its RSI is already 87 (severely overbought); usually after this, there’s a sharp correction.
📉 Now? VTHO is sitting in the Top LOSERS, -8.70%. EGLD, which was also in the Top Gainers yesterday (+10%), is now plunging too, -10.32%.
It’s like a soap opera plot: "From the Stage of Honor to an Uninvited Comeback" 🎭
Let’s break down today’s losers lineup, in a fresh and weird version:
🥇 IOST -14.22% → The champion of today’s losers. Like someone who just won the lottery and then his wallet disappears again the next day.
🥈 EGLD -10.32% → Even though yesterday it became a group’s pride. Now it’s like, "Oh right, it was you—the one who was making noise yesterday?"
🥉 PROM -9.38% → A proud name "Prometheus," but the fire went out first today.
VET -9.33%, VTHO -8.70% → A duo of "one-management artists" who went up on stage together, and also stepped off the stage together.
$IOST
$EGLD
$PROM
#TopLosers #EdukasiCrypto #VTHO.24小时交易策略 #EGLD
1.1k
·
--
$CNPY (Canopy) — GUE version
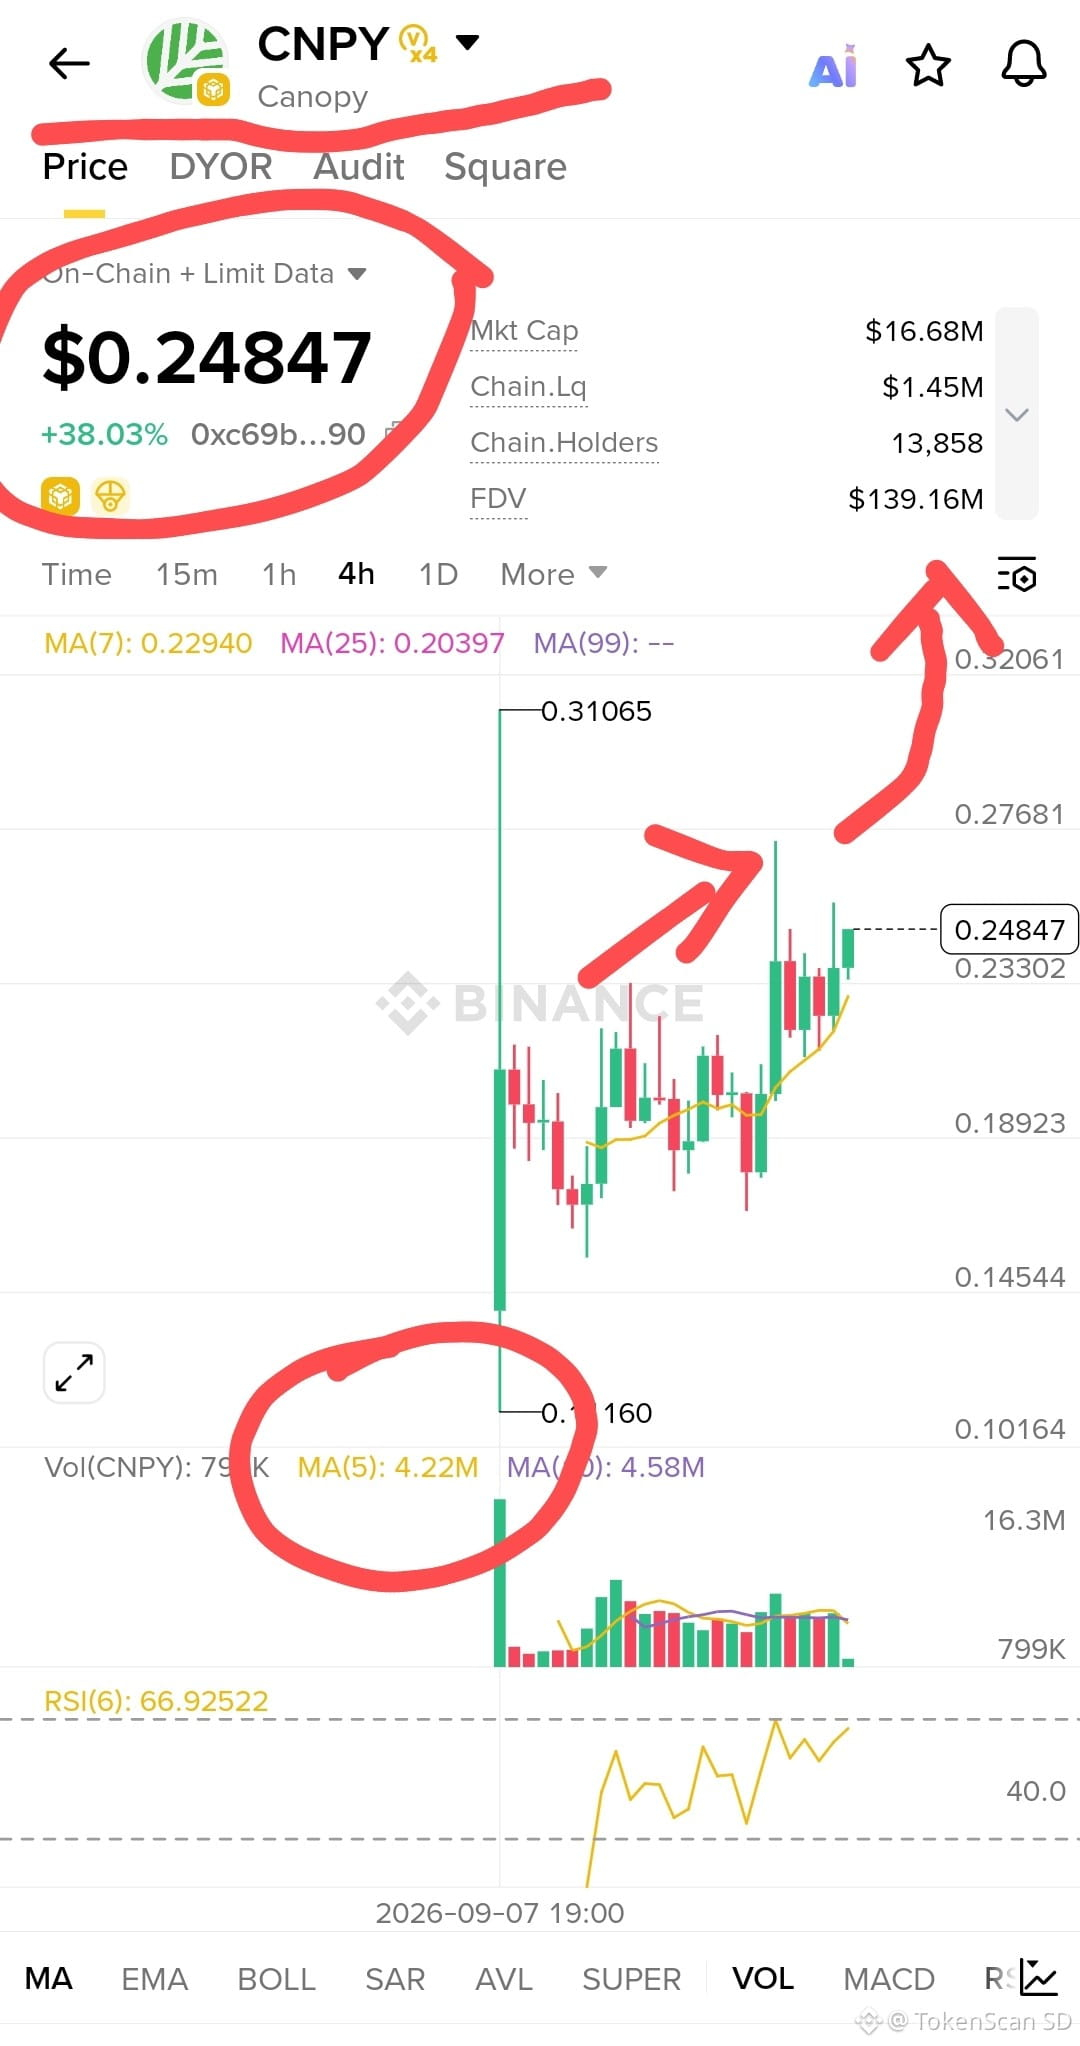
Price on chart: $0.248 (+38%)
MC $16.6M
Liq $1.45M
Holders 13.8k
FDV $139M
Not a coin “dogs wearing hats.” This is AI infrastructure to build an appchain with ~200 lines of code. $CNPY = pay gas + stake + borrow security from someone else’s chain. Seed $8.5M. Listed 7 Sep on Alpha/Bitget/Gate. Circulation is only ~12% of the max 560 million. The rest is still waiting in line to come out. 👋
Chart 4H:
That first green candle isn’t accumulation—people are fighting for seats. High $0.31, now sitting at $0.248, still above MA7/MA25. RSI 67 = a bit hot, not knocked out yet.
Support: 0.23 – 0.19
Resistance: 0.27 – 0.31
Volume vs MC is insane. Good for trading, bad for your ego.
Conclusion: good narrative, listing timing is nice, price already ran first. Chasing +38% = buying a concert ticket for songs that haven’t started yet. Wait for a pullback, small size, don’t marry the green candle.🤪
DYOR. Not a signal. If you lose money, don’t tag me—tag the MA7.
#Canopy #NewListing
$CNPY
{alpha}(560xc69b16cf18cea1e5d0bb6a1a9db802097790ddd2)
$CNPY (Canopy) — GUE version
Price on chart: $0.248 (+38%)
MC $16.6M
Liq $1.45M
Holders 13.8k
FDV $139M
Not a coin “dogs wearing hats.” This is AI infrastructure to build an appchain with ~200 lines of code. $CNPY = pay gas + stake + borrow security from someone else’s chain. Seed $8.5M. Listed 7 Sep on Alpha/Bitget/Gate. Circulation is only ~12% of the max 560 million. The rest is still waiting in line to come out. 👋
Chart 4H:
That first green candle isn’t accumulation—people are fighting for seats. High $0.31, now sitting at $0.248, still above MA7/MA25. RSI 67 = a bit hot, not knocked out yet.
Support: 0.23 – 0.19
Resistance: 0.27 – 0.31
Volume vs MC is insane. Good for trading, bad for your ego.
Conclusion: good narrative, listing timing is nice, price already ran first. Chasing +38% = buying a concert ticket for songs that haven’t started yet. Wait for a pullback, small size, don’t marry the green candle.🤪
DYOR. Not a signal. If you lose money, don’t tag me—tag the MA7.
#Canopy #NewListing
$CNPY
Price on chart: $0.248 (+38%)
MC $16.6M
Liq $1.45M
Holders 13.8k
FDV $139M
Not a coin “dogs wearing hats.” This is AI infrastructure to build an appchain with ~200 lines of code. $CNPY = pay gas + stake + borrow security from someone else’s chain. Seed $8.5M. Listed 7 Sep on Alpha/Bitget/Gate. Circulation is only ~12% of the max 560 million. The rest is still waiting in line to come out. 👋
Chart 4H:
That first green candle isn’t accumulation—people are fighting for seats. High $0.31, now sitting at $0.248, still above MA7/MA25. RSI 67 = a bit hot, not knocked out yet.
Support: 0.23 – 0.19
Resistance: 0.27 – 0.31
Volume vs MC is insane. Good for trading, bad for your ego.
Conclusion: good narrative, listing timing is nice, price already ran first. Chasing +38% = buying a concert ticket for songs that haven’t started yet. Wait for a pullback, small size, don’t marry the green candle.🤪
DYOR. Not a signal. If you lose money, don’t tag me—tag the MA7.
#Canopy #NewListing
$CNPY
445
·
--
#CPIWatch Tonight, "Headline vs Core" is up ring 🥊
August NFP +162K, the labor market is still strong. Now it’s Core CPI’s turn tonight + FOMC 15–16 Sept to set the direction.
This is according to my analysis 👇
Core ≤0,2% → I’d lean to hold; BNB has room to 725–740.
Core in-line but yields don’t fall → range 700–720.
Core ≥0,3% → hike odds increase; pressure toward 704, possibly 690.
The logic: hot core → expectations of a hike rise → yield & dollar strengthen → risk-off → BTC drops first → BNB follows, often deeper.
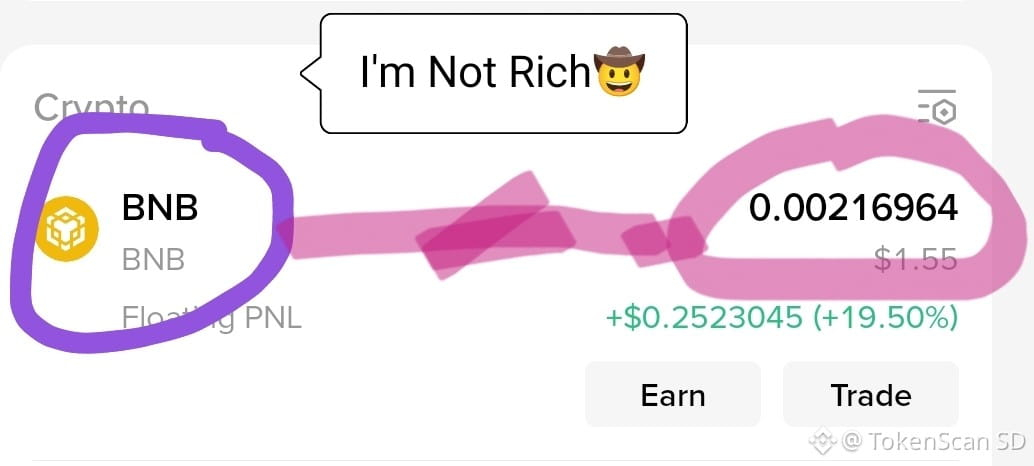
My position is small: hold BNB ~1,5 USDT, just to gauge sentiment. Neutral-to-bearish ahead of the release.
Hike or hold? 👇
$BNB
#CPIWatch Tonight, "Headline vs Core" is up ring 🥊
August NFP +162K, the labor market is still strong. Now it’s Core CPI’s turn tonight + FOMC 15–16 Sept to set the direction.
This is according to my analysis 👇
Core ≤0,2% → I’d lean to hold; BNB has room to 725–740.
Core in-line but yields don’t fall → range 700–720.
Core ≥0,3% → hike odds increase; pressure toward 704, possibly 690.
The logic: hot core → expectations of a hike rise → yield & dollar strengthen → risk-off → BTC drops first → BNB follows, often deeper.
My position is small: hold BNB ~1,5 USDT, just to gauge sentiment. Neutral-to-bearish ahead of the release.
Hike or hold? 👇
$BNB
August NFP +162K, the labor market is still strong. Now it’s Core CPI’s turn tonight + FOMC 15–16 Sept to set the direction.
This is according to my analysis 👇
Core ≤0,2% → I’d lean to hold; BNB has room to 725–740.
Core in-line but yields don’t fall → range 700–720.
Core ≥0,3% → hike odds increase; pressure toward 704, possibly 690.
The logic: hot core → expectations of a hike rise → yield & dollar strengthen → risk-off → BTC drops first → BNB follows, often deeper.
My position is small: hold BNB ~1,5 USDT, just to gauge sentiment. Neutral-to-bearish ahead of the release.
Hike or hold? 👇
$BNB
95
Log in to explore more content
Join global crypto users on Binance Square
⚡️ Get latest and useful information about crypto.
💬 Trusted by the world’s largest crypto exchange.
👍 Discover real insights from verified creators.
Email / Phone number
Trending Topics
MetaMaskExitsLidoValidatorsAfterSecurityIncident
22,904 views
518 Discussing
🚨 METAMASK JUST STARTED EXITING ETH VALIDATORS AFTER A SECURITY INCIDENT.
MetaMask says an ongoing security incident hit part of its infrastructure, forcing it to proactively exit affected validators from its non-custodial staking operations. The company says it has found no immediate threat to MetaMask wallets so far.
The key detail?
These validators are tied to Lido staking, and the exit process may temporarily remove ETH from staking while the investigation continues. Lido-related reports say the full exit, withdrawal and re-entry cycle could take up to roughly 45 days.
That means the market should separate two things:
Wallet users are not currently being told they’re at immediate risk.
But validator infrastructure clearly was serious enough to trigger an emergency exit.
And when one of Ethereum’s biggest wallet brands starts pulling validators as a precaution, traders pay attention.
Security incidents don’t need stolen funds to become market-moving.
Sometimes the reaction itself is the signal. 👀
$ETH $LDO
#metamaskexitslidovalidatorsaftersecurityincident
KimHotbae
·0 Likes
·2.5k views
MicronBeatsEarningsLiftsGuidance
17,813 views
445 Discussing
CFTCSubmitsTwoEventContractRulesToWhiteHouse
15,014 views
401 Discussing