
#bitcoincycle
bitcoincycle
178,039 views
400 Discussing
Hot
Latest

·
--
$BTC | Mayer Multiple missed Bitcoin's real 2021 top. It read 1.97 on 13 April 2021, then price ran to a fresh high on 8 November with Mayer only at 1.50. Watch the ratio alone and you'd have called April the top.
On the desk I treat it as descriptive, not predictive. SatoshiMacro's tracker has it at 1.06 today against a A$103,536 200-day average, below the 1.20 print from the 13 August 2025 high. My read: that double-top gap matters more than the 2.4 ceiling, since single-indicator signals are weak alone. AU CFD traders still face ASIC's 2:1 cap and ordinary income tax under TR 97/11, not the 12-month CGT discount.
https://satoshimacro.com/tools/crypto/cycle-indicators/bitcoin-mayer-multiple/?utm_source=binance_square&utm_medium=social&utm_campaign=autopilot_short-1
#SatoshiMacro #MayerMultiple #BitcoinCycle #Bitcoin
$BTC | Mayer Multiple missed Bitcoin's real 2021 top. It read 1.97 on 13 April 2021, then price ran to a fresh high on 8 November with Mayer only at 1.50. Watch the ratio alone and you'd have called April the top.
On the desk I treat it as descriptive, not predictive. SatoshiMacro's tracker has it at 1.06 today against a A$103,536 200-day average, below the 1.20 print from the 13 August 2025 high. My read: that double-top gap matters more than the 2.4 ceiling, since single-indicator signals are weak alone. AU CFD traders still face ASIC's 2:1 cap and ordinary income tax under TR 97/11, not the 12-month CGT discount.
https://satoshimacro.com/tools/crypto/cycle-indicators/bitcoin-mayer-multiple/?utm_source=binance_square&utm_medium=social&utm_campaign=autopilot_short-1
#SatoshiMacro #MayerMultiple #BitcoinCycle #Bitcoin
On the desk I treat it as descriptive, not predictive. SatoshiMacro's tracker has it at 1.06 today against a A$103,536 200-day average, below the 1.20 print from the 13 August 2025 high. My read: that double-top gap matters more than the 2.4 ceiling, since single-indicator signals are weak alone. AU CFD traders still face ASIC's 2:1 cap and ordinary income tax under TR 97/11, not the 12-month CGT discount.
https://satoshimacro.com/tools/crypto/cycle-indicators/bitcoin-mayer-multiple/?utm_source=binance_square&utm_medium=social&utm_campaign=autopilot_short-1
#SatoshiMacro #MayerMultiple #BitcoinCycle #Bitcoin
100
·
--
Bitcoin's Pi Cycle Bottom Fired in September. What Happens in the Months After?$BTC | Bitcoin's Pi Cycle Bottom confirmed a signal on 1 September 2026 at A$108,493, and as of 3 November 2026 SatoshiMacro's tracker has the ratio at 1.100, inside the Bottom signal forming band of 0.96 to 1.43. The firing itself is old news by now. The question worth asking two months later is whether the real low already happened months before anyone noticed, and what the three prior firings say comes next.
## What does a 1.100 reading actually mean right now?
The indicator divides the 150-day moving average by the 471-day moving average, multiplied by 0.745. A reading above 1.00 means the 150-day line has already crossed back above the signal line, which is why SatoshiMacro classifies this as fired rather than forming. At 1.100 the ratio has climbed off its post-firing low and is working toward the 1.43 boundary of the Mid cycle band. It has not reached Mid cycle yet, which matters, because the next section is about what that gap has meant historically.
## Does the firing date tell you when the bottom actually happened?
No, and this is the part traders miss. Pi Cycle Bottom is a trailing signal built from two moving averages, so by construction it confirms a low well after the fact. The record on AUD prices backs this up directly: the 21 July 2015 firing at A$375 came roughly six months after the actual low of A$210 on 14 January 2015. The 22 May 2019 firing at A$11,017 came about five months after the A$4,401 low on 15 December 2018. The 24 March 2023 firing at A$41,145 came about four months after the A$23,595 low on 21 November 2022. On the desk we never treated a confirmation line as a timing tool; it tells you where price has been, not where it is going. If the September 2026 firing holds that same four-to-six-month lag, the actual cycle low sits somewhere in the March to May 2026 window, not in September.
## What happened in the twelve months after the last three firings?
The three completed firings returned 137 percent (from July 2015), 27 percent (from May 2019) and 148 percent (from March 2023) over the following twelve months. The September 2026 firing has no twelve-month record yet, so there's nothing to report there. My read is that the base rate looks attractive on paper but the spread between those three outcomes is the real lesson: 27 percent is not 148 percent, and a three-firing sample size gives you a pattern, not a law. Averaging the three gets you to roughly 104 percent, a number that is more useful as a sanity check against overconfidence than as a forecast.
## A worked range, not a prediction
Take a hypothetical A$10,000 allocated at the firing price. At the weakest of the three historical outcomes (27 percent), that position would sit near A$12,700 twelve months out. At the strongest (148 percent), it would sit near A$24,800. That is the honest spread SatoshiMacro's own data shows across three cycles, and it is wide enough that anyone treating the midpoint as a target is fooling themselves.
## Why I treat this as a confirmation, not a forecast
Four firings on AUD data is a thin sample. The 0.745 multiplier and the 150/471-day windows were fitted to past cycles, not derived from first principles, and both moving averages are trailing by construction, so every reading lags the real price action by months. The signal also missed entirely in the March 2020 COVID crash; it never fired at all that cycle. SatoshiMacro's own documentation is explicit that this works as one input alongside others, not as a standalone trigger, and I'd push back hard on anyone trading it in isolation.
## Where it sits inside the broader model
Pi Cycle Bottom is one of nine signals in the Valuation tier of the SatoshiMacro Model, carrying 25 percent of that tier's weight. All three of the documented historical bottoms registered inside the model's Accumulation zone, scored 15 to 30, at the time they occurred. That cross-check matters more to me than the Pi Cycle reading alone; a single indicator agreeing with itself across cycles is weaker evidence than several unrelated valuation signals landing in the same zone together.
## What this means for Australian holders specifically
If you bought spot BTC around the 1 September 2026 firing and want the ATO's 50 percent capital gains discount, you need to hold past 1 September 2027; sell a day earlier and the full gain is taxed. For anyone running this through a leveraged CFD instead of spot, ASIC's 2:1 retail leverage cap on crypto CFDs and the mandatory negative balance protection cut both the downside and the upside relative to an unleveraged position, and ATO guidance under TR 97/11 typically treats that kind of active CFD trading as ordinary income rather than a discounted capital gain. Spot exchanges named on SatoshiMacro's page, including Independent Reserve and CoinSpot, are AUSTRAC-registered, which is the custody-side check that matters more than fee comparisons at this stage of a cycle.
## What I would actually do with this reading
What I would actually do with a ratio climbing through 1.100 is treat it as permission to stop waiting for a lower print, not as a standalone buy signal. On the desk we never sized a position off one line crossing another; we wanted Pi Cycle Bottom, the Mayer Multiple sitting under 0.6, and Fear and Greed under 25 agreeing before committing real capital, and even then sized small enough that being wrong about timing wasn't the thing that broke the position. One signal is not a basket. If you're building a case right now, the question to ask isn't "has Pi Cycle Bottom fired," because it has. It's whether the other valuation inputs in SatoshiMacro's model are telling the same story, or whether this one line is doing all the work on its own.
https://satoshimacro.com/tools/crypto/cycle-indicators/bitcoin-pi-cycle-bottom-indicator/?utm_source=binance_square&utm_medium=social&utm_campaign=autopilot_article
#SatoshiMacro #PiCycleBottom #BitcoinCycle #Bitcoin
Bitcoin's Pi Cycle Bottom Fired in September. What Happens in the Months After?
$BTC | Bitcoin's Pi Cycle Bottom confirmed a signal on 1 September 2026 at A$108,493, and as of 3 November 2026 SatoshiMacro's tracker has the ratio at 1.100, inside the Bottom signal forming band of 0.96 to 1.43. The firing itself is old news by now. The question worth asking two months later is whether the real low already happened months before anyone noticed, and what the three prior firings say comes next.
## What does a 1.100 reading actually mean right now?
The indicator divides the 150-day moving average by the 471-day moving average, multiplied by 0.745. A reading above 1.00 means the 150-day line has already crossed back above the signal line, which is why SatoshiMacro classifies this as fired rather than forming. At 1.100 the ratio has climbed off its post-firing low and is working toward the 1.43 boundary of the Mid cycle band. It has not reached Mid cycle yet, which matters, because the next section is about what that gap has meant historically.
## Does the firing date tell you when the bottom actually happened?
No, and this is the part traders miss. Pi Cycle Bottom is a trailing signal built from two moving averages, so by construction it confirms a low well after the fact. The record on AUD prices backs this up directly: the 21 July 2015 firing at A$375 came roughly six months after the actual low of A$210 on 14 January 2015. The 22 May 2019 firing at A$11,017 came about five months after the A$4,401 low on 15 December 2018. The 24 March 2023 firing at A$41,145 came about four months after the A$23,595 low on 21 November 2022. On the desk we never treated a confirmation line as a timing tool; it tells you where price has been, not where it is going. If the September 2026 firing holds that same four-to-six-month lag, the actual cycle low sits somewhere in the March to May 2026 window, not in September.
## What happened in the twelve months after the last three firings?
The three completed firings returned 137 percent (from July 2015), 27 percent (from May 2019) and 148 percent (from March 2023) over the following twelve months. The September 2026 firing has no twelve-month record yet, so there's nothing to report there. My read is that the base rate looks attractive on paper but the spread between those three outcomes is the real lesson: 27 percent is not 148 percent, and a three-firing sample size gives you a pattern, not a law. Averaging the three gets you to roughly 104 percent, a number that is more useful as a sanity check against overconfidence than as a forecast.
## A worked range, not a prediction
Take a hypothetical A$10,000 allocated at the firing price. At the weakest of the three historical outcomes (27 percent), that position would sit near A$12,700 twelve months out. At the strongest (148 percent), it would sit near A$24,800. That is the honest spread SatoshiMacro's own data shows across three cycles, and it is wide enough that anyone treating the midpoint as a target is fooling themselves.
## Why I treat this as a confirmation, not a forecast
Four firings on AUD data is a thin sample. The 0.745 multiplier and the 150/471-day windows were fitted to past cycles, not derived from first principles, and both moving averages are trailing by construction, so every reading lags the real price action by months. The signal also missed entirely in the March 2020 COVID crash; it never fired at all that cycle. SatoshiMacro's own documentation is explicit that this works as one input alongside others, not as a standalone trigger, and I'd push back hard on anyone trading it in isolation.
## Where it sits inside the broader model
Pi Cycle Bottom is one of nine signals in the Valuation tier of the SatoshiMacro Model, carrying 25 percent of that tier's weight. All three of the documented historical bottoms registered inside the model's Accumulation zone, scored 15 to 30, at the time they occurred. That cross-check matters more to me than the Pi Cycle reading alone; a single indicator agreeing with itself across cycles is weaker evidence than several unrelated valuation signals landing in the same zone together.
## What this means for Australian holders specifically
If you bought spot BTC around the 1 September 2026 firing and want the ATO's 50 percent capital gains discount, you need to hold past 1 September 2027; sell a day earlier and the full gain is taxed. For anyone running this through a leveraged CFD instead of spot, ASIC's 2:1 retail leverage cap on crypto CFDs and the mandatory negative balance protection cut both the downside and the upside relative to an unleveraged position, and ATO guidance under TR 97/11 typically treats that kind of active CFD trading as ordinary income rather than a discounted capital gain. Spot exchanges named on SatoshiMacro's page, including Independent Reserve and CoinSpot, are AUSTRAC-registered, which is the custody-side check that matters more than fee comparisons at this stage of a cycle.
## What I would actually do with this reading
What I would actually do with a ratio climbing through 1.100 is treat it as permission to stop waiting for a lower print, not as a standalone buy signal. On the desk we never sized a position off one line crossing another; we wanted Pi Cycle Bottom, the Mayer Multiple sitting under 0.6, and Fear and Greed under 25 agreeing before committing real capital, and even then sized small enough that being wrong about timing wasn't the thing that broke the position. One signal is not a basket. If you're building a case right now, the question to ask isn't "has Pi Cycle Bottom fired," because it has. It's whether the other valuation inputs in SatoshiMacro's model are telling the same story, or whether this one line is doing all the work on its own.
https://satoshimacro.com/tools/crypto/cycle-indicators/bitcoin-pi-cycle-bottom-indicator/?utm_source=binance_square&utm_medium=social&utm_campaign=autopilot_article
#SatoshiMacro #PiCycleBottom #BitcoinCycle #Bitcoin
## What does a 1.100 reading actually mean right now?
The indicator divides the 150-day moving average by the 471-day moving average, multiplied by 0.745. A reading above 1.00 means the 150-day line has already crossed back above the signal line, which is why SatoshiMacro classifies this as fired rather than forming. At 1.100 the ratio has climbed off its post-firing low and is working toward the 1.43 boundary of the Mid cycle band. It has not reached Mid cycle yet, which matters, because the next section is about what that gap has meant historically.
## Does the firing date tell you when the bottom actually happened?
No, and this is the part traders miss. Pi Cycle Bottom is a trailing signal built from two moving averages, so by construction it confirms a low well after the fact. The record on AUD prices backs this up directly: the 21 July 2015 firing at A$375 came roughly six months after the actual low of A$210 on 14 January 2015. The 22 May 2019 firing at A$11,017 came about five months after the A$4,401 low on 15 December 2018. The 24 March 2023 firing at A$41,145 came about four months after the A$23,595 low on 21 November 2022. On the desk we never treated a confirmation line as a timing tool; it tells you where price has been, not where it is going. If the September 2026 firing holds that same four-to-six-month lag, the actual cycle low sits somewhere in the March to May 2026 window, not in September.
## What happened in the twelve months after the last three firings?
The three completed firings returned 137 percent (from July 2015), 27 percent (from May 2019) and 148 percent (from March 2023) over the following twelve months. The September 2026 firing has no twelve-month record yet, so there's nothing to report there. My read is that the base rate looks attractive on paper but the spread between those three outcomes is the real lesson: 27 percent is not 148 percent, and a three-firing sample size gives you a pattern, not a law. Averaging the three gets you to roughly 104 percent, a number that is more useful as a sanity check against overconfidence than as a forecast.
## A worked range, not a prediction
Take a hypothetical A$10,000 allocated at the firing price. At the weakest of the three historical outcomes (27 percent), that position would sit near A$12,700 twelve months out. At the strongest (148 percent), it would sit near A$24,800. That is the honest spread SatoshiMacro's own data shows across three cycles, and it is wide enough that anyone treating the midpoint as a target is fooling themselves.
## Why I treat this as a confirmation, not a forecast
Four firings on AUD data is a thin sample. The 0.745 multiplier and the 150/471-day windows were fitted to past cycles, not derived from first principles, and both moving averages are trailing by construction, so every reading lags the real price action by months. The signal also missed entirely in the March 2020 COVID crash; it never fired at all that cycle. SatoshiMacro's own documentation is explicit that this works as one input alongside others, not as a standalone trigger, and I'd push back hard on anyone trading it in isolation.
## Where it sits inside the broader model
Pi Cycle Bottom is one of nine signals in the Valuation tier of the SatoshiMacro Model, carrying 25 percent of that tier's weight. All three of the documented historical bottoms registered inside the model's Accumulation zone, scored 15 to 30, at the time they occurred. That cross-check matters more to me than the Pi Cycle reading alone; a single indicator agreeing with itself across cycles is weaker evidence than several unrelated valuation signals landing in the same zone together.
## What this means for Australian holders specifically
If you bought spot BTC around the 1 September 2026 firing and want the ATO's 50 percent capital gains discount, you need to hold past 1 September 2027; sell a day earlier and the full gain is taxed. For anyone running this through a leveraged CFD instead of spot, ASIC's 2:1 retail leverage cap on crypto CFDs and the mandatory negative balance protection cut both the downside and the upside relative to an unleveraged position, and ATO guidance under TR 97/11 typically treats that kind of active CFD trading as ordinary income rather than a discounted capital gain. Spot exchanges named on SatoshiMacro's page, including Independent Reserve and CoinSpot, are AUSTRAC-registered, which is the custody-side check that matters more than fee comparisons at this stage of a cycle.
## What I would actually do with this reading
What I would actually do with a ratio climbing through 1.100 is treat it as permission to stop waiting for a lower print, not as a standalone buy signal. On the desk we never sized a position off one line crossing another; we wanted Pi Cycle Bottom, the Mayer Multiple sitting under 0.6, and Fear and Greed under 25 agreeing before committing real capital, and even then sized small enough that being wrong about timing wasn't the thing that broke the position. One signal is not a basket. If you're building a case right now, the question to ask isn't "has Pi Cycle Bottom fired," because it has. It's whether the other valuation inputs in SatoshiMacro's model are telling the same story, or whether this one line is doing all the work on its own.
https://satoshimacro.com/tools/crypto/cycle-indicators/bitcoin-pi-cycle-bottom-indicator/?utm_source=binance_square&utm_medium=social&utm_campaign=autopilot_article
#SatoshiMacro #PiCycleBottom #BitcoinCycle #Bitcoin
127
·
--
$BTC | The MVRV Z-Score proxy I track for SatoshiMacro, built on AUD BTC closes, sits at 0.18 today, just above the 0.08 cutoff for the cycle-bottom zone. It already touched that zone once in 2026, only the sixth year that has happened since the proxy's 2016 start. On the desk, a second approach to a floor reads differently to the first. History shows the cycle-top zone has held for 183 days total versus 362 in the cycle-bottom zone. Bottoms take longer. My read is that slower rhythm matters more than today's single print. It is a position classifier, not a forecaster, and this signal carries 25 percent of Tier 1 in the SatoshiMacro Model, never the whole call. Not trading advice.
https://satoshimacro.com/tools/crypto/cycle-indicators/bitcoin-market-value-z-score/?utm_source=binance_square&utm_medium=social&utm_campaign=autopilot_short-1
#SatoshiMacro #MVRV #BitcoinCycle #Bitcoin
$BTC | The MVRV Z-Score proxy I track for SatoshiMacro, built on AUD BTC closes, sits at 0.18 today, just above the 0.08 cutoff for the cycle-bottom zone. It already touched that zone once in 2026, only the sixth year that has happened since the proxy's 2016 start. On the desk, a second approach to a floor reads differently to the first. History shows the cycle-top zone has held for 183 days total versus 362 in the cycle-bottom zone. Bottoms take longer. My read is that slower rhythm matters more than today's single print. It is a position classifier, not a forecaster, and this signal carries 25 percent of Tier 1 in the SatoshiMacro Model, never the whole call. Not trading advice.
https://satoshimacro.com/tools/crypto/cycle-indicators/bitcoin-market-value-z-score/?utm_source=binance_square&utm_medium=social&utm_campaign=autopilot_short-1
#SatoshiMacro #MVRV #BitcoinCycle #Bitcoin
https://satoshimacro.com/tools/crypto/cycle-indicators/bitcoin-market-value-z-score/?utm_source=binance_square&utm_medium=social&utm_campaign=autopilot_short-1
#SatoshiMacro #MVRV #BitcoinCycle #Bitcoin
89
·
--
$BTC | SatoshiMacro's Risk Metric reads 0.35, 35.3 out of 100, for November 2026, in the below fair value band. On the desk I treat a one-factor model as context, not a trigger. The three documented cycle bottoms sit at 0.32 in 2015, 0.34 in 2018 and 0.30 in 2022, so today's print sits only a few points above the lowest readings on record. Close, but not there yet. The model is a log regression against time since the 2013 genesis block. It ignores liquidity, regulation and ETF flow, and it has never pinned an exact bottom date. My read favours slow accumulation over a single entry call, and for Australian holders the ATO's twelve month CGT discount matters more than nailing the low.
https://satoshimacro.com/tools/crypto/cycle-indicators/bitcoin-risk-metric/?utm_source=binance_square&utm_medium=social&utm_campaign=autopilot_short-1
#SatoshiMacro #RiskMetric #BitcoinCycle #Bitcoin
$BTC | SatoshiMacro's Risk Metric reads 0.35, 35.3 out of 100, for November 2026, in the below fair value band. On the desk I treat a one-factor model as context, not a trigger. The three documented cycle bottoms sit at 0.32 in 2015, 0.34 in 2018 and 0.30 in 2022, so today's print sits only a few points above the lowest readings on record. Close, but not there yet. The model is a log regression against time since the 2013 genesis block. It ignores liquidity, regulation and ETF flow, and it has never pinned an exact bottom date. My read favours slow accumulation over a single entry call, and for Australian holders the ATO's twelve month CGT discount matters more than nailing the low.
https://satoshimacro.com/tools/crypto/cycle-indicators/bitcoin-risk-metric/?utm_source=binance_square&utm_medium=social&utm_campaign=autopilot_short-1
#SatoshiMacro #RiskMetric #BitcoinCycle #Bitcoin
https://satoshimacro.com/tools/crypto/cycle-indicators/bitcoin-risk-metric/?utm_source=binance_square&utm_medium=social&utm_campaign=autopilot_short-1
#SatoshiMacro #RiskMetric #BitcoinCycle #Bitcoin
87
·
--
$BTC | On the desk a sigma reading shows distance from trend, not direction. SatoshiMacro's Bitcoin Power Law model has BTC 0.87 sigma below AUD fair value today, a 40 percent discount to the A$184,369 line tracked since January 2013. Peak excess keeps shrinking: 3.37 sigma in 2013, 2.32 in 2017, 1.97 in 2021, only 0.75 in January 2025. My read is that this is fading convexity, not a broken model, since the fit is statistical, not causal. It has never closed a month below negative 2 sigma, though a first time stays possible. One day before the 31 October lodgement deadline, weigh any 2026 gains against the ATO's 12-month CGT discount now.
https://satoshimacro.com/tools/crypto/cycle-indicators/bitcoin-power-law/?utm_source=binance_square&utm_medium=social&utm_campaign=autopilot_short-1
#SatoshiMacro #BitcoinPowerLaw #BitcoinCycle #Bitcoin
$BTC | On the desk a sigma reading shows distance from trend, not direction. SatoshiMacro's Bitcoin Power Law model has BTC 0.87 sigma below AUD fair value today, a 40 percent discount to the A$184,369 line tracked since January 2013. Peak excess keeps shrinking: 3.37 sigma in 2013, 2.32 in 2017, 1.97 in 2021, only 0.75 in January 2025. My read is that this is fading convexity, not a broken model, since the fit is statistical, not causal. It has never closed a month below negative 2 sigma, though a first time stays possible. One day before the 31 October lodgement deadline, weigh any 2026 gains against the ATO's 12-month CGT discount now.
https://satoshimacro.com/tools/crypto/cycle-indicators/bitcoin-power-law/?utm_source=binance_square&utm_medium=social&utm_campaign=autopilot_short-1
#SatoshiMacro #BitcoinPowerLaw #BitcoinCycle #Bitcoin
https://satoshimacro.com/tools/crypto/cycle-indicators/bitcoin-power-law/?utm_source=binance_square&utm_medium=social&utm_campaign=autopilot_short-1
#SatoshiMacro #BitcoinPowerLaw #BitcoinCycle #Bitcoin
85
·
--
$BTC | Pi Cycle Top sits at 0.48 today. SatoshiMacro's tracker has the fast 111-day average at A$105,405 against the slow line at A$220,024, inside the far-from-signal zone below 0.7. On the desk, we watch the zone. Even the May 2024 cycle high only reached 0.737, short of the 0.95 approaching band. My read: the indicator earns its place by staying quiet, not forecasting a top. It is one Tier 1 input in a 48-signal composite, never a standalone sell trigger, and it missed November 2021 outright. A re-arm needs the fast line back under 92 percent of the slow line. With lodgement day near, the ATO's 12-month CGT discount clock still matters more than this ratio.
https://satoshimacro.com/tools/crypto/cycle-indicators/bitcoin-pi-cycle-top-indicator/?utm_source=binance_square&utm_medium=social&utm_campaign=autopilot_short-1
#SatoshiMacro #PiCycleTop #BitcoinCycle #Bitcoin
$BTC | Pi Cycle Top sits at 0.48 today. SatoshiMacro's tracker has the fast 111-day average at A$105,405 against the slow line at A$220,024, inside the far-from-signal zone below 0.7. On the desk, we watch the zone. Even the May 2024 cycle high only reached 0.737, short of the 0.95 approaching band. My read: the indicator earns its place by staying quiet, not forecasting a top. It is one Tier 1 input in a 48-signal composite, never a standalone sell trigger, and it missed November 2021 outright. A re-arm needs the fast line back under 92 percent of the slow line. With lodgement day near, the ATO's 12-month CGT discount clock still matters more than this ratio.
https://satoshimacro.com/tools/crypto/cycle-indicators/bitcoin-pi-cycle-top-indicator/?utm_source=binance_square&utm_medium=social&utm_campaign=autopilot_short-1
#SatoshiMacro #PiCycleTop #BitcoinCycle #Bitcoin
https://satoshimacro.com/tools/crypto/cycle-indicators/bitcoin-pi-cycle-top-indicator/?utm_source=binance_square&utm_medium=social&utm_campaign=autopilot_short-1
#SatoshiMacro #PiCycleTop #BitcoinCycle #Bitcoin
73
·
--
$BTC | JPMorgan says Bitcoin will be the best performing asset over the next decade. Square is lit up with it. On the desk, a decade-long call never told us anything about tomorrow's position size. Right now the SatoshiMacro Model, 48 signals across six tiers, reads 40.8, flat Neutral. Compare that to 91.4 at the 2021-11 top. A bullish decade thesis and a mid-cycle reading answer different questions. My read: size, do not chase. Honest caveat: that 7-of-7 zone accuracy is calibrated in-sample, only 4-of-7 raw. On an ASIC account the 2:1 crypto CFD cap already limits how hard a decade call can hurt you short term.
https://satoshimacro.com/tools/crypto/satoshimacro-model/?utm_source=binance_square&utm_medium=social&utm_campaign=autopilot_short-2
#SatoshiMacro #JPMorganPredictsBitcoinBestPerformingAssetOverNextDecade #BitcoinCycle #Bitcoin
$BTC | JPMorgan says Bitcoin will be the best performing asset over the next decade. Square is lit up with it. On the desk, a decade-long call never told us anything about tomorrow's position size. Right now the SatoshiMacro Model, 48 signals across six tiers, reads 40.8, flat Neutral. Compare that to 91.4 at the 2021-11 top. A bullish decade thesis and a mid-cycle reading answer different questions. My read: size, do not chase. Honest caveat: that 7-of-7 zone accuracy is calibrated in-sample, only 4-of-7 raw. On an ASIC account the 2:1 crypto CFD cap already limits how hard a decade call can hurt you short term.
https://satoshimacro.com/tools/crypto/satoshimacro-model/?utm_source=binance_square&utm_medium=social&utm_campaign=autopilot_short-2
#SatoshiMacro #JPMorganPredictsBitcoinBestPerformingAssetOverNextDecade #BitcoinCycle #Bitcoin
https://satoshimacro.com/tools/crypto/satoshimacro-model/?utm_source=binance_square&utm_medium=social&utm_campaign=autopilot_short-2
#SatoshiMacro #JPMorganPredictsBitcoinBestPerformingAssetOverNextDecade #BitcoinCycle #Bitcoin
260

·
--
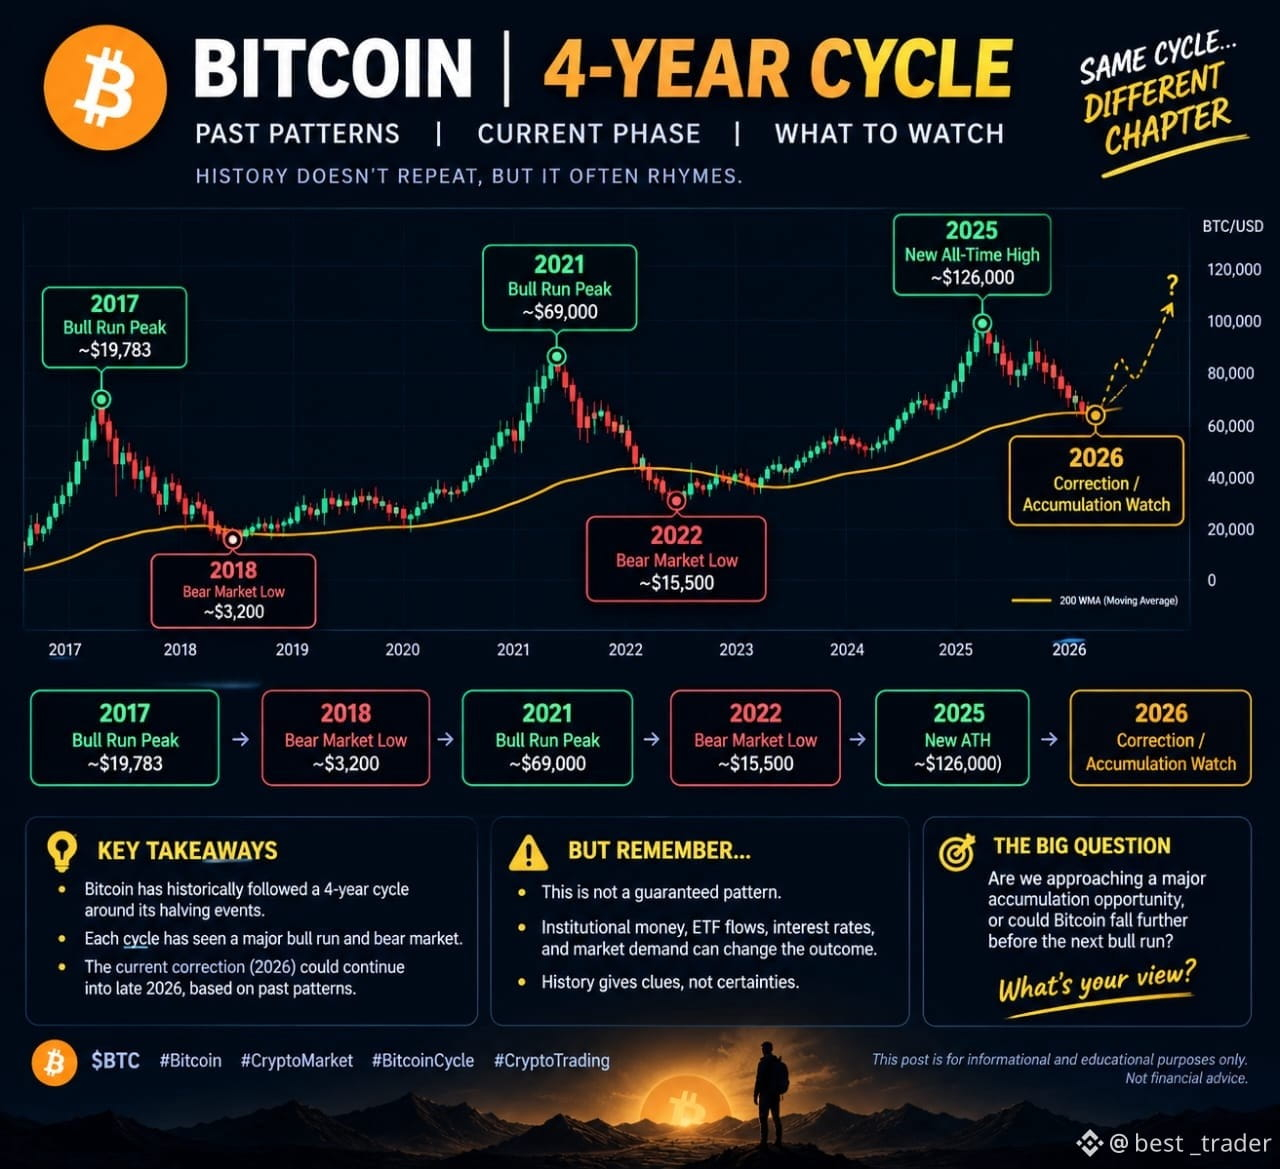
🚨 BITCOIN'S 4-YEAR CYCLE IS BACK IN FOCUS… ARE YOU READY? 👀
Most people are waiting for $BTC to recover.
But I'm watching something different: Bitcoin's 4-year cycle.
Look at the historical pattern:
🔹 2017 — Bull market peak
🔹 2018 — Bear market
🔹 2021 — Bull market peak
🔹 2022 — Bear market
🔹 2025 — New all-time high
🔹 2026 — A major correction
See the pattern? 👀
Bitcoin has historically experienced major bull and bear phases around its halving cycles. Some traders believe the current correction could continue into late 2026.
But here's the catch: history can offer clues, not guarantees.
Institutional money, ETF flows, interest rates, and market demand can all change the outcome.
I'm not blindly buying every dip or selling out of fear. I'm watching how the market reacts and waiting for confirmation.
The real question is: Are we approaching a major accumulation opportunity, or could Bitcoin fall further before the next bull run?
👇 What's your view?
A) Accumulation phase
B) More downside ahead
C) The 4-year cycle is becoming less reliable
$BTC #Bitcoin #CryptoMarket #BitcoinCycle #cryptotrading
🚨 BITCOIN'S 4-YEAR CYCLE IS BACK IN FOCUS… ARE YOU READY? 👀
Most people are waiting for $BTC to recover.
But I'm watching something different: Bitcoin's 4-year cycle.
Look at the historical pattern:
🔹 2017 — Bull market peak
🔹 2018 — Bear market
🔹 2021 — Bull market peak
🔹 2022 — Bear market
🔹 2025 — New all-time high
🔹 2026 — A major correction
See the pattern? 👀
Bitcoin has historically experienced major bull and bear phases around its halving cycles. Some traders believe the current correction could continue into late 2026.
But here's the catch: history can offer clues, not guarantees.
Institutional money, ETF flows, interest rates, and market demand can all change the outcome.
I'm not blindly buying every dip or selling out of fear. I'm watching how the market reacts and waiting for confirmation.
The real question is: Are we approaching a major accumulation opportunity, or could Bitcoin fall further before the next bull run?
👇 What's your view?
A) Accumulation phase
B) More downside ahead
C) The 4-year cycle is becoming less reliable
$BTC #Bitcoin #CryptoMarket #BitcoinCycle #cryptotrading
Most people are waiting for $BTC to recover.
But I'm watching something different: Bitcoin's 4-year cycle.
Look at the historical pattern:
🔹 2017 — Bull market peak
🔹 2018 — Bear market
🔹 2021 — Bull market peak
🔹 2022 — Bear market
🔹 2025 — New all-time high
🔹 2026 — A major correction
See the pattern? 👀
Bitcoin has historically experienced major bull and bear phases around its halving cycles. Some traders believe the current correction could continue into late 2026.
But here's the catch: history can offer clues, not guarantees.
Institutional money, ETF flows, interest rates, and market demand can all change the outcome.
I'm not blindly buying every dip or selling out of fear. I'm watching how the market reacts and waiting for confirmation.
The real question is: Are we approaching a major accumulation opportunity, or could Bitcoin fall further before the next bull run?
👇 What's your view?
A) Accumulation phase
B) More downside ahead
C) The 4-year cycle is becoming less reliable
$BTC #Bitcoin #CryptoMarket #BitcoinCycle #cryptotrading
84

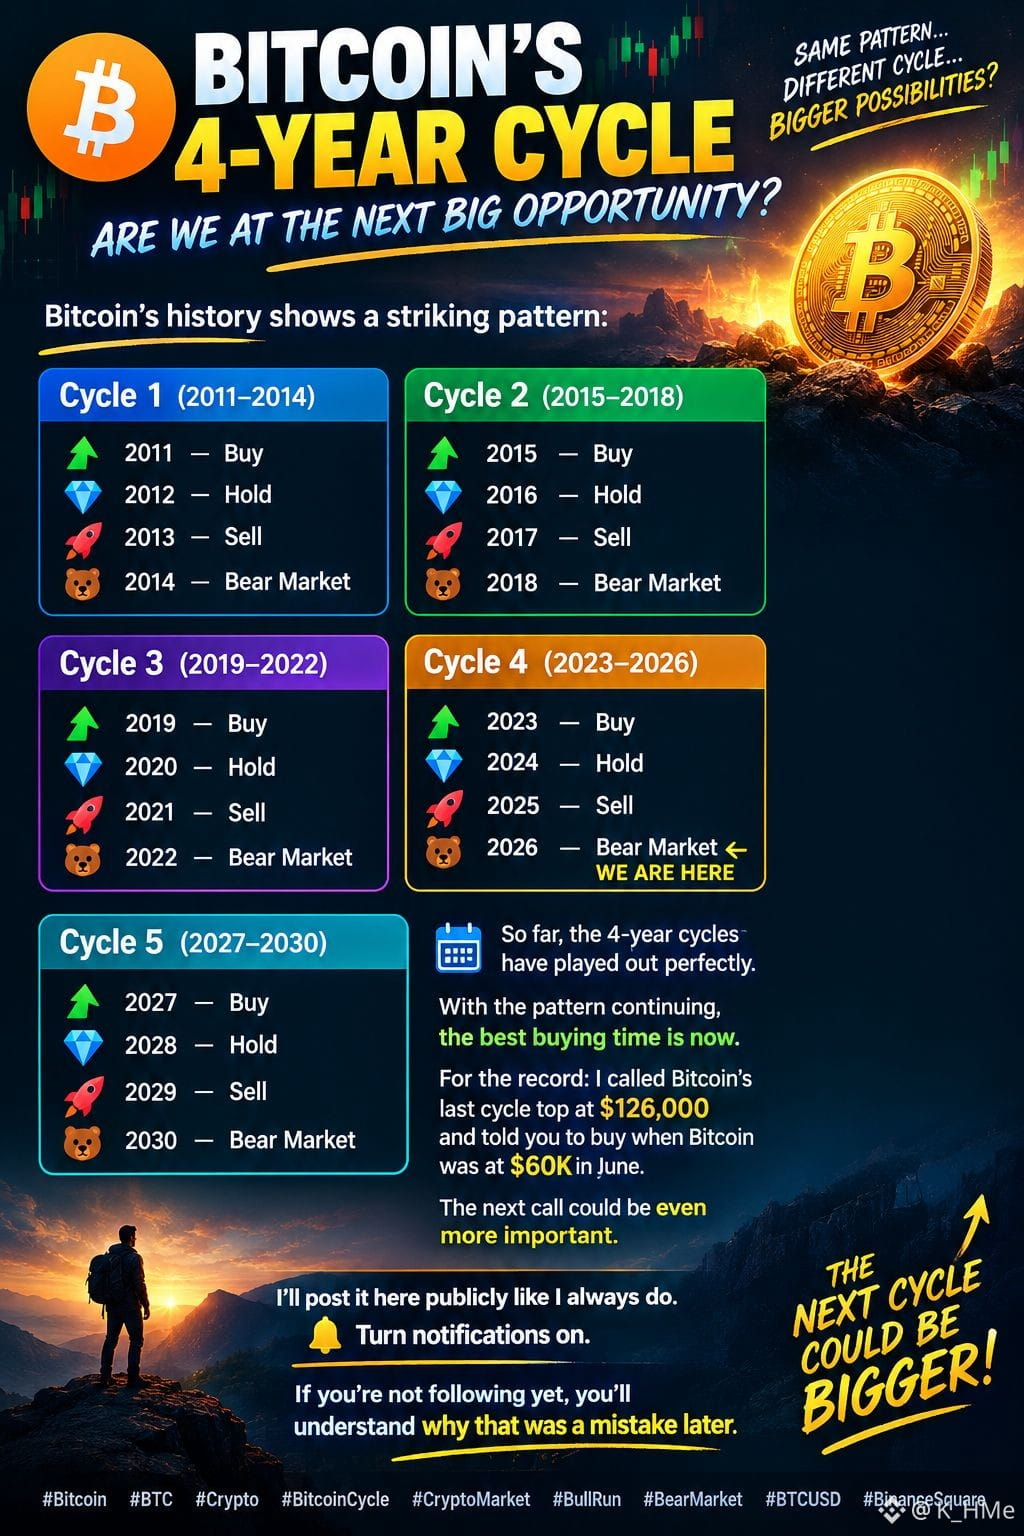
🔥 BITCOIN’S 4-YEAR CYCLE: ARE WE AT THE NEXT BIG OPPORTUNITY?
#Bitcoin ’s history shows a striking pattern:
📈 2011 — Buy
💎 2012 — Hold
🚀 2013 — Sell
🐻 2014 — Bear Market
📈 2015 — Buy
💎 2016 — Hold
🚀 2017 — Sell
🐻 2018 — Bear Market
📈 2019 — Buy
💎 2020 — Hold
🚀 2021 — Sell
🐻 2022 — Bear Market
And now…
📈 2023 — Buy
💎 2024 — Hold
🚀 2025 — Sell
🐻 2026 — Bear Market?
If this cycle repeats, 2026 could be the accumulation zone before the next major Bitcoin cycle begins.
Then the potential roadmap:
🔥 2027 — Buy
💎 2028 — Hold
🚀 2029 — Sell
🐻 2030 — Bear Market
History doesn’t guarantee the future—but the pattern is impossible to ignore.
👀 The real question: Are we looking at the next opportunity before the crowd realizes it?
#Bitcoin #BTC #Crypto #BitcoinCycle #CryptoMarket #BullRun #BearMarket #BTCUSD #BinanceSquare
{spot}(BTCUSDT)
🔥 BITCOIN’S 4-YEAR CYCLE: ARE WE AT THE NEXT BIG OPPORTUNITY?
#Bitcoin ’s history shows a striking pattern:
📈 2011 — Buy
💎 2012 — Hold
🚀 2013 — Sell
🐻 2014 — Bear Market
📈 2015 — Buy
💎 2016 — Hold
🚀 2017 — Sell
🐻 2018 — Bear Market
📈 2019 — Buy
💎 2020 — Hold
🚀 2021 — Sell
🐻 2022 — Bear Market
And now…
📈 2023 — Buy
💎 2024 — Hold
🚀 2025 — Sell
🐻 2026 — Bear Market?
If this cycle repeats, 2026 could be the accumulation zone before the next major Bitcoin cycle begins.
Then the potential roadmap:
🔥 2027 — Buy
💎 2028 — Hold
🚀 2029 — Sell
🐻 2030 — Bear Market
History doesn’t guarantee the future—but the pattern is impossible to ignore.
👀 The real question: Are we looking at the next opportunity before the crowd realizes it?
#Bitcoin #BTC #Crypto #BitcoinCycle #CryptoMarket #BullRun #BearMarket #BTCUSD #BinanceSquare
#Bitcoin ’s history shows a striking pattern:
📈 2011 — Buy
💎 2012 — Hold
🚀 2013 — Sell
🐻 2014 — Bear Market
📈 2015 — Buy
💎 2016 — Hold
🚀 2017 — Sell
🐻 2018 — Bear Market
📈 2019 — Buy
💎 2020 — Hold
🚀 2021 — Sell
🐻 2022 — Bear Market
And now…
📈 2023 — Buy
💎 2024 — Hold
🚀 2025 — Sell
🐻 2026 — Bear Market?
If this cycle repeats, 2026 could be the accumulation zone before the next major Bitcoin cycle begins.
Then the potential roadmap:
🔥 2027 — Buy
💎 2028 — Hold
🚀 2029 — Sell
🐻 2030 — Bear Market
History doesn’t guarantee the future—but the pattern is impossible to ignore.
👀 The real question: Are we looking at the next opportunity before the crowd realizes it?
#Bitcoin #BTC #Crypto #BitcoinCycle #CryptoMarket #BullRun #BearMarket #BTCUSD #BinanceSquare
50
·
--
$BTC | Bitcoin sits 18.3 percent above its AUD 200-week moving average, and crypto Twitter is calling the bounce a fresh top signal. On the desk we check rate of change before reacting to a headline. SatoshiMacro's 200-week MA heatmap reads the 4-week ROC of that average, not price, and today it is 1.91 percent, the blue "early recovery" band, nowhere near the red cycle-top zone above 10.71 percent (the fastest 5 percent of readings since 2016). The 2017 peak hit 28.6 percent on this measure. My read: it rules out blow-off tops better than it calls them, and it is not a standalone signal. It sits in the SatoshiMacro Model's Valuation tier at 25 percent weight.
https://satoshimacro.com/tools/crypto/cycle-indicators/bitcoin-200-week-ma-heatmap/?utm_source=binance_square&utm_medium=social&utm_campaign=autopilot_short-1
#SatoshiMacro #WMAHeatmap #BitcoinCycle #Bitcoin
$BTC | Bitcoin sits 18.3 percent above its AUD 200-week moving average, and crypto Twitter is calling the bounce a fresh top signal. On the desk we check rate of change before reacting to a headline. SatoshiMacro's 200-week MA heatmap reads the 4-week ROC of that average, not price, and today it is 1.91 percent, the blue "early recovery" band, nowhere near the red cycle-top zone above 10.71 percent (the fastest 5 percent of readings since 2016). The 2017 peak hit 28.6 percent on this measure. My read: it rules out blow-off tops better than it calls them, and it is not a standalone signal. It sits in the SatoshiMacro Model's Valuation tier at 25 percent weight.
https://satoshimacro.com/tools/crypto/cycle-indicators/bitcoin-200-week-ma-heatmap/?utm_source=binance_square&utm_medium=social&utm_campaign=autopilot_short-1
#SatoshiMacro #WMAHeatmap #BitcoinCycle #Bitcoin
https://satoshimacro.com/tools/crypto/cycle-indicators/bitcoin-200-week-ma-heatmap/?utm_source=binance_square&utm_medium=social&utm_campaign=autopilot_short-1
#SatoshiMacro #WMAHeatmap #BitcoinCycle #Bitcoin
101

·
--
**BITCOIN’S 4-YEAR CYCLE ISN’T OVER YET. 👀📉**
Most traders may be focusing on the wrong signal.
Bitcoin’s recent recovery could be a relief rally rather than the start of another massive move higher. If the historical 4-year cycle continues to play out, the market may still have a major correction ahead.
Here’s the potential scenario to watch:
📍 **$82K → $40K → Market Bottom → $160K → $45K**
First, a possible downside move. Then, a potential cycle bottom. After that, a strong recovery could surprise the bears — before another major correction changes the market outlook.
But remember: **historical patterns don’t guarantee future price movements.** These levels are a scenario, not a certainty.
The real question is: Are we witnessing the beginning of a new bullish leg, or just a temporary bounce before another major move down?
📌 Save this post and revisit these levels as the market develops.
🔔 Follow for more Bitcoin market analysis, key price levels, and cycle updates.
**What’s your prediction for BTC — $40K first or $100K+?** 👇
$BTC #Bitcoin #Crypto #BTCAnalysis #BitcoinCycle
**BITCOIN’S 4-YEAR CYCLE ISN’T OVER YET. 👀📉**
Most traders may be focusing on the wrong signal.
Bitcoin’s recent recovery could be a relief rally rather than the start of another massive move higher. If the historical 4-year cycle continues to play out, the market may still have a major correction ahead.
Here’s the potential scenario to watch:
📍 **$82K → $40K → Market Bottom → $160K → $45K**
First, a possible downside move. Then, a potential cycle bottom. After that, a strong recovery could surprise the bears — before another major correction changes the market outlook.
But remember: **historical patterns don’t guarantee future price movements.** These levels are a scenario, not a certainty.
The real question is: Are we witnessing the beginning of a new bullish leg, or just a temporary bounce before another major move down?
📌 Save this post and revisit these levels as the market develops.
🔔 Follow for more Bitcoin market analysis, key price levels, and cycle updates.
**What’s your prediction for BTC — $40K first or $100K+?** 👇
$BTC #Bitcoin #Crypto #BTCAnalysis #BitcoinCycle
Most traders may be focusing on the wrong signal.
Bitcoin’s recent recovery could be a relief rally rather than the start of another massive move higher. If the historical 4-year cycle continues to play out, the market may still have a major correction ahead.
Here’s the potential scenario to watch:
📍 **$82K → $40K → Market Bottom → $160K → $45K**
First, a possible downside move. Then, a potential cycle bottom. After that, a strong recovery could surprise the bears — before another major correction changes the market outlook.
But remember: **historical patterns don’t guarantee future price movements.** These levels are a scenario, not a certainty.
The real question is: Are we witnessing the beginning of a new bullish leg, or just a temporary bounce before another major move down?
📌 Save this post and revisit these levels as the market develops.
🔔 Follow for more Bitcoin market analysis, key price levels, and cycle updates.
**What’s your prediction for BTC — $40K first or $100K+?** 👇
$BTC #Bitcoin #Crypto #BTCAnalysis #BitcoinCycle
281
·
--
$BTC | Rainbow Chart data today has Bitcoin at minus 0.74 sigma on SatoshiMacro's log regression, sitting in the Still Cheap band. Fair value this month: A$184,616. Actual close: A$118,680. That is a 36 percent gap. On the desk we never sized a position off one chart alone, but this one earns its 25 percent weight in the SatoshiMacro Model's Tier 1 valuation tier honestly. Every cycle top since 2013 has peaked in a progressively lower band than the last. My read: the 5.41 slope still holds, yet the model classifies zones, it does not call the exact peak day. AUD holders weighing an exit should run the 12 month CGT discount clock first.
https://satoshimacro.com/tools/crypto/cycle-indicators/bitcoin-rainbow-chart/?utm_source=binance_square&utm_medium=social&utm_campaign=autopilot_short-1
#SatoshiMacro #BitcoinCycle #RainbowChart #Bitcoin
$BTC | Rainbow Chart data today has Bitcoin at minus 0.74 sigma on SatoshiMacro's log regression, sitting in the Still Cheap band. Fair value this month: A$184,616. Actual close: A$118,680. That is a 36 percent gap. On the desk we never sized a position off one chart alone, but this one earns its 25 percent weight in the SatoshiMacro Model's Tier 1 valuation tier honestly. Every cycle top since 2013 has peaked in a progressively lower band than the last. My read: the 5.41 slope still holds, yet the model classifies zones, it does not call the exact peak day. AUD holders weighing an exit should run the 12 month CGT discount clock first.
https://satoshimacro.com/tools/crypto/cycle-indicators/bitcoin-rainbow-chart/?utm_source=binance_square&utm_medium=social&utm_campaign=autopilot_short-1
#SatoshiMacro #BitcoinCycle #RainbowChart #Bitcoin
https://satoshimacro.com/tools/crypto/cycle-indicators/bitcoin-rainbow-chart/?utm_source=binance_square&utm_medium=social&utm_campaign=autopilot_short-1
#SatoshiMacro #BitcoinCycle #RainbowChart #Bitcoin
86
·
--
$BTC | On the desk we always treated power law regressions as a weather forecast, not a trading signal. Right now SatoshiMacro's Bitcoin Power Law model puts BTC at -0.75 sigma below its AUD fair value line, price A$118,350 against a regression fair value of A$184,607, a 36 percent discount. The slope on this AUD dataset since January 2013 is 5.41. Only the 2013 and 2017 cycle tops ever pushed through +2 sigma. Bands are statistical, not causal. My read: a confirmation tool, not an entry trigger. Short refits on this model swing wildly, so the full 166 month history matters more than one reading. Hold past 12 months and the ATO's 50 percent CGT discount still applies either way.
https://satoshimacro.com/tools/crypto/cycle-indicators/bitcoin-power-law/?utm_source=binance_square&utm_medium=social&utm_campaign=autopilot_short-1
#SatoshiMacro #PowerLaw #BitcoinCycle #Bitcoin
$BTC | On the desk we always treated power law regressions as a weather forecast, not a trading signal. Right now SatoshiMacro's Bitcoin Power Law model puts BTC at -0.75 sigma below its AUD fair value line, price A$118,350 against a regression fair value of A$184,607, a 36 percent discount. The slope on this AUD dataset since January 2013 is 5.41. Only the 2013 and 2017 cycle tops ever pushed through +2 sigma. Bands are statistical, not causal. My read: a confirmation tool, not an entry trigger. Short refits on this model swing wildly, so the full 166 month history matters more than one reading. Hold past 12 months and the ATO's 50 percent CGT discount still applies either way.
https://satoshimacro.com/tools/crypto/cycle-indicators/bitcoin-power-law/?utm_source=binance_square&utm_medium=social&utm_campaign=autopilot_short-1
#SatoshiMacro #PowerLaw #BitcoinCycle #Bitcoin
https://satoshimacro.com/tools/crypto/cycle-indicators/bitcoin-power-law/?utm_source=binance_square&utm_medium=social&utm_campaign=autopilot_short-1
#SatoshiMacro #PowerLaw #BitcoinCycle #Bitcoin
98
·
--
$BTC | Fed minutes this week zero in on an October pause. Crypto Twitter is calling it bullish for Bitcoin already. On the desk, we never isolate a rate call. SatoshiMacro's Model folds the 2s10s yield curve and the dollar index into its Macro tier. That tier is just 5 percent of the 48-signal composite. SMM reads 38.2 right now. Neutral zone, as of this morning AEST. A pause gets priced into yield-curve steepening first. Spot follows later. My read: one headline will not move a 48-signal model much. It's a position classifier, not a forecaster. Five percent of the score will not flip Neutral into anything else.
https://satoshimacro.com/tools/crypto/satoshimacro-model/?utm_source=binance_square&utm_medium=social&utm_campaign=autopilot_short-1
#SatoshiMacro #FedMinutesFocusOnOctoberPause #BitcoinCycle #Bitcoin
$BTC | Fed minutes this week zero in on an October pause. Crypto Twitter is calling it bullish for Bitcoin already. On the desk, we never isolate a rate call. SatoshiMacro's Model folds the 2s10s yield curve and the dollar index into its Macro tier. That tier is just 5 percent of the 48-signal composite. SMM reads 38.2 right now. Neutral zone, as of this morning AEST. A pause gets priced into yield-curve steepening first. Spot follows later. My read: one headline will not move a 48-signal model much. It's a position classifier, not a forecaster. Five percent of the score will not flip Neutral into anything else.
https://satoshimacro.com/tools/crypto/satoshimacro-model/?utm_source=binance_square&utm_medium=social&utm_campaign=autopilot_short-1
#SatoshiMacro #FedMinutesFocusOnOctoberPause #BitcoinCycle #Bitcoin
https://satoshimacro.com/tools/crypto/satoshimacro-model/?utm_source=binance_square&utm_medium=social&utm_campaign=autopilot_short-1
#SatoshiMacro #FedMinutesFocusOnOctoberPause #BitcoinCycle #Bitcoin
72

*BITCOIN CYCLE IS NOT OVER: Why Everyone Is Reading It Wrong*EVERYONE IS READING THIS BITCOIN CYCLE WRONG.
The market thinks the 4-year cycle is dead. It's not. We are still following the same pattern that has been repeating since 2017.
Bitcoin is giving late bulls one FINAL chance to exit before the real liquidation begins. Don't chase the relief rally.
Quick reminder of my track record:
I publicly called $BTC $17K bottom in 2022, $126K top in 2025, and then $58K local bottom in 2026. All played out.
My new projection based on the chart:
- 2026 BOTTOM: $29K
- 2029 TOP: $149K
- 2030 BOTTOM: $35K
The chart clearly shows $19K (2017), $69K (2021), and $126K (2025) tops following the same rising trendline. The next major top is forming.
Save this chart and check back later. Patience will be rewarded.
#Bitcoin $ #BTC $#BitcoinCycle
*BITCOIN CYCLE IS NOT OVER: Why Everyone Is Reading It Wrong*
EVERYONE IS READING THIS BITCOIN CYCLE WRONG.
The market thinks the 4-year cycle is dead. It's not. We are still following the same pattern that has been repeating since 2017.
Bitcoin is giving late bulls one FINAL chance to exit before the real liquidation begins. Don't chase the relief rally.
Quick reminder of my track record:
I publicly called $BTC $17K bottom in 2022, $126K top in 2025, and then $58K local bottom in 2026. All played out.
My new projection based on the chart:
- 2026 BOTTOM: $29K
- 2029 TOP: $149K
- 2030 BOTTOM: $35K
The chart clearly shows $19K (2017), $69K (2021), and $126K (2025) tops following the same rising trendline. The next major top is forming.
Save this chart and check back later. Patience will be rewarded.
#Bitcoin $ #BTC $#BitcoinCycle
The market thinks the 4-year cycle is dead. It's not. We are still following the same pattern that has been repeating since 2017.
Bitcoin is giving late bulls one FINAL chance to exit before the real liquidation begins. Don't chase the relief rally.
Quick reminder of my track record:
I publicly called $BTC $17K bottom in 2022, $126K top in 2025, and then $58K local bottom in 2026. All played out.
My new projection based on the chart:
- 2026 BOTTOM: $29K
- 2029 TOP: $149K
- 2030 BOTTOM: $35K
The chart clearly shows $19K (2017), $69K (2021), and $126K (2025) tops following the same rising trendline. The next major top is forming.
Save this chart and check back later. Patience will be rewarded.
#Bitcoin $ #BTC $#BitcoinCycle
59

·
--

Article
🚨 EVERYONE MAY BE READING THIS #BITCOIN CYCLE WRONG🚨 EVERYONE MAY BE READING THIS $BITCOIN CYCLE WRONG
I still believe Bitcoin is following a familiar 4-year cycle structure.
Right now, the market could be giving late bulls one final opportunity to protect profits before a deeper liquidation phase begins. ⚠️
This is why I’m not chasing every relief rally. Patience matters more than FOMO.
📌 Save this post and come back to it later.
Quick reminder:
I publicly called the $BTC $17K bottom in 2022, the $126K top in 2025, and the $58K local bottom in 2026.
History doesn’t always repeat perfectly — but the cycle structure is worth watching
#crypto #BitcoinCycle #CryptoTrading #BİNANCE #BinanceSquareTalks
🚨 EVERYONE MAY BE READING THIS #BITCOIN CYCLE WRONG
🚨 EVERYONE MAY BE READING THIS $BITCOIN CYCLE WRONG
I still believe Bitcoin is following a familiar 4-year cycle structure.
Right now, the market could be giving late bulls one final opportunity to protect profits before a deeper liquidation phase begins. ⚠️
This is why I’m not chasing every relief rally. Patience matters more than FOMO.
📌 Save this post and come back to it later.
Quick reminder:
I publicly called the $BTC $17K bottom in 2022, the $126K top in 2025, and the $58K local bottom in 2026.
History doesn’t always repeat perfectly — but the cycle structure is worth watching
#crypto #BitcoinCycle #CryptoTrading #BİNANCE #BinanceSquareTalks
I still believe Bitcoin is following a familiar 4-year cycle structure.
Right now, the market could be giving late bulls one final opportunity to protect profits before a deeper liquidation phase begins. ⚠️
This is why I’m not chasing every relief rally. Patience matters more than FOMO.
📌 Save this post and come back to it later.
Quick reminder:
I publicly called the $BTC $17K bottom in 2022, the $126K top in 2025, and the $58K local bottom in 2026.
History doesn’t always repeat perfectly — but the cycle structure is worth watching
#crypto #BitcoinCycle #CryptoTrading #BİNANCE #BinanceSquareTalks
1
87

·
--

Article
Anthony Scaramucci drops a bomb of optimism.. The Bitcoin four-year cycle is alive and a historic rise awaits us in the fourth quarterIn extremely significant statements that reshuffled the strategic outlook for market makers and HODL whales for 2026, the famous billionaire and founder of SkyBridge Capital, Anthony Scaramucci, came out with a strong message for the skeptics of the historical structure of the digital gold chart!
📊 Breaking down Scaramucci's strategic vision:
Anthony Scaramucci drops a bomb of optimism.. The Bitcoin four-year cycle is alive and a historic rise awaits us in the fourth quarter
In extremely significant statements that reshuffled the strategic outlook for market makers and HODL whales for 2026, the famous billionaire and founder of SkyBridge Capital, Anthony Scaramucci, came out with a strong message for the skeptics of the historical structure of the digital gold chart!
📊 Breaking down Scaramucci's strategic vision:
📊 Breaking down Scaramucci's strategic vision:
2
153

·
--
🚨 Is the Bitcoin 4-Year Cycle Broken, or Are We Just Impatient?
Let’s look at the cold, hard numbers. 📊
Historically, Bitcoin hits its absolute cycle bottom roughly 12 to 13 months after the macro peak.
f
following the subdued top we saw back in October 2025, we are currently only about 8 months into this decline phase.
Right now, BTC is holding flat around the $63,500 mark. For weeks, it’s felt like watching paint dry.
But beneath the surface, something interesting is happening:
the peak-to-trough drawdowns are shrinking every single cycle (from 85%, to 84%, to 77% in previous runs).
The Swing Factor to Watch: Realized Price / Cost Basis.
If BTC holds a calm, orderly line here, the floor stays strong. But if panic sets in and short-term holders capitulate, it drags the entire realized price average down with it.
Are we building a massive accumulation base for late 2026, or is there one final flush left to clear out the leverage?
👇 Drop your average entry price below. Let’s see who is actually buying this range!
#BTC #CryptoMarket #BitcoinCycle #TechnicalAnalysis
🚨 Is the Bitcoin 4-Year Cycle Broken, or Are We Just Impatient?
Let’s look at the cold, hard numbers. 📊
Historically, Bitcoin hits its absolute cycle bottom roughly 12 to 13 months after the macro peak.
f
following the subdued top we saw back in October 2025, we are currently only about 8 months into this decline phase.
Right now, BTC is holding flat around the $63,500 mark. For weeks, it’s felt like watching paint dry.
But beneath the surface, something interesting is happening:
the peak-to-trough drawdowns are shrinking every single cycle (from 85%, to 84%, to 77% in previous runs).
The Swing Factor to Watch: Realized Price / Cost Basis.
If BTC holds a calm, orderly line here, the floor stays strong. But if panic sets in and short-term holders capitulate, it drags the entire realized price average down with it.
Are we building a massive accumulation base for late 2026, or is there one final flush left to clear out the leverage?
👇 Drop your average entry price below. Let’s see who is actually buying this range!
#BTC #CryptoMarket #BitcoinCycle #TechnicalAnalysis
Let’s look at the cold, hard numbers. 📊
Historically, Bitcoin hits its absolute cycle bottom roughly 12 to 13 months after the macro peak.
f
following the subdued top we saw back in October 2025, we are currently only about 8 months into this decline phase.
Right now, BTC is holding flat around the $63,500 mark. For weeks, it’s felt like watching paint dry.
But beneath the surface, something interesting is happening:
the peak-to-trough drawdowns are shrinking every single cycle (from 85%, to 84%, to 77% in previous runs).
The Swing Factor to Watch: Realized Price / Cost Basis.
If BTC holds a calm, orderly line here, the floor stays strong. But if panic sets in and short-term holders capitulate, it drags the entire realized price average down with it.
Are we building a massive accumulation base for late 2026, or is there one final flush left to clear out the leverage?
👇 Drop your average entry price below. Let’s see who is actually buying this range!
#BTC #CryptoMarket #BitcoinCycle #TechnicalAnalysis
2
390

Real Vision Analyst Reveals Why Buying Bitcoin at $60,000s Is a Once in Cycle Opportunity.
Jamie Coutts, Chief Crypto Analyst at Real Vision, believes crypto may have one more leg lower before a recovery, but says anyone buying Bitcoin in the $60,000s on a long-term horizon is likely making one of the better financial decisions available right now.
Coutts acknowledged that crypto has already seen a roughly 50% decline from its highs, which he described as broadly in line with previous bear markets on a volatility-adjusted basis. But he stopped short of calling a definitive bottom, suggesting one more flush lower remains possible before the market finds its footing.
“Anything in the $60,000s for Bitcoin is an amazing accumulation zone on a long-term horizon,” he said, framing the current period as a potential opportunity rather than a reason for alarm.
The Liquidity Argument
The main point of Coutts’ thesis is not about crypto specifically. It is about what happens to global liquidity in 2026 and 2027. He identified three converging pressures that could stress financial markets in the near term.
Why Liquidity Eventually Has to Come
The U.S. government, he argued, cannot afford to let yields run too high. Budget deficits are already running at wartime levels as a percentage of GDP. If markets decline sharply and tax receipts fall, those deficits blow out further and yields become unmanageable.
The only realistic path out of that scenario runs through the Federal Reserve adding liquidity, which historically has been one of the most reliable tailwinds for risk assets including crypto.
#bitcoin #BitcoinCycle
#BitcoinFearGaugeSurgesNearly20%
#buyBTC #TopPost
$BTC
{spot}(BTCUSDT)
Real Vision Analyst Reveals Why Buying Bitcoin at $60,000s Is a Once in Cycle Opportunity.
Jamie Coutts, Chief Crypto Analyst at Real Vision, believes crypto may have one more leg lower before a recovery, but says anyone buying Bitcoin in the $60,000s on a long-term horizon is likely making one of the better financial decisions available right now.
Coutts acknowledged that crypto has already seen a roughly 50% decline from its highs, which he described as broadly in line with previous bear markets on a volatility-adjusted basis. But he stopped short of calling a definitive bottom, suggesting one more flush lower remains possible before the market finds its footing.
“Anything in the $60,000s for Bitcoin is an amazing accumulation zone on a long-term horizon,” he said, framing the current period as a potential opportunity rather than a reason for alarm.
The Liquidity Argument
The main point of Coutts’ thesis is not about crypto specifically. It is about what happens to global liquidity in 2026 and 2027. He identified three converging pressures that could stress financial markets in the near term.
Why Liquidity Eventually Has to Come
The U.S. government, he argued, cannot afford to let yields run too high. Budget deficits are already running at wartime levels as a percentage of GDP. If markets decline sharply and tax receipts fall, those deficits blow out further and yields become unmanageable.
The only realistic path out of that scenario runs through the Federal Reserve adding liquidity, which historically has been one of the most reliable tailwinds for risk assets including crypto.
#bitcoin #BitcoinCycle
#BitcoinFearGaugeSurgesNearly20%
#buyBTC #TopPost
$BTC
Jamie Coutts, Chief Crypto Analyst at Real Vision, believes crypto may have one more leg lower before a recovery, but says anyone buying Bitcoin in the $60,000s on a long-term horizon is likely making one of the better financial decisions available right now.
Coutts acknowledged that crypto has already seen a roughly 50% decline from its highs, which he described as broadly in line with previous bear markets on a volatility-adjusted basis. But he stopped short of calling a definitive bottom, suggesting one more flush lower remains possible before the market finds its footing.
“Anything in the $60,000s for Bitcoin is an amazing accumulation zone on a long-term horizon,” he said, framing the current period as a potential opportunity rather than a reason for alarm.
The Liquidity Argument
The main point of Coutts’ thesis is not about crypto specifically. It is about what happens to global liquidity in 2026 and 2027. He identified three converging pressures that could stress financial markets in the near term.
Why Liquidity Eventually Has to Come
The U.S. government, he argued, cannot afford to let yields run too high. Budget deficits are already running at wartime levels as a percentage of GDP. If markets decline sharply and tax receipts fall, those deficits blow out further and yields become unmanageable.
The only realistic path out of that scenario runs through the Federal Reserve adding liquidity, which historically has been one of the most reliable tailwinds for risk assets including crypto.
#bitcoin #BitcoinCycle
#BitcoinFearGaugeSurgesNearly20%
#buyBTC #TopPost
$BTC

124

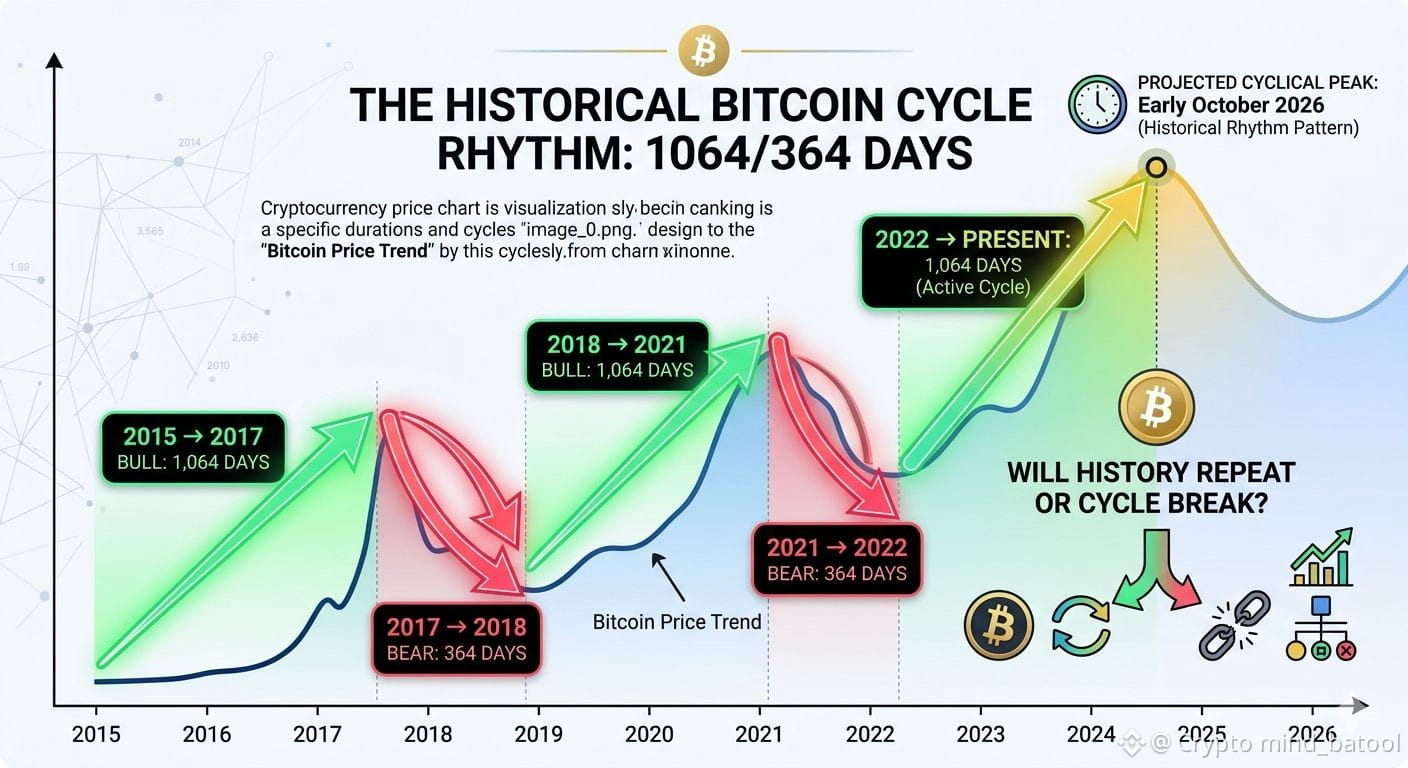
🚨 BITCOIN MAY HAVE ~7 WEEKS LEFT…
Almost nobody is ready for what this cycle could bring. 👀
The historical pattern is hard to ignore:
📈 2015 → 2017 Bull: 1,064 days
📉 2017 → 2018 Bear: 364 days
📈 2018 → 2021 Bull: 1,064 days
📉 2021 → 2022 Bear: 364 days
📈 2022 → 2025 Bull: 1,064 days
If the same cycle rhythm repeats, the next major turning point could come around early October 2026.
But this time, there’s one big question:
Will $BTC repeat history… or finally break the cycle? 👀🔥
👇 What’s your prediction?
1️⃣ History repeats — Expecting a major correction around October! 📉
2️⃣ Cycle breaks — Institutional demand pushes $BTC higher earlier! 🚀
Let me know your thoughts below! 👇
#Bitcoin #BTC #Crypto #BitcoinCycle #CryptoMarket
{future}(BTCUSDT)
🚨 BITCOIN MAY HAVE ~7 WEEKS LEFT…
Almost nobody is ready for what this cycle could bring. 👀
The historical pattern is hard to ignore:
📈 2015 → 2017 Bull: 1,064 days
📉 2017 → 2018 Bear: 364 days
📈 2018 → 2021 Bull: 1,064 days
📉 2021 → 2022 Bear: 364 days
📈 2022 → 2025 Bull: 1,064 days
If the same cycle rhythm repeats, the next major turning point could come around early October 2026.
But this time, there’s one big question:
Will $BTC repeat history… or finally break the cycle? 👀🔥
👇 What’s your prediction?
1️⃣ History repeats — Expecting a major correction around October! 📉
2️⃣ Cycle breaks — Institutional demand pushes $BTC higher earlier! 🚀
Let me know your thoughts below! 👇
#Bitcoin #BTC #Crypto #BitcoinCycle #CryptoMarket
Almost nobody is ready for what this cycle could bring. 👀
The historical pattern is hard to ignore:
📈 2015 → 2017 Bull: 1,064 days
📉 2017 → 2018 Bear: 364 days
📈 2018 → 2021 Bull: 1,064 days
📉 2021 → 2022 Bear: 364 days
📈 2022 → 2025 Bull: 1,064 days
If the same cycle rhythm repeats, the next major turning point could come around early October 2026.
But this time, there’s one big question:
Will $BTC repeat history… or finally break the cycle? 👀🔥
👇 What’s your prediction?
1️⃣ History repeats — Expecting a major correction around October! 📉
2️⃣ Cycle breaks — Institutional demand pushes $BTC higher earlier! 🚀
Let me know your thoughts below! 👇
#Bitcoin #BTC #Crypto #BitcoinCycle #CryptoMarket
2
76
Log in to explore more content
Join global crypto users on Binance Square
⚡️ Get latest and useful information about crypto.
💬 Trusted by the world’s largest crypto exchange.
👍 Discover real insights from verified creators.
Email / Phone number
Trending Topics
1
#BitcoinRebounds$75KAsChipsLead
1,978 views
62 Discussing
2
#JobsReportRaisesHikeOdds
49,917 views
669 Discussing
3
#US Data Center Rules May Constrain AI Expansion
6,847 views
78 Discussing
4
#$2TWipedOutHedgeFundsFaceLiquidation
9,509 views
83 Discussing
5
#WillAnthropicListOnTime
4,117 views
129 Discussing
6
#USNovemberMichiganExpectationsIndexPrelimAt50.9
10,145 views
232 Discussing
7
#OilPlungesBelow$100
11,759 views
33 Discussing
8
#TradFiForBeginners
5,915 views
132 Discussing
9
#USMidtermsCouldShakeUpUS-IranTies
26,244 views
411 Discussing
10
#RussianCentralBankNamesBTCETHUSDTForNonQualifiedInvestors
372 views
7 Discussing