

MOOPLY
302 Posts

MOOPLY
Report
Block User
🚀 Crypto News & AI-Powered Insights | 📊 BTC, Altcoins & Market Trends | 🐋 Whale Alerts | 🔥 Trending Tokens | 💡 Research, Not Hype | NFA
Open Trade
Frequent Trader
3.7 Years
29 Following
78 Followers
180 Liked
Posts
Portfolio
All
Quotes
Videos
·
--
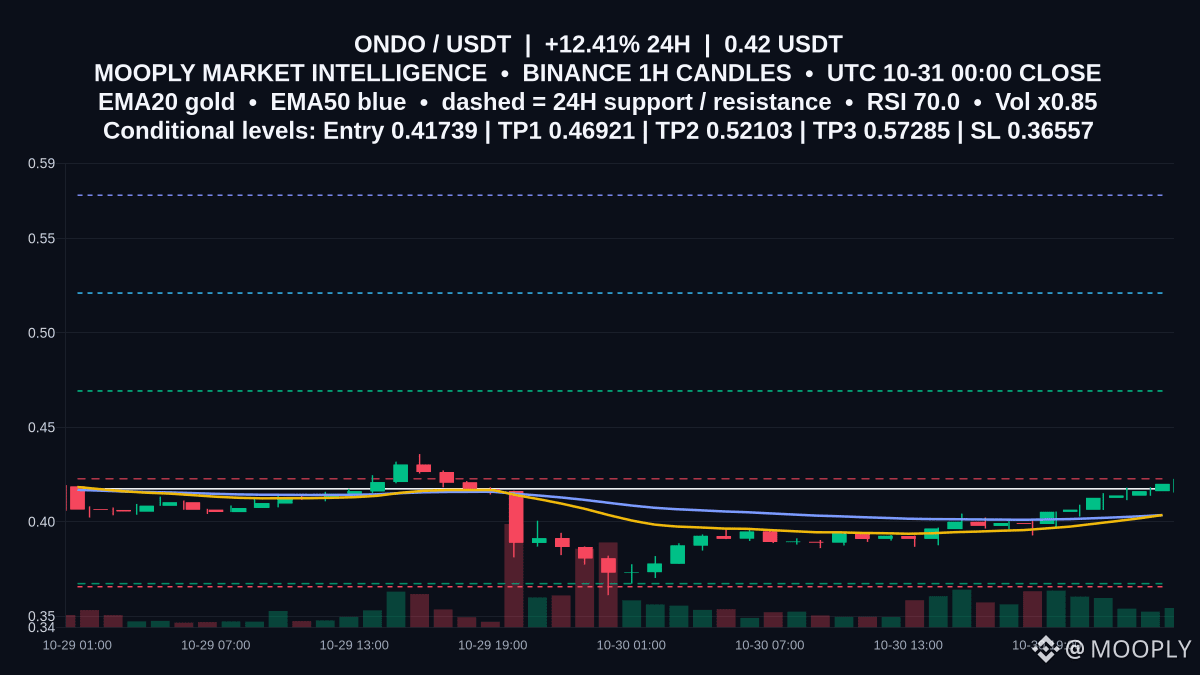
Breakout watch: $ONDO is pressing the 0.4227 ceiling after a +12.406% 24h move and a fresh 6h gain of 5.32. EMA20 (0.40352) has edged above EMA50 (0.4035) and RSI at 69.95 puts momentum at the threshold—making the next 1h close around resistance decisive.
📍 Potential entry: 0.41739
🎯 Target 1: 0.46921
🎯 Target 2: 0.52103
🛑 Stop / invalidation: 0.36557
A 1h close above 0.4227, followed by a steady retest hold, would confirm upside continuation; failure to sustain above 0.41739 and especially a break beneath 0.3672 would weaken the setup and tilt risk lower toward invalidation. Are you waiting for a clear candle close through 0.4227 before considering the scenario?
Not financial advice.
#ONDO #MarketContext #UpsideScenario
8
·
--
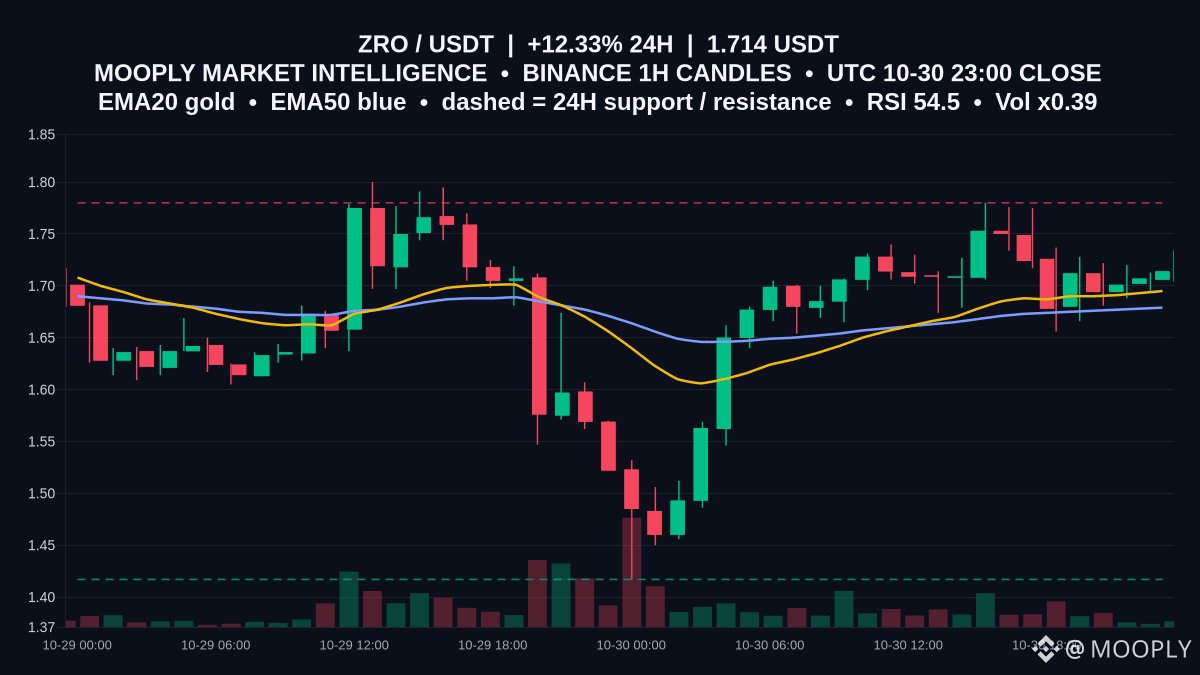
Momentum returned: $ZRO is up 12.328% in 24h at 1.714, but it’s still boxed inside a known range.
On the 1h, EMA20 at 1.695 sits above EMA50 at 1.679 while RSI at 54.47 is constructive without being stretched. With ATR at 0.045, swings are relatively tight, and repeated failure under 1.78 has capped progress.
This is a range: support is 1.417 and resistance is 1.78. A sustained close above 1.78 would signal range expansion; rejection there keeps chop intact, with 1.695–1.679 acting as the near-term pivot. Losing that zone on closes would refocus price toward 1.417.
Would you like an alert on the first hourly close above 1.78 or below 1.695?
Not financial advice.
#ZRO #MarketContext #RangeWatch
43
·
--
Binance under scrutiny after reported outflows, frozen stablecoins and unusual trading activity
Reports say large outflows from wallets labeled with the exchange coincided with a sharp market move: BTC plunged, many longs liquidated and a sizable chunk of market cap erased. Independent firms reportedly flagged billions in stablecoins frozen by issuers; those freezes are described as linked to the same wallet set. The exchange’s leadership has said user funds remain safe and that an internal investigation is ongoing.
Unverified claims allege stolen tokens were dumped then used to place event-driven longs expecting buybacks—this theory remains speculative and not confirmed.
Counterpoint: BTC showed early recovery signs amid the volatility, underscoring how fast markets can rebound once narratives settle.
Takeaway: facts are still being verified. Watch official disclosures and on-chain analysis before drawing conclusions.
#CryptoSecurity #Bitcoin #Stablecoins #CryptoExchanges

71
·
--
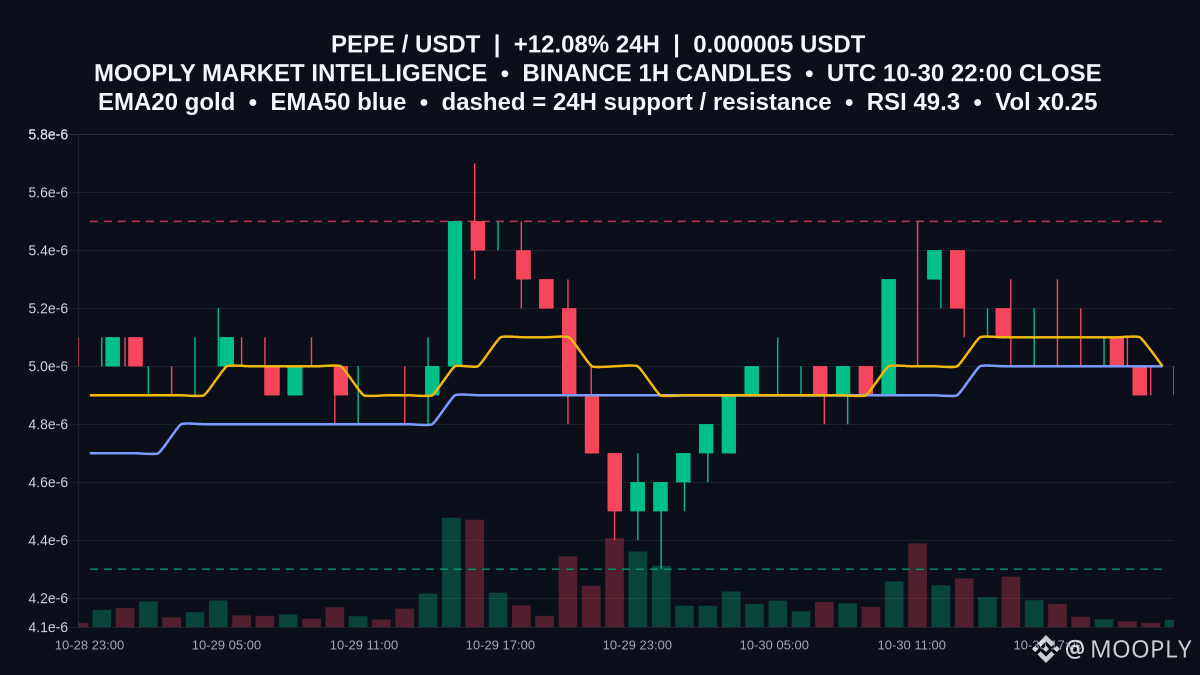
Range-bound session for $PEPE as price hovers at 0.00000502 after a 12.081% 24h gain.
EMA20 and EMA50 are both 0.000005 while RSI at 49.29 signals balance; ATR at 0.0000002 points to tight, repeatable swings that favor fading extremes rather than chasing moves.
This is a defined box: support at 0.0000043 and resistance at 0.0000055. With price near the midpoint and last 6h at -2.33, patience pays—participation is light around 0.25 of baseline.
Confirmation would be a 1h close above 0.0000055 with expanding volume; a 1h close below 0.0000043 would shift risk lower as that level flips to resistance. Which side of 0.0000043–0.0000055 do you expect the next hourly candle to probe first?
Not financial advice.
#PEPE #PriceActionNotes #RangeLevels
4
·
--
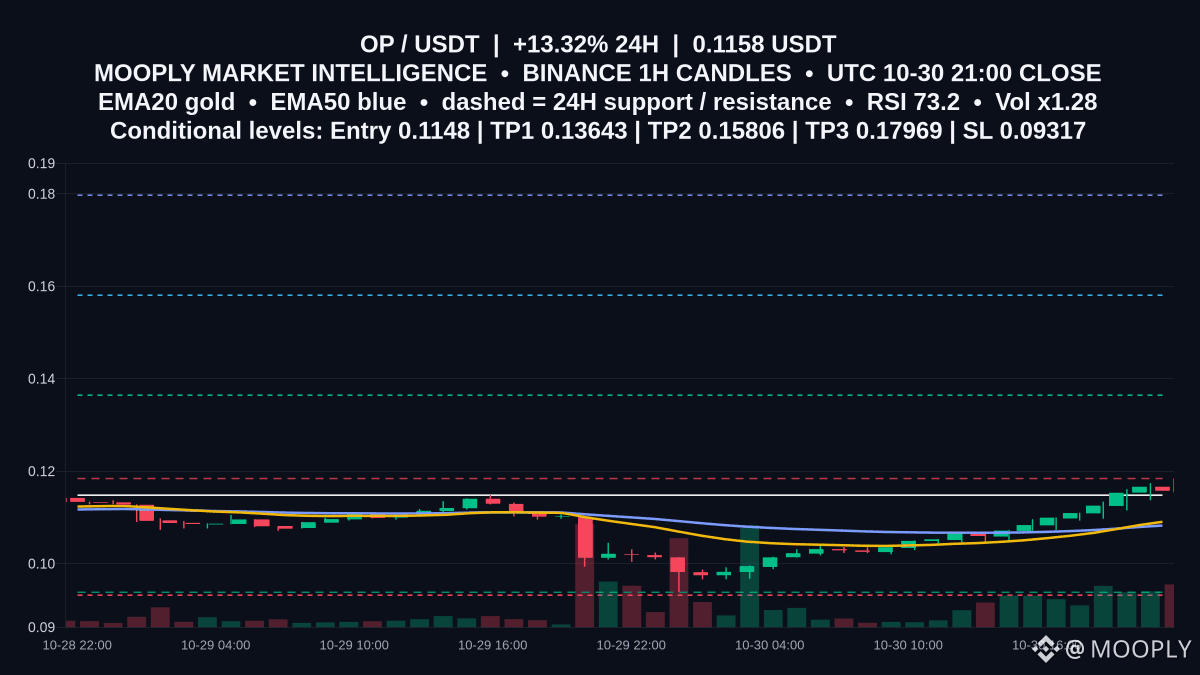
After a +13.32% day, $OP trades at 0.1158 and sits just below the 0.1184 cap.
EMA20 (0.10904) above EMA50 (0.10823) with MACD positive supports momentum, but RSI 73.17 into resistance makes 0.1184 the key decision point.
📍 Potential entry: 0.1148
🎯 Target 1: 0.13643
🎯 Target 2: 0.15806
🛑 Stop / invalidation: 0.09317
Confirmation comes on a 1h close and hold above 0.1184, opening room toward the targets. A rejection at 0.1184 and slip back through 0.1148 would warn of a deeper move toward the 0.0938 support and invalidate the scenario.
Do you want an alert if the next 1h candle closes above 0.1184 or taps 0.1148 first?
Not financial advice.
#OP #PriceActionNotes #UpsideLevels
7
·
--
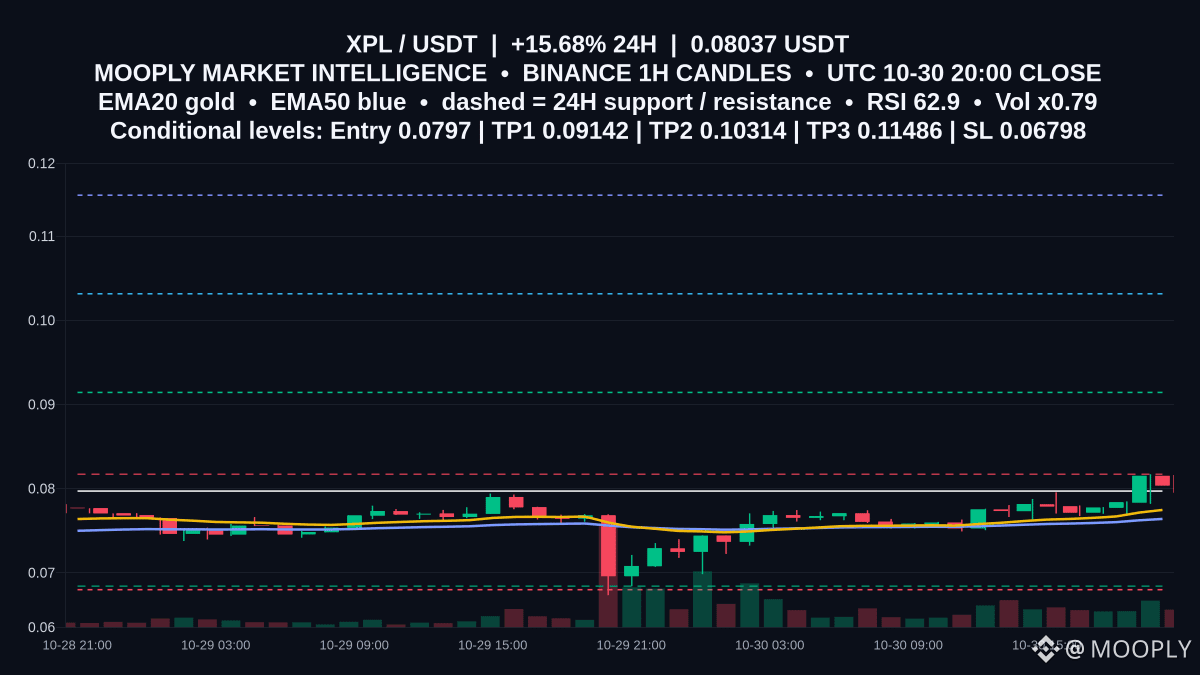
Momentum has nudged $XPL to the doorstep of 0.0817, the mapped 24h resistance.
Price is 0.08037 with EMA20 0.07746 above EMA50 0.07639 and RSI 62.87, a constructive setup. The 0.0817 cap matters because recent intraday pushes stalled there; a clean close above it would open room toward 0.09142 and 0.10314, while 0.0684 remains key support (ATR 0.00168).
📍 Potential entry: 0.0797
🎯 Target 1: 0.09142
🎯 Target 2: 0.10314
🛑 Stop / invalidation: 0.06798
Confirmation comes if price reclaims and holds 0.0817 after a dip toward 0.0797; failure to hold 0.0797 or losing the EMA20 at 0.07746 would raise risk of a move back to 0.0684, invalidating this scenario.
Would you like an alert if 0.0817 breaks on an hourly close?
Not financial advice.
#XPL #PriceActionNotes #UpsideLevels
·
--
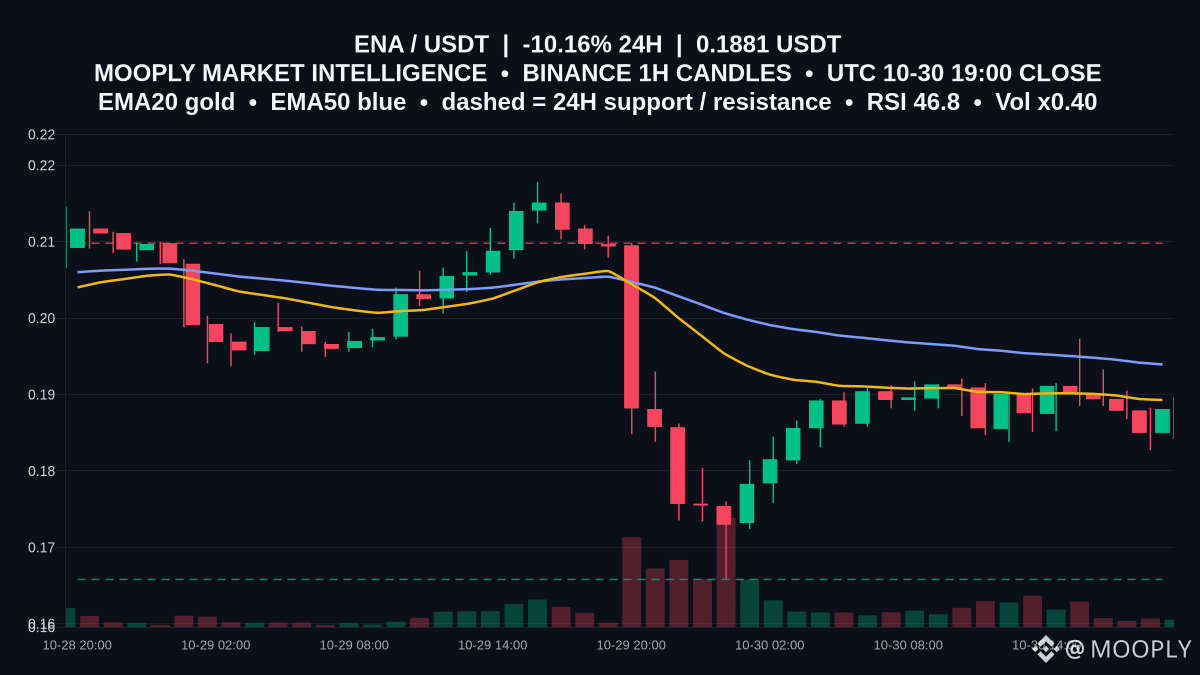
Range-bound but bruised: $ENA is trading at 0.1881 after a -10.157% 24h move, with activity muted at 0.4x recent volume.
Price sits just under EMA20 at 0.18929 and below EMA50 at 0.19394. MACD remains below zero but is above its signal, hinting momentum stabilization if 0.18929 is reclaimed. ATR at 0.00526 frames typical hourly swings.
Direction is RANGE. Resistance is 0.2098 and support is 0.1658; price is holding mid-band after a sharp dip and bounce.
The range view holds while hourly closes stay between 0.1658 and 0.2098, ideally with repeated defenses of 0.1658; it’s invalidated on a decisive 1h close above 0.2098 or below 0.1658. Are you watching for a clean reclaim of 0.18929 before any attempt toward 0.2098?
Not financial advice.
#ENA #PriceActionNotes #RangeLevels
6
·
--
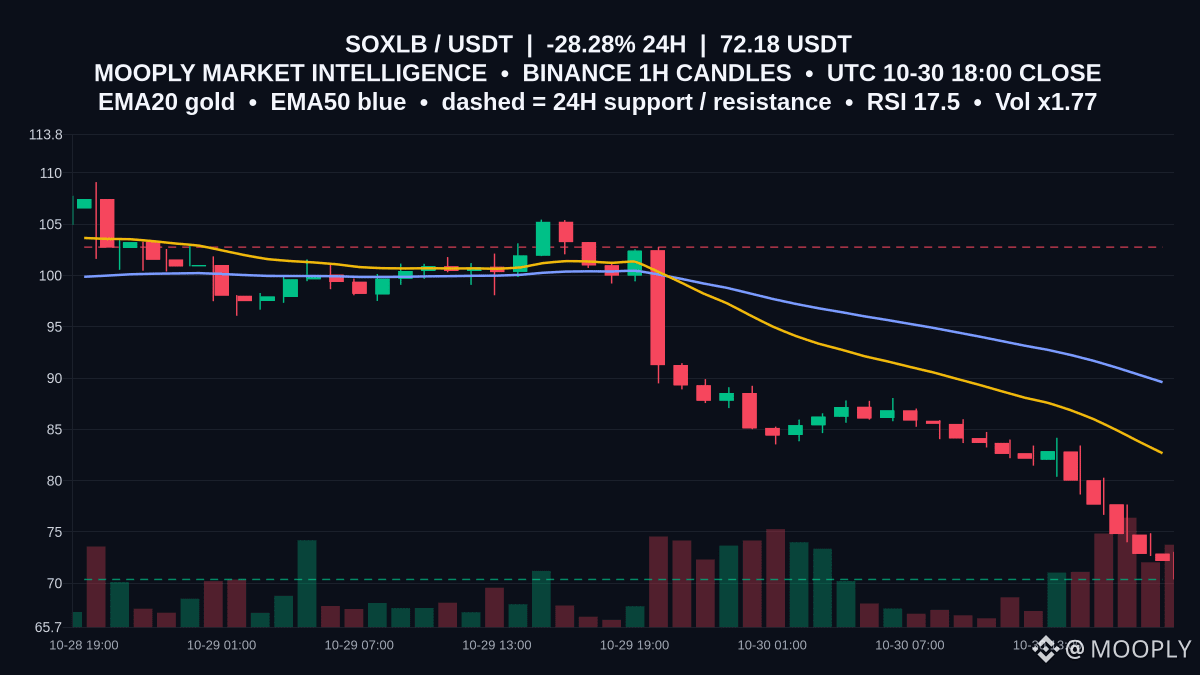
Whipsawed and deeply oversold, $SOXLB sits at 72.18 after a -28.283% day.
RSI 17.5 flags seller exhaustion, but price is well beneath a falling EMA20 at 82.675 and EMA50 at 89.599, so any bounce runs into layered resistance fast.
This reads as a range: 70.37 support versus 102.77 resistance. With ATR 2.579 and volume elevated (x1.77), probes of the floor can be noisy before direction is clear.
Confirmation looks like repeated 1h holds above 70.37 and a reclaim of 82.675; losing 70.37 would invalidate the range idea. A sustained push over 89.599 would put 102.77 back in play.
Are you waiting for a clean 1h close holding 70.37 before eyeing a mean‑reversion attempt?
Not financial advice.
#SOXLB #PriceActionNotes #RangeLevels
2
·
--
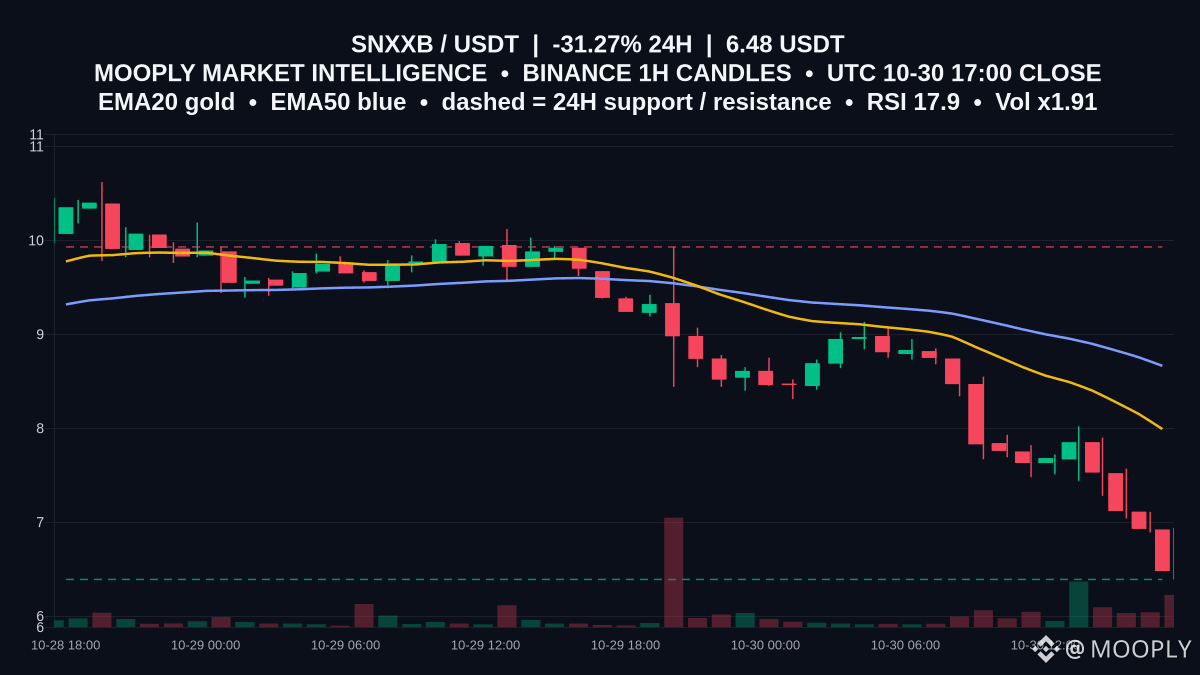
Volatility squeezed $SNXXB to 6.48 (-31.27% 24h) on 13,104,153.5594 volume across 46,667 trades.
RSI 17.86 flags oversold, but the tape is boxed between 6.39 support and 9.93 resistance. With EMA20 at 7.991 and EMA50 at 8.664 trending lower, rallies toward those averages often meet supply; MACD below signal (-0.61068942 vs -0.46382454) underscores momentum risk.
Range view: defend 6.39 on hourly closes to keep mean-reversion bounces toward 7.991/8.664 in play; a 1h close below 6.39 would undermine the floor, while only strength through 9.93 would shift control. ATR 0.399 frames 1h moves, and participation is elevated at 1.91x; the last 6h drop of -15.07 urges caution into spikes.
Which comes first on your watch: a hold at 6.39 or a retest of the EMA20 at 7.991?
Not financial advice.
#SNXXB #PriceActionNotes #RangeLevels
·
--
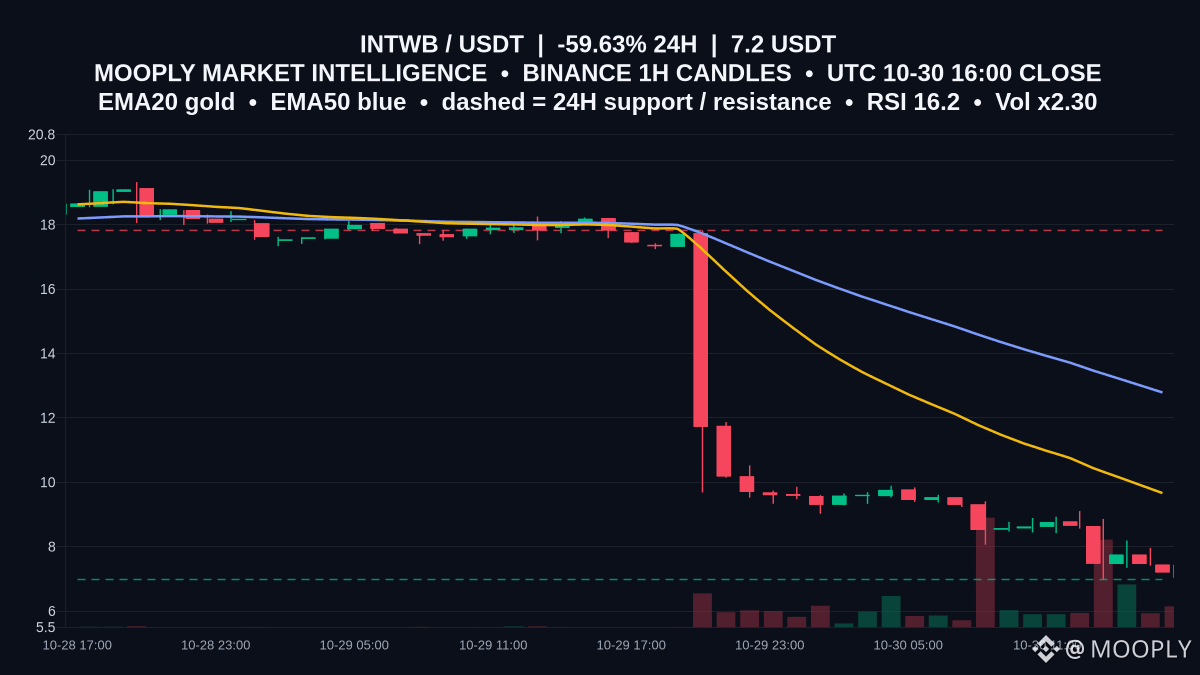
Steep slide grips $INTWB: price at 7.2, -59.628% over 24h, with 19,441,773.0223 in volume and 146,748 trades.
RSI at 16.18 flags extreme short‑term exhaustion, but price sits well below EMA20 9.662 and EMA50 12.787, keeping momentum heavy. ATR 0.612 points to brisk intraday volatility.
Direction: RANGE. Support is 6.98 and resistance is 17.82. Sitting just above 6.98, a hold can foster a rebound toward 9.662; a 1h close below 6.98 would further undermine the base. If buyers reclaim 9.662 on a close, 12.787 becomes the next pivot, while 17.82 remains the ceiling. Which level are you watching first: 6.98 holding or a close back above 9.662?
Not financial advice.
#INTWB #PriceActionNotes #RangeLevels
Steep slide grips $INTWB : price at 7.2, -59.628% over 24h, with 19,441,773.0223 in volume and 146,748 trades.
RSI at 16.18 flags extreme short‑term exhaustion, but price sits well below EMA20 9.662 and EMA50 12.787, keeping momentum heavy. ATR 0.612 points to brisk intraday volatility.
Direction: RANGE. Support is 6.98 and resistance is 17.82. Sitting just above 6.98, a hold can foster a rebound toward 9.662; a 1h close below 6.98 would further undermine the base. If buyers reclaim 9.662 on a close, 12.787 becomes the next pivot, while 17.82 remains the ceiling. Which level are you watching first: 6.98 holding or a close back above 9.662?
Not financial advice.
#INTWB #PriceActionNotes #RangeLevels
9
·
--
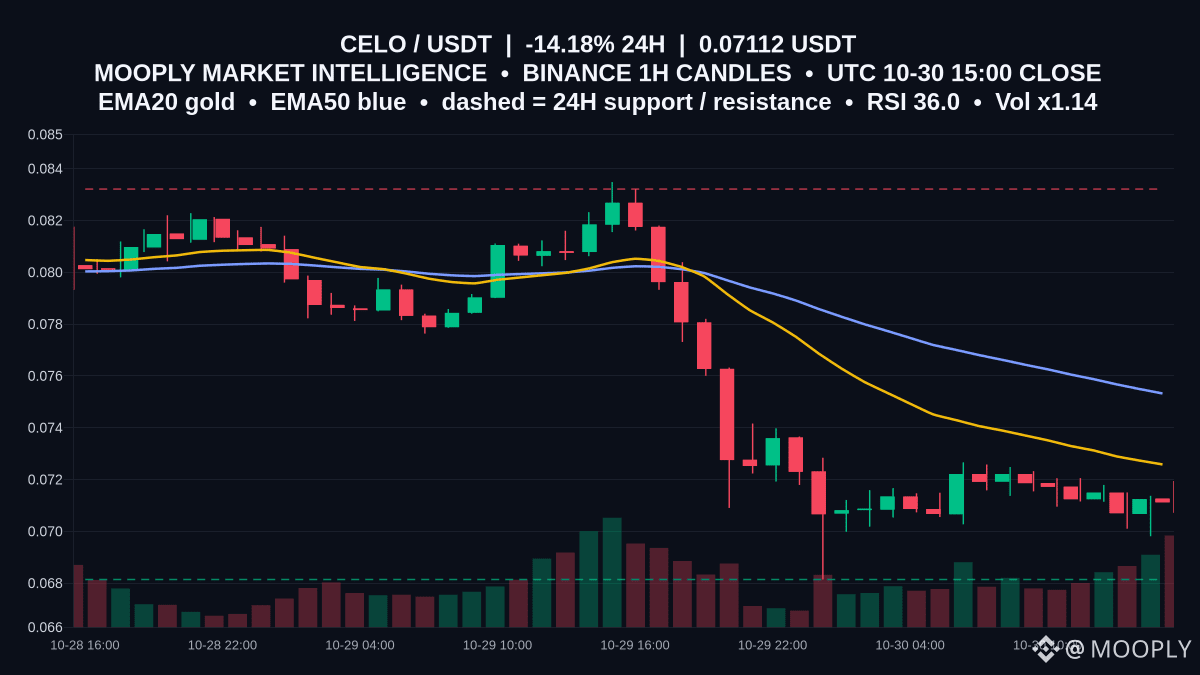
Selloff grips $CELO, trading at 0.07112, down 14.18% over 24h.
On the 1h view, price is below EMA20 at 0.07258 and EMA50 at 0.07532, with RSI at 36.04 and a negative MACD, signaling weak momentum. ATR at 0.00117 and slightly elevated turnover (1.14) point to active but contained swings.
Range context: support sits at 0.06814 and resistance at 0.08321. The range thesis holds while buyers defend 0.06814 and rallies stall beneath 0.08321; an hourly close below 0.06814 would invalidate this, while acceptance above 0.08321 would shift bias upward. Which boundary will price test first, 0.06814 or 0.08321?
Not financial advice.
#CELO #PriceActionNotes #RangeLevels
Selloff grips $CELO , trading at 0.07112, down 14.18% over 24h.
On the 1h view, price is below EMA20 at 0.07258 and EMA50 at 0.07532, with RSI at 36.04 and a negative MACD, signaling weak momentum. ATR at 0.00117 and slightly elevated turnover (1.14) point to active but contained swings.
Range context: support sits at 0.06814 and resistance at 0.08321. The range thesis holds while buyers defend 0.06814 and rallies stall beneath 0.08321; an hourly close below 0.06814 would invalidate this, while acceptance above 0.08321 would shift bias upward. Which boundary will price test first, 0.06814 or 0.08321?
Not financial advice.
#CELO #PriceActionNotes #RangeLevels
1
·
--
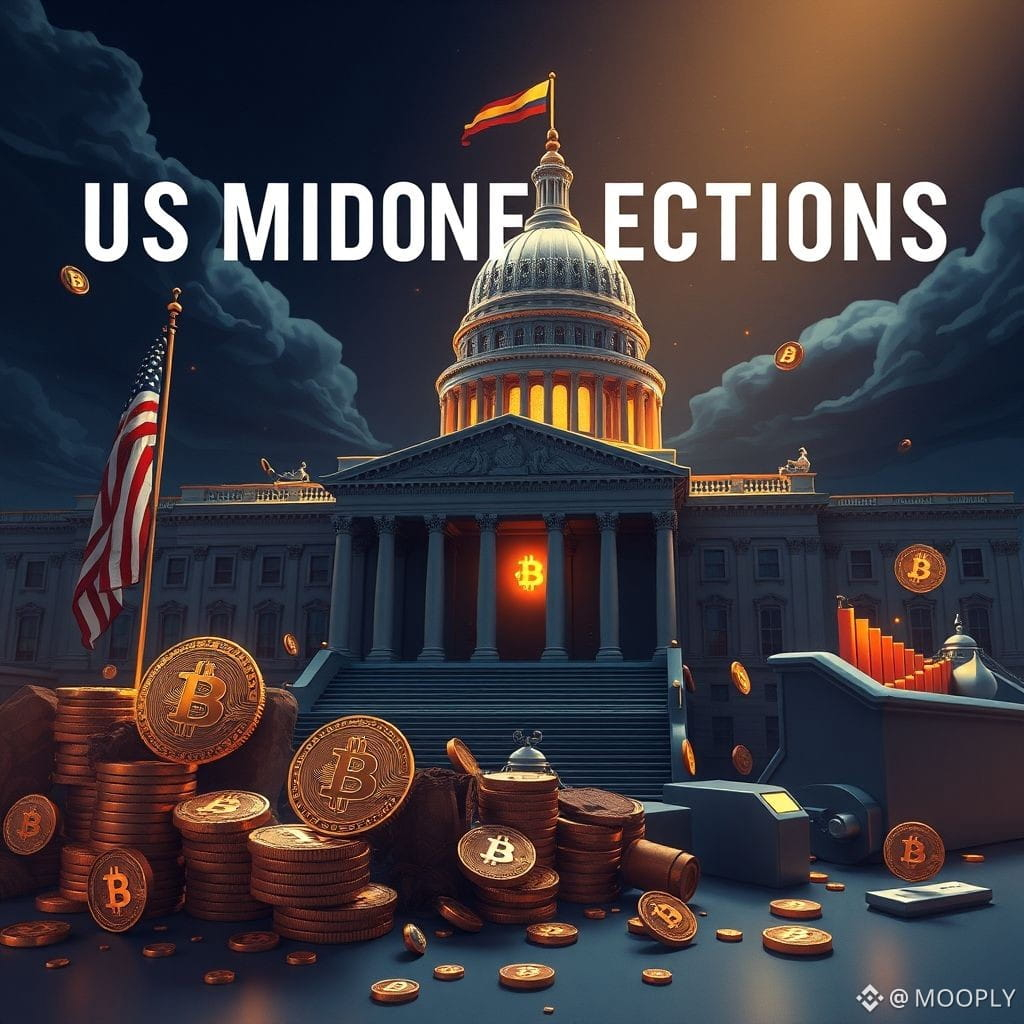
How US midterms could reshape crypto regulation—and markets
Prediction markets and models show a tilt toward a Democratic sweep (e.g., Kalshi ~63%, Polymarket ~67%, Decision Desk ~55% as reported). That outcome matters because the CLARITY Act passed the House but failed a Senate vote 49–50 on Sep 15—leaving a clear path where Senate composition will shape next steps.
Key points:
- Regulatory risk: A Democratic sweep could slow or reshape industry-favored bipartisan bills; analysts disagree on timing and likelihood of revival.
- Market positioning: Regulation‑sensitive altcoins and crypto stocks are likely most exposed; $BTC appears less correlated, though it has recently dipped below $80K as volatility rises.
- Timing: Senate control is the critical swing for federal crypto policy and near‑term legislative clarity.
Counterpoint: Macro drivers (Fed policy, yields, oil) may dominate price moves, reducing the near‑term electoral impact.
Takeaway: Midterm results will be a regulatory inflection point for the industry; watch Senate outcomes and bill progress for directional clarity.
#USMidtermElections #CryptoRegulation #Bitcoin #Altcoins
11
·
--
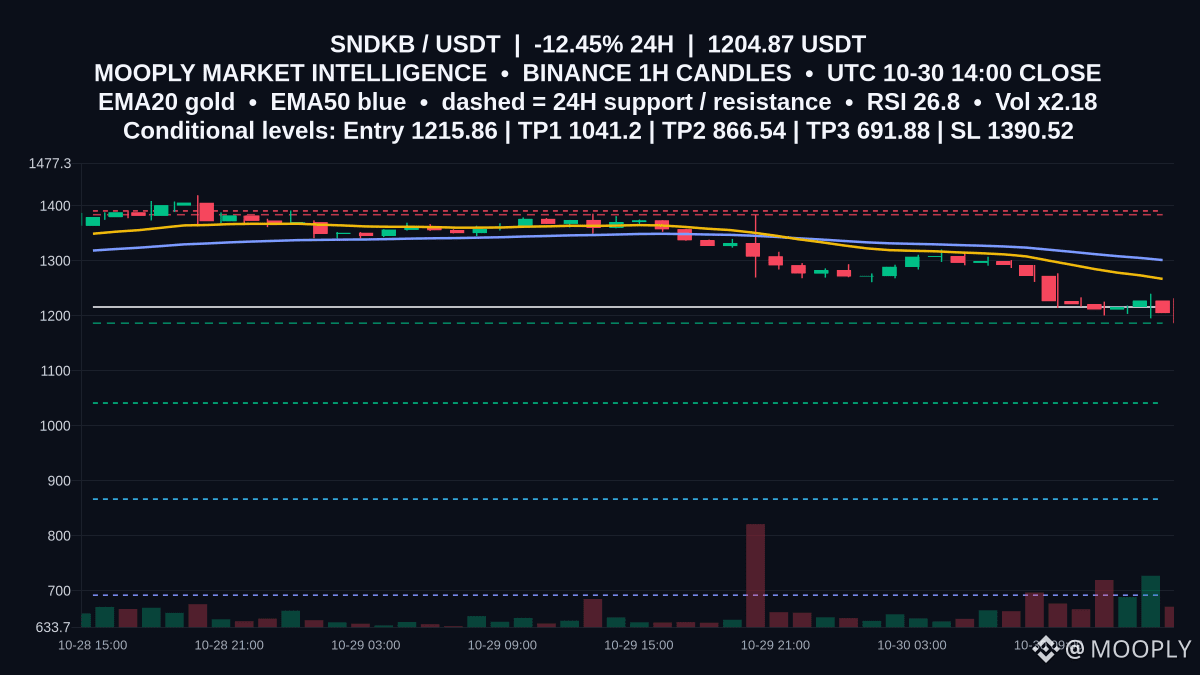
Sell pressure bites $SNDKB, down -12.445% in 24h to 1204.87 as the 1h trend weakens.
Price sits beneath EMA20 1266.94 and EMA50 1301.19, both pointing down; MACD is below signal and RSI at 26.82 flags soft momentum. The nearby 1186.46 support is pivotal; losing it would open room lower, while 1383.65 remains the key cap above, with volume running about 2.18x on the drop.
📍 Potential entry: 1215.86
🎯 Target 1: 1041.2
🎯 Target 2: 866.54
🛑 Stop / invalidation: 1390.52
Bearish scenario strengthens on a 1h rejection near 1215.86 and a break/close below 1186.46; that confirms downside toward 1041.2, then 866.54. Reclaiming 1383.65 and tagging 1390.52 would invalidate the setup.
Should I alert you if 1186.46 breaks or if price instead bases above it?
Not financial advice.
#SNDKB #PriceActionNotes #DownsideLevels
Sell pressure bites $SNDKB , down -12.445% in 24h to 1204.87 as the 1h trend weakens.
Price sits beneath EMA20 1266.94 and EMA50 1301.19, both pointing down; MACD is below signal and RSI at 26.82 flags soft momentum. The nearby 1186.46 support is pivotal; losing it would open room lower, while 1383.65 remains the key cap above, with volume running about 2.18x on the drop.
📍 Potential entry: 1215.86
🎯 Target 1: 1041.2
🎯 Target 2: 866.54
🛑 Stop / invalidation: 1390.52
Bearish scenario strengthens on a 1h rejection near 1215.86 and a break/close below 1186.46; that confirms downside toward 1041.2, then 866.54. Reclaiming 1383.65 and tagging 1390.52 would invalidate the setup.
Should I alert you if 1186.46 breaks or if price instead bases above it?
Not financial advice.
#SNDKB #PriceActionNotes #DownsideLevels
6
·
--
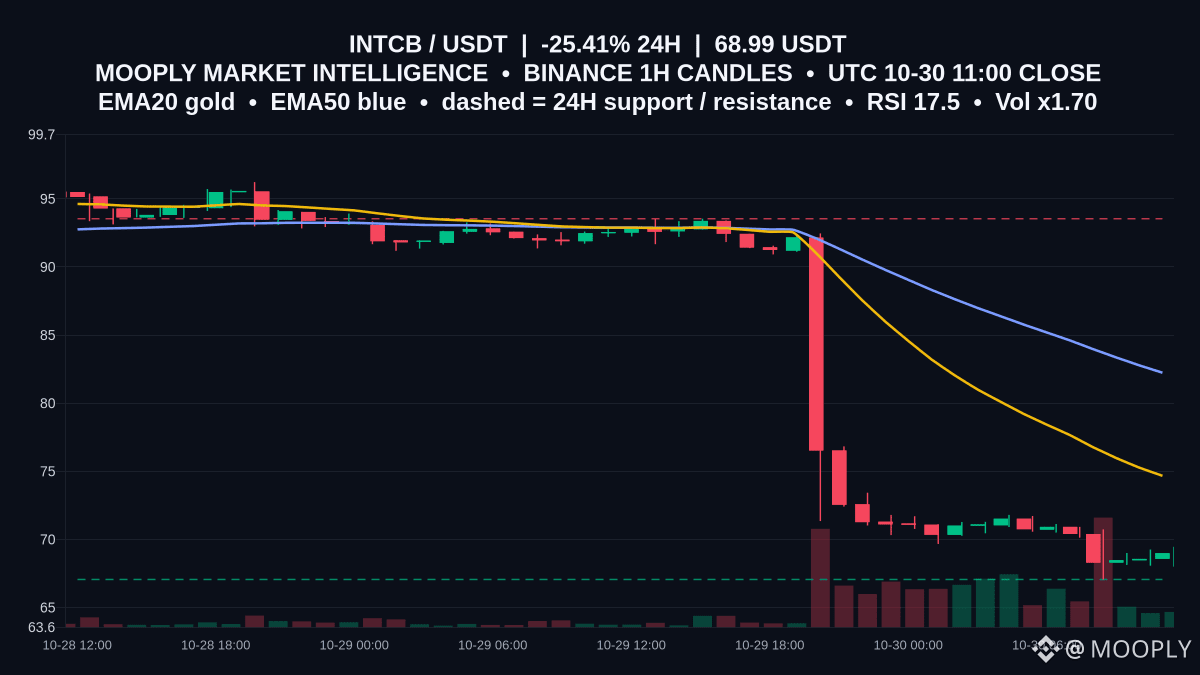
Down -25.411% in 24h, $INTCB sits at 68.99, perched just above a mapped floor.
RSI at 17.49 signals extreme short‑term exhaustion, yet the trend bias remains down with EMA20 at 74.668 below EMA50 at 82.235. That makes the nearby levels do the heavy lifting.
Range view: support at 67.06 and resistance at 93.54 define the box. Holding 67.06 keeps the base intact, while 93.54 has capped rebounds.
Confirmation comes from repeated hourly closes above 67.06 and a reclaim of 74.668; invalidation is an hourly close below 67.06. Strength toward the top requires clearing 82.235 on the way to 93.54.
Do you want updates if price tests 67.06 again or if it starts reclaiming 74.668?
Not financial advice.
#INTCB #PriceActionNotes #RangeLevels
2
·
--
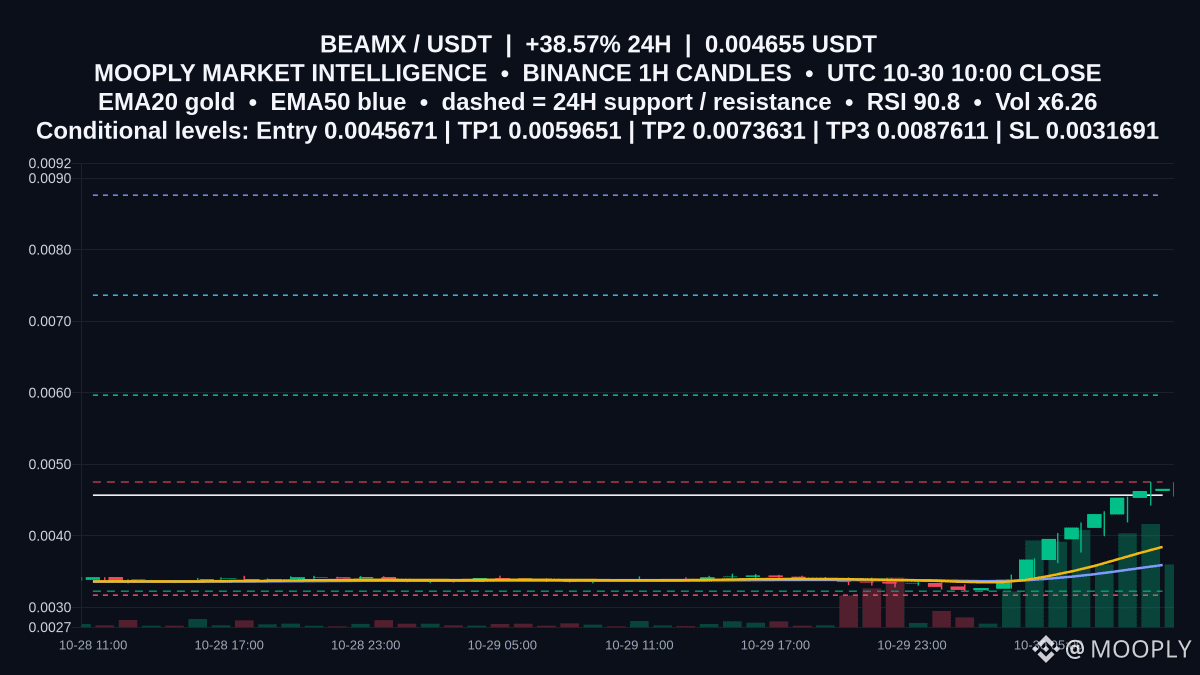
Momentum has snapped awake for $BEAMX: +38.569% in 24h to 0.004655 with volume x6.26.
RSI 90.84 flags an overextended push, yet EMA20 0.0038445 > EMA50 0.0035912 and a positive MACD keep trend bias constructive. The nearby 0.004751 resistance is the key pivot; 0.003224 is the support to defend.
📍 Potential entry: 0.0045671
🎯 Target 1: 0.0059651
🎯 Target 2: 0.0073631
🛑 Stop / invalidation: 0.0031691
Confirmation would be a clean 1h close and hold above 0.004751, opening room toward 0.0059651 and 0.0073631. Failure to reclaim 0.0045671 with drift toward 0.003224 warns of exhaustion; below 0.0031691 the scenario is invalid.
Want an alert on the next hourly close relative to 0.004751?
Not financial advice.
#BEAMX #PriceActionNotes #UpsideLevels
Momentum has snapped awake for $BEAMX : +38.569% in 24h to 0.004655 with volume x6.26.
RSI 90.84 flags an overextended push, yet EMA20 0.0038445 > EMA50 0.0035912 and a positive MACD keep trend bias constructive. The nearby 0.004751 resistance is the key pivot; 0.003224 is the support to defend.
📍 Potential entry: 0.0045671
🎯 Target 1: 0.0059651
🎯 Target 2: 0.0073631
🛑 Stop / invalidation: 0.0031691
Confirmation would be a clean 1h close and hold above 0.004751, opening room toward 0.0059651 and 0.0073631. Failure to reclaim 0.0045671 with drift toward 0.003224 warns of exhaustion; below 0.0031691 the scenario is invalid.
Want an alert on the next hourly close relative to 0.004751?
Not financial advice.
#BEAMX #PriceActionNotes #UpsideLevels
1
·
--
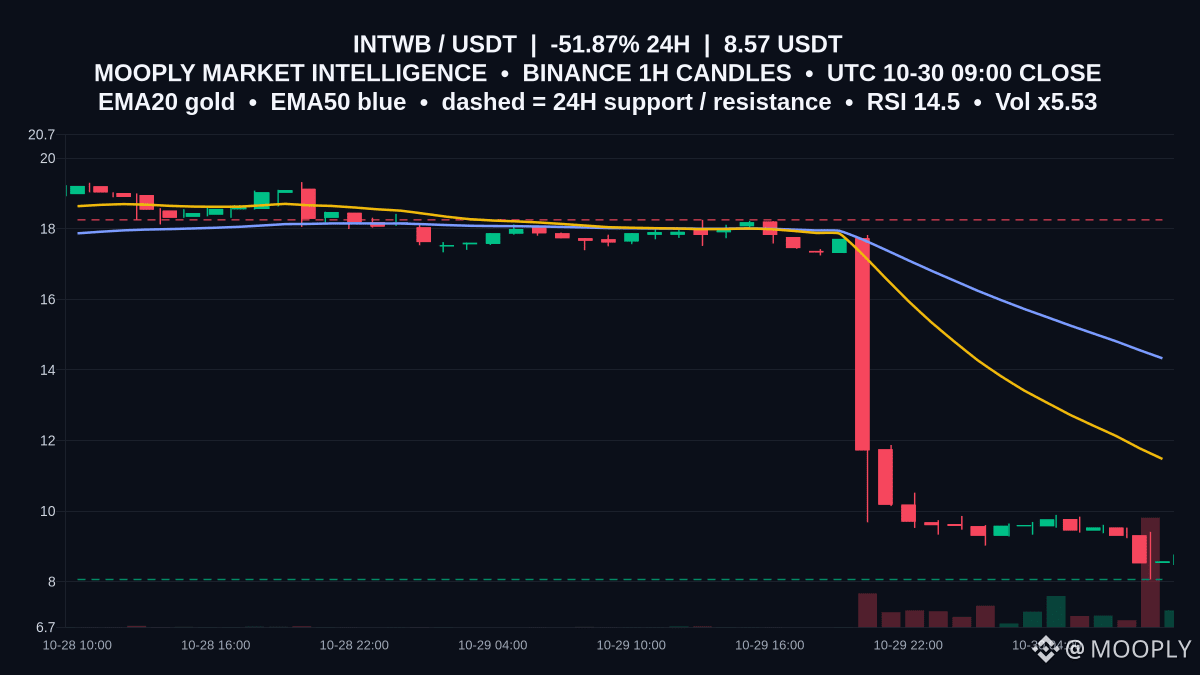
After a -51.871% 24h slide, $INTWB is parked just above a make-or-break floor.
Price at 8.57 hovers over 8.06 support, with RSI 14.53 very weak and EMA20 11.474 below EMA50 14.325. That matters because falling EMAs tend to act as layered resistance, capping rebounds until momentum steadies.
Range view: support 8.06, resistance 18.25. The range idea holds while hourly closes defend 8.06; a reclaim of 11.474, then 14.325 would be the first constructive steps toward 18.25. A decisive hourly close below 8.06 would invalidate this floor and keep downside pressure active.
Which level are you watching on the next 1h close first: 8.06 or 11.474?
Not financial advice.
#INTWB #PriceActionNotes #RangeLevels
6
·
--
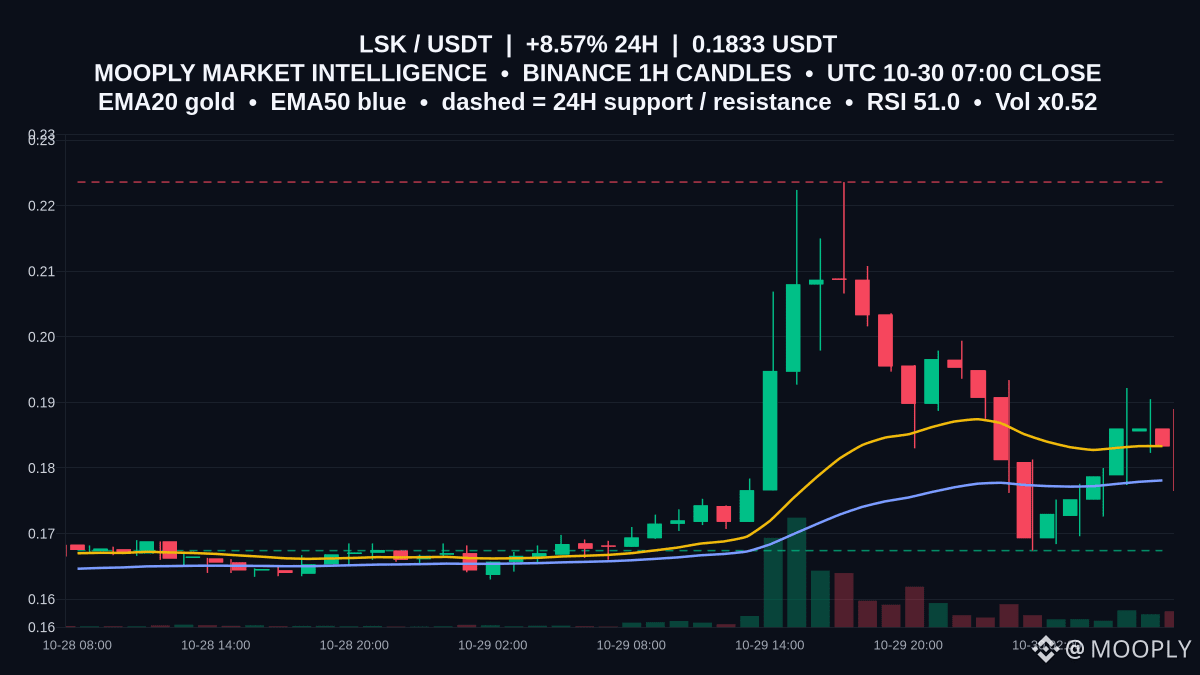
Snug against its moving pivot, $LSK is up 8.566% at 0.1833, kissing the 1h EMA20 at 0.18333.
EMA20 above EMA50 (0.18333 > 0.17811) hints at short‑term control, yet RSI 51.01, MACD below its signal (0.00121773 < 0.0027189), and a muted volume pace (x0.52) keep things balanced. That makes the band crucial: support at 0.1674 and resistance at 0.2236.
In a range context, buyers can probe toward 0.2236 while defending the 0.17811–0.1674 zone. An hourly close above 0.2236 would confirm expansion; a close beneath 0.1674 would signal a breakdown beyond support.
Are you prioritizing a clean break of 0.2236 or a retest of 0.1674 first?
Not financial advice.
#LSK #PriceActionNotes #RangeLevels
93
·
--
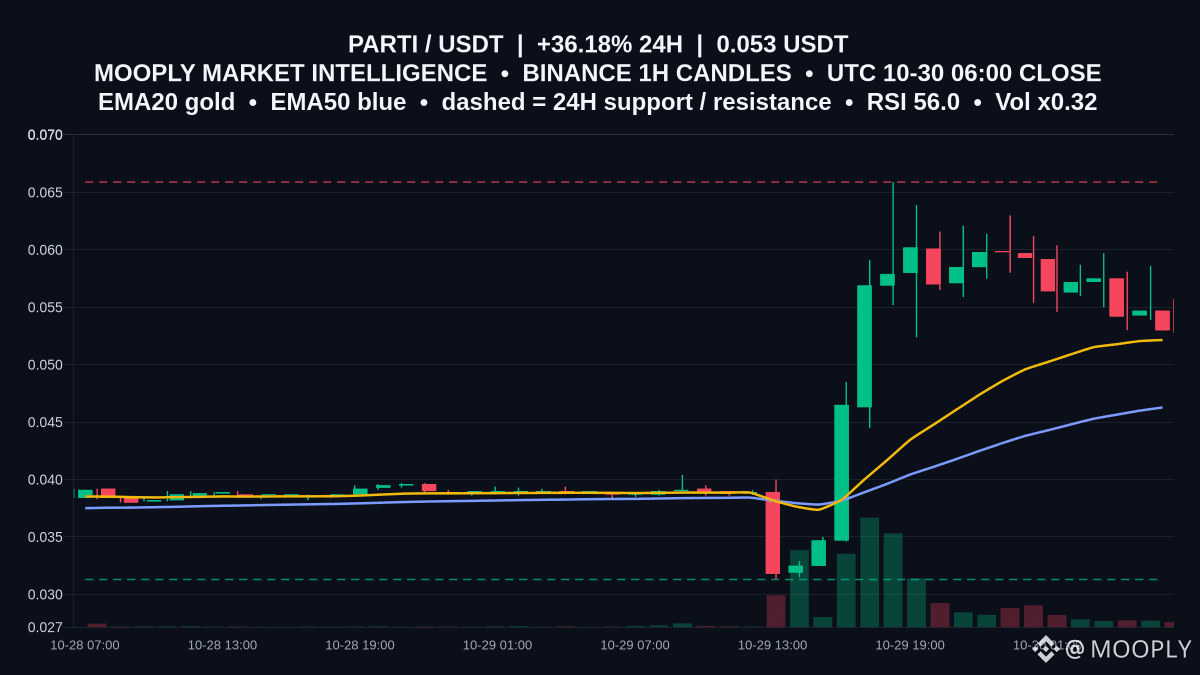
$PARTI is trading at 0.053 after a 36.176% 24h pop, but the last 6h slipped -10.62%, flagging a pause.
Why it matters: EMA20 at 0.05215 sits above EMA50 at 0.04628, a constructive short‑term tilt, yet RSI 56.01 with MACD below its signal suggests momentum is cooling rather than accelerating.
Range context: resistance stands at 0.0659 and support at 0.0313. With ATR14 at 0.00634, it likely takes multiple 1h sessions to traverse the full band, and recent wicks failed under 0.0659.
A 1h close and sustained hold above 0.0659 would shift bias higher; slipping back under 0.05215 exposes 0.04628, while losing 0.0313 would break the range idea. Which level do you expect to be tested first: 0.0659 or 0.0313?
Not financial advice.
#PARTI #PriceActionNotes #RangeLevels
146
·
--
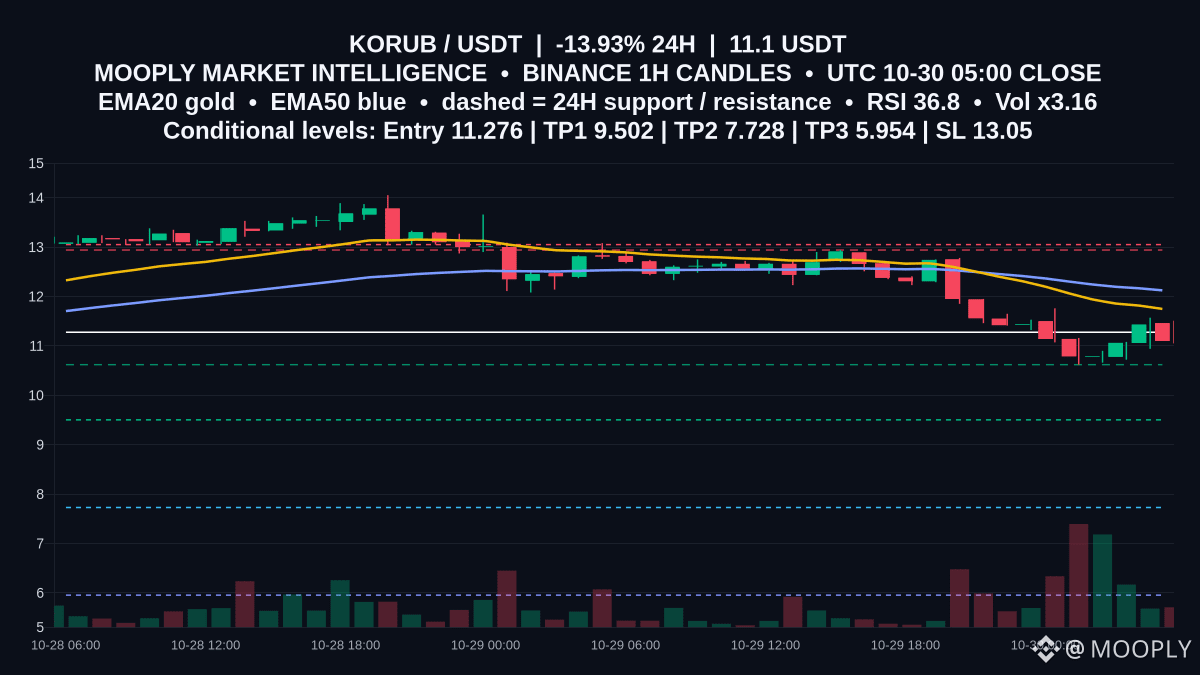
Selling pressure deepened on $KORUB, down -13.93% over 24h, as hourly momentum stays weak.
Price is below EMA20 11.748 and EMA50 12.124, with RSI 36.79 and a negative MACD, keeping bears in control. 12.94 is the ceiling that capped rebounds, while 10.62 is the nearby floor; volume at 3.16x underscores the move.
📍 Potential entry: 11.276
🎯 Target 1: 9.502
🎯 Target 2: 7.728
🛑 Stop / invalidation: 13.05
Bearish bias strengthens if a rejection near 11.276 rolls over toward 10.62; a loss of 10.62 would expose 9.502. A 1h close above 12.94, or any push to 13.05, invalidates and shifts focus back to the EMAs.
Would you like an alert if price retests 10.62 or closes an hour above 12.94?
Not financial advice.
#KORUB #PriceActionNotes #DownsideLevels
Selling pressure deepened on $KORUB , down -13.93% over 24h, as hourly momentum stays weak.
Price is below EMA20 11.748 and EMA50 12.124, with RSI 36.79 and a negative MACD, keeping bears in control. 12.94 is the ceiling that capped rebounds, while 10.62 is the nearby floor; volume at 3.16x underscores the move.
📍 Potential entry: 11.276
🎯 Target 1: 9.502
🎯 Target 2: 7.728
🛑 Stop / invalidation: 13.05
Bearish bias strengthens if a rejection near 11.276 rolls over toward 10.62; a loss of 10.62 would expose 9.502. A 1h close above 12.94, or any push to 13.05, invalidates and shifts focus back to the EMAs.
Would you like an alert if price retests 10.62 or closes an hour above 12.94?
Not financial advice.
#KORUB #PriceActionNotes #DownsideLevels
28
·
--
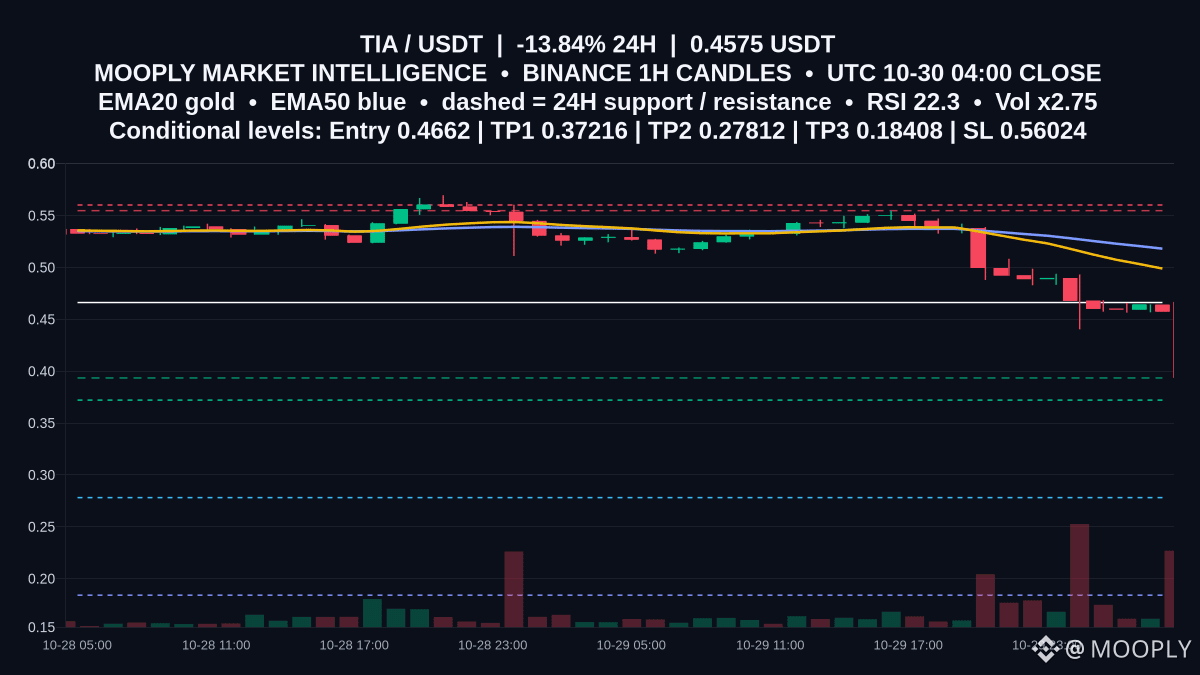
Fresh downside momentum: -13.838% in 24h puts $TIA at 0.4575, with volume running 2.75x its recent pace.
RSI 22.27 is stretched, yet price sits under EMA20 0.49896 and EMA50 0.51815—trend still skewed lower. Key resistance is 0.5548; nearest support 0.3935.
📍 Potential entry: 0.4662
🎯 Target 1: 0.37216
🎯 Target 2: 0.27812
🛑 Stop / invalidation: 0.56024
Bearish continuation is favored if a bounce toward 0.4662 fails and hourly closes stay beneath 0.49896/0.51815, keeping 0.3935 in play. A firm close above 0.5548 or a move to 0.56024 would invalidate.
Would you wait for a rejection near 0.4662, or prefer a clean breakdown toward 0.3935 before engaging?
Not financial advice.
#TIA #PriceActionNotes #DownsideLevels
116
Log in to explore more content
Join global crypto users on Binance Square
⚡️ Get latest and useful information about crypto.
💬 Trusted by the world’s largest crypto exchange.
👍 Discover real insights from verified creators.
Email / Phone number
Trending Topics
UniswapA16zSeekDeFiExemptionFromIllinoisCryptoTax
45,126 views
979 Discussing
#CryptoTax 🚨 CRYPTO MARKET & REGULATORY UPDATE #HKDollarStablecoinHKDAPToLaunchOnSolana
#uniswapa16zseekdefiexemptionfromillinoiscryptotax UNISWAP, a16z & DeFi Education Fund Challenge Illinois Crypto Tax Rules
October 30, 2026 | Market Volatility & Industry Developments
📊 1. MARKET SNAPSHOT
Crypto markets are showing mixed signals, with selected assets posting sharp gains while several major cryptocurrencies remain under pressure.
📈 Top reported gainers
SOPH: +60.81% — $0.00238
BEAMX: +37.94% — $0.004701
SKDDB: +16.81% — $9.38
📉 Notable reported losers
INTWUSDT: −61.09% — $6.72
AKEUSDT: −31.47% — $0.013989
SNXXUSDT: −30.71% — $6.43
🔎 Major crypto assets under pressure
DOGE: −5.06%
PEPE: −4.91%
SUI: −4.83%
NEAR: −3.28%
XRP: −3.13%
Uniswap Labs, Andreessen Horowitz (a16z), and the DeFi Education Fund (DEF) are pushing for exemptions from Illinois’
#Uniswap #a16z #DeFi #CryptoRegulation #Illinois # #Web3 #BinanceSquare
#HKDollarStablecoinHKDAPToLaunchOnSolana #HKDAP #Stablecoin #CryptoNews #Blockchain #DeFi #DigitalPayments
⚖️ 3. UNISWAP, a16z & ILLINOIS CRYPTO TAX RULES
Uniswap Labs, Andreessen Horowitz (a16z), and the DeFi Education Fund are associated with efforts to seek exemptions proposed Illinois crypto tax requirements.
The debate highlights a key question: How should tax-reporting obligations apply to decentralized that may not operate like traditional financial intermediaries?
The outcome could influence DeFi compliance, developer obligations, and the future regulatory environment.
#BinanceSquare #CryptoNews #HKDAP #Stablecoin #Uniswap #a16z #DeFi #CryptoTax
CHASEPA SULUXù
·2 Likes
·514 views
HKDollarStablecoinHKDAPToLaunchOnSolana
32,799 views
631 Discussing
$1.5BInLeveragedCryptoBetsLiquidated
65,235 views
281 Discussing