

#marketcontext
marketcontext
3,681 views
55 Discussing
Hot
Latest

·
--
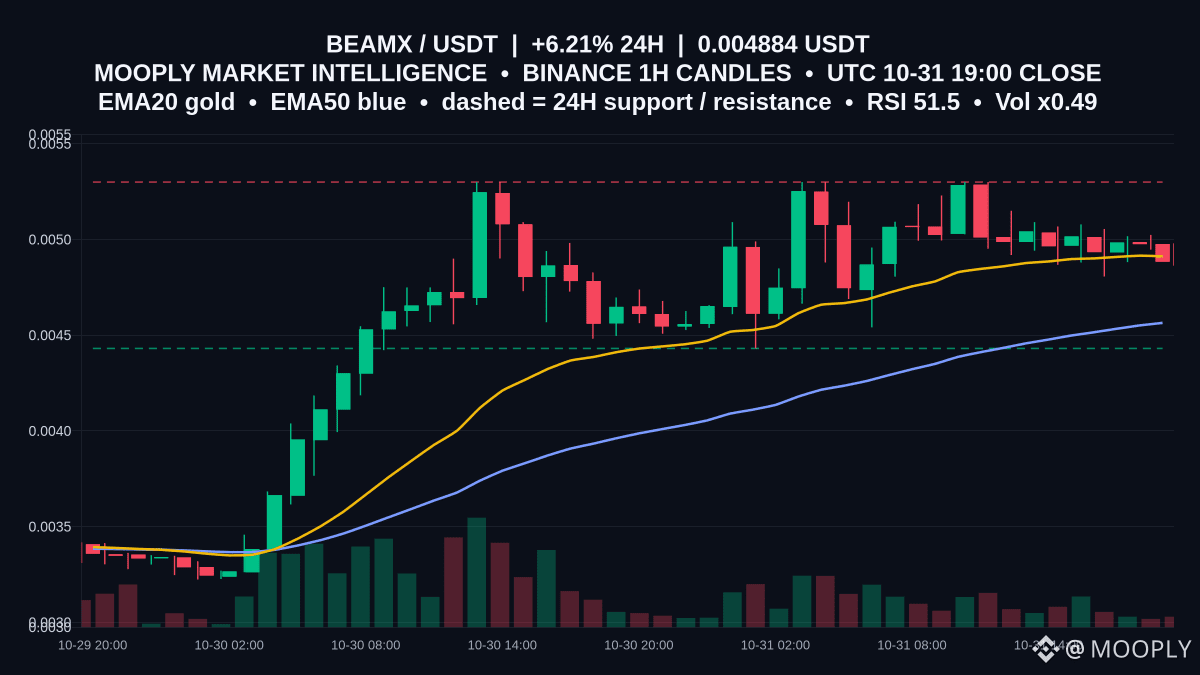
$BEAMX is pausing at 0.004884 after a +6.208% day, boxed between nearby moving averages.
Price sits just under EMA20 0.0049125 while holding above EMA50 0.0045645—this squeeze often decides the next push. With RSI 51.51 and MACD below its signal, momentum is muted and participation is light (vol x0.49).
Range setup: support at 0.004431 and resistance at 0.0053. The range holds while 0.004431 attracts bids and 0.0053 caps bounces. A firm 1h close above 0.0053 would confirm expansion; a close below 0.004431 would tilt bias lower.
Are you watching a reclaim of 0.0049125 first, or a liquidity sweep toward 0.004431?
Not financial advice.
#BEAMX #MarketContext #RangeWatch
5
·
--
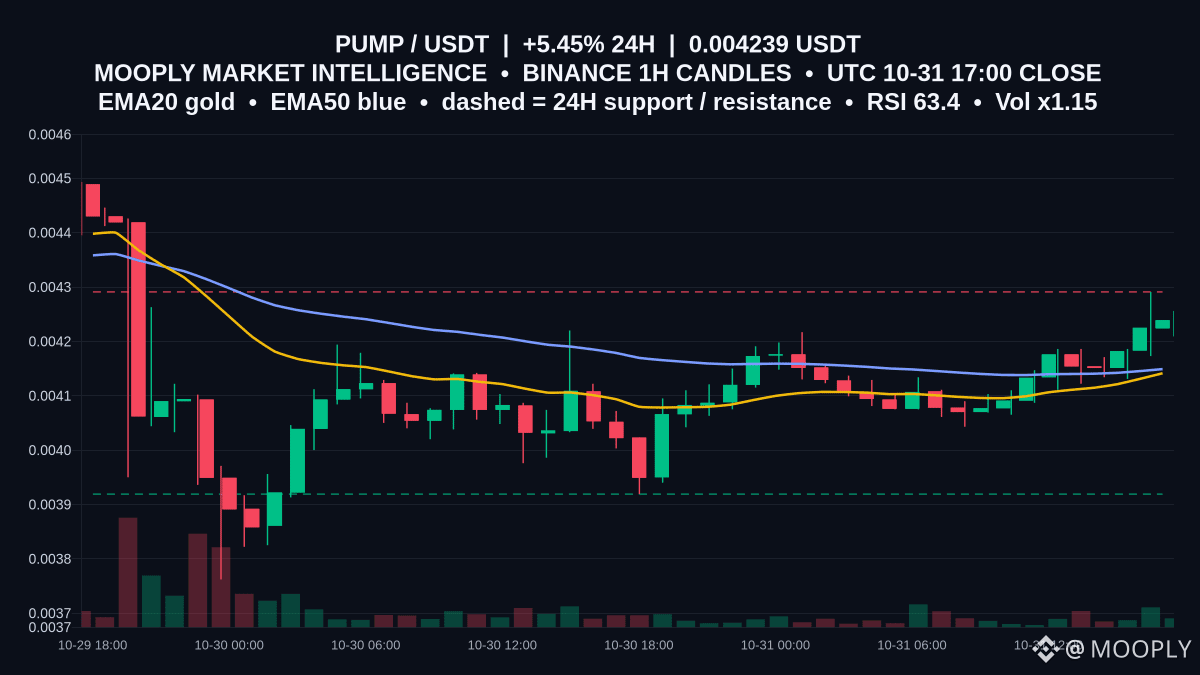
Pressing the top of its recent band, $PUMP is up 5.45% on the day.
Price sits at 0.004239, above EMA20 0.0041413 and EMA50 0.004149, with RSI 63.4 and a positive MACD over its signal—constructive but not stretched. The key level is 0.004291 resistance, which capped prior advances; it frames the range with 0.003919 as support.
In this RANGE setup, sellers have leaned on 0.004291 while buyers stepped in above 0.003919. The EMA cluster at 0.0041413–0.004149 is a useful intraband pivot; holding above it favors repeated retests of the ceiling.
A 1h close and acceptance above 0.004291 would confirm a break; rejection there or a loss of 0.003919 keeps the range intact. With volume slightly elevated (1.15x), follow-through is key.
Are you watching for a clean hourly close over 0.004291, or a rotation back toward the EMA zone first?
Not financial advice.
#PUMP #MarketContext #RangeWatch
3
·
--
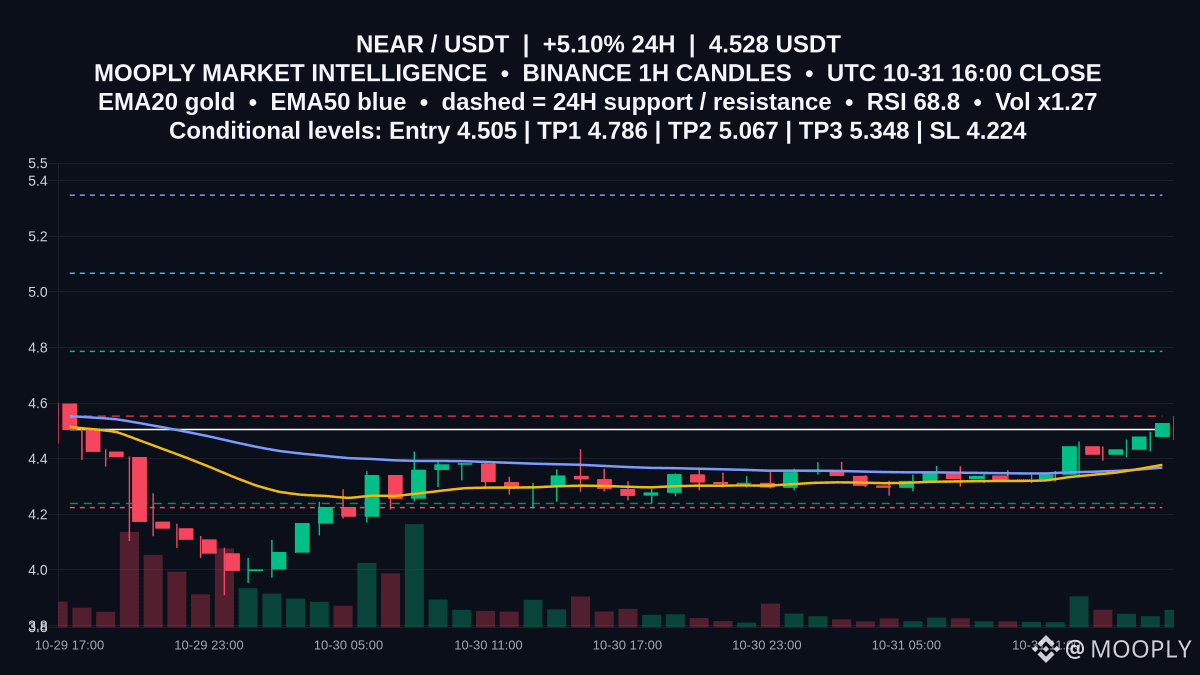
Buyers just nudged $NEAR to 4.528, approaching the nearby 4.553 ceiling.
On the 1h view, EMA20 at 4.378 sits above EMA50 at 4.368 while RSI prints 68.82—momentum is positive into resistance at 4.553. The key daily support below is 4.239, defining the risk window.
📍 Potential entry: 4.505
🎯 Target 1: 4.786
🎯 Target 2: 5.067
🛑 Stop / invalidation: 4.224
A pullback that holds near 4.505 and then a firm 1h close above 4.553 would confirm follow‑through toward 4.786 and 5.067. Losing 4.368 (EMA50) and especially the 4.239 support would weaken the setup, with the scenario invalidated at 4.224.
Would you like an update if the next hourly candle closes above 4.553?
Not financial advice.
#NEAR #MarketContext #UpsideScenario
2
·
--
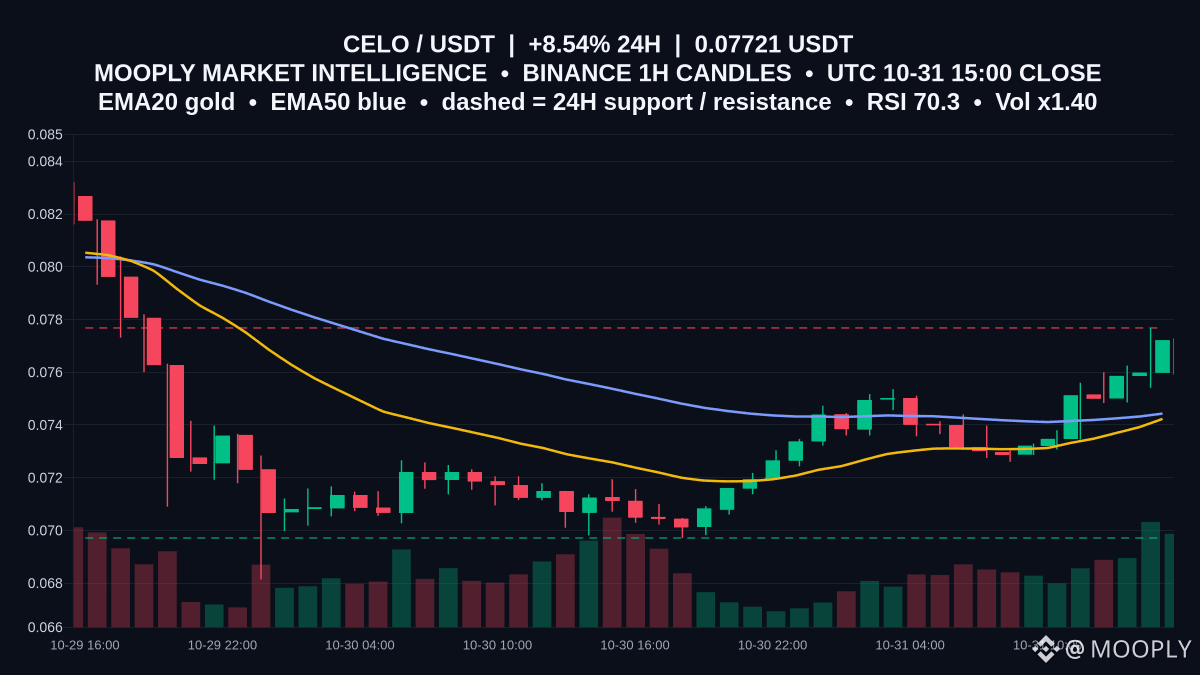
Bid pressure returns to $CELO with a 24h gain of 8.544% and price at 0.07721, sitting just beneath defined resistance at 0.07768.
Why it matters: RSI is elevated at 70.35 while price trades above EMA20 0.07423 and EMA50 0.07443, making that moving-average band the immediate test if momentum cools.
Range view: resistance 0.07768, support 0.06971. ATR14 at 0.00121 implies typical 1h swings can reject moves near the top. A firm 1h close above 0.07768 would signal range expansion; failure keeps rotation toward 0.07423–0.07443 and, if that fails, 0.06971. MACD stays positive (0.00076563 vs 0.00034641).
Will you watch for an hourly close over 0.07768, or a fade toward the 0.07423–0.07443 zone?
Not financial advice.
#CELO #MarketContext #RangeWatch
·
--
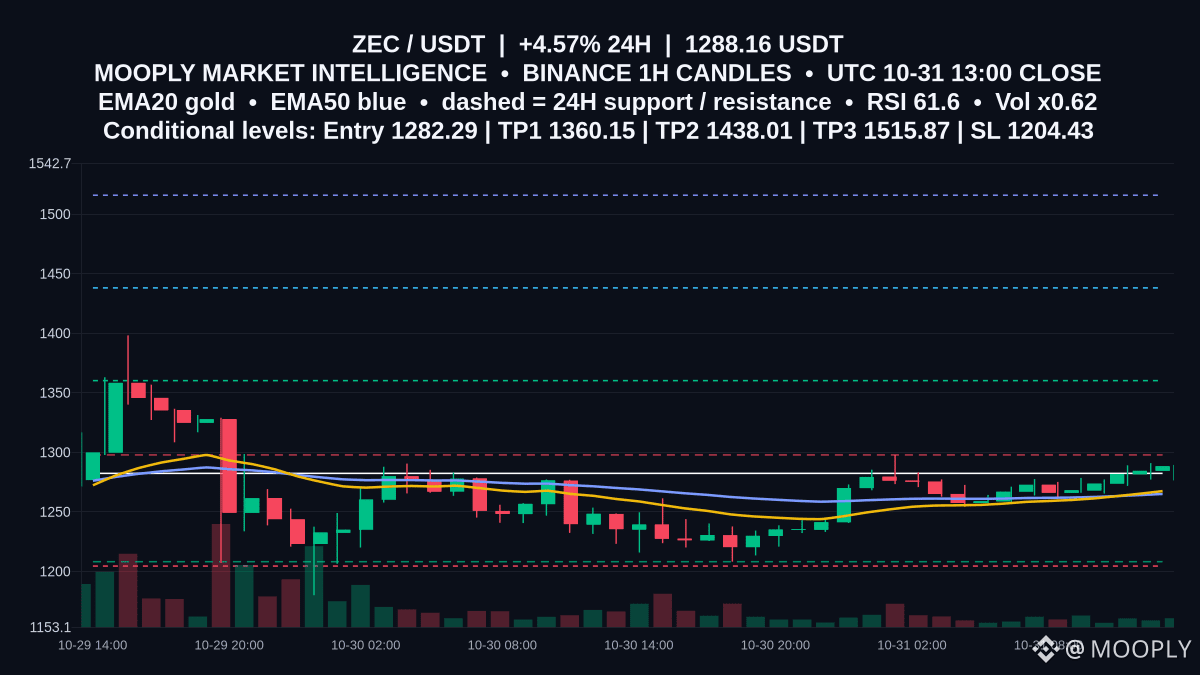
$ZEC is pressing toward nearby 1h resistance at 1297.77 after a +4.57% day.
Why this matters: EMA20 (1267.39) now sits above EMA50 (1264.98) and RSI at 61.61 suggests constructive momentum, but 1297.77 remains the lid. A clean break could unlock the mapped upside levels.
📍 Potential entry: 1282.29
🎯 Target 1: 1360.15
🎯 Target 2: 1438.01
🛑 Stop / invalidation: 1204.43
Confirmation would be a 1h close and hold above 1297.77; failure there keeps price capped inside 1208.1–1297.77. The scenario is invalidated on a loss of 1208.1 or if 1204.43 prints. Are you watching for a reclaim and retest of 1297.77 before momentum extends?
Not financial advice.
#ZEC #MarketContext #UpsideScenario
5
·
--
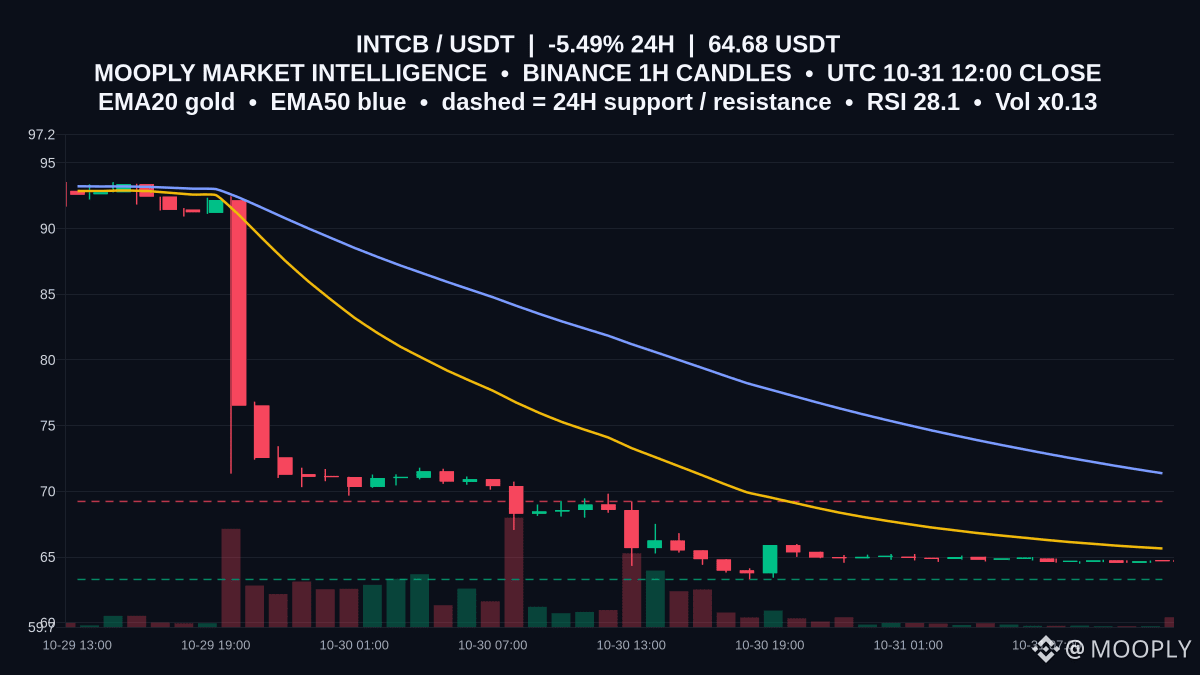
$INTCB trades at 64.68 as momentum cools; RSI is 28.07 and MACD sits beneath its signal, reflecting ongoing pressure after recent weakness.
Why it matters: price is below a falling EMA20 (65.65) and well under EMA50 (71.372), so rebounds into these averages risk fading. The tape is defined by a nearby range and lighter turnover (Vol x0.13).
Range view: 63.29 is the key support and 69.23 the ceiling. Holding above 63.29 keeps mean‑reversion attempts toward 65.65 and 69.23 in play; repeated rejection at 69.23 preserves seller control. An hourly close above 69.23 opens room toward 71.372, while a close below 63.29 exposes fresh lows.
Are you watching 63.29 for confirmation, or waiting for an hourly close back above 69.23?
Not financial advice.
#INTCB #MarketContext #RangeWatch
1
·
--
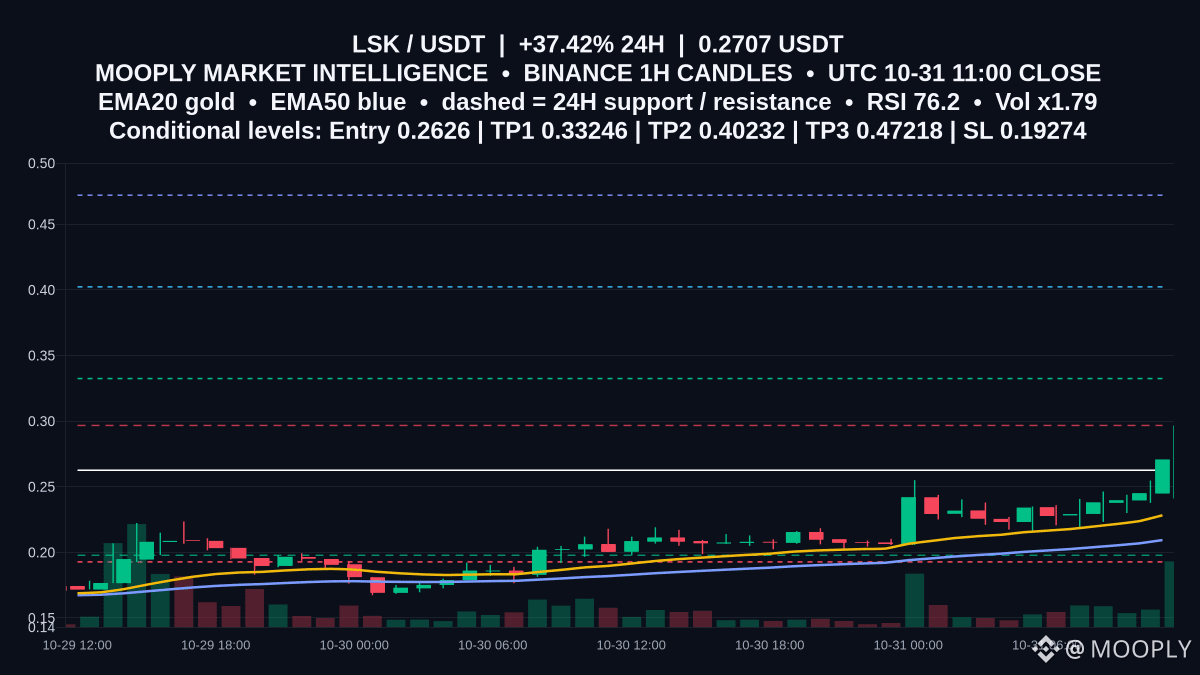
$LSK just surged +37.42% in 24h to 0.2707, with 12,971,532.50975 in volume across 271,624 trades.
EMA20 at 0.22827 above EMA50 at 0.20938 signals bullish structure, while MACD stays above its signal. But RSI 76.16 flags a stretched move as price presses toward the 0.2967 resistance; 0.1978 is the nearest proven 1h support.
📍 Potential entry: 0.2626
🎯 Target 1: 0.33246
🎯 Target 2: 0.40232
🛑 Stop / invalidation: 0.19274
Confirmation improves with an hourly close holding above 0.2626 and a push through 0.2967. Losing 0.2626 would weaken momentum; a close below 0.1978 would undermine the setup and puts 0.19274 as hard invalidation.
Want an alert if the next 1h close challenges 0.2967?
Not financial advice.
#LSK #MarketContext #UpsideScenario
1
·
--
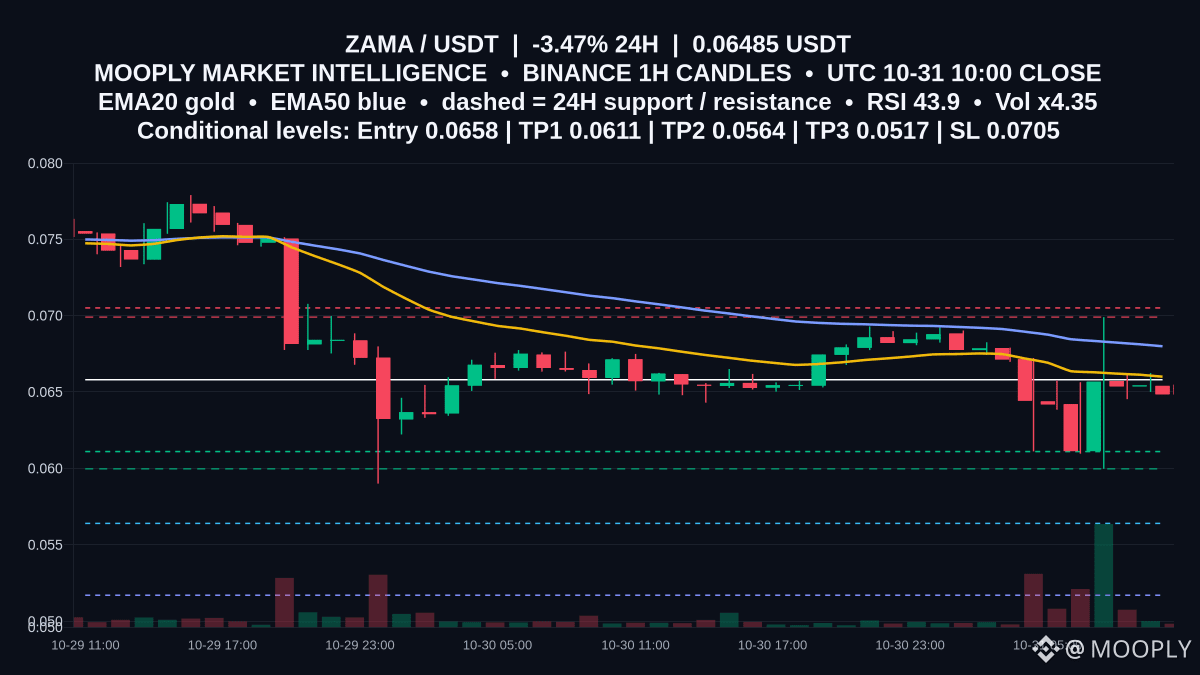
Spotlight on $ZAMA: 0.06485, down -3.472% over 24h.
Price sits below EMA20 0.066 and EMA50 0.06799, with RSI 43.92 and MACD below its signal (−0.00087763 < −0.00081243), keeping bias heavy. The 0.0699 area is the cap, while 0.05997 is the nearest firm support. ATR14 at 0.00238 suggests room for measured follow-through.
📍 Potential entry: 0.0658
🎯 Target 1: 0.0611
🎯 Target 2: 0.0564
🛑 Stop / invalidation: 0.0705
A rejection near 0.0658 beneath the 0.066/0.06799 EMA cluster would favor continuation toward 0.0611 and 0.0564, with 0.05997 a key checkpoint. A sustained close above 0.0705 would invalidate by reclaiming 0.0699 and breaking the short-term bearish structure.
Which level are you watching first, 0.0699 or 0.05997?
Not financial advice.
#ZAMA #MarketContext #DownsideScenario
Spotlight on $ZAMA : 0.06485, down -3.472% over 24h.
Price sits below EMA20 0.066 and EMA50 0.06799, with RSI 43.92 and MACD below its signal (−0.00087763 < −0.00081243), keeping bias heavy. The 0.0699 area is the cap, while 0.05997 is the nearest firm support. ATR14 at 0.00238 suggests room for measured follow-through.
📍 Potential entry: 0.0658
🎯 Target 1: 0.0611
🎯 Target 2: 0.0564
🛑 Stop / invalidation: 0.0705
A rejection near 0.0658 beneath the 0.066/0.06799 EMA cluster would favor continuation toward 0.0611 and 0.0564, with 0.05997 a key checkpoint. A sustained close above 0.0705 would invalidate by reclaiming 0.0699 and breaking the short-term bearish structure.
Which level are you watching first, 0.0699 or 0.05997?
Not financial advice.
#ZAMA #MarketContext #DownsideScenario
2
·
--
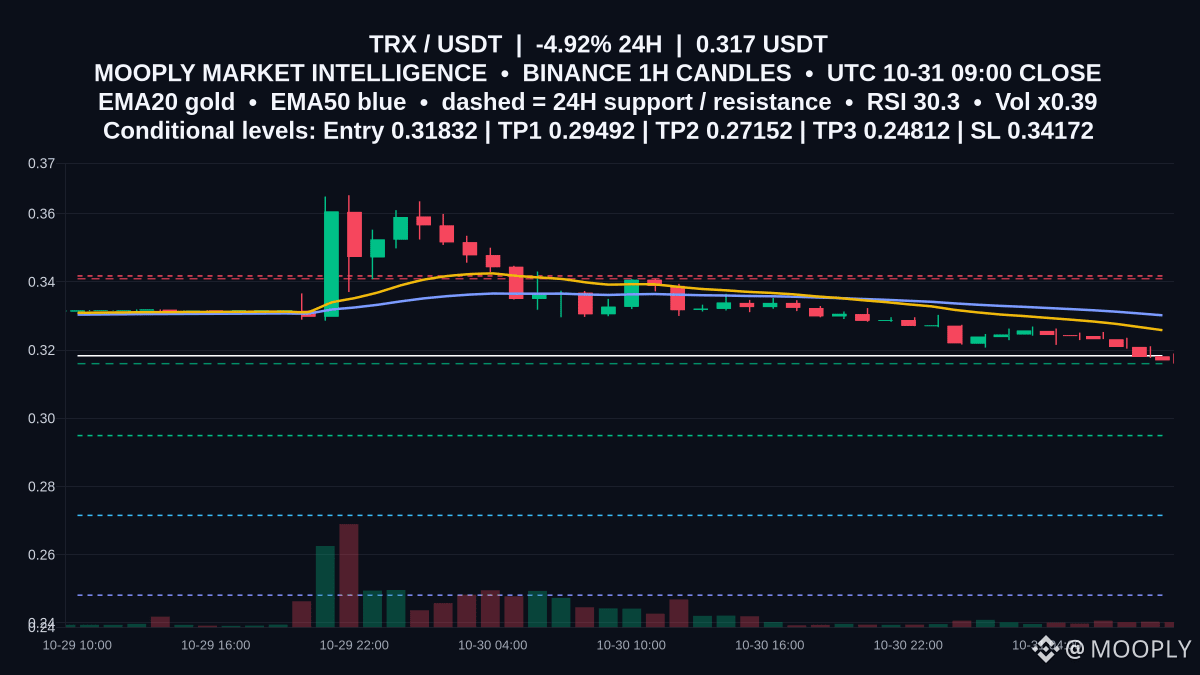
Bearish momentum grips $TRX at 0.317, down 4.919% over 24h.
Price sits beneath EMA20 0.32581 and EMA50 0.33018, with RSI at 30.28. The nearby 0.316 support is pivotal—losing it would favor continuation—while 0.3409 caps the upside. MACD below signal (-0.00420805 vs -0.00350399) adds to downside pressure.
📍 Potential entry: 0.31832
🎯 Target 1: 0.29492
🎯 Target 2: 0.27152
🛑 Stop / invalidation: 0.34172
Confirmation improves on a 1h close below 0.316 and failure to reclaim it on retests. A push back above 0.3409—and especially through 0.34172—would invalidate. Want an alert if 0.316 breaks or if price first retests 0.31832?
Not financial advice.
#TRX #MarketContext #DownsideScenario
·
--
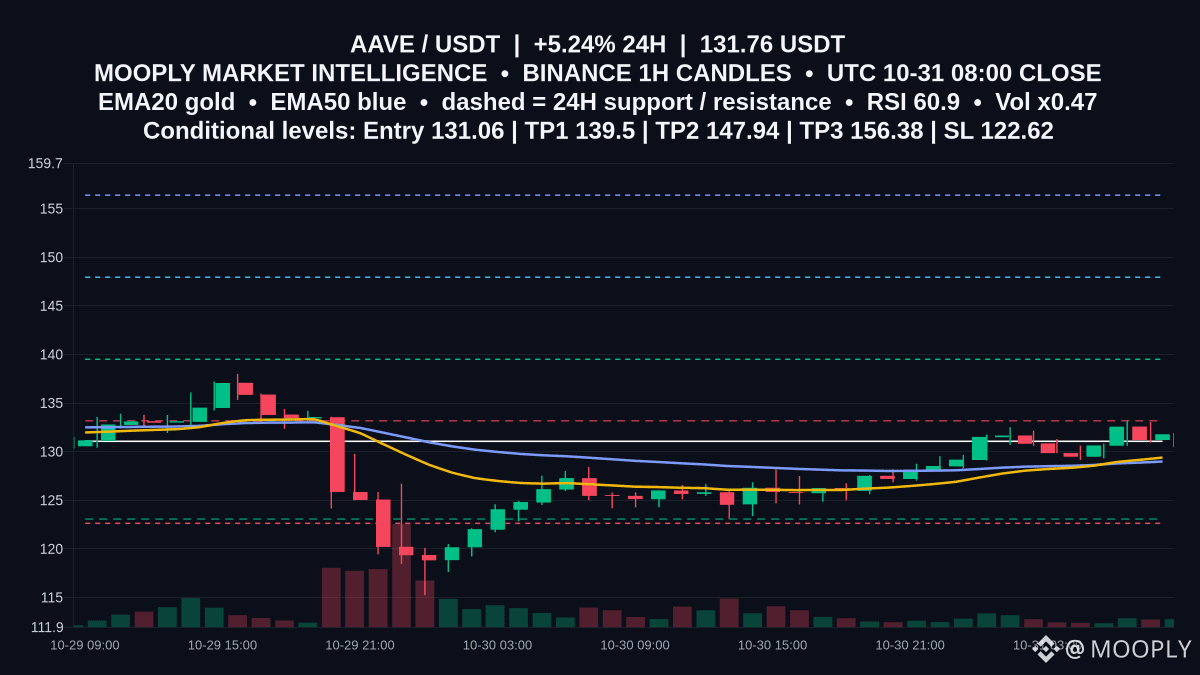
Up 5.24% in 24h, $AAVE is pressing into 133.17 resistance.
Why it matters: EMA20 at 129.39 sits above EMA50 at 128.98 with RSI 60.93, pointing to a constructive bias; a clean 1h close through 133.17 could unlock continuation, while lighter participation (0.47x) makes that breakout test critical.
📍 Potential entry: 131.06
🎯 Target 1: 139.5
🎯 Target 2: 147.94
🛑 Stop / invalidation: 122.62
Confirmation comes with a 1h close above 133.17 that holds as support. Rejection there and a slip under 129.39 would weaken the setup; sustained trade below 123.06 invalidates. Want a ping if 133.17 flips to support on the next 1h close?
Not financial advice.
#AAVE #MarketContext #UpsideScenario
1
·
--
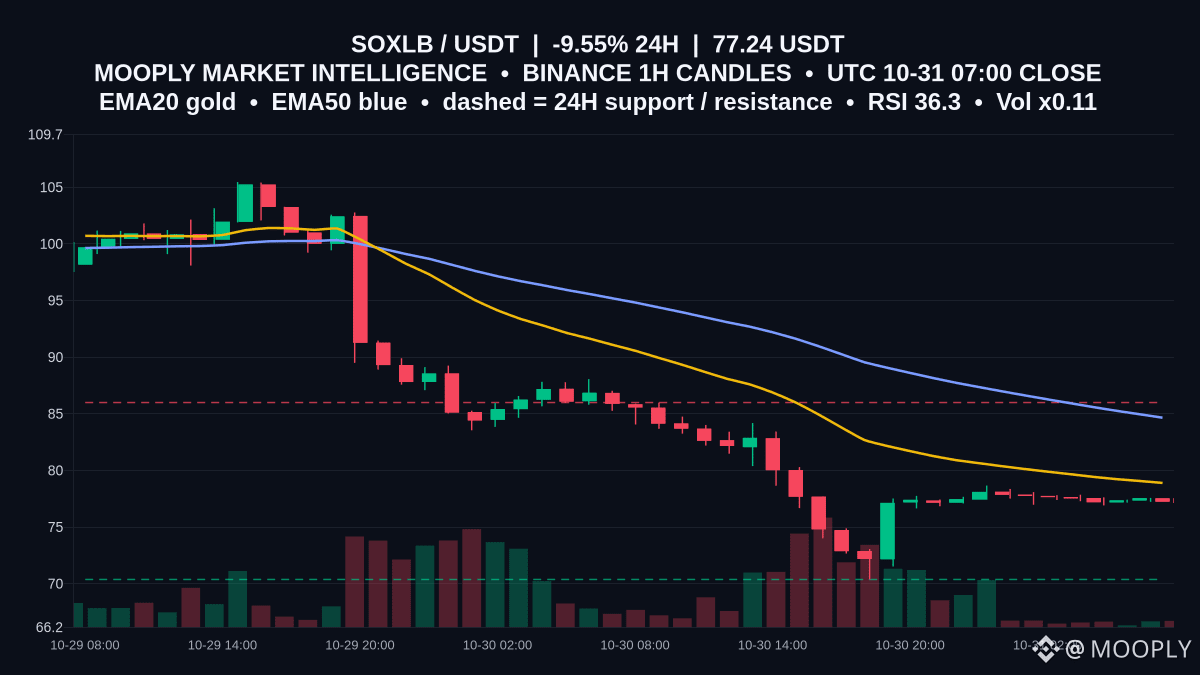
Range is tightening on $SOXLB after a sharp 24h drop to 77.24 (-9.553%).
Price sits beneath EMA20 78.891 and EMA50 84.651, so the short-term bias stays heavy, while RSI 36.28 signals weak but not oversold momentum. MACD at -2.45467439 is above its signal -3.15024382, hinting downside pressure may be easing, and volume participation is thin at 0.11x.
For now, the band is clear: support 70.37 and resistance 85.99. Respecting this range favors mean reversion around SMA20 77.495; a 1h close above 85.99 would tilt toward recovery, while a break below 70.37 would extend the slide. Which side are you watching to be tested first?
Not financial advice.
#SOXLB #MarketContext #RangeWatch
3
·
--
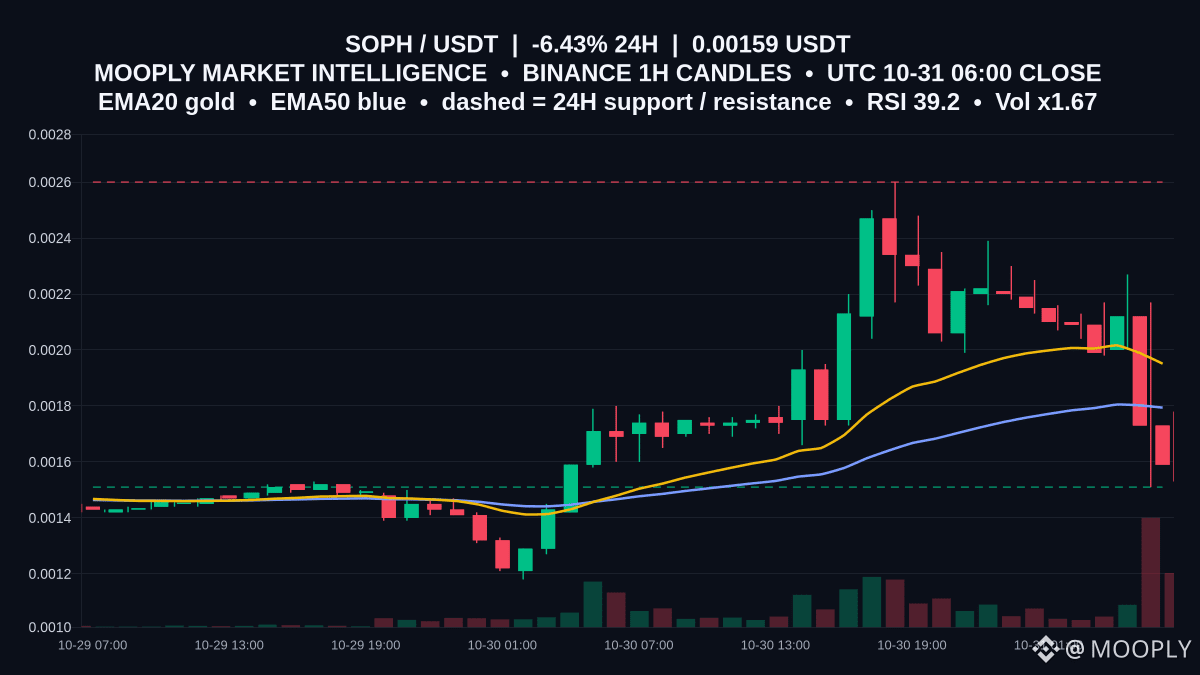
$SOPH trades at 0.00159, hovering just above mapped support at 0.00151 after a -26.05% 6h slide.
Price is below EMA20 0.0019512 and EMA50 0.001794; with RSI 39.15 and MACD beneath its signal (0.00004674 < 0.00012146), momentum leans weak, so reacting to nearby levels becomes critical.
Range context: support 0.00151, resistance 0.0026. With ATR 0.0002657, swings inside this band can be meaningful; watch the 1h closes near 0.00151.
A 1h close back above 0.0019512 would bolster a recovery toward 0.0026; a decisive close below 0.00151 would shift bias lower. A clean break and hold above 0.0026 would mark range expansion.
Are you watching for a reaction at 0.00151 or waiting for a reclaim of 0.0019512 first?
Not financial advice.
#SOPH #MarketContext #RangeWatch
3
·
--
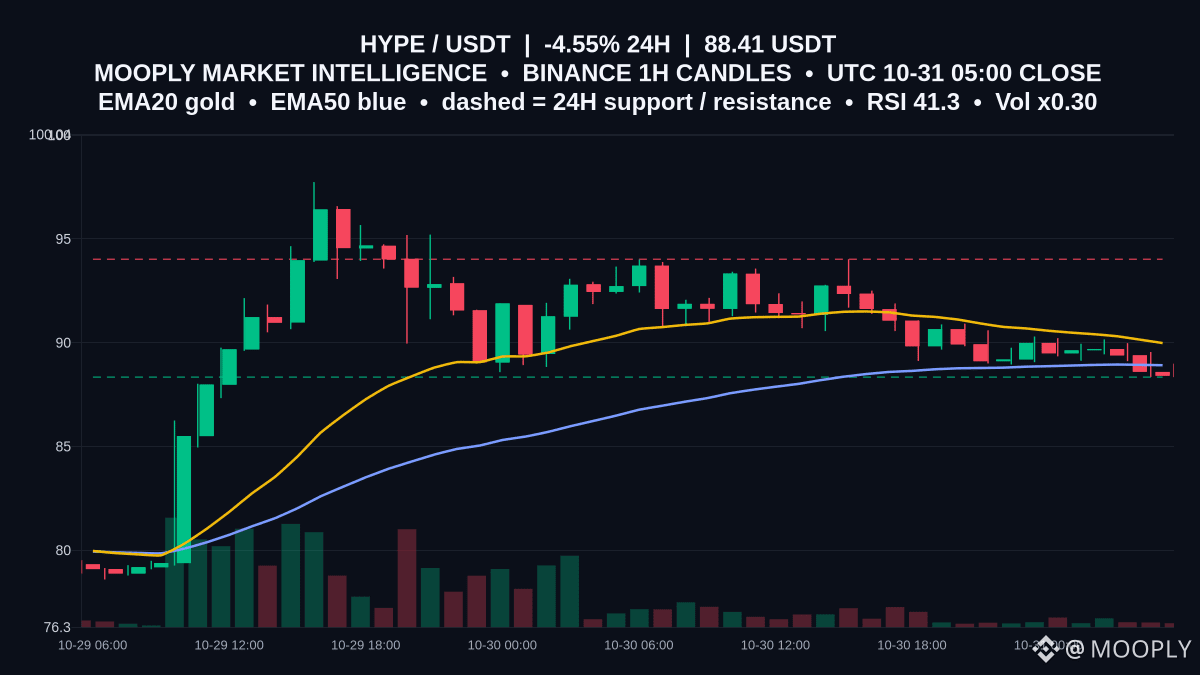
At 88.41 after -4.546% in 24h, $HYPE is hovering just above 88.34 support inside a 1h range capped by 94.02.
Why this matters: price is below EMA20 89.983 and EMA50 88.914, with RSI 41.3 and a negative MACD hinting momentum has cooled while volume runs near 0.3, so attempts to break the range may lack follow‑through.
Range view: holding 88.34 keeps the path open for rebounds toward 94.02. A sustained 1h close back above 89.983 would reinforce a bounce toward resistance, while a 1h close under 88.34 would hand control to sellers beyond the range.
Would you like an alert if 88.34 breaks or 94.02 gets tested?
Not financial advice.
#HYPE #MarketContext #RangeWatch
·
--
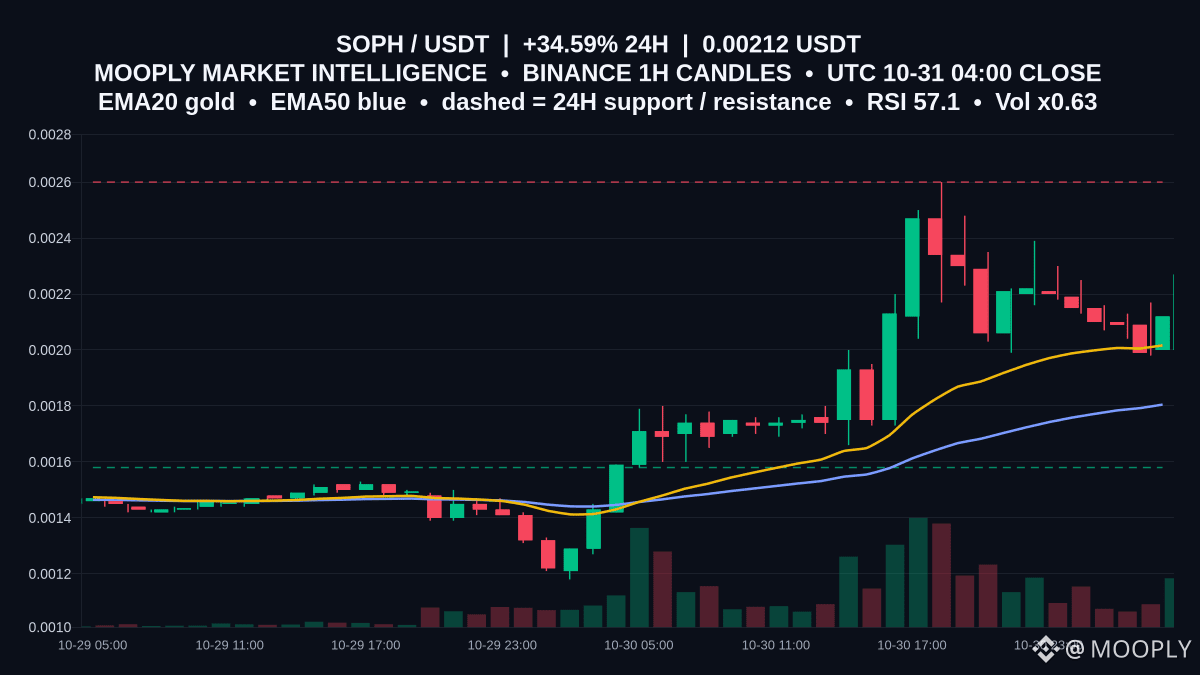
$SOPH surged +34.591% to 0.00212, but the latest hours show it catching its breath.
EMA20 at 0.0020165 now rides above EMA50 at 0.001805, signaling a short‑term uptrend. Still, RSI 57.08 and a MACD under its signal (0.00012655 vs 0.00015303) reflect cooling momentum after a -4.5% move over the last 6h.
Range in play: 0.00158 support to 0.0026 resistance. ATR14 at 0.00025 suggests room for brisk intraday swings while price digests gains. A decisive 1h close above 0.0026 would favor continuation; a break below 0.00158 would tilt control back to sellers. Are you watching for a retest of 0.0026 or a liquidity sweep toward 0.00158 first?
Not financial advice.
#SOPH #MarketContext #RangeWatch
1
·
--
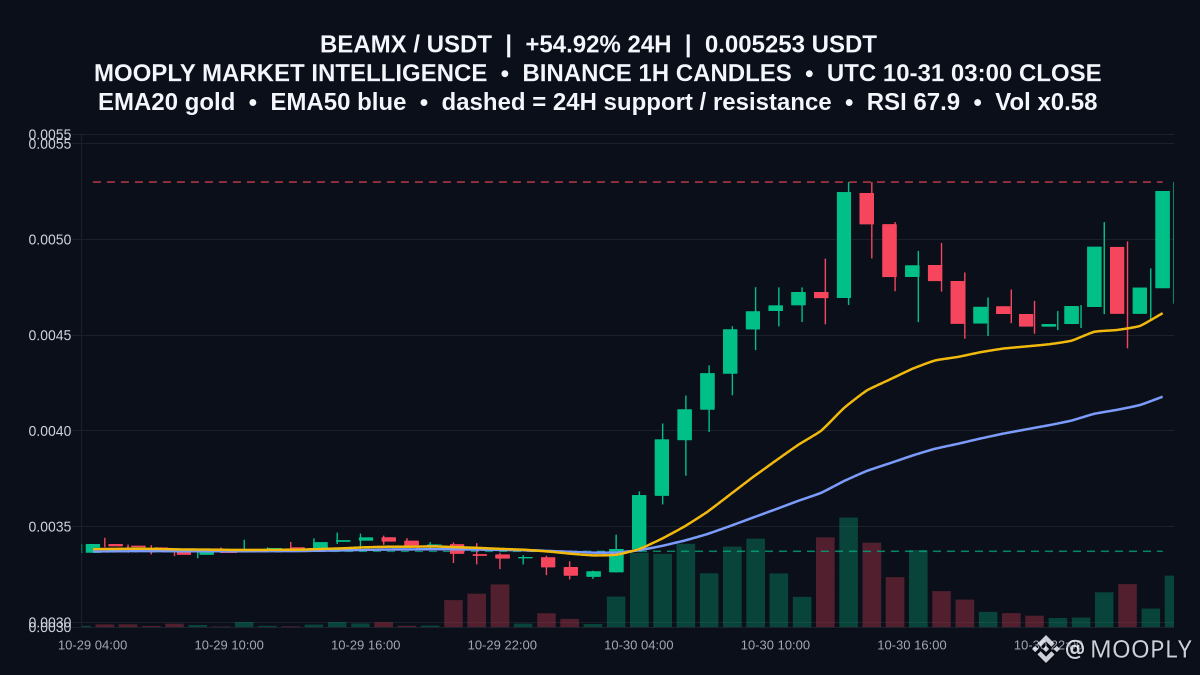
Momentum is hot but the lid is firm: $BEAMX just surged 54.922% in 24h to 0.005253, stalling right beneath a well-defined cap.
On the 1h, EMA20 at 0.0046154 sits above EMA50 at 0.004179, signaling constructive trend. That matters into nearby resistance, because sustained upside typically needs a clean break or risk of quick mean reversion grows as RSI hovers at 67.92.
Range active: resistance 0.0053 versus support 0.003371. With ATR at 0.0003171, intraband swings can be sharp, and price is currently tucked just under the ceiling.
A firm 1h close above 0.0053 would mark range expansion; failure there and a drift toward 0.0046154 keeps the chop intact, while a break below 0.003371 would flip the structure lower.
Which comes first on your watchlist: a confirmed close above 0.0053 or a retest of 0.0046154?
Not financial advice.
#BEAMX #MarketContext #RangeWatch
·
--
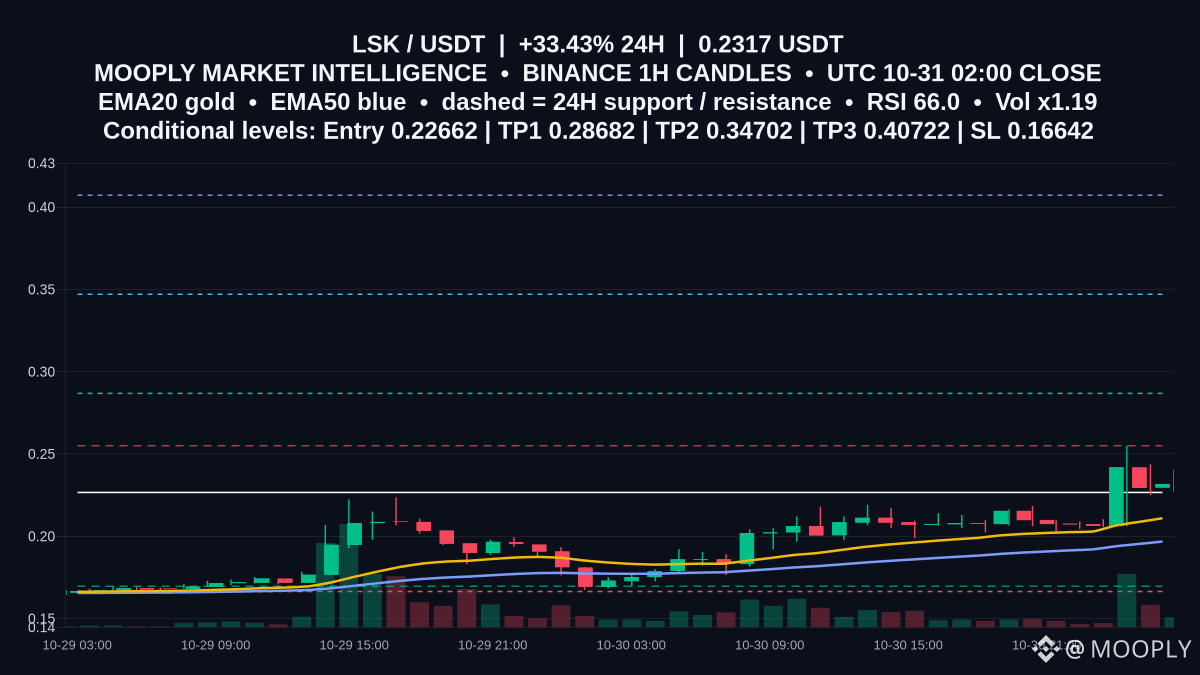
A 33.43% day lifts $LSK to 0.2317, putting fresh momentum on the 1h chart.
EMA20 at 0.21094 sits above EMA50 at 0.19677 with RSI 66.01, a constructive alignment. The nearby 0.255 resistance is the next decision point, while 0.1696 is the breakout base that underpins the move.
📍 Potential entry: 0.22662
🎯 Target 1: 0.28682
🎯 Target 2: 0.34702
🛑 Stop / invalidation: 0.16642
Confirmation improves on sustained closes above 0.22662 and a push through 0.255. A firm rejection at 0.255 risks a pullback toward the EMA20 area (0.21094) or 0.1696; a 1h close under 0.1696 leans toward the 0.16642 invalidation. Would you like alerts if 0.255 breaks or if we retest 0.22662?
Not financial advice.
#LSK #MarketContext #UpsideScenario
29
·
--
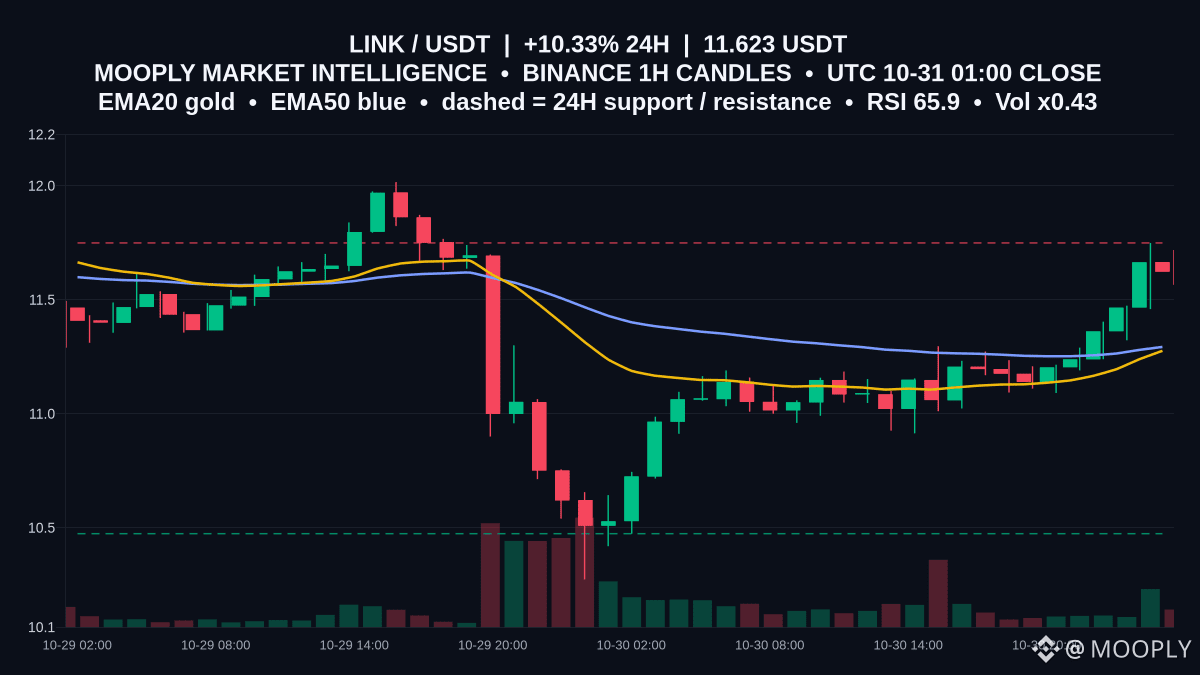
Momentum returns to $LINK, up 10.327% in 24h and pushing toward a defined ceiling.
On the 1h view, price is 11.623 with RSI 65.93 and a positive MACD, yet EMA20 at 11.276 still sits just under EMA50 at 11.293—momentum without a clear trend shift. That puts 11.749 in focus as pivotal resistance; repeated rejections there capped advances. The range floor is 10.474, where buyers previously stepped in. With ATR(14) at 0.167, swings can persist inside this band until a decisive move.
Will you wait for an hourly close through 11.749, or look for a fade back toward 11.276–11.293 and 10.474?
Not financial advice.
#LINK #MarketContext #RangeWatch
Momentum returns to $LINK , up 10.327% in 24h and pushing toward a defined ceiling.
On the 1h view, price is 11.623 with RSI 65.93 and a positive MACD, yet EMA20 at 11.276 still sits just under EMA50 at 11.293—momentum without a clear trend shift. That puts 11.749 in focus as pivotal resistance; repeated rejections there capped advances. The range floor is 10.474, where buyers previously stepped in. With ATR(14) at 0.167, swings can persist inside this band until a decisive move.
Will you wait for an hourly close through 11.749, or look for a fade back toward 11.276–11.293 and 10.474?
Not financial advice.
#LINK #MarketContext #RangeWatch
32
·
--
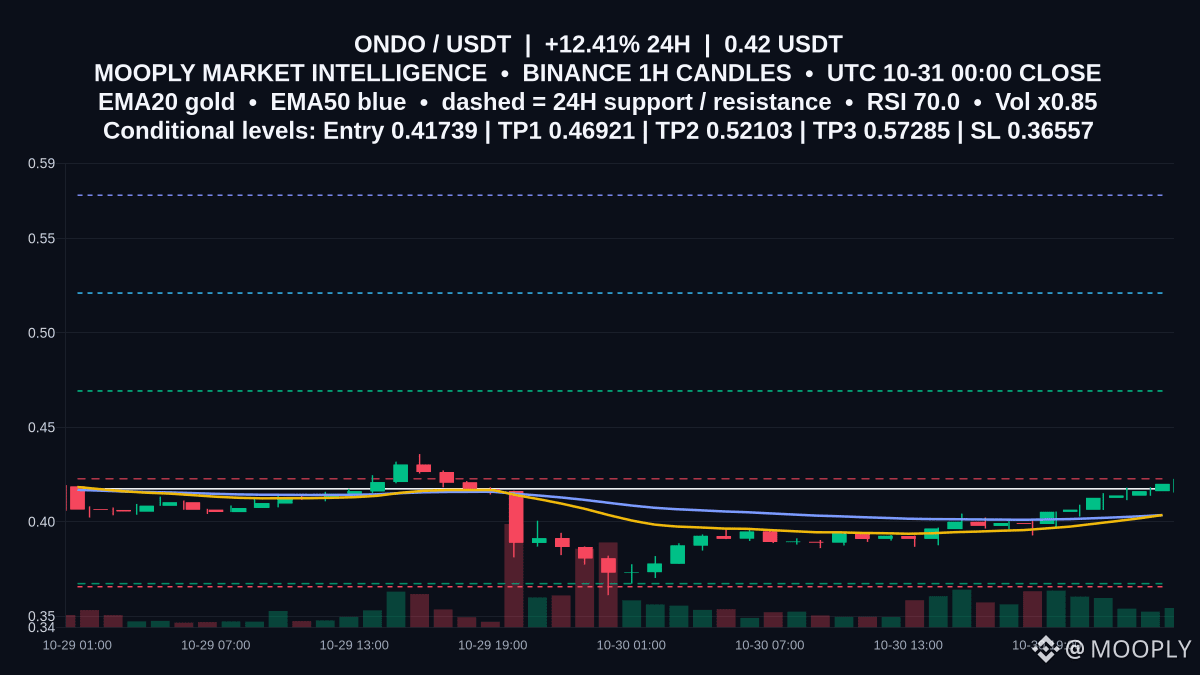
Breakout watch: $ONDO is pressing the 0.4227 ceiling after a +12.406% 24h move and a fresh 6h gain of 5.32. EMA20 (0.40352) has edged above EMA50 (0.4035) and RSI at 69.95 puts momentum at the threshold—making the next 1h close around resistance decisive.
📍 Potential entry: 0.41739
🎯 Target 1: 0.46921
🎯 Target 2: 0.52103
🛑 Stop / invalidation: 0.36557
A 1h close above 0.4227, followed by a steady retest hold, would confirm upside continuation; failure to sustain above 0.41739 and especially a break beneath 0.3672 would weaken the setup and tilt risk lower toward invalidation. Are you waiting for a clear candle close through 0.4227 before considering the scenario?
Not financial advice.
#ONDO #MarketContext #UpsideScenario
46
·
--
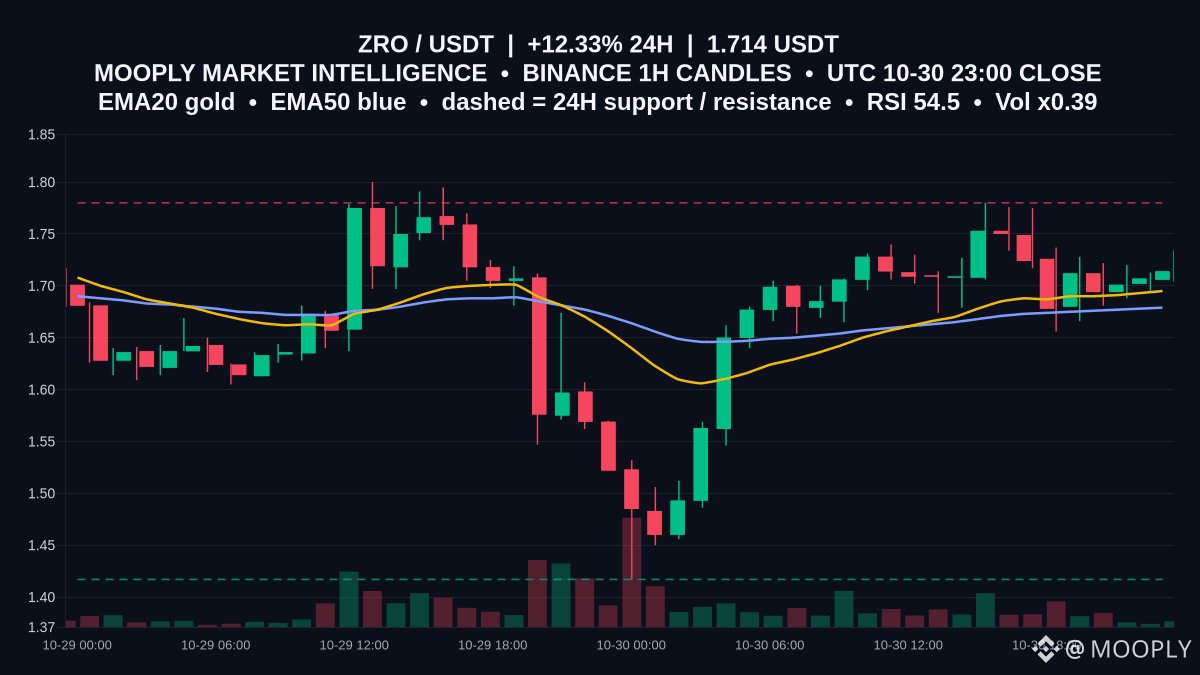
Momentum returned: $ZRO is up 12.328% in 24h at 1.714, but it’s still boxed inside a known range.
On the 1h, EMA20 at 1.695 sits above EMA50 at 1.679 while RSI at 54.47 is constructive without being stretched. With ATR at 0.045, swings are relatively tight, and repeated failure under 1.78 has capped progress.
This is a range: support is 1.417 and resistance is 1.78. A sustained close above 1.78 would signal range expansion; rejection there keeps chop intact, with 1.695–1.679 acting as the near-term pivot. Losing that zone on closes would refocus price toward 1.417.
Would you like an alert on the first hourly close above 1.78 or below 1.695?
Not financial advice.
#ZRO #MarketContext #RangeWatch
57
·
--
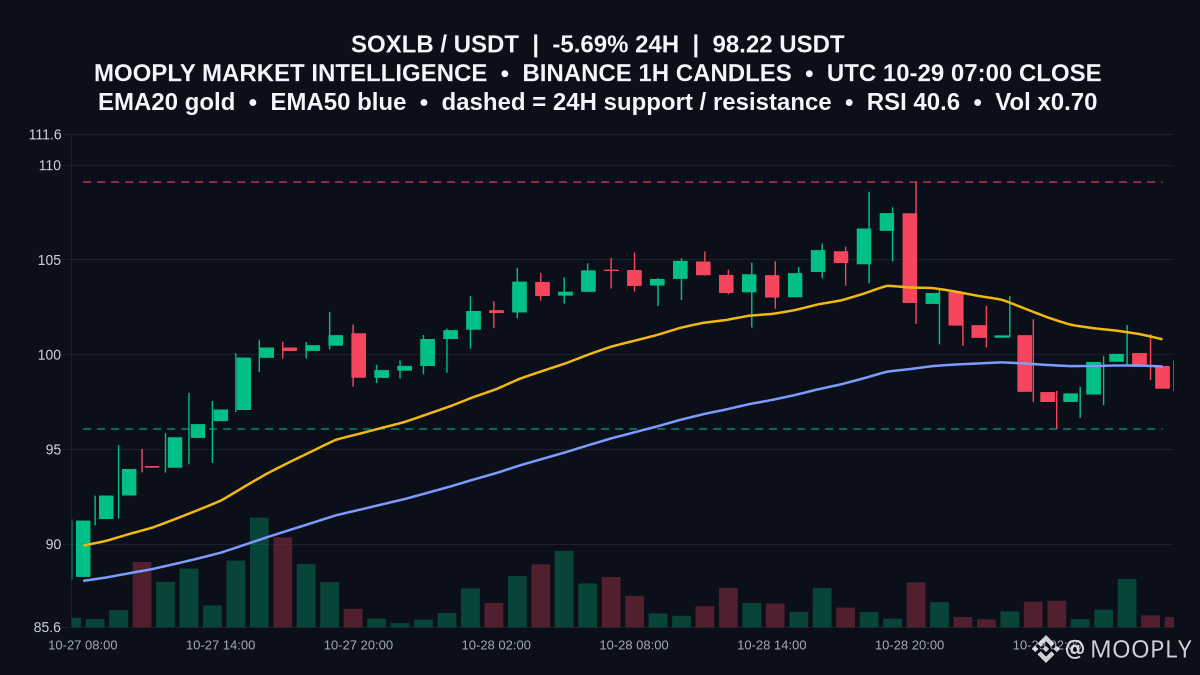
Back under the century mark, $SOXLB is down 5.692% in 24h, trading 98.22.
On the 1h, price sits below EMA20 100.815 and EMA50 99.382 while RSI 40.62 leans risk-off. That makes 96.08 a pivotal support from recent lows, with 109.11 the clear cap from the latest high—defining a broad range to respect.
With ATR at 3.004, moves between levels can come quickly. The range view holds while 96.08 contains dips; a 1h close back above 99.382 would be the first sign of repair, with further improvement above 100.815. A decisive close below 96.08 would invalidate the range bias and favor continuation lower.
Which trigger matters more to you here—the 99.382 reclaim or a breakdown of 96.08?
Not financial advice.
#SOXLB #MarketContext #RangeStructure
50
Log in to explore more content
Join global crypto users on Binance Square
⚡️ Get latest and useful information about crypto.
💬 Trusted by the world’s largest crypto exchange.
👍 Discover real insights from verified creators.
Email / Phone number
Trending Topics
1
#BinanceSAFUFundTransferCompleted7499BTC
22,418 views
584 Discussing
2
#BinanceRecovery90% of stolen assets
94,303 views
144 Discussing
3
#YiHe:ProofOfReserves:10TokensAt100%Backing
107,618 views
624 Discussing
4
#BackedNotBroken:RichardTengSaysUsersBearNoLoss
20,201 views
390 Discussing
5
#CZSaysCompensationIsinPlaceUsersAreProtected
104,810 views
1,290 Discussing
6
#IntelHasItsWorstDaySince1974
36,831 views
640 Discussing
7
#TRMCambodianCasinosReceived$1.07BInCrypto
9,453 views
66 Discussing
8
#USDCCirculationFallsAbout800MInSevenDays
59,221 views
679 Discussing
9
#SuspectedNorthKoreaAttacksAccountForNearly89%OfCryptoHackLosses
13,282 views
94 Discussing
10
#OpenAICutsFundraisingTargetBy$10B
3,043 views
72 Discussing