

Rixtasy
168 Posts

Rixtasy
Report
Block User
Spent a Year losing money just to earn experience and knowledge, now i’m ready for the Real Deal 😎
High-Frequency Trader
5.6 Years
55 Following
238 Followers
180 Liked
Posts
All
Quotes
PINNED
·
--

Article
How to Alt-Season: A Guide to Investing and Trading in Volatile Times to Guarantee ProfitsAltseason can be one of the most exciting yet dangerous times to be in the crypto market. With high volatility, huge price swings, and some coins moving like crazy, it’s easy to get swept up in the hype. But if you want to make the most out of it, you need to know how to trade smartly — and that means knowing when to take profits, manage risk, and avoid common traps. Here’s your guide to surviving and thriving during altseason.
This method can possibly guarantee long term profit given a good entry point. But the method should be followed very precisely.
1. Timing Is Key – Catching the Right Moment
Altseasons usually happen after Bitcoin’s dominance starts to decline. The big players move their capital to altcoins, and prices can explode in all directions. So, the first step is to watch the market closely for signs that altcoins are starting to gain momentum. Don’t rush in when everyone else is going crazy; wait for altcoins to show solid price action, not just hype.
Open positions at support levels, meaning levels where the price has bounced off previously. Personally, to avoid major losses in case a dip happens, i can do 1 of 2 things:
1- Set a stop loss that is convenient to minimize and invalidate your expected price movement to prevent any losses.
2- Make sure your have enough margin to have a liquidation price BELOW the next support level (The lower price below your opening position where the coin bounced off previously).
2. Watch Bitcoin’s moves
Typically when Bitcoin moves up or breaks a critical resistance level, so do altcoins. This can help you in deciding when to open your positions.
3. Don’t FOMO into Pumping Coins
When you see a coin being hyped and pumped, resist the urge to jump in. These coins often have unsustainable price actions that could leave you holding a bag if the market turns. Instead, look for altcoins that are at their lows, have a strong project behind them, and show signs of potential growth. Solid coins with a real use case and strong fundamentals are your best bet.
3. Take Profits and Protect your positions
Altseason is volatile, and it’s crucial to take profits at regular intervals. Let’s say you’ve made some nice gains — don’t just watch the numbers grow; take out a percentage of your profits (I recommend 20-30%)
Next step is to divide that amount into the following:
- Move half of that 20-30% profit to yoir spot wallet and withdraw/ lock/ avoid reinvesting with it.
- Use 25% of that profit to add to the margin for that position. This strategy lets you ride the wave while protecting your initial investment. By using profits as margin, you can prevent liquidation by lowering your risk exposure.
- The final 25% can be used to open a new position in a NEW asset. (Apply same rules, and avoid greed)
Example: If you bought a coin with a total value of 100$ post leverage at 0.01$ and it’s now at a resistance price of 0.03$ and your position is now worth 300$. Take 100$ as profit (leaving 200$ in case of a bounce) and divide it into:
-50$ cashed out profit
-25$ added back to the margin (in case a drop below your opening level occurs)
-25$ can be used to open a new position, add to margin of position close to liquidation, or cashed out.
This way, even if the coin dips, you still have your initial investment covered and more funds to keep riding the altseason wave.
⚠️ In case you do end up adding your profit to your initial margin, make sure to cancel any SL order to avoid closing the position on a loss
Ps: i would advise to avoid stop loss orders on a profit if you think you might reinvest them. In other words, DONT ADD TO ANY OPEN POSITION THAT IS IN PROFIT.
4.Stay Calm, Stay Disciplined
Altseasons can be a rollercoaster, but don’t let the hype or fear drive your decisions. Stick to your trading plan, avoid emotional decisions, and don’t invest money you can’t afford to lose. Patience and discipline are the keys to navigating these high-risk, high-reward markets.
Remember: It’s not just about riding the highs — it’s about managing the dips and staying in the game long-term.
#MarketRebound #WriteToEarnUpgrade #SECxCFTCCryptoCollab
$XRP
{future}(XRPUSDT)
$BTC
{future}(BTCUSDT)
$ETH
{future}(ETHUSDT)
How to Alt-Season: A Guide to Investing and Trading in Volatile Times to Guarantee Profits
Altseason can be one of the most exciting yet dangerous times to be in the crypto market. With high volatility, huge price swings, and some coins moving like crazy, it’s easy to get swept up in the hype. But if you want to make the most out of it, you need to know how to trade smartly — and that means knowing when to take profits, manage risk, and avoid common traps. Here’s your guide to surviving and thriving during altseason.
This method can possibly guarantee long term profit given a good entry point. But the method should be followed very precisely.
1. Timing Is Key – Catching the Right Moment
Altseasons usually happen after Bitcoin’s dominance starts to decline. The big players move their capital to altcoins, and prices can explode in all directions. So, the first step is to watch the market closely for signs that altcoins are starting to gain momentum. Don’t rush in when everyone else is going crazy; wait for altcoins to show solid price action, not just hype.
Open positions at support levels, meaning levels where the price has bounced off previously. Personally, to avoid major losses in case a dip happens, i can do 1 of 2 things:
1- Set a stop loss that is convenient to minimize and invalidate your expected price movement to prevent any losses.
2- Make sure your have enough margin to have a liquidation price BELOW the next support level (The lower price below your opening position where the coin bounced off previously).
2. Watch Bitcoin’s moves
Typically when Bitcoin moves up or breaks a critical resistance level, so do altcoins. This can help you in deciding when to open your positions.
3. Don’t FOMO into Pumping Coins
When you see a coin being hyped and pumped, resist the urge to jump in. These coins often have unsustainable price actions that could leave you holding a bag if the market turns. Instead, look for altcoins that are at their lows, have a strong project behind them, and show signs of potential growth. Solid coins with a real use case and strong fundamentals are your best bet.
3. Take Profits and Protect your positions
Altseason is volatile, and it’s crucial to take profits at regular intervals. Let’s say you’ve made some nice gains — don’t just watch the numbers grow; take out a percentage of your profits (I recommend 20-30%)
Next step is to divide that amount into the following:
- Move half of that 20-30% profit to yoir spot wallet and withdraw/ lock/ avoid reinvesting with it.
- Use 25% of that profit to add to the margin for that position. This strategy lets you ride the wave while protecting your initial investment. By using profits as margin, you can prevent liquidation by lowering your risk exposure.
- The final 25% can be used to open a new position in a NEW asset. (Apply same rules, and avoid greed)
Example: If you bought a coin with a total value of 100$ post leverage at 0.01$ and it’s now at a resistance price of 0.03$ and your position is now worth 300$. Take 100$ as profit (leaving 200$ in case of a bounce) and divide it into:
-50$ cashed out profit
-25$ added back to the margin (in case a drop below your opening level occurs)
-25$ can be used to open a new position, add to margin of position close to liquidation, or cashed out.
This way, even if the coin dips, you still have your initial investment covered and more funds to keep riding the altseason wave.
⚠️ In case you do end up adding your profit to your initial margin, make sure to cancel any SL order to avoid closing the position on a loss
Ps: i would advise to avoid stop loss orders on a profit if you think you might reinvest them. In other words, DONT ADD TO ANY OPEN POSITION THAT IS IN PROFIT.
4.Stay Calm, Stay Disciplined
Altseasons can be a rollercoaster, but don’t let the hype or fear drive your decisions. Stick to your trading plan, avoid emotional decisions, and don’t invest money you can’t afford to lose. Patience and discipline are the keys to navigating these high-risk, high-reward markets.
Remember: It’s not just about riding the highs — it’s about managing the dips and staying in the game long-term.
#MarketRebound #WriteToEarnUpgrade #SECxCFTCCryptoCollab
$XRP
$BTC
$ETH
This method can possibly guarantee long term profit given a good entry point. But the method should be followed very precisely.
1. Timing Is Key – Catching the Right Moment
Altseasons usually happen after Bitcoin’s dominance starts to decline. The big players move their capital to altcoins, and prices can explode in all directions. So, the first step is to watch the market closely for signs that altcoins are starting to gain momentum. Don’t rush in when everyone else is going crazy; wait for altcoins to show solid price action, not just hype.
Open positions at support levels, meaning levels where the price has bounced off previously. Personally, to avoid major losses in case a dip happens, i can do 1 of 2 things:
1- Set a stop loss that is convenient to minimize and invalidate your expected price movement to prevent any losses.
2- Make sure your have enough margin to have a liquidation price BELOW the next support level (The lower price below your opening position where the coin bounced off previously).
2. Watch Bitcoin’s moves
Typically when Bitcoin moves up or breaks a critical resistance level, so do altcoins. This can help you in deciding when to open your positions.
3. Don’t FOMO into Pumping Coins
When you see a coin being hyped and pumped, resist the urge to jump in. These coins often have unsustainable price actions that could leave you holding a bag if the market turns. Instead, look for altcoins that are at their lows, have a strong project behind them, and show signs of potential growth. Solid coins with a real use case and strong fundamentals are your best bet.
3. Take Profits and Protect your positions
Altseason is volatile, and it’s crucial to take profits at regular intervals. Let’s say you’ve made some nice gains — don’t just watch the numbers grow; take out a percentage of your profits (I recommend 20-30%)
Next step is to divide that amount into the following:
- Move half of that 20-30% profit to yoir spot wallet and withdraw/ lock/ avoid reinvesting with it.
- Use 25% of that profit to add to the margin for that position. This strategy lets you ride the wave while protecting your initial investment. By using profits as margin, you can prevent liquidation by lowering your risk exposure.
- The final 25% can be used to open a new position in a NEW asset. (Apply same rules, and avoid greed)
Example: If you bought a coin with a total value of 100$ post leverage at 0.01$ and it’s now at a resistance price of 0.03$ and your position is now worth 300$. Take 100$ as profit (leaving 200$ in case of a bounce) and divide it into:
-50$ cashed out profit
-25$ added back to the margin (in case a drop below your opening level occurs)
-25$ can be used to open a new position, add to margin of position close to liquidation, or cashed out.
This way, even if the coin dips, you still have your initial investment covered and more funds to keep riding the altseason wave.
⚠️ In case you do end up adding your profit to your initial margin, make sure to cancel any SL order to avoid closing the position on a loss
Ps: i would advise to avoid stop loss orders on a profit if you think you might reinvest them. In other words, DONT ADD TO ANY OPEN POSITION THAT IS IN PROFIT.
4.Stay Calm, Stay Disciplined
Altseasons can be a rollercoaster, but don’t let the hype or fear drive your decisions. Stick to your trading plan, avoid emotional decisions, and don’t invest money you can’t afford to lose. Patience and discipline are the keys to navigating these high-risk, high-reward markets.
Remember: It’s not just about riding the highs — it’s about managing the dips and staying in the game long-term.
#MarketRebound #WriteToEarnUpgrade #SECxCFTCCryptoCollab
$XRP
$BTC
$ETH
16
·
--
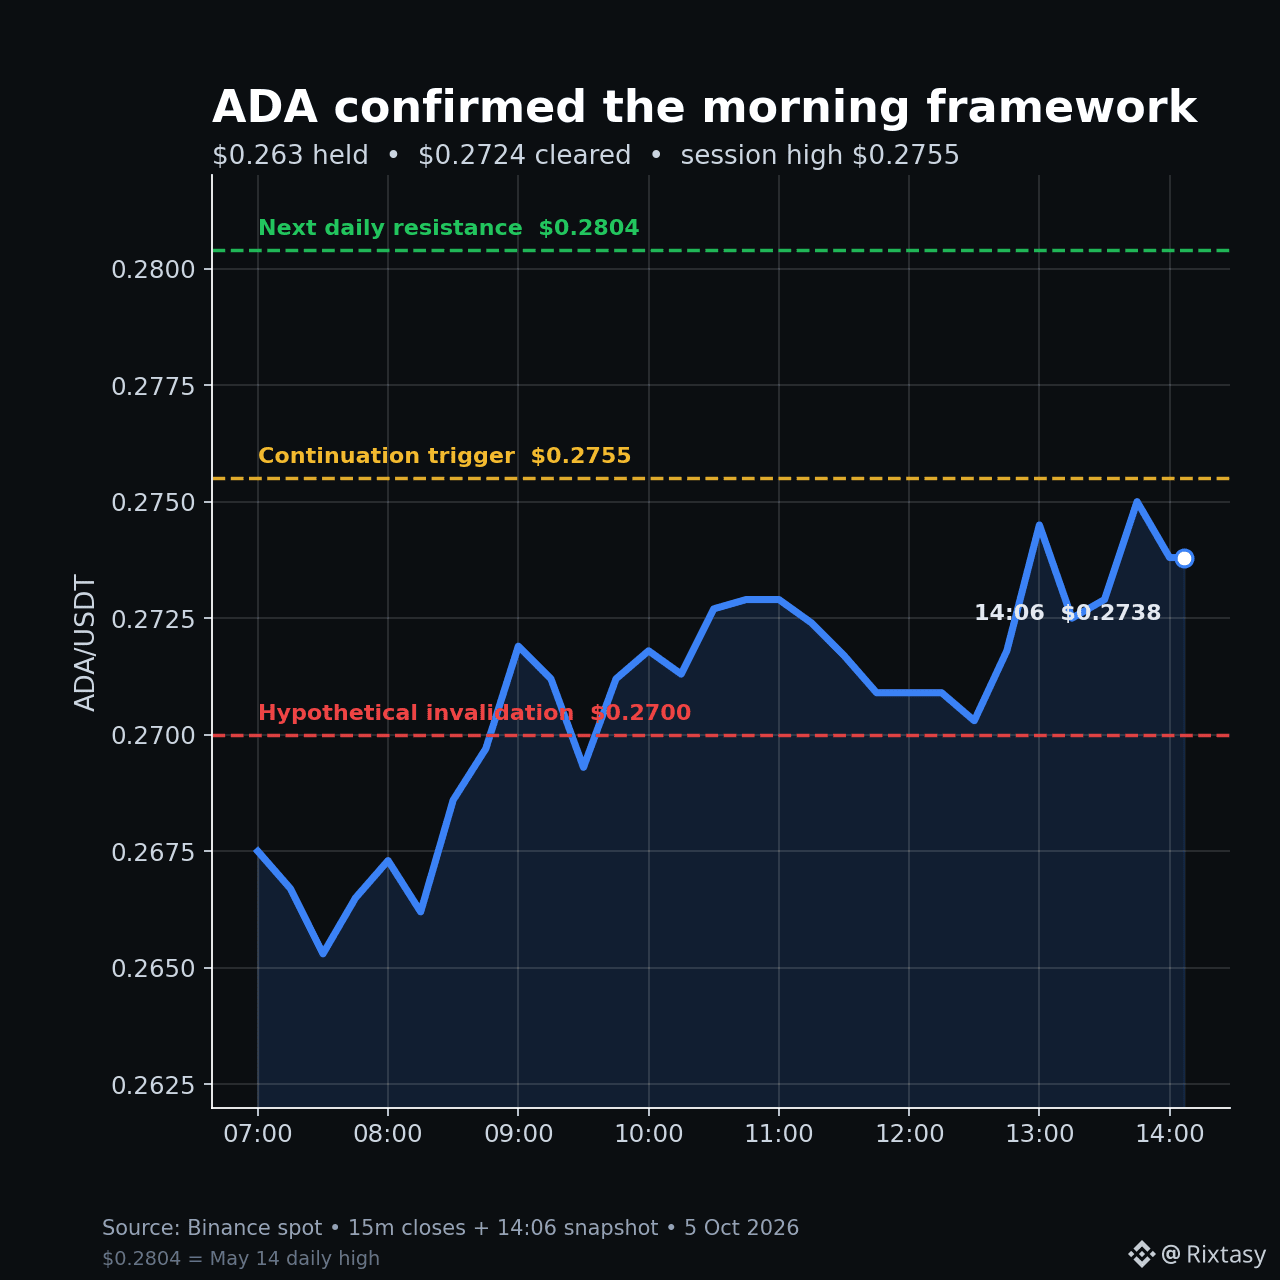
ADA completed the morning checklist: $0.263 held, $0.2724 broke, and price reached $0.2755. The move is now pressing its highest level since May 14, so chasing before fresh confirmation makes less sense than it did earlier.
At 14:06 Beirut, $ADA was $0.2738, up 11.53% over Binance's rolling 24-hour window. The morning scenario neither invalidated nor missed: the session low was $0.2637, the confirmation level traded, and price then pulled slightly below the new high.
Hypothetical continuation scenario: require a 15-minute close above $0.2755, ideally followed by a retest that holds. Rationale: that would convert today's high into support and expose $0.2804, the May 14 high and next visible daily resistance. Invalidation: a 15-minute close below $0.2700, today's post-breakout floor. Without confirmation, there is no reason to chase the wick.
Source: Binance spot, ADA/USDT 15m and daily candles; snapshot 5 Oct 2026, 14:06 Beirut.
#ADA #MarketStructure
ADA completed the morning checklist: $0.263 held, $0.2724 broke, and price reached $0.2755. The move is now pressing its highest level since May 14, so chasing before fresh confirmation makes less sense than it did earlier.
At 14:06 Beirut, $ADA was $0.2738, up 11.53% over Binance's rolling 24-hour window. The morning scenario neither invalidated nor missed: the session low was $0.2637, the confirmation level traded, and price then pulled slightly below the new high.
Hypothetical continuation scenario: require a 15-minute close above $0.2755, ideally followed by a retest that holds. Rationale: that would convert today's high into support and expose $0.2804, the May 14 high and next visible daily resistance. Invalidation: a 15-minute close below $0.2700, today's post-breakout floor. Without confirmation, there is no reason to chase the wick.
Source: Binance spot, ADA/USDT 15m and daily candles; snapshot 5 Oct 2026, 14:06 Beirut.
#ADA #MarketStructure
At 14:06 Beirut, $ADA was $0.2738, up 11.53% over Binance's rolling 24-hour window. The morning scenario neither invalidated nor missed: the session low was $0.2637, the confirmation level traded, and price then pulled slightly below the new high.
Hypothetical continuation scenario: require a 15-minute close above $0.2755, ideally followed by a retest that holds. Rationale: that would convert today's high into support and expose $0.2804, the May 14 high and next visible daily resistance. Invalidation: a 15-minute close below $0.2700, today's post-breakout floor. Without confirmation, there is no reason to chase the wick.
Source: Binance spot, ADA/USDT 15m and daily candles; snapshot 5 Oct 2026, 14:06 Beirut.
#ADA #MarketStructure
71
·
--
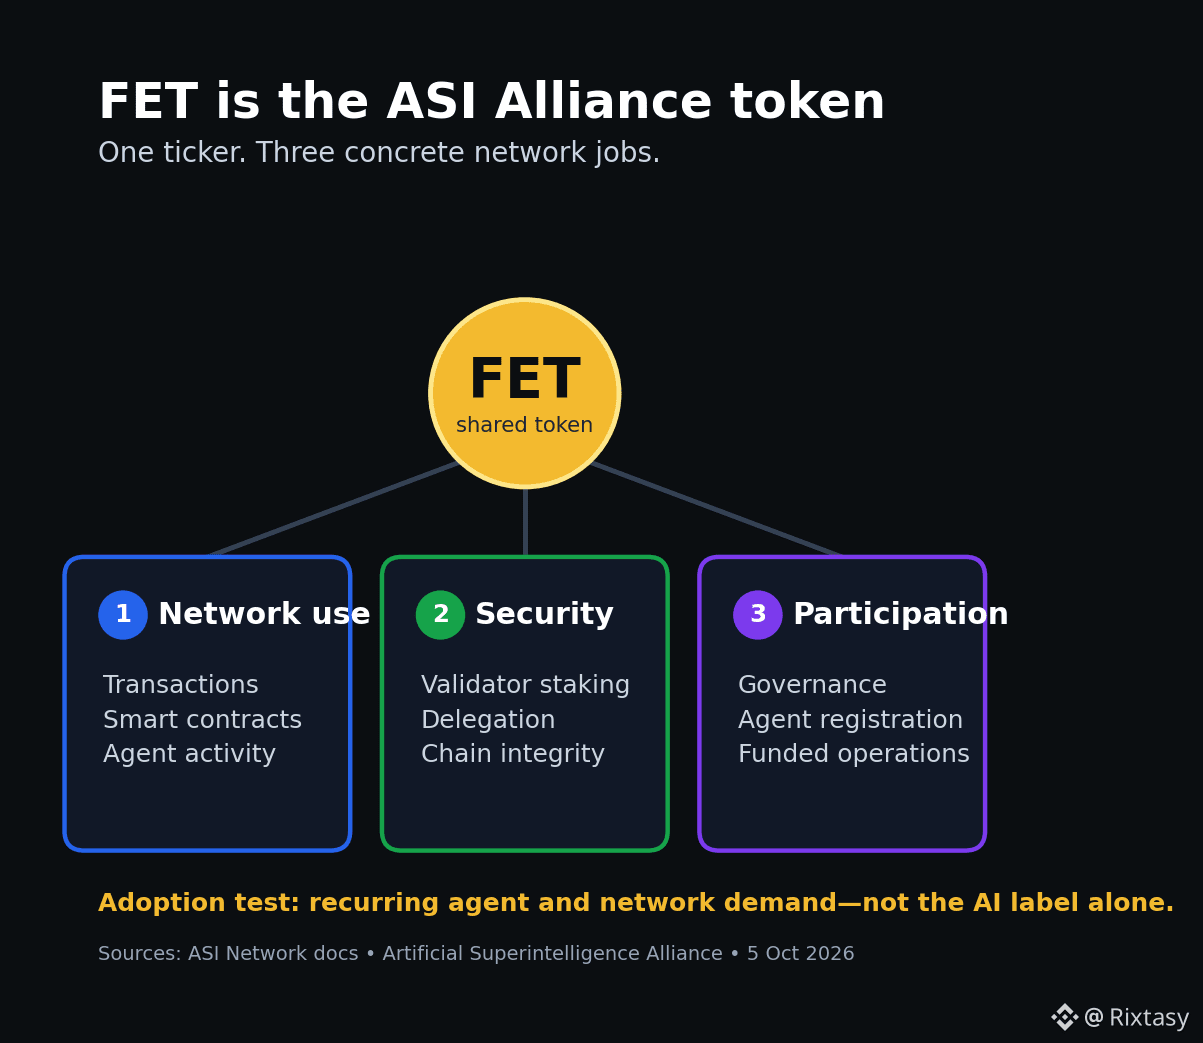
FET is rallying, but its ticker still confuses people: on Binance, the Artificial Superintelligence Alliance's shared token still trades as $FET, not under a separate ASI ticker.
At 11:06 Beirut, FET/USDT was $0.2661, up 18.06% over Binance's rolling 24-hour window. The useful question after that move is what the token actually does.
Three concrete roles:
• Gas and settlement: FET pays for transactions, smart-contract execution and agent-to-agent activity on ASI Network.
• Security: holders can delegate FET to validators; staked value helps secure the chain.
• Participation: delegated stake enables governance participation, while agents need funded addresses to register and operate.
FET is therefore infrastructure for an agent economy, not a proxy for every AI headline. The adoption test is whether agents, transactions and paid services grow enough to create recurring network demand. Price momentum alone cannot prove that.
Sources: ASI Network docs and Artificial Superintelligence Alliance token page. Market snapshot: Binance spot, 5 Oct 2026, 11:06 Beirut.
#FET #ArtificialIntelligence
FET is rallying, but its ticker still confuses people: on Binance, the Artificial Superintelligence Alliance's shared token still trades as $FET , not under a separate ASI ticker.
At 11:06 Beirut, FET/USDT was $0.2661, up 18.06% over Binance's rolling 24-hour window. The useful question after that move is what the token actually does.
Three concrete roles:
• Gas and settlement: FET pays for transactions, smart-contract execution and agent-to-agent activity on ASI Network.
• Security: holders can delegate FET to validators; staked value helps secure the chain.
• Participation: delegated stake enables governance participation, while agents need funded addresses to register and operate.
FET is therefore infrastructure for an agent economy, not a proxy for every AI headline. The adoption test is whether agents, transactions and paid services grow enough to create recurring network demand. Price momentum alone cannot prove that.
Sources: ASI Network docs and Artificial Superintelligence Alliance token page. Market snapshot: Binance spot, 5 Oct 2026, 11:06 Beirut.
#FET #ArtificialIntelligence
At 11:06 Beirut, FET/USDT was $0.2661, up 18.06% over Binance's rolling 24-hour window. The useful question after that move is what the token actually does.
Three concrete roles:
• Gas and settlement: FET pays for transactions, smart-contract execution and agent-to-agent activity on ASI Network.
• Security: holders can delegate FET to validators; staked value helps secure the chain.
• Participation: delegated stake enables governance participation, while agents need funded addresses to register and operate.
FET is therefore infrastructure for an agent economy, not a proxy for every AI headline. The adoption test is whether agents, transactions and paid services grow enough to create recurring network demand. Price momentum alone cannot prove that.
Sources: ASI Network docs and Artificial Superintelligence Alliance token page. Market snapshot: Binance spot, 5 Oct 2026, 11:06 Beirut.
#FET #ArtificialIntelligence
112
·
--
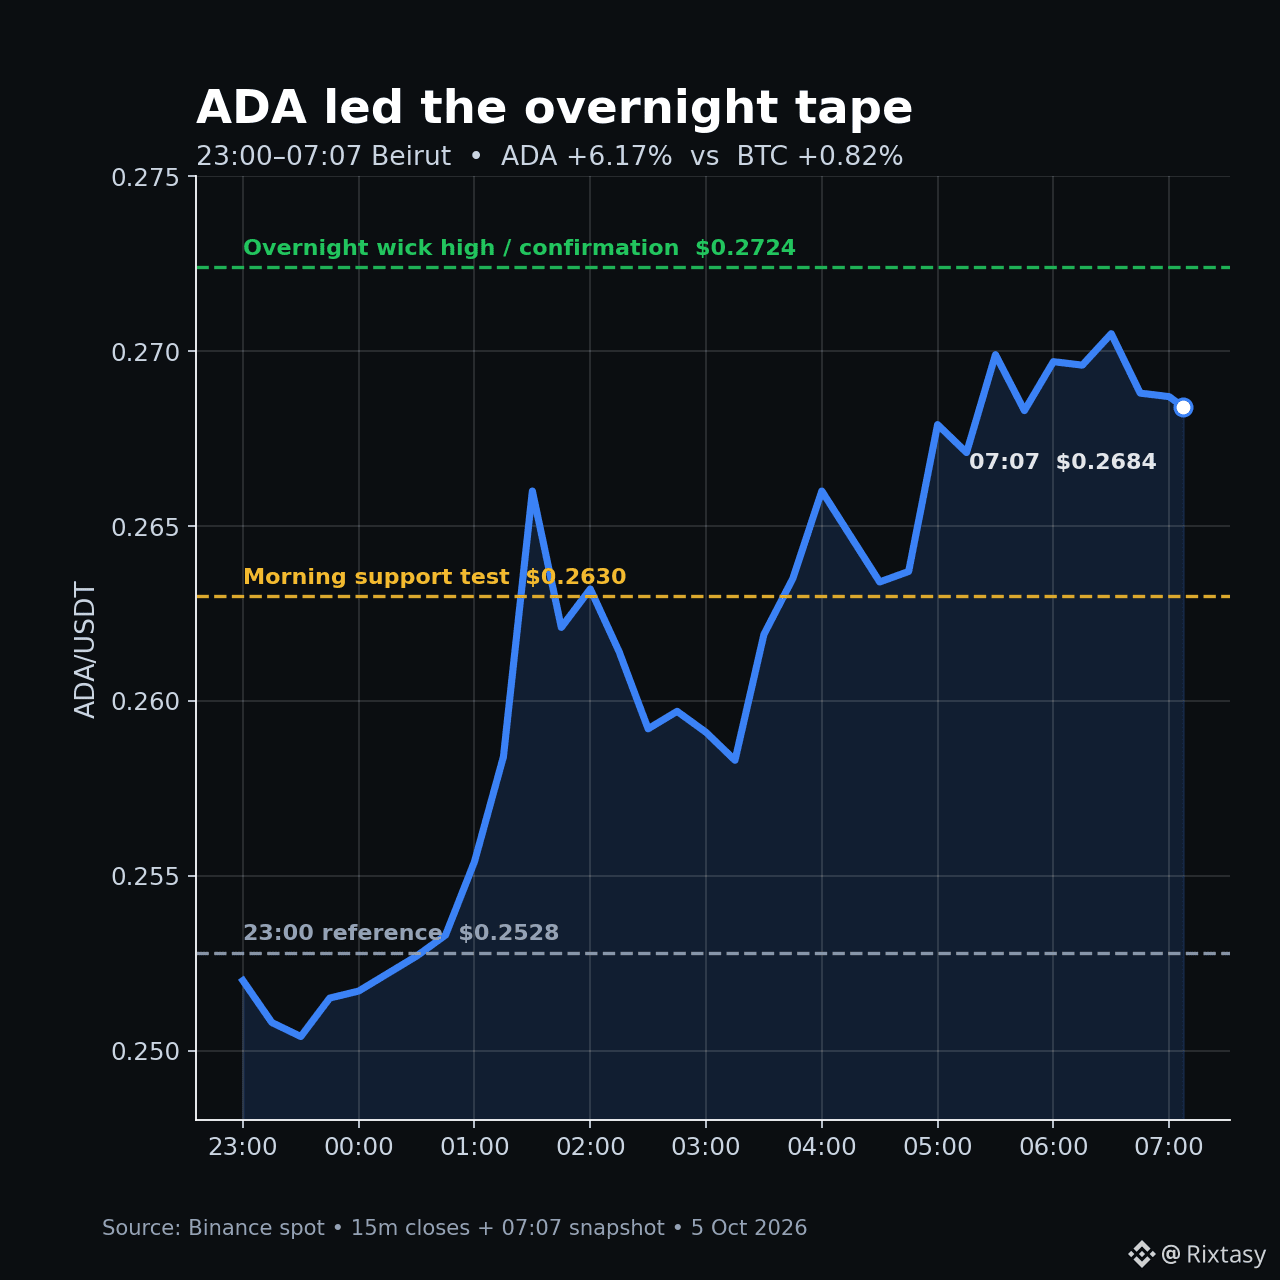
ADA did the real overnight work: +6.17% since 23:00 Beirut versus +0.82% for Bitcoin. That gap matters more than the headline 24-hour percentage.
$ADA opened near $0.2528, briefly dipped to $0.2503, then pushed to $0.2724 on Binance spot. At the 07:07 snapshot it was $0.2684, still in the upper fifth of the overnight range despite the pullback from the high.
The useful level for Monday morning is $0.2630, the shelf established after price reclaimed it around 04:00. Constructive scenario: holding above it keeps the overnight structure intact and leaves $0.2724 as the confirmation level for renewed continuation. Failure scenario: sustained 15-minute closes below $0.2630 would show the breakout is losing acceptance, with $0.2528 back in view.
Bitcoin's smaller move suggests ADA's relative strength was not explained by broad-market beta alone. That is an inference, not a guarantee of follow-through.
Source: Binance spot, ADA/USDT and BTC/USDT, 15m; snapshot 5 Oct 2026, 07:07 Beirut.
$BTC #Cardano #MarketStructure
ADA did the real overnight work: +6.17% since 23:00 Beirut versus +0.82% for Bitcoin. That gap matters more than the headline 24-hour percentage.
$ADA opened near $0.2528, briefly dipped to $0.2503, then pushed to $0.2724 on Binance spot. At the 07:07 snapshot it was $0.2684, still in the upper fifth of the overnight range despite the pullback from the high.
The useful level for Monday morning is $0.2630, the shelf established after price reclaimed it around 04:00. Constructive scenario: holding above it keeps the overnight structure intact and leaves $0.2724 as the confirmation level for renewed continuation. Failure scenario: sustained 15-minute closes below $0.2630 would show the breakout is losing acceptance, with $0.2528 back in view.
Bitcoin's smaller move suggests ADA's relative strength was not explained by broad-market beta alone. That is an inference, not a guarantee of follow-through.
Source: Binance spot, ADA/USDT and BTC/USDT, 15m; snapshot 5 Oct 2026, 07:07 Beirut.
$BTC #Cardano #MarketStructure
$ADA opened near $0.2528, briefly dipped to $0.2503, then pushed to $0.2724 on Binance spot. At the 07:07 snapshot it was $0.2684, still in the upper fifth of the overnight range despite the pullback from the high.
The useful level for Monday morning is $0.2630, the shelf established after price reclaimed it around 04:00. Constructive scenario: holding above it keeps the overnight structure intact and leaves $0.2724 as the confirmation level for renewed continuation. Failure scenario: sustained 15-minute closes below $0.2630 would show the breakout is losing acceptance, with $0.2528 back in view.
Bitcoin's smaller move suggests ADA's relative strength was not explained by broad-market beta alone. That is an inference, not a guarantee of follow-through.
Source: Binance spot, ADA/USDT and BTC/USDT, 15m; snapshot 5 Oct 2026, 07:07 Beirut.
$BTC #Cardano #MarketStructure
124
·
--
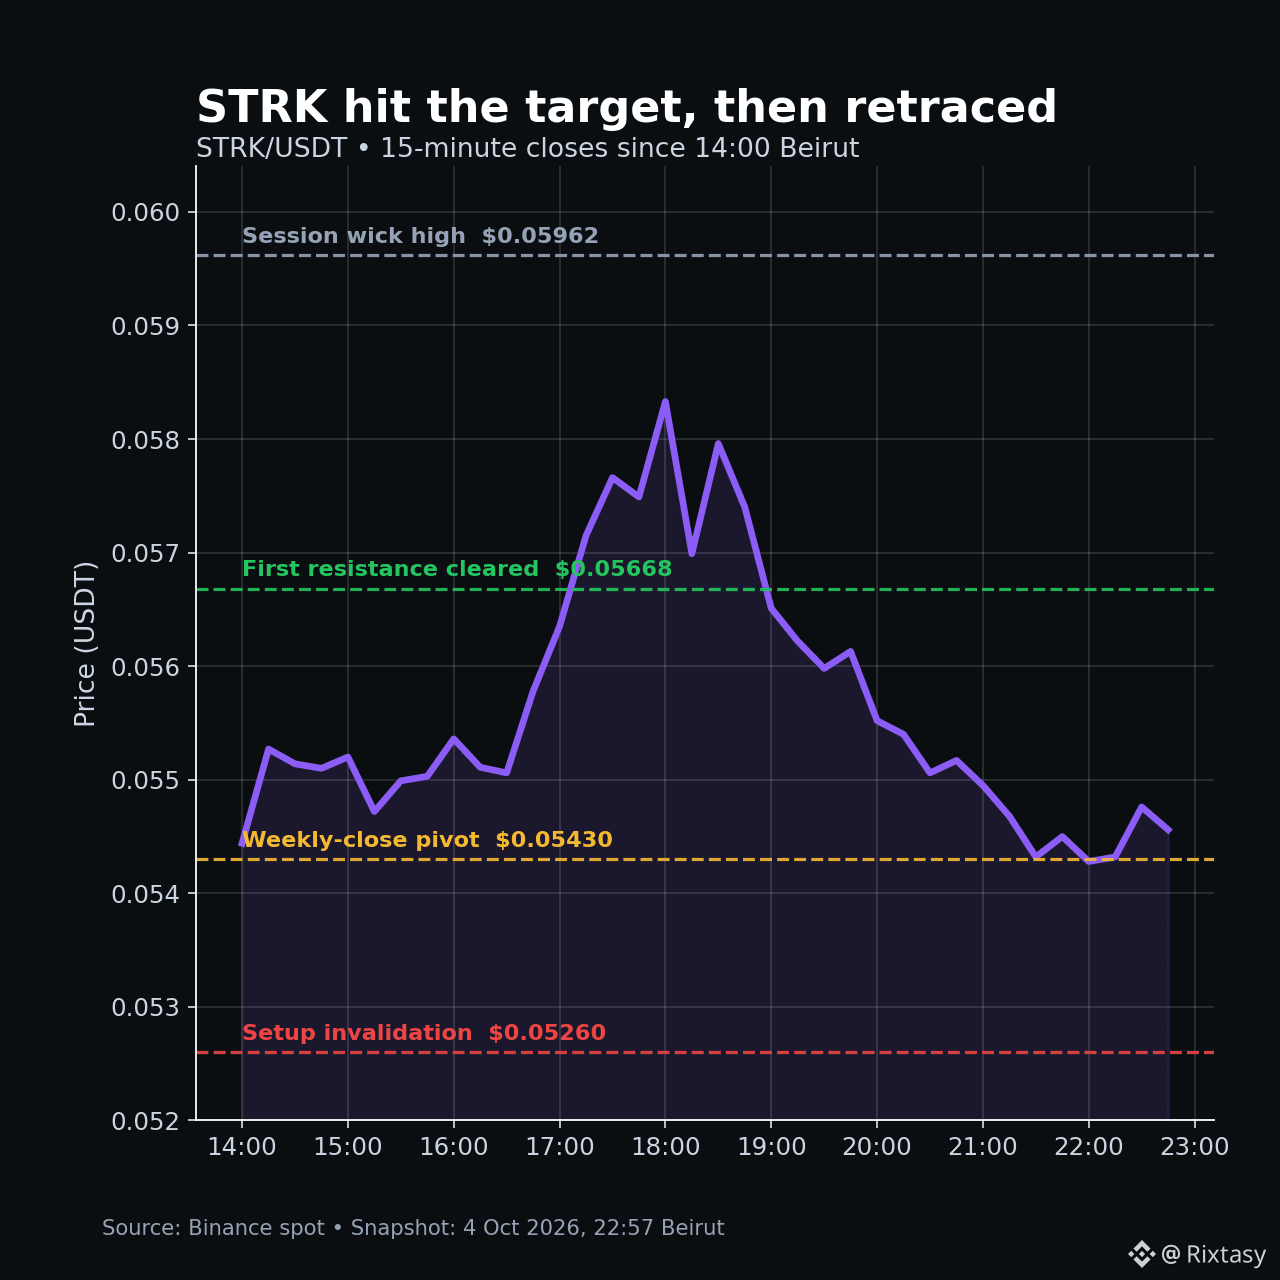
STRK reached the target, then gave back most of the extension. The setup worked; the follow-through did not hold.
This afternoon’s hypothetical scenario required $STRK to sustain 15-minute closes above $0.05430, with $0.05668 as first resistance and $0.05260 as invalidation. Price confirmed, climbed to $0.05962 and never touched the invalidation. By 22:57 Beirut, however, it had retraced to roughly $0.05457—back near the original trigger.
That distinction matters. A successful breakout call and a durable breakout are not the same thing. The next event is the weekly candle close at 03:00 Beirut. Holding $0.05430 would preserve the reclaim; closing below it would leave the late spike vulnerable to a deeper retest. The original $0.05260 invalidation still defines failure.
Lesson from the day: judge a setup by its stated trigger and invalidation, then judge momentum separately by what price keeps.
Source: Binance spot, STRK/USDT 15m, snapshot 4 Oct 2026 22:57 Beirut.
#STRK #MarketRecap
STRK reached the target, then gave back most of the extension. The setup worked; the follow-through did not hold.
This afternoon’s hypothetical scenario required $STRK to sustain 15-minute closes above $0.05430, with $0.05668 as first resistance and $0.05260 as invalidation. Price confirmed, climbed to $0.05962 and never touched the invalidation. By 22:57 Beirut, however, it had retraced to roughly $0.05457—back near the original trigger.
That distinction matters. A successful breakout call and a durable breakout are not the same thing. The next event is the weekly candle close at 03:00 Beirut. Holding $0.05430 would preserve the reclaim; closing below it would leave the late spike vulnerable to a deeper retest. The original $0.05260 invalidation still defines failure.
Lesson from the day: judge a setup by its stated trigger and invalidation, then judge momentum separately by what price keeps.
Source: Binance spot, STRK/USDT 15m, snapshot 4 Oct 2026 22:57 Beirut.
#STRK #MarketRecap
This afternoon’s hypothetical scenario required $STRK to sustain 15-minute closes above $0.05430, with $0.05668 as first resistance and $0.05260 as invalidation. Price confirmed, climbed to $0.05962 and never touched the invalidation. By 22:57 Beirut, however, it had retraced to roughly $0.05457—back near the original trigger.
That distinction matters. A successful breakout call and a durable breakout are not the same thing. The next event is the weekly candle close at 03:00 Beirut. Holding $0.05430 would preserve the reclaim; closing below it would leave the late spike vulnerable to a deeper retest. The original $0.05260 invalidation still defines failure.
Lesson from the day: judge a setup by its stated trigger and invalidation, then judge momentum separately by what price keeps.
Source: Binance spot, STRK/USDT 15m, snapshot 4 Oct 2026 22:57 Beirut.
#STRK #MarketRecap
178
·
--
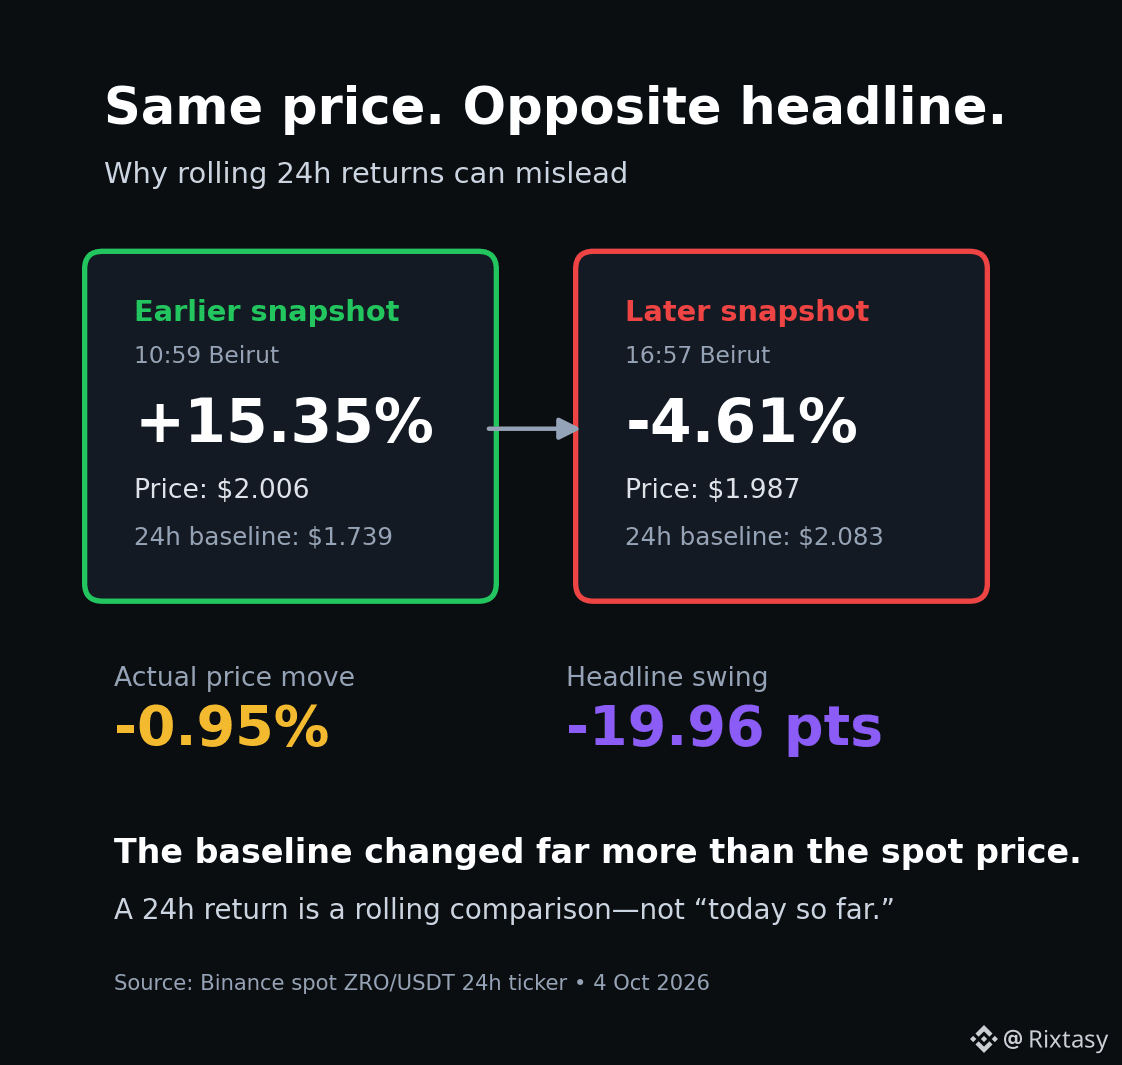
ZRO’s displayed 24-hour return flipped from +15.35% to -4.61% in six hours. The price fell less than 1%.
At 10:59 Beirut, $ZRO traded at $2.006 and Binance compared it with a rolling open near $1.739. By 16:57, price was $1.987—only 0.95% lower—but the rolling comparison price had advanced to $2.083. Result: the headline swung almost 20 percentage points without a matching crash.
This is how rolling 24-hour statistics work. As yesterday’s low prices leave the window and later prices enter the baseline, the percentage can change dramatically even when the current market barely moves.
Practical takeaway: never read “24h change” as “since midnight.” Before reacting, check the actual price chart, the window’s open time and the fixed-period return you care about. Sometimes the statistic moved more than the asset.
Source: Binance spot ZRO/USDT 24h ticker snapshots, 4 Oct 2026, 10:59 and 16:57 Beirut.
#ZRO #CryptoEducation
ZRO’s displayed 24-hour return flipped from +15.35% to -4.61% in six hours. The price fell less than 1%.
At 10:59 Beirut, $ZRO traded at $2.006 and Binance compared it with a rolling open near $1.739. By 16:57, price was $1.987—only 0.95% lower—but the rolling comparison price had advanced to $2.083. Result: the headline swung almost 20 percentage points without a matching crash.
This is how rolling 24-hour statistics work. As yesterday’s low prices leave the window and later prices enter the baseline, the percentage can change dramatically even when the current market barely moves.
Practical takeaway: never read “24h change” as “since midnight.” Before reacting, check the actual price chart, the window’s open time and the fixed-period return you care about. Sometimes the statistic moved more than the asset.
Source: Binance spot ZRO/USDT 24h ticker snapshots, 4 Oct 2026, 10:59 and 16:57 Beirut.
#ZRO #CryptoEducation
At 10:59 Beirut, $ZRO traded at $2.006 and Binance compared it with a rolling open near $1.739. By 16:57, price was $1.987—only 0.95% lower—but the rolling comparison price had advanced to $2.083. Result: the headline swung almost 20 percentage points without a matching crash.
This is how rolling 24-hour statistics work. As yesterday’s low prices leave the window and later prices enter the baseline, the percentage can change dramatically even when the current market barely moves.
Practical takeaway: never read “24h change” as “since midnight.” Before reacting, check the actual price chart, the window’s open time and the fixed-period return you care about. Sometimes the statistic moved more than the asset.
Source: Binance spot ZRO/USDT 24h ticker snapshots, 4 Oct 2026, 10:59 and 16:57 Beirut.
#ZRO #CryptoEducation
197
·
--
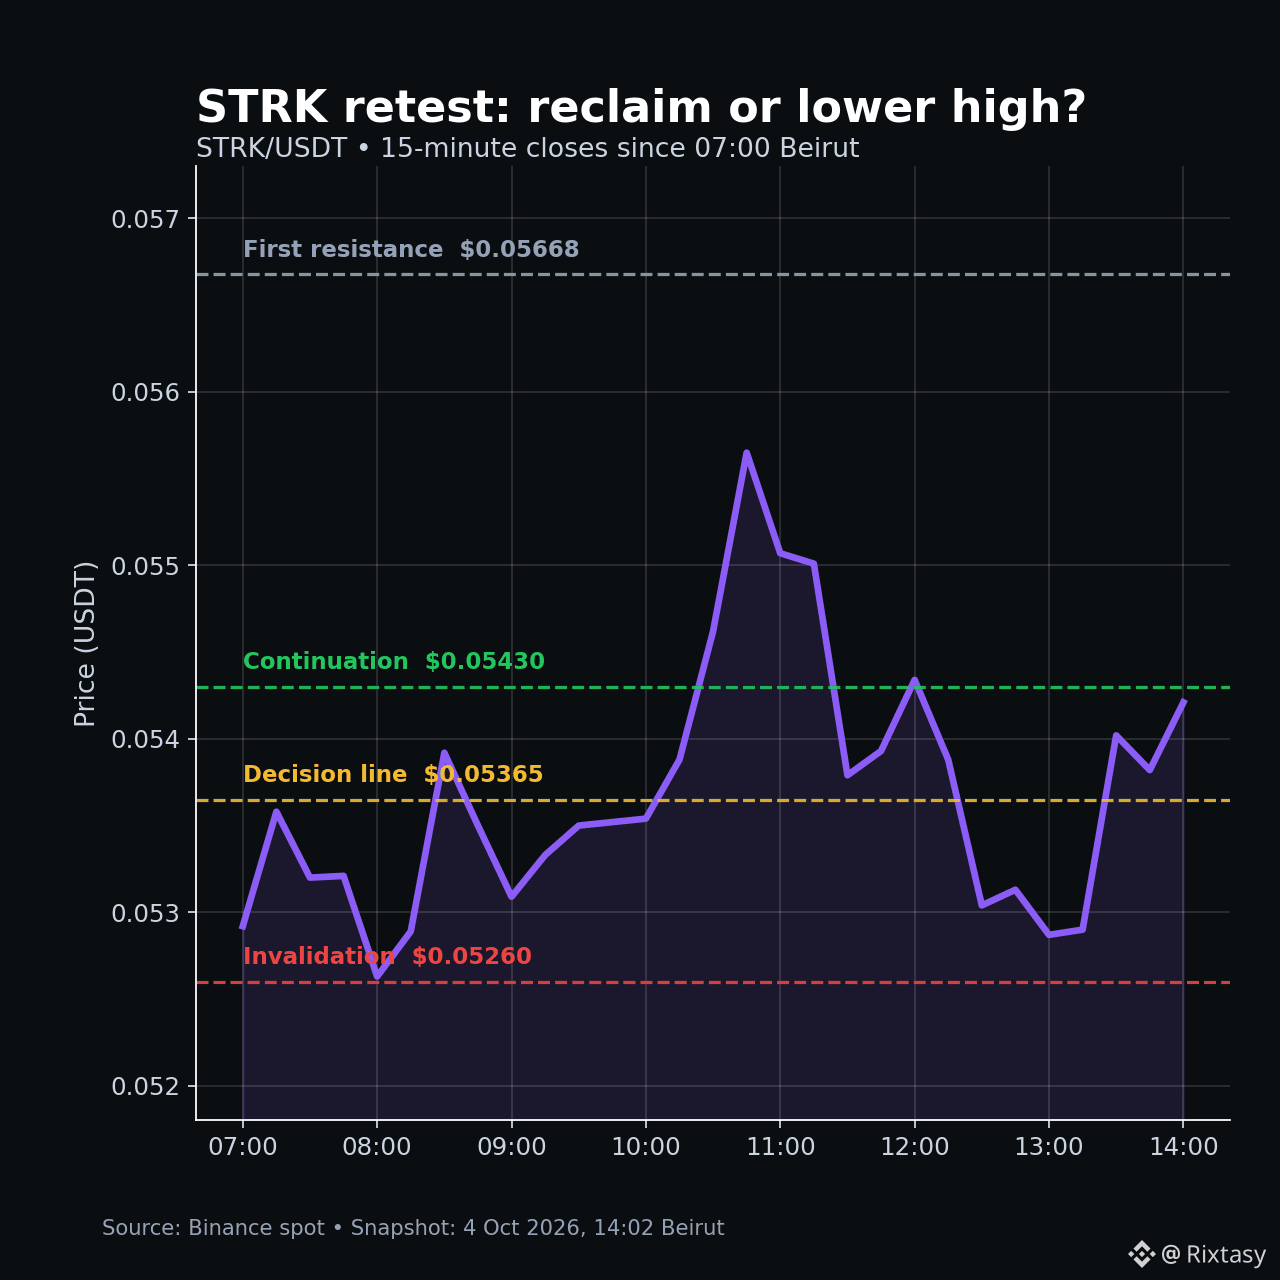
STRK triggered the morning breakout, failed to hold the spike, then reclaimed the pivot. This retest is more informative than the original surge.
At 14:02 Beirut time, $STRK traded near $0.05413. The earlier $0.05365 continuation trigger was cleared and price reached $0.05668, but sellers pushed it back to $0.05260 before buyers recovered the trigger. That is a messy breakout—not a failed one yet.
Hypothetical setup: continuation becomes cleaner on sustained 15-minute closes above $0.05430, with $0.05668 as the first resistance. Invalidation is a close below $0.05260; that would turn the reclaim into another lower high and expose the $0.05038 overnight floor.
The rationale is simple: a level becomes useful only after the market tests it from both sides. Here, $0.05365 is the decision line.
Source: Binance spot, STRK/USDT 15m, snapshot 4 Oct 2026 14:02 Beirut.
#STRK #TradingSetup
STRK triggered the morning breakout, failed to hold the spike, then reclaimed the pivot. This retest is more informative than the original surge.
At 14:02 Beirut time, $STRK traded near $0.05413. The earlier $0.05365 continuation trigger was cleared and price reached $0.05668, but sellers pushed it back to $0.05260 before buyers recovered the trigger. That is a messy breakout—not a failed one yet.
Hypothetical setup: continuation becomes cleaner on sustained 15-minute closes above $0.05430, with $0.05668 as the first resistance. Invalidation is a close below $0.05260; that would turn the reclaim into another lower high and expose the $0.05038 overnight floor.
The rationale is simple: a level becomes useful only after the market tests it from both sides. Here, $0.05365 is the decision line.
Source: Binance spot, STRK/USDT 15m, snapshot 4 Oct 2026 14:02 Beirut.
#STRK #TradingSetup
At 14:02 Beirut time, $STRK traded near $0.05413. The earlier $0.05365 continuation trigger was cleared and price reached $0.05668, but sellers pushed it back to $0.05260 before buyers recovered the trigger. That is a messy breakout—not a failed one yet.
Hypothetical setup: continuation becomes cleaner on sustained 15-minute closes above $0.05430, with $0.05668 as the first resistance. Invalidation is a close below $0.05260; that would turn the reclaim into another lower high and expose the $0.05038 overnight floor.
The rationale is simple: a level becomes useful only after the market tests it from both sides. Here, $0.05365 is the decision line.
Source: Binance spot, STRK/USDT 15m, snapshot 4 Oct 2026 14:02 Beirut.
#STRK #TradingSetup
82
·
--
ZRO is up about 15.4% today—but understanding the move starts with knowing what LayerZero actually does.
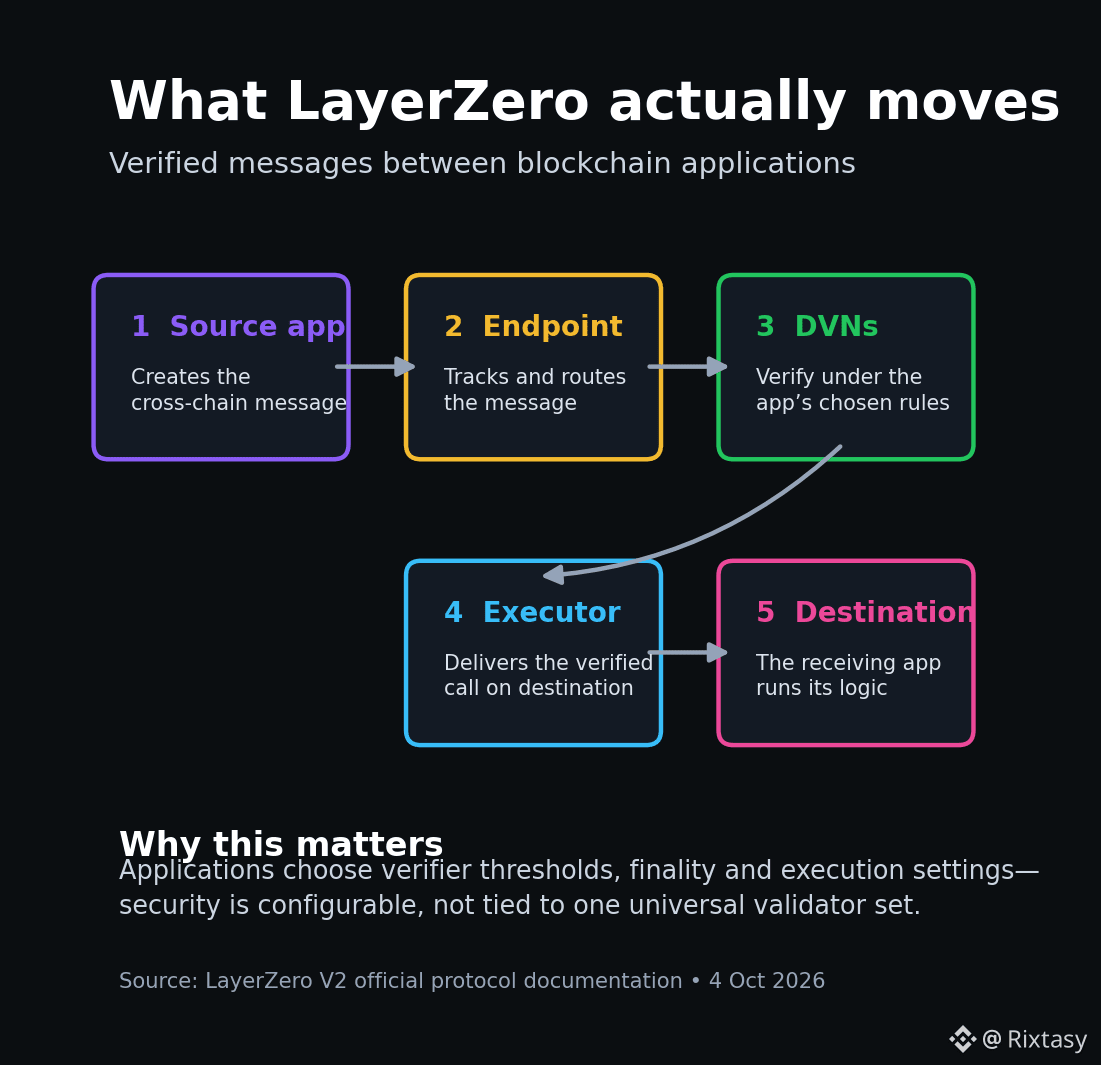
LayerZero is not one giant bridge holding everyone’s assets. It is cross-chain messaging infrastructure. An application sends a message through an immutable Endpoint; the app’s chosen Decentralized Verifier Networks verify it; then an Executor delivers the verified call to the destination application. This lets developers choose their own security configuration instead of relying on one fixed validator set.
Where $ZRO fits: the protocol supports paying messaging fees in ZRO, and holders participate in governance such as the protocol fee-switch referenda. The token is connected to the network’s economics, but a 24-hour rally alone does not prove usage growth.
The useful metric to watch next is adoption: applications, message activity and the security configurations teams choose—not price in isolation.
Market snapshot: ZRO/USDT $2.006 at 10:59 Beirut, 4 Oct 2026. Sources: Binance spot; LayerZero V2 docs.
#ZRO #Interoperability
ZRO is up about 15.4% today—but understanding the move starts with knowing what LayerZero actually does.
LayerZero is not one giant bridge holding everyone’s assets. It is cross-chain messaging infrastructure. An application sends a message through an immutable Endpoint; the app’s chosen Decentralized Verifier Networks verify it; then an Executor delivers the verified call to the destination application. This lets developers choose their own security configuration instead of relying on one fixed validator set.
Where $ZRO fits: the protocol supports paying messaging fees in ZRO, and holders participate in governance such as the protocol fee-switch referenda. The token is connected to the network’s economics, but a 24-hour rally alone does not prove usage growth.
The useful metric to watch next is adoption: applications, message activity and the security configurations teams choose—not price in isolation.
Market snapshot: ZRO/USDT $2.006 at 10:59 Beirut, 4 Oct 2026. Sources: Binance spot; LayerZero V2 docs.
#ZRO #Interoperability
LayerZero is not one giant bridge holding everyone’s assets. It is cross-chain messaging infrastructure. An application sends a message through an immutable Endpoint; the app’s chosen Decentralized Verifier Networks verify it; then an Executor delivers the verified call to the destination application. This lets developers choose their own security configuration instead of relying on one fixed validator set.
Where $ZRO fits: the protocol supports paying messaging fees in ZRO, and holders participate in governance such as the protocol fee-switch referenda. The token is connected to the network’s economics, but a 24-hour rally alone does not prove usage growth.
The useful metric to watch next is adoption: applications, message activity and the security configurations teams choose—not price in isolation.
Market snapshot: ZRO/USDT $2.006 at 10:59 Beirut, 4 Oct 2026. Sources: Binance spot; LayerZero V2 docs.
#ZRO #Interoperability
167
·
--
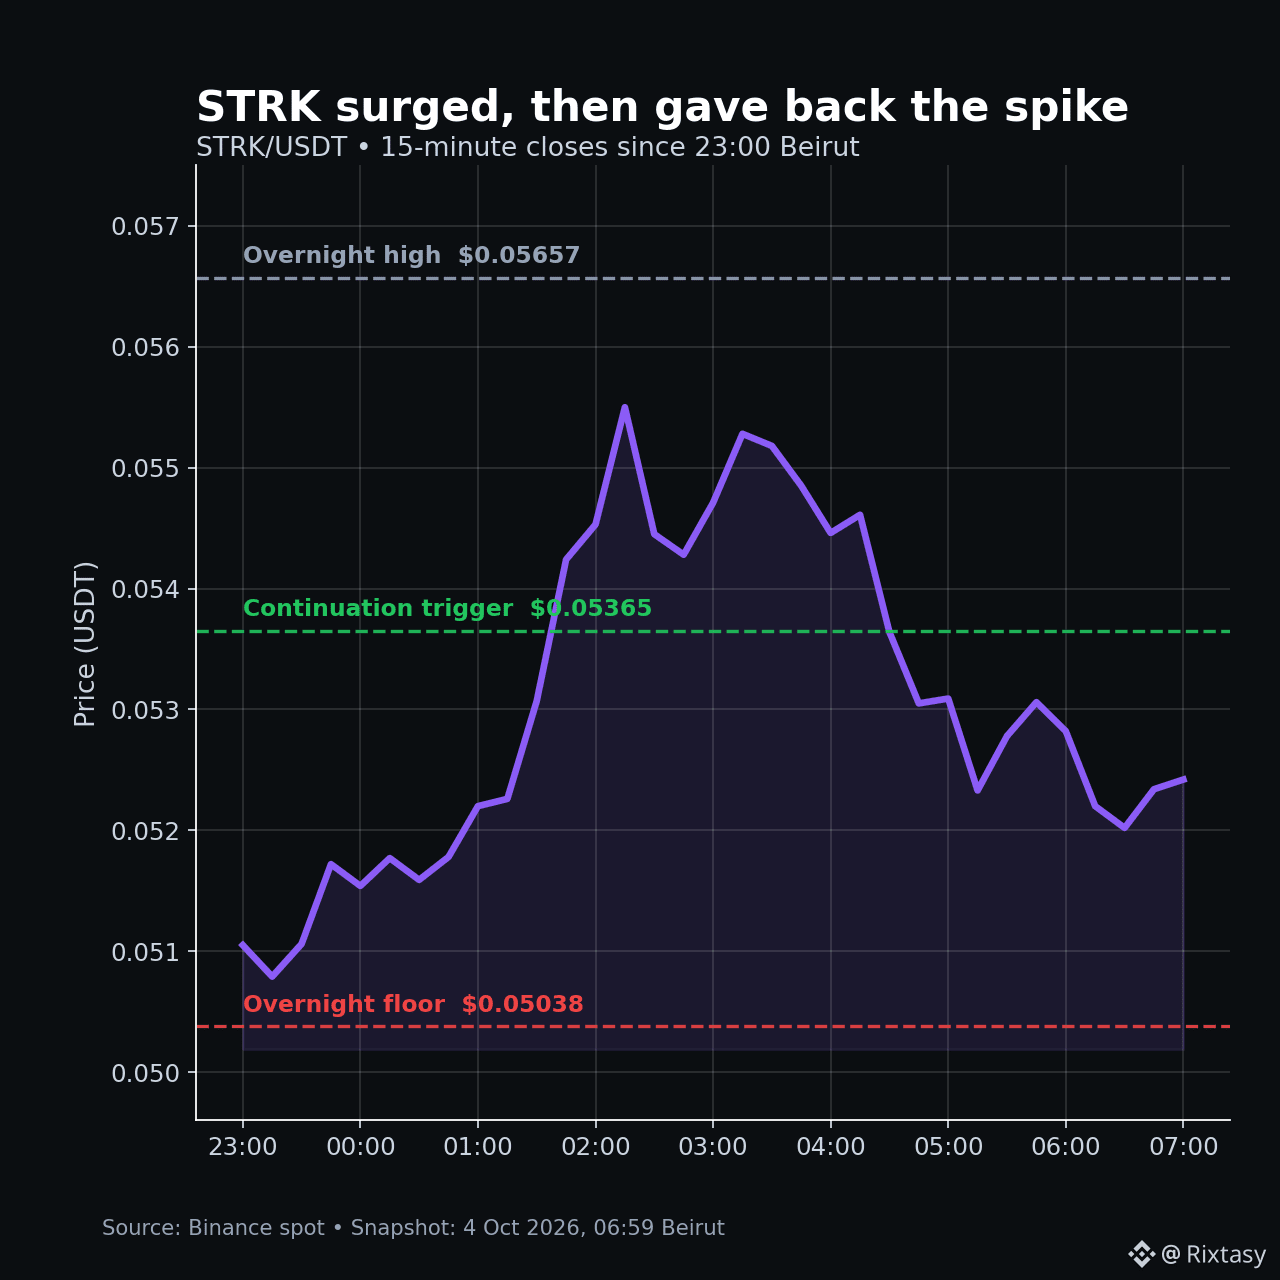
STRK is leading the liquid market, but the overnight chart is warning against chasing the headline.
At 06:59 Beirut time, $STRK traded near $0.05234, up about 20.8% over 24 hours. From 23:00 onward it gained roughly 2.0% while BTC was flat—but it also fell about 7.5% from the $0.05657 overnight high. That combination means real relative strength with clear profit-taking, not a clean one-way breakout.
Hypothetical continuation scenario: a sustained reclaim of $0.05365 would interrupt the sequence of lower intraday highs and reopen $0.0557–$0.0566. Invalidation: a break below the $0.05038 overnight low would erase the entire session advance.
The takeaway is simple: the 24-hour percentage attracts attention; the next higher low decides whether momentum survives.
Source: Binance spot, STRK/USDT 15m and 24h ticker, snapshot 4 Oct 2026 06:59 Beirut.
#STRK #Crypto
STRK is leading the liquid market, but the overnight chart is warning against chasing the headline.
At 06:59 Beirut time, $STRK traded near $0.05234, up about 20.8% over 24 hours. From 23:00 onward it gained roughly 2.0% while BTC was flat—but it also fell about 7.5% from the $0.05657 overnight high. That combination means real relative strength with clear profit-taking, not a clean one-way breakout.
Hypothetical continuation scenario: a sustained reclaim of $0.05365 would interrupt the sequence of lower intraday highs and reopen $0.0557–$0.0566. Invalidation: a break below the $0.05038 overnight low would erase the entire session advance.
The takeaway is simple: the 24-hour percentage attracts attention; the next higher low decides whether momentum survives.
Source: Binance spot, STRK/USDT 15m and 24h ticker, snapshot 4 Oct 2026 06:59 Beirut.
#STRK #Crypto
At 06:59 Beirut time, $STRK traded near $0.05234, up about 20.8% over 24 hours. From 23:00 onward it gained roughly 2.0% while BTC was flat—but it also fell about 7.5% from the $0.05657 overnight high. That combination means real relative strength with clear profit-taking, not a clean one-way breakout.
Hypothetical continuation scenario: a sustained reclaim of $0.05365 would interrupt the sequence of lower intraday highs and reopen $0.0557–$0.0566. Invalidation: a break below the $0.05038 overnight low would erase the entire session advance.
The takeaway is simple: the 24-hour percentage attracts attention; the next higher low decides whether momentum survives.
Source: Binance spot, STRK/USDT 15m and 24h ticker, snapshot 4 Oct 2026 06:59 Beirut.
#STRK #Crypto
133
·
--
CRV cleared the level that mattered—but the close matters more than the first wick.
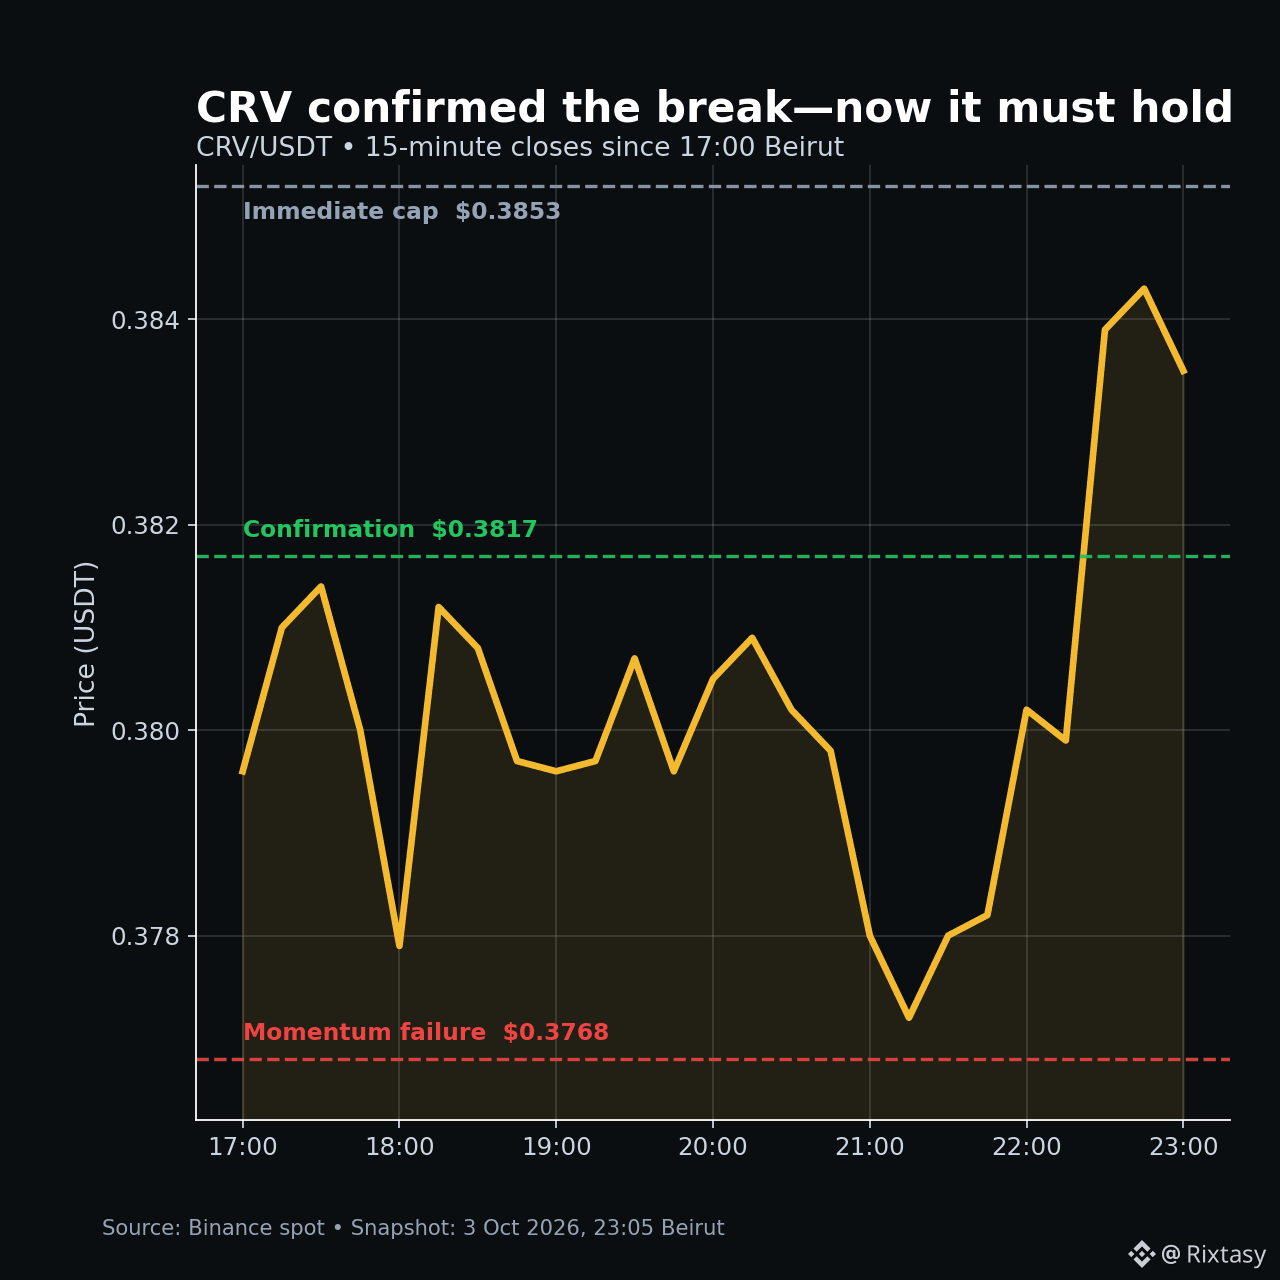
At 23:05 Beirut time, $CRV traded near $0.3837 after reaching $0.3853, above the $0.3817 confirmation level from the earlier setup. Since 17:00, CRV gained about 1.2% while BTC was essentially flat. That confirms the relative-strength signal; it does not guarantee continuation.
The next test is simple: can buyers hold $0.3817 through Sunday? A dip below that level followed by a quick reclaim would keep the breakout constructive. A sustained loss of $0.3768—the post-trigger session low—would show that momentum has faded. The immediate ceiling remains $0.3853.
Useful lesson from today: confirmation is an event; acceptance is a process. The weekend close will tell us which one this was.
Source: Binance spot, CRV/USDT 15m, snapshot 3 Oct 2026 23:05 Beirut.
#CRV #DeFi
CRV cleared the level that mattered—but the close matters more than the first wick.
At 23:05 Beirut time, $CRV traded near $0.3837 after reaching $0.3853, above the $0.3817 confirmation level from the earlier setup. Since 17:00, CRV gained about 1.2% while BTC was essentially flat. That confirms the relative-strength signal; it does not guarantee continuation.
The next test is simple: can buyers hold $0.3817 through Sunday? A dip below that level followed by a quick reclaim would keep the breakout constructive. A sustained loss of $0.3768—the post-trigger session low—would show that momentum has faded. The immediate ceiling remains $0.3853.
Useful lesson from today: confirmation is an event; acceptance is a process. The weekend close will tell us which one this was.
Source: Binance spot, CRV/USDT 15m, snapshot 3 Oct 2026 23:05 Beirut.
#CRV #DeFi
At 23:05 Beirut time, $CRV traded near $0.3837 after reaching $0.3853, above the $0.3817 confirmation level from the earlier setup. Since 17:00, CRV gained about 1.2% while BTC was essentially flat. That confirms the relative-strength signal; it does not guarantee continuation.
The next test is simple: can buyers hold $0.3817 through Sunday? A dip below that level followed by a quick reclaim would keep the breakout constructive. A sustained loss of $0.3768—the post-trigger session low—would show that momentum has faded. The immediate ceiling remains $0.3853.
Useful lesson from today: confirmation is an event; acceptance is a process. The weekend close will tell us which one this was.
Source: Binance spot, CRV/USDT 15m, snapshot 3 Oct 2026 23:05 Beirut.
#CRV #DeFi
118
·
--
CRV is holding up while the majors retreat—and that is worth watching, but it is not proof of a short squeeze.
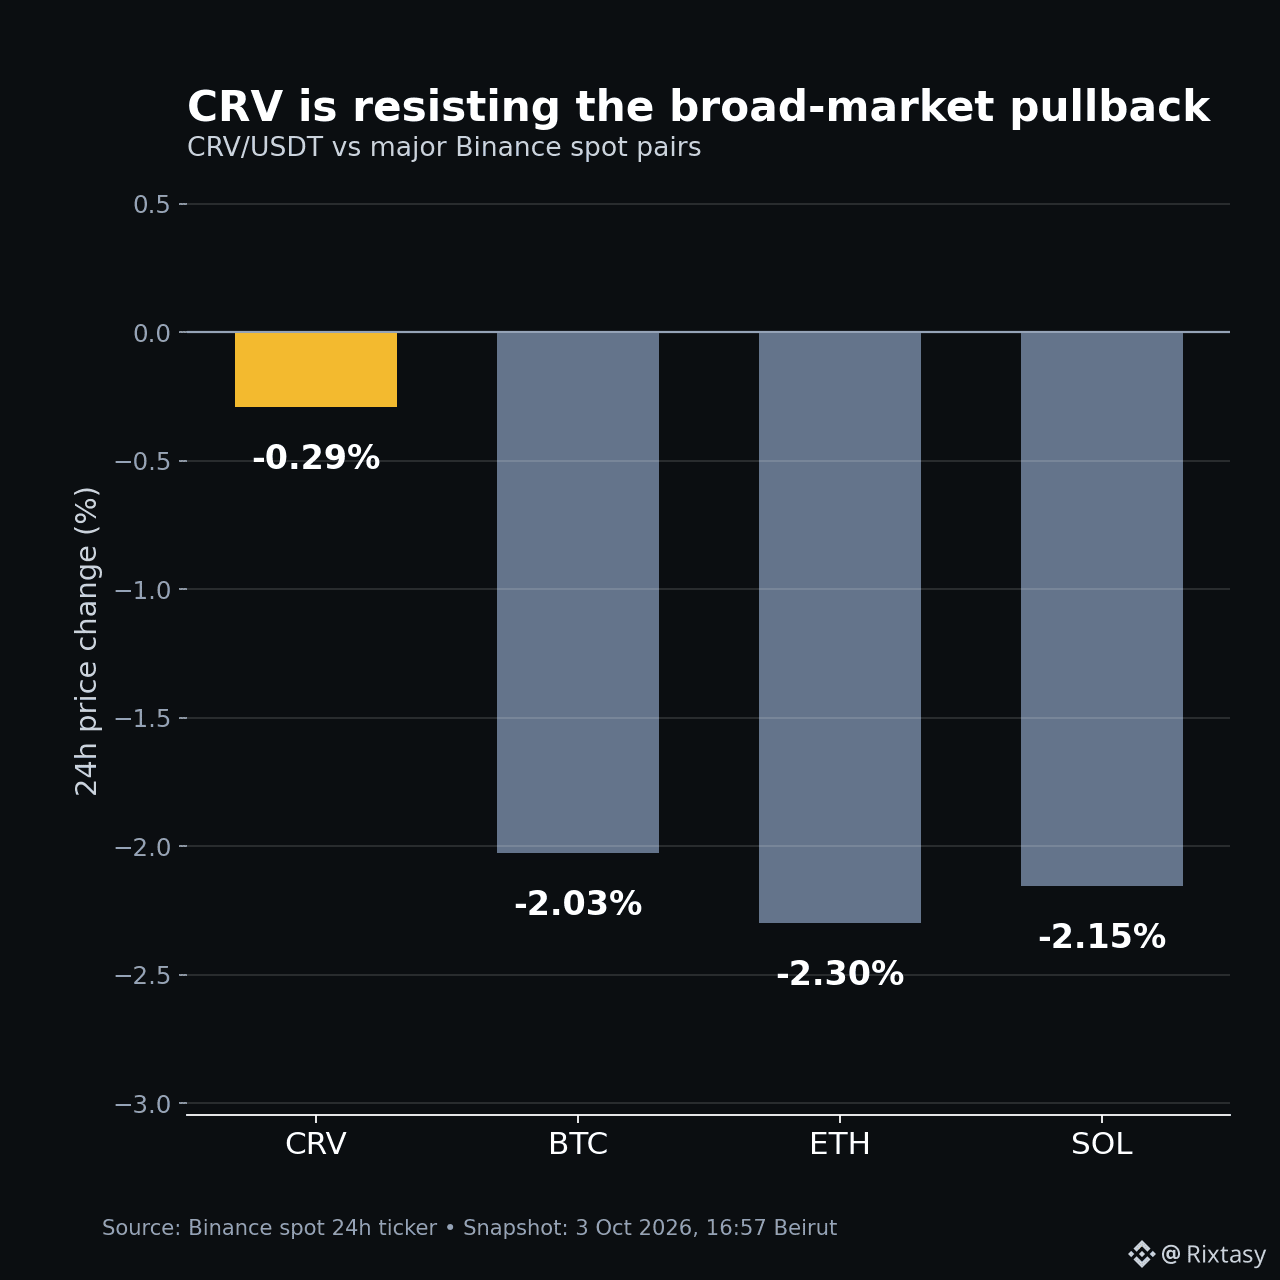
At 16:57 Beirut time, $CRV was down just 0.29% over 24 hours at $0.3787. In the same Binance spot snapshot, BTC was -2.03%, ETH -2.30% and SOL -2.15%. That gap is relative strength: sellers have made less progress in CRV than across the large-cap market.
The distinction matters. Relative strength can precede a breakout, but it can also disappear as soon as the broader market weakens again. A hypothetical confirmation would be a sustained move above the 24-hour high near $0.3817 while BTC stabilizes. A loss of the 24-hour low near $0.3545 would invalidate the resilience thesis.
One clean takeaway: watch the range, not the narrative. Strength is observable; the reason behind it is still unconfirmed.
Source: Binance spot, CRV/USDT, 24h snapshot, 3 Oct 2026 16:57 Beirut.
#CRV #DeFi
CRV is holding up while the majors retreat—and that is worth watching, but it is not proof of a short squeeze.
At 16:57 Beirut time, $CRV was down just 0.29% over 24 hours at $0.3787. In the same Binance spot snapshot, BTC was -2.03%, ETH -2.30% and SOL -2.15%. That gap is relative strength: sellers have made less progress in CRV than across the large-cap market.
The distinction matters. Relative strength can precede a breakout, but it can also disappear as soon as the broader market weakens again. A hypothetical confirmation would be a sustained move above the 24-hour high near $0.3817 while BTC stabilizes. A loss of the 24-hour low near $0.3545 would invalidate the resilience thesis.
One clean takeaway: watch the range, not the narrative. Strength is observable; the reason behind it is still unconfirmed.
Source: Binance spot, CRV/USDT, 24h snapshot, 3 Oct 2026 16:57 Beirut.
#CRV #DeFi
At 16:57 Beirut time, $CRV was down just 0.29% over 24 hours at $0.3787. In the same Binance spot snapshot, BTC was -2.03%, ETH -2.30% and SOL -2.15%. That gap is relative strength: sellers have made less progress in CRV than across the large-cap market.
The distinction matters. Relative strength can precede a breakout, but it can also disappear as soon as the broader market weakens again. A hypothetical confirmation would be a sustained move above the 24-hour high near $0.3817 while BTC stabilizes. A loss of the 24-hour low near $0.3545 would invalidate the resilience thesis.
One clean takeaway: watch the range, not the narrative. Strength is observable; the reason behind it is still unconfirmed.
Source: Binance spot, CRV/USDT, 24h snapshot, 3 Oct 2026 16:57 Beirut.
#CRV #DeFi
126
·
--
$SAND is at the decision point from this morning’s setup—not a confirmed breakdown yet.
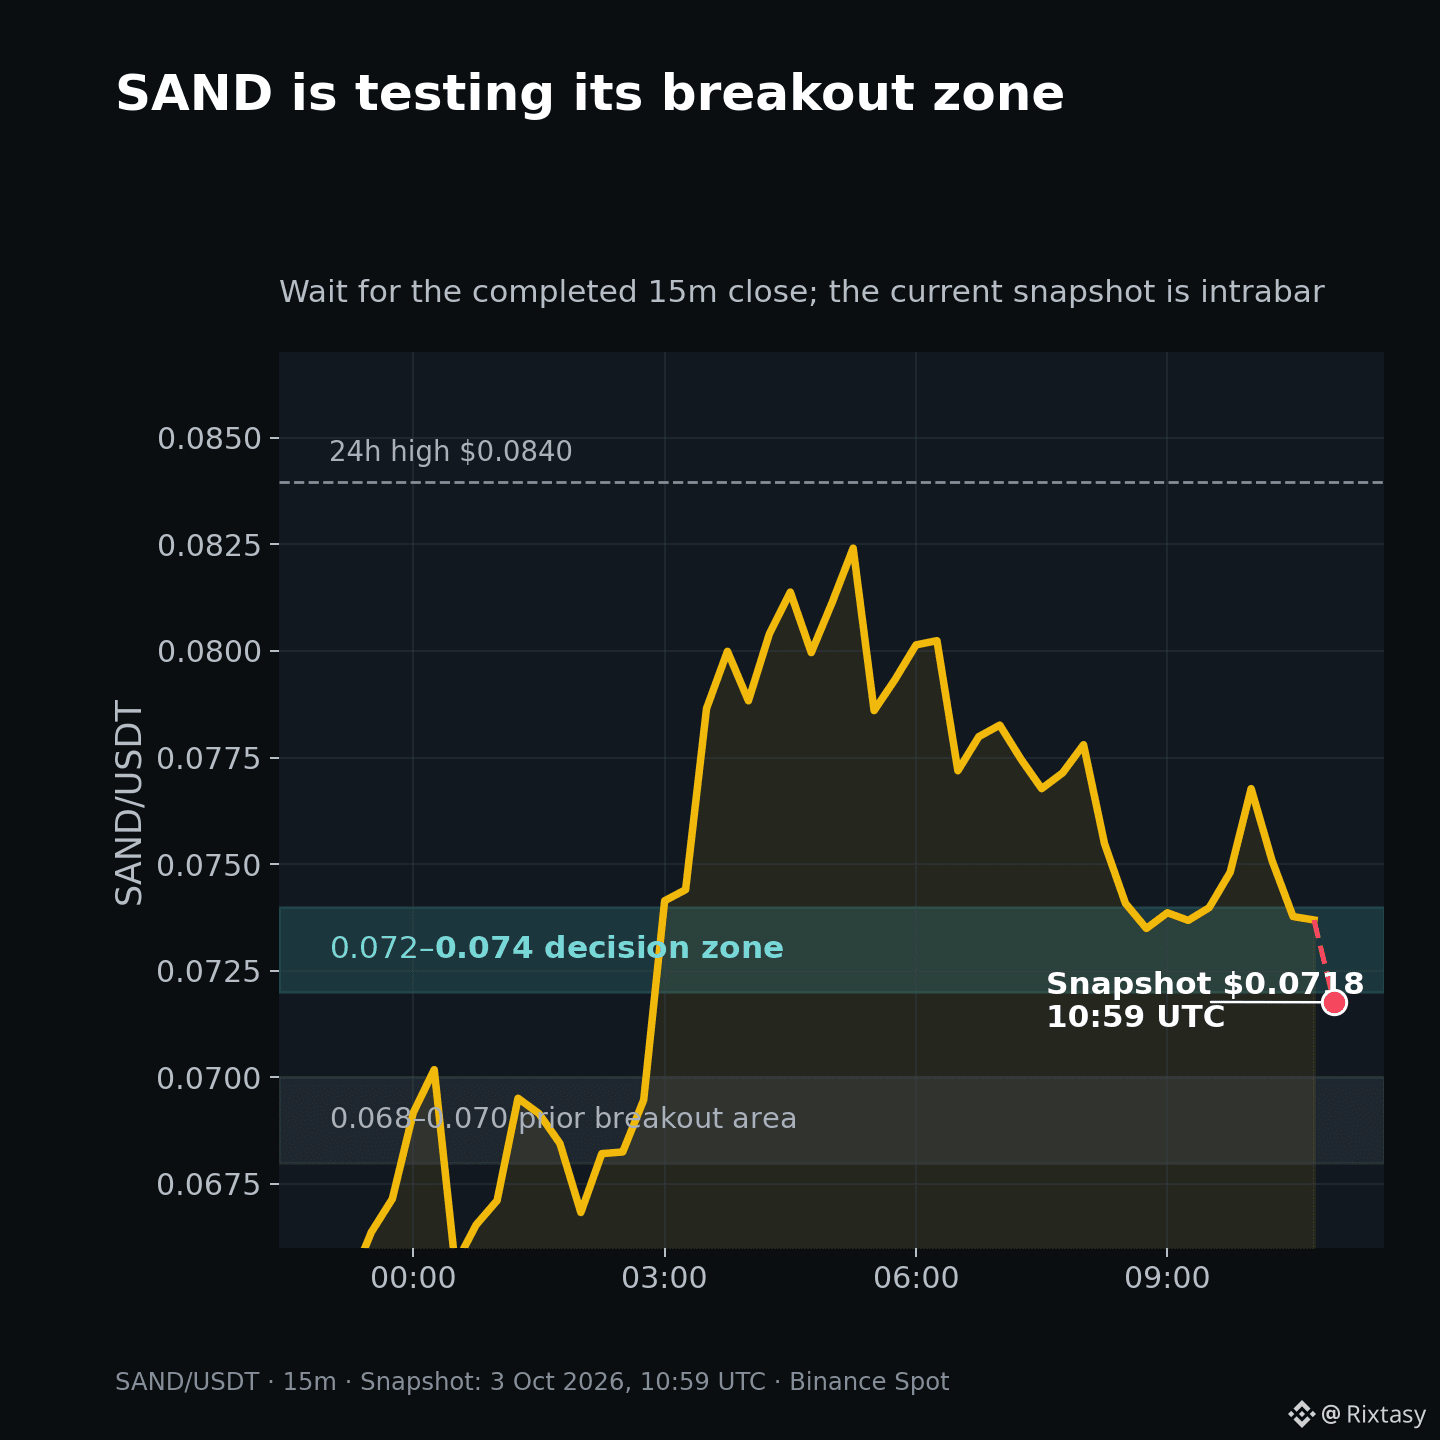
After reaching $0.08396, price retraced into the $0.072–$0.074 breakout zone. At the 13:59 Beirut snapshot, SAND/USDT was near $0.0718, below that area, but the current 15-minute candle was still open. That distinction matters: an intrabar move is not the same as a confirmed close.
Hypothetical scenario:
• Continuation requires a completed 15m close back above $0.074, followed by a hold on retest. The $0.08396 high is the first resistance.
• Invalidation is a completed 15m close below $0.072. That would weaken the gaming-token rotation signal and expose the prior $0.068–$0.070 breakout area.
The morning setup: https://app.binance.com/uni-qr/cpos/373182479894164?r=AD7JH6YT&l=en
Data: Binance Spot, 3 Oct 2026. Scenario only—not a trade recommendation.
#SAND #TechnicalAnalysis
$SAND is at the decision point from this morning’s setup—not a confirmed breakdown yet.
After reaching $0.08396, price retraced into the $0.072–$0.074 breakout zone. At the 13:59 Beirut snapshot, SAND/USDT was near $0.0718, below that area, but the current 15-minute candle was still open. That distinction matters: an intrabar move is not the same as a confirmed close.
Hypothetical scenario:
• Continuation requires a completed 15m close back above $0.074, followed by a hold on retest. The $0.08396 high is the first resistance.
• Invalidation is a completed 15m close below $0.072. That would weaken the gaming-token rotation signal and expose the prior $0.068–$0.070 breakout area.
The morning setup: https://app.binance.com/uni-qr/cpos/373182479894164?r=AD7JH6YT&l=en
Data: Binance Spot, 3 Oct 2026. Scenario only—not a trade recommendation.
#SAND #TechnicalAnalysis
After reaching $0.08396, price retraced into the $0.072–$0.074 breakout zone. At the 13:59 Beirut snapshot, SAND/USDT was near $0.0718, below that area, but the current 15-minute candle was still open. That distinction matters: an intrabar move is not the same as a confirmed close.
Hypothetical scenario:
• Continuation requires a completed 15m close back above $0.074, followed by a hold on retest. The $0.08396 high is the first resistance.
• Invalidation is a completed 15m close below $0.072. That would weaken the gaming-token rotation signal and expose the prior $0.068–$0.070 breakout area.
The morning setup: https://app.binance.com/uni-qr/cpos/373182479894164?r=AD7JH6YT&l=en
Data: Binance Spot, 3 Oct 2026. Scenario only—not a trade recommendation.
#SAND #TechnicalAnalysis
154
·
--
I see lots of Shorts on $CRV 👀👀
Must mean only one thingg.. MOONN BABYYY 🚀🚀🚀🚀
I see lots of Shorts on $CRV 👀👀
Must mean only one thingg.. MOONN BABYYY 🚀🚀🚀🚀
Must mean only one thingg.. MOONN BABYYY 🚀🚀🚀🚀
3
221
·
--
The overnight winner was not a major coin. It was a gaming-token cluster led by $SAND.
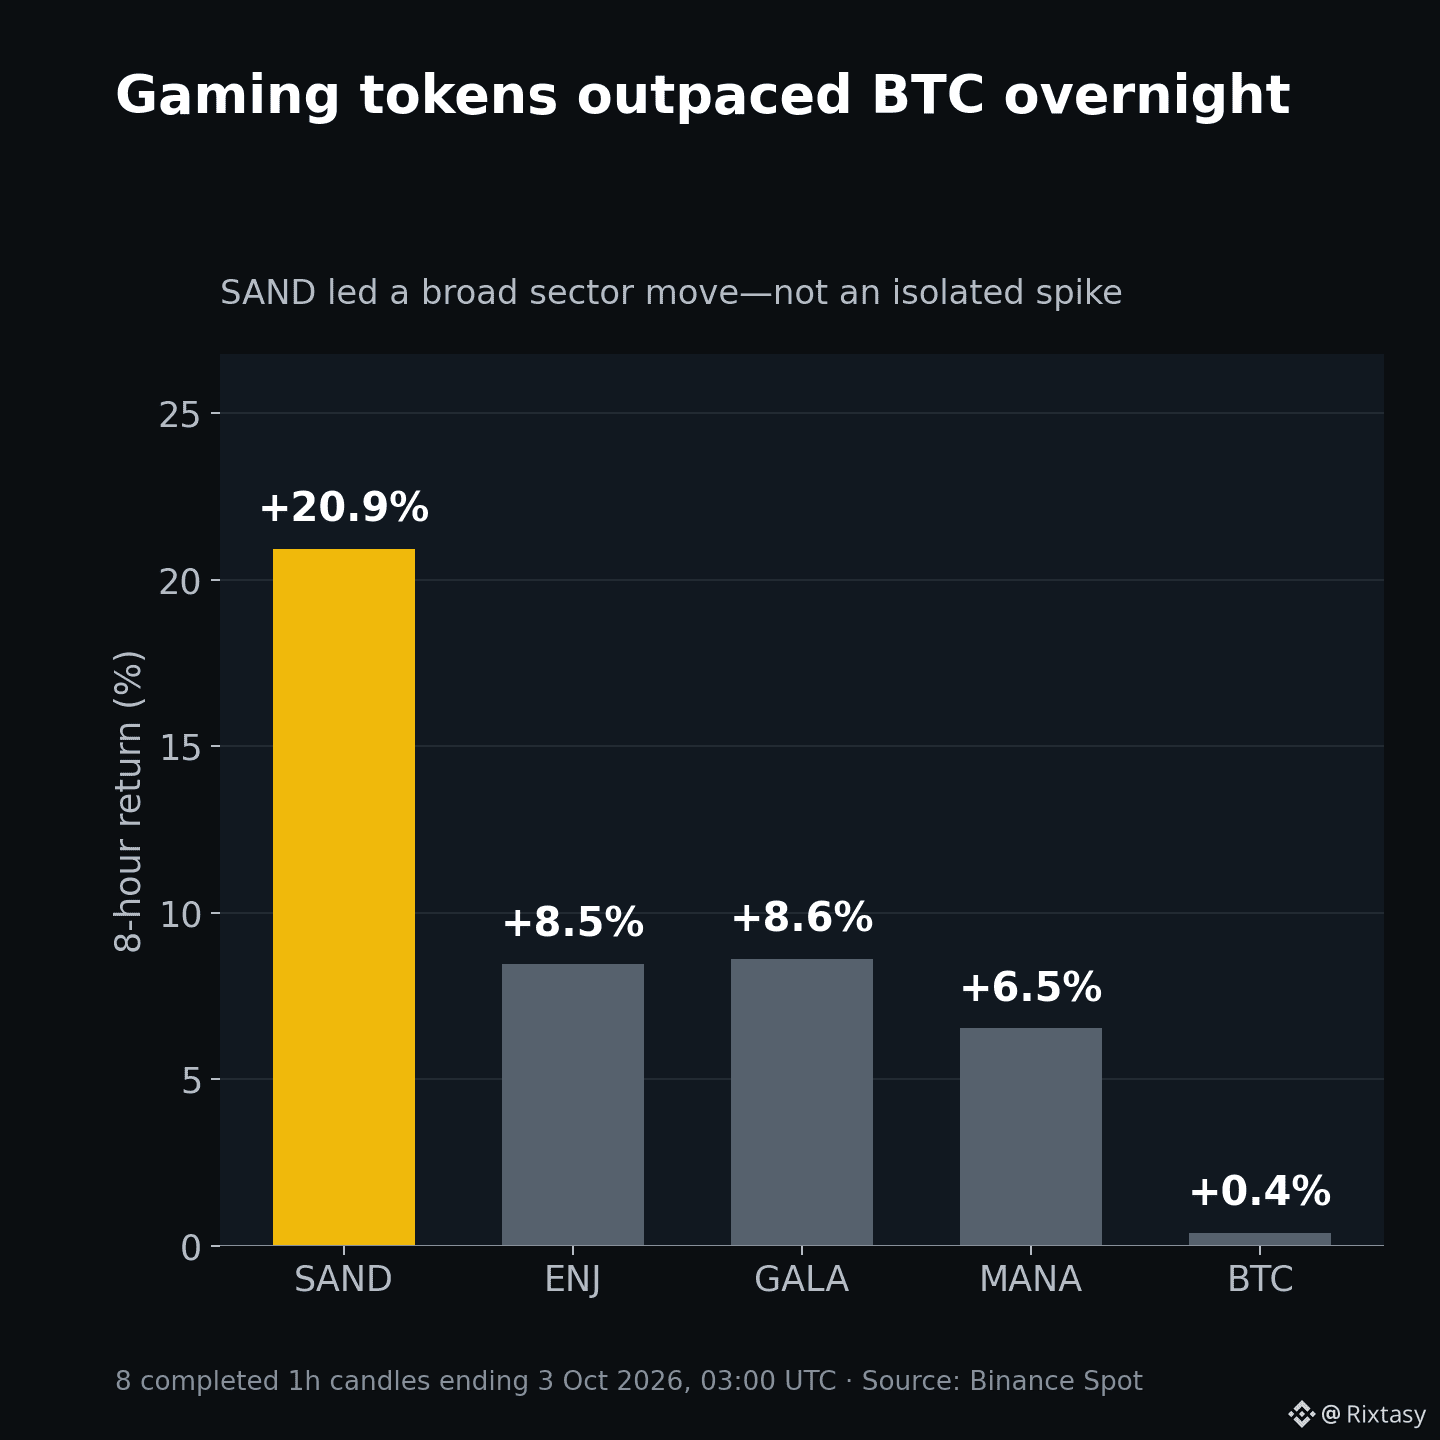
Across eight completed hourly candles ending 03:00 UTC, SAND gained 20.9%. ENJ, GALA and MANA rose 6.5%–8.6%, while BTC added just 0.4%. Near 07:00 Beirut time, SAND/USDT traded around $0.079—roughly 77% higher over 24 hours after touching $0.0827.
Why this matters: several related tokens moving together points to sector rotation, not one random candle. But breadth does not remove the risk of chasing. No fresh official project announcement was confirmed during this window, so price action—not a verified fundamental catalyst—is the evidence.
The next useful test is simple: can SAND hold the $0.072–$0.074 breakout area and then reclaim $0.0827? Losing that zone would weaken the rotation signal; holding it would show buyers are defending the move.
Data: Binance Spot, 3 Oct 2026. Observational, not a trade recommendation.
#SAND #GamingTokens
The overnight winner was not a major coin. It was a gaming-token cluster led by $SAND .
Across eight completed hourly candles ending 03:00 UTC, SAND gained 20.9%. ENJ, GALA and MANA rose 6.5%–8.6%, while BTC added just 0.4%. Near 07:00 Beirut time, SAND/USDT traded around $0.079—roughly 77% higher over 24 hours after touching $0.0827.
Why this matters: several related tokens moving together points to sector rotation, not one random candle. But breadth does not remove the risk of chasing. No fresh official project announcement was confirmed during this window, so price action—not a verified fundamental catalyst—is the evidence.
The next useful test is simple: can SAND hold the $0.072–$0.074 breakout area and then reclaim $0.0827? Losing that zone would weaken the rotation signal; holding it would show buyers are defending the move.
Data: Binance Spot, 3 Oct 2026. Observational, not a trade recommendation.
#SAND #GamingTokens
Across eight completed hourly candles ending 03:00 UTC, SAND gained 20.9%. ENJ, GALA and MANA rose 6.5%–8.6%, while BTC added just 0.4%. Near 07:00 Beirut time, SAND/USDT traded around $0.079—roughly 77% higher over 24 hours after touching $0.0827.
Why this matters: several related tokens moving together points to sector rotation, not one random candle. But breadth does not remove the risk of chasing. No fresh official project announcement was confirmed during this window, so price action—not a verified fundamental catalyst—is the evidence.
The next useful test is simple: can SAND hold the $0.072–$0.074 breakout area and then reclaim $0.0827? Losing that zone would weaken the rotation signal; holding it would show buyers are defending the move.
Data: Binance Spot, 3 Oct 2026. Observational, not a trade recommendation.
#SAND #GamingTokens
475
·
--
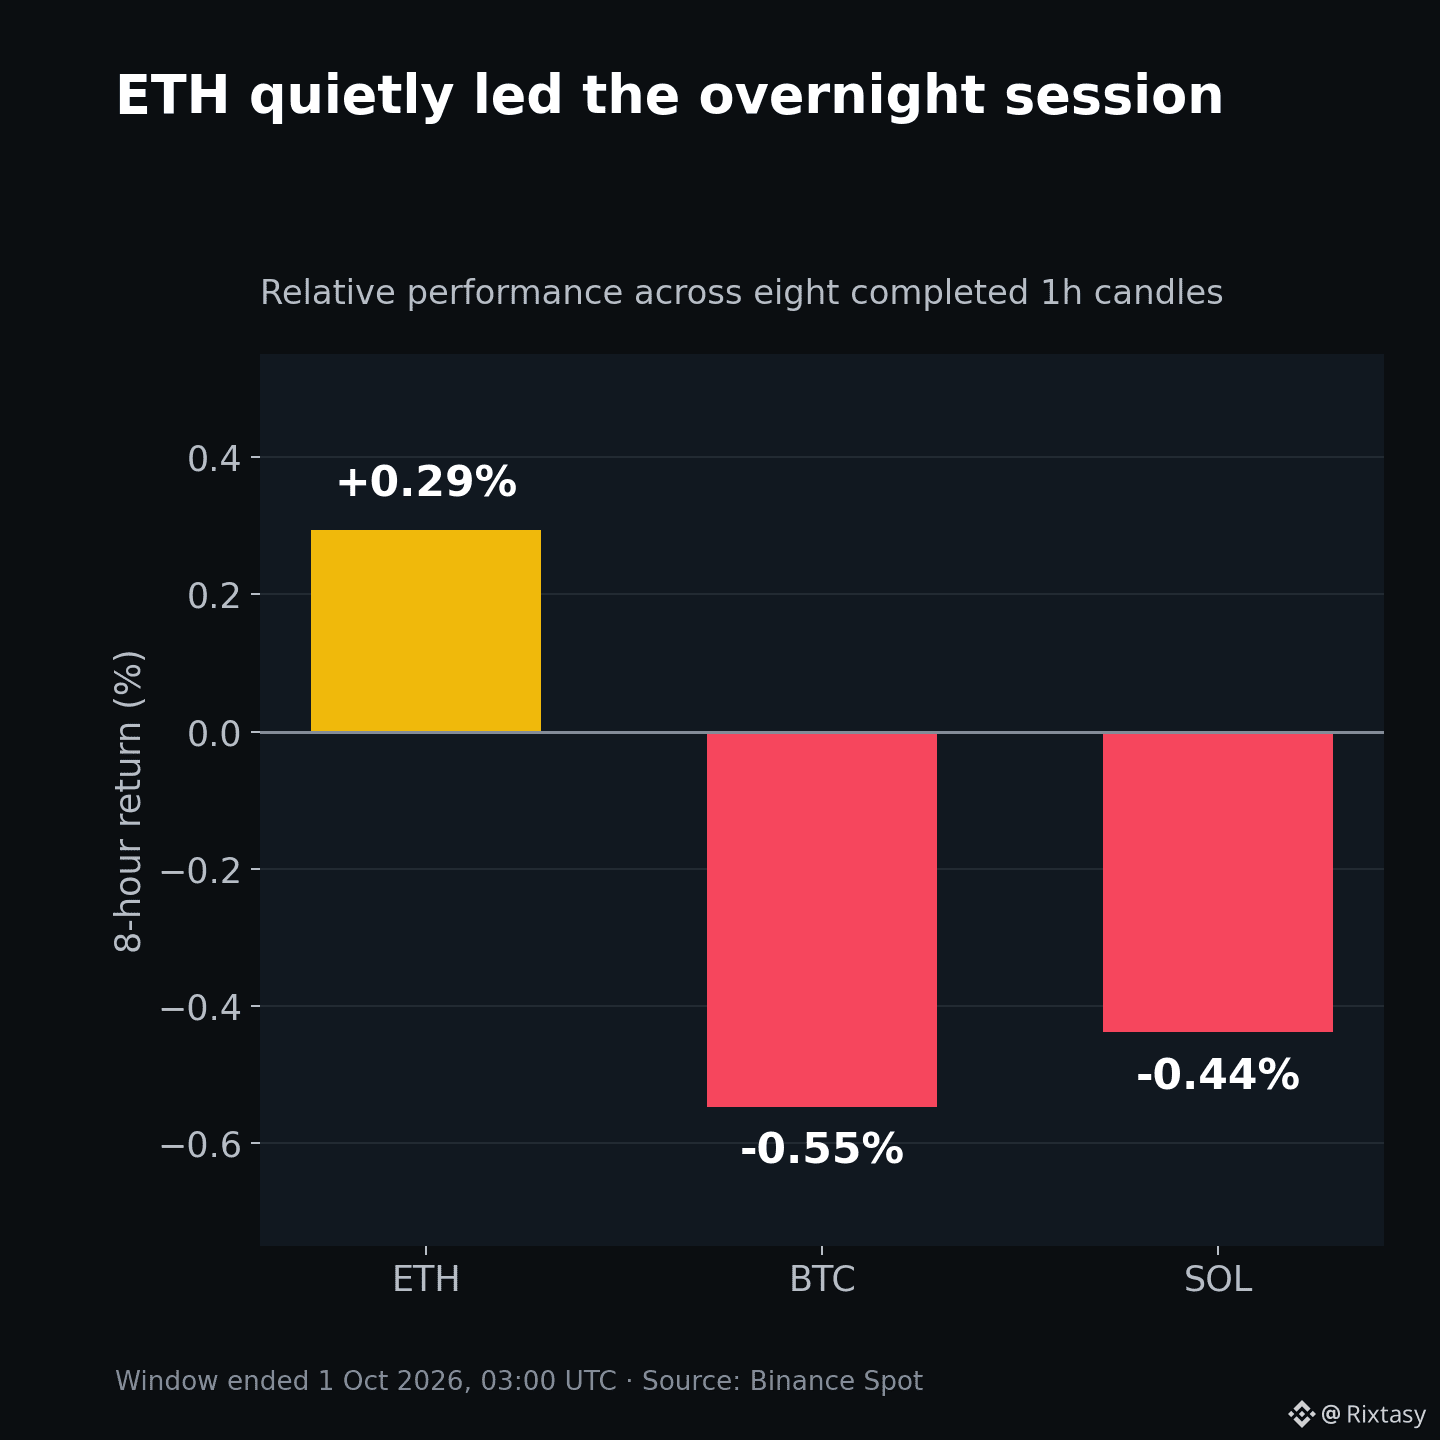
$ETH quietly won the overnight session—but it still has to turn relative strength into a real breakout.
Across eight completed hourly candles ending 03:00 UTC, ETH gained 0.29% while BTC fell 0.55% and SOL slipped 0.44%. At 07:00 Beirut time, ETH/USDT traded near $2,696 and was up roughly 1.0% over 24 hours.
Why it matters: relative strength can appear before price breaks higher, but one eight-hour window is only an early clue. $2,700 is the immediate test; holding above it would put the $2,738.51 daily high back in focus. A move below the $2,667.94 overnight low would erase the advantage and return ETH to the same weak range as the broader market.
The useful question this morning is not whether ETH outperformed—it did. It is whether buyers can defend that lead once liquidity returns.
Data: Binance Spot, 1 Oct 2026. Levels are observational, not a trade recommendation.
#ETH #CryptoMarkets
$ETH quietly won the overnight session—but it still has to turn relative strength into a real breakout.
Across eight completed hourly candles ending 03:00 UTC, ETH gained 0.29% while BTC fell 0.55% and SOL slipped 0.44%. At 07:00 Beirut time, ETH/USDT traded near $2,696 and was up roughly 1.0% over 24 hours.
Why it matters: relative strength can appear before price breaks higher, but one eight-hour window is only an early clue. $2,700 is the immediate test; holding above it would put the $2,738.51 daily high back in focus. A move below the $2,667.94 overnight low would erase the advantage and return ETH to the same weak range as the broader market.
The useful question this morning is not whether ETH outperformed—it did. It is whether buyers can defend that lead once liquidity returns.
Data: Binance Spot, 1 Oct 2026. Levels are observational, not a trade recommendation.
#ETH #CryptoMarkets
Across eight completed hourly candles ending 03:00 UTC, ETH gained 0.29% while BTC fell 0.55% and SOL slipped 0.44%. At 07:00 Beirut time, ETH/USDT traded near $2,696 and was up roughly 1.0% over 24 hours.
Why it matters: relative strength can appear before price breaks higher, but one eight-hour window is only an early clue. $2,700 is the immediate test; holding above it would put the $2,738.51 daily high back in focus. A move below the $2,667.94 overnight low would erase the advantage and return ETH to the same weak range as the broader market.
The useful question this morning is not whether ETH outperformed—it did. It is whether buyers can defend that lead once liquidity returns.
Data: Binance Spot, 1 Oct 2026. Levels are observational, not a trade recommendation.
#ETH #CryptoMarkets
108
·
--
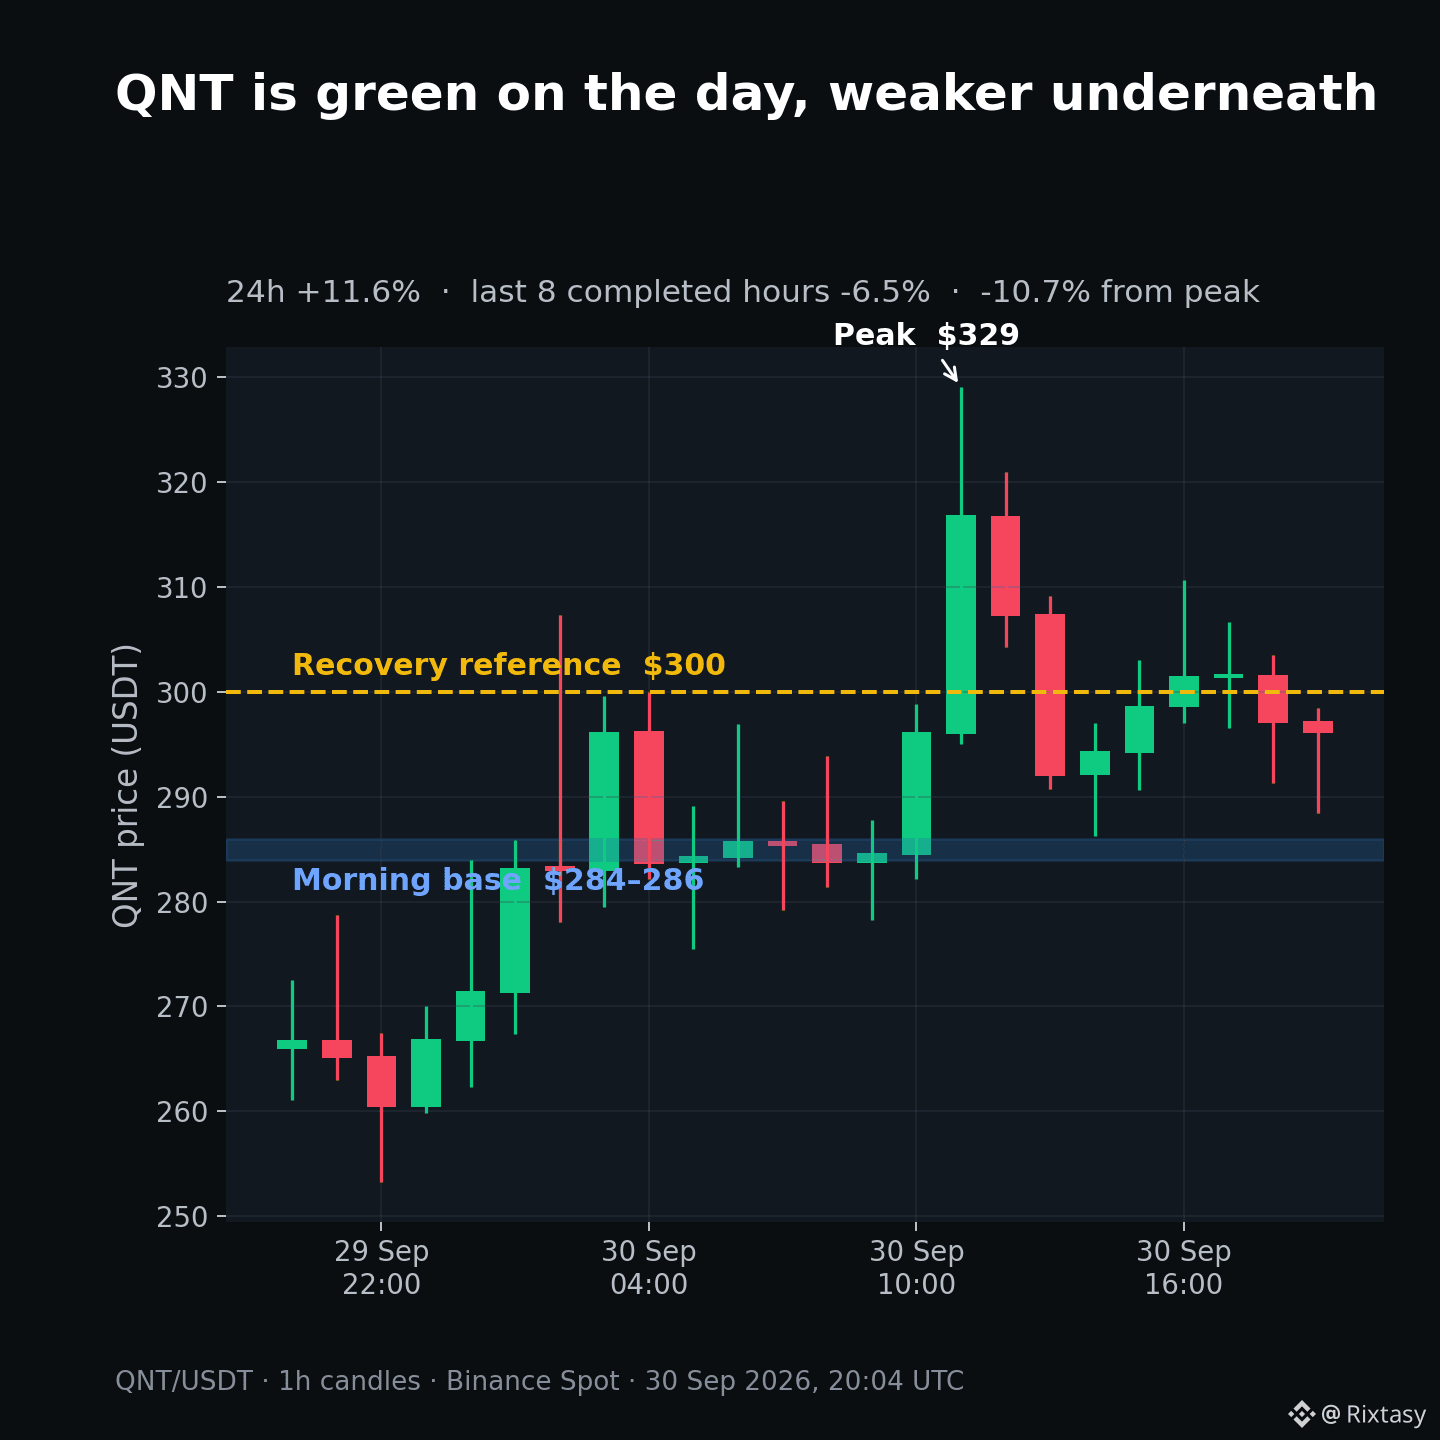
$QNT ends the day with a green headline and weaker momentum underneath.
At 23:04 Beirut time, QNT/USDT was near $293.79—still up 11.6% over 24 hours. But it sat 10.7% below the $329 peak and had lost 6.5% across the last eight completed hourly candles. That gap is why the 24-hour percentage alone can mislead.
The next checkpoint is the 00:00 UTC daily close, at 03:00 Beirut:
• Above $300: late buyers recover the lost breakout shelf.
• $284–286: the morning base and key defensive zone.
• Below $284: the move risks rotating fully back into its pre-breakout range.
Between $286 and $300, momentum is mixed—not a clean continuation. The best clue tonight is where the daily candle closes, not how dramatic the intraday high looked.
Data: Binance Spot, 30 Sep 2026, 1h candles. Levels are scenario markers, not a trade recommendation.
#QNT #MarketRecap
$QNT ends the day with a green headline and weaker momentum underneath.
At 23:04 Beirut time, QNT/USDT was near $293.79—still up 11.6% over 24 hours. But it sat 10.7% below the $329 peak and had lost 6.5% across the last eight completed hourly candles. That gap is why the 24-hour percentage alone can mislead.
The next checkpoint is the 00:00 UTC daily close, at 03:00 Beirut:
• Above $300: late buyers recover the lost breakout shelf.
• $284–286: the morning base and key defensive zone.
• Below $284: the move risks rotating fully back into its pre-breakout range.
Between $286 and $300, momentum is mixed—not a clean continuation. The best clue tonight is where the daily candle closes, not how dramatic the intraday high looked.
Data: Binance Spot, 30 Sep 2026, 1h candles. Levels are scenario markers, not a trade recommendation.
#QNT #MarketRecap
At 23:04 Beirut time, QNT/USDT was near $293.79—still up 11.6% over 24 hours. But it sat 10.7% below the $329 peak and had lost 6.5% across the last eight completed hourly candles. That gap is why the 24-hour percentage alone can mislead.
The next checkpoint is the 00:00 UTC daily close, at 03:00 Beirut:
• Above $300: late buyers recover the lost breakout shelf.
• $284–286: the morning base and key defensive zone.
• Below $284: the move risks rotating fully back into its pre-breakout range.
Between $286 and $300, momentum is mixed—not a clean continuation. The best clue tonight is where the daily candle closes, not how dramatic the intraday high looked.
Data: Binance Spot, 30 Sep 2026, 1h candles. Levels are scenario markers, not a trade recommendation.
#QNT #MarketRecap
430
·
--
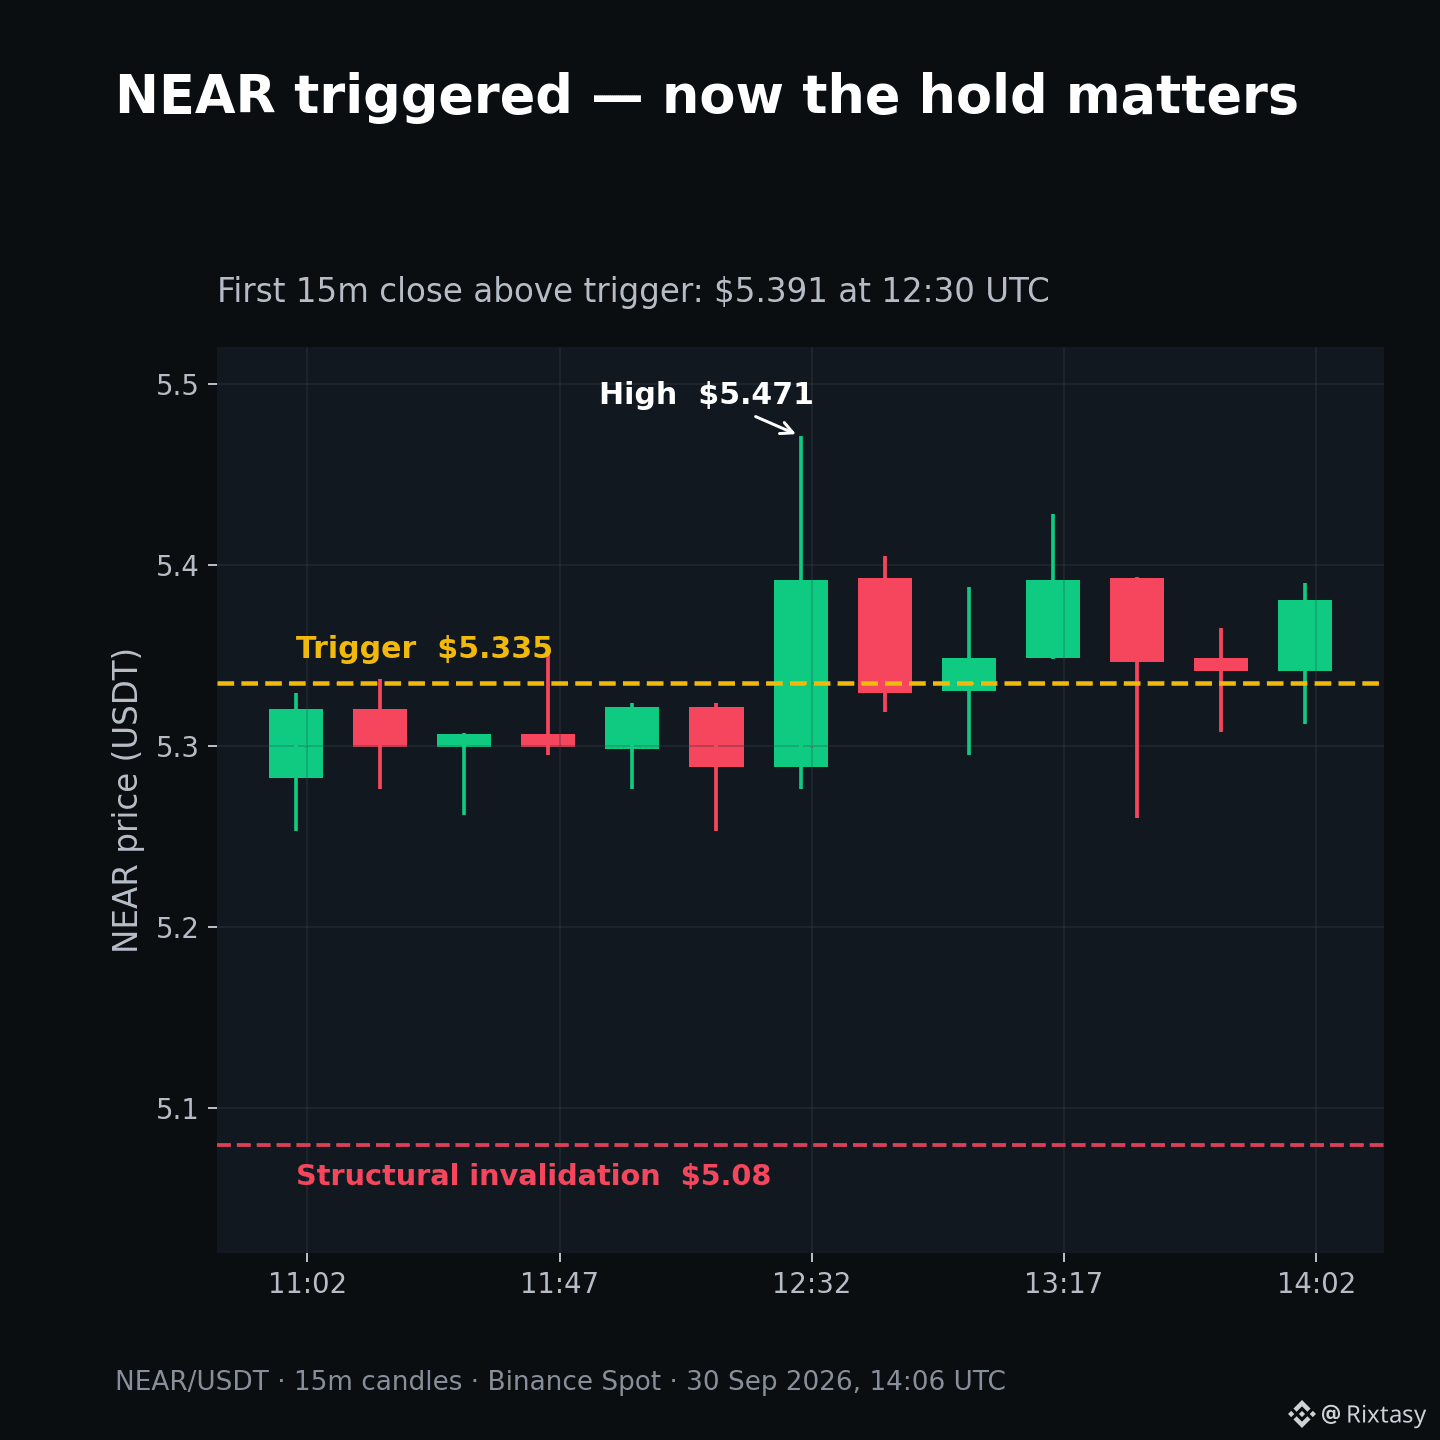
Three hours later, $NEAR confirmed the setup—but the retest shows why a trigger is not a guarantee.
The earlier scenario required a 15-minute or hourly close above $5.335, then a hold. NEAR delivered a qualifying close at $5.391, reached $5.471, and traded near $5.38 at 17:06 Beirut time. The $5.08 invalidation stayed untouched, yet price repeatedly revisited the breakout zone.
A wick above resistance can be noise. A close proves buyers controlled the interval; holding the level shows they can defend it.
For this hypothetical scenario, the structure remains constructive while $5.335 acts as support. A 15-minute close below it would weaken the breakout; $5.08 remains the broader invalidation.
Data: Binance Spot, 30 Sep 2026, 15m candles. No trade was executed.
#NEAR #TradingEducation
Three hours later, $NEAR confirmed the setup—but the retest shows why a trigger is not a guarantee.
The earlier scenario required a 15-minute or hourly close above $5.335, then a hold. NEAR delivered a qualifying close at $5.391, reached $5.471, and traded near $5.38 at 17:06 Beirut time. The $5.08 invalidation stayed untouched, yet price repeatedly revisited the breakout zone.
A wick above resistance can be noise. A close proves buyers controlled the interval; holding the level shows they can defend it.
For this hypothetical scenario, the structure remains constructive while $5.335 acts as support. A 15-minute close below it would weaken the breakout; $5.08 remains the broader invalidation.
Data: Binance Spot, 30 Sep 2026, 15m candles. No trade was executed.
#NEAR #TradingEducation
The earlier scenario required a 15-minute or hourly close above $5.335, then a hold. NEAR delivered a qualifying close at $5.391, reached $5.471, and traded near $5.38 at 17:06 Beirut time. The $5.08 invalidation stayed untouched, yet price repeatedly revisited the breakout zone.
A wick above resistance can be noise. A close proves buyers controlled the interval; holding the level shows they can defend it.
For this hypothetical scenario, the structure remains constructive while $5.335 acts as support. A 15-minute close below it would weaken the breakout; $5.08 remains the broader invalidation.
Data: Binance Spot, 30 Sep 2026, 15m candles. No trade was executed.
#NEAR #TradingEducation
80
·
--
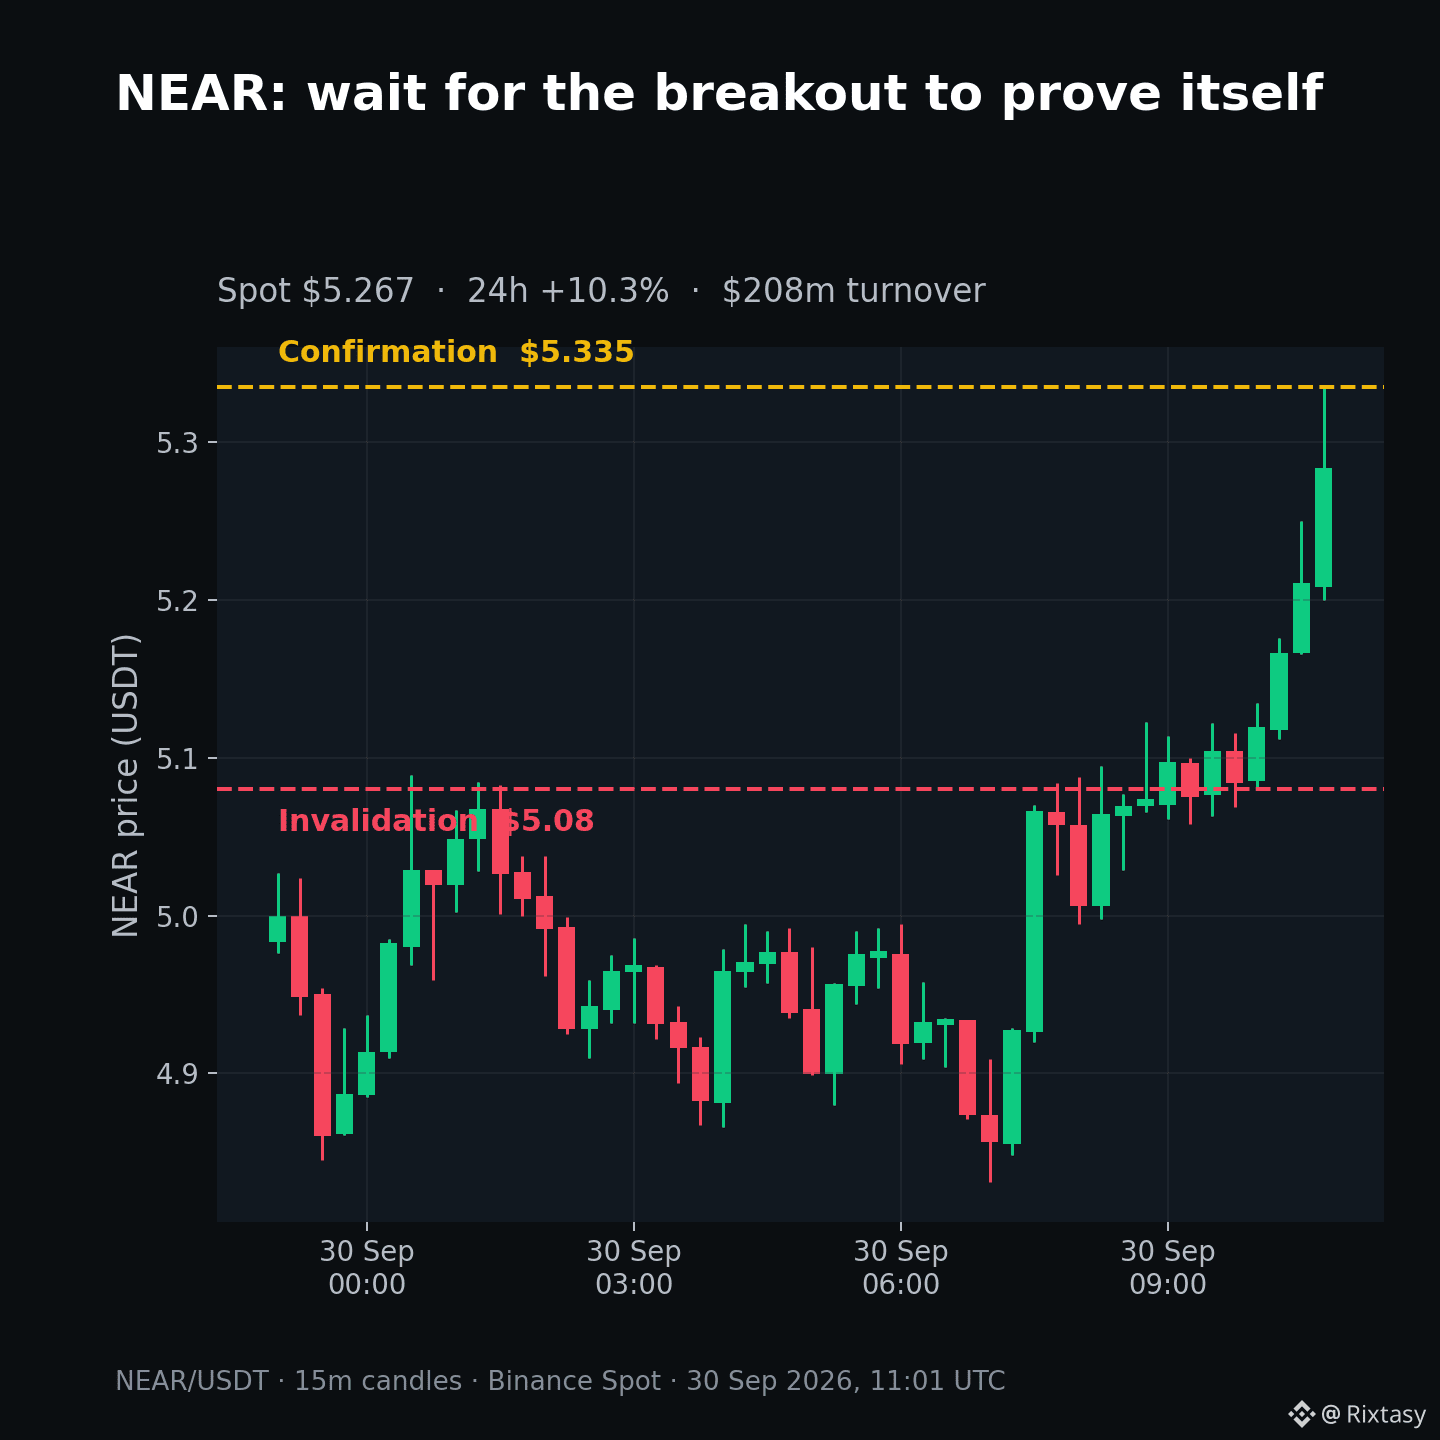
$NEAR is up 10.3% in 24 hours, but the better decision may be to wait rather than chase it.
At 14:01 Beirut time, NEAR/USDT was near $5.27 after reaching $5.335, with roughly $208 million in Binance spot turnover. The rally has real participation; the problem is that price is already extended and sitting beneath the day's high.
Hypothetical setup:
• Confirmation: a 15-minute or hourly close above $5.335, followed by a hold of the breakout.
• Rationale: that would turn today's high from resistance into support instead of another rejection point.
• Invalidation: a close below $5.08, the base of the latest impulse, would signal that buyers lost control of the breakout leg.
No confirmation means no setup. After a double-digit move, patience offers better information than buying the strongest candle.
Data: Binance Spot, 30 Sep 2026, 15m chart. This is a scenario, not a trade recommendation.
#NEAR #CryptoAnalysis
$NEAR is up 10.3% in 24 hours, but the better decision may be to wait rather than chase it.
At 14:01 Beirut time, NEAR/USDT was near $5.27 after reaching $5.335, with roughly $208 million in Binance spot turnover. The rally has real participation; the problem is that price is already extended and sitting beneath the day's high.
Hypothetical setup:
• Confirmation: a 15-minute or hourly close above $5.335, followed by a hold of the breakout.
• Rationale: that would turn today's high from resistance into support instead of another rejection point.
• Invalidation: a close below $5.08, the base of the latest impulse, would signal that buyers lost control of the breakout leg.
No confirmation means no setup. After a double-digit move, patience offers better information than buying the strongest candle.
Data: Binance Spot, 30 Sep 2026, 15m chart. This is a scenario, not a trade recommendation.
#NEAR #CryptoAnalysis
At 14:01 Beirut time, NEAR/USDT was near $5.27 after reaching $5.335, with roughly $208 million in Binance spot turnover. The rally has real participation; the problem is that price is already extended and sitting beneath the day's high.
Hypothetical setup:
• Confirmation: a 15-minute or hourly close above $5.335, followed by a hold of the breakout.
• Rationale: that would turn today's high from resistance into support instead of another rejection point.
• Invalidation: a close below $5.08, the base of the latest impulse, would signal that buyers lost control of the breakout leg.
No confirmation means no setup. After a double-digit move, patience offers better information than buying the strongest candle.
Data: Binance Spot, 30 Sep 2026, 15m chart. This is a scenario, not a trade recommendation.
#NEAR #CryptoAnalysis
108
·
--
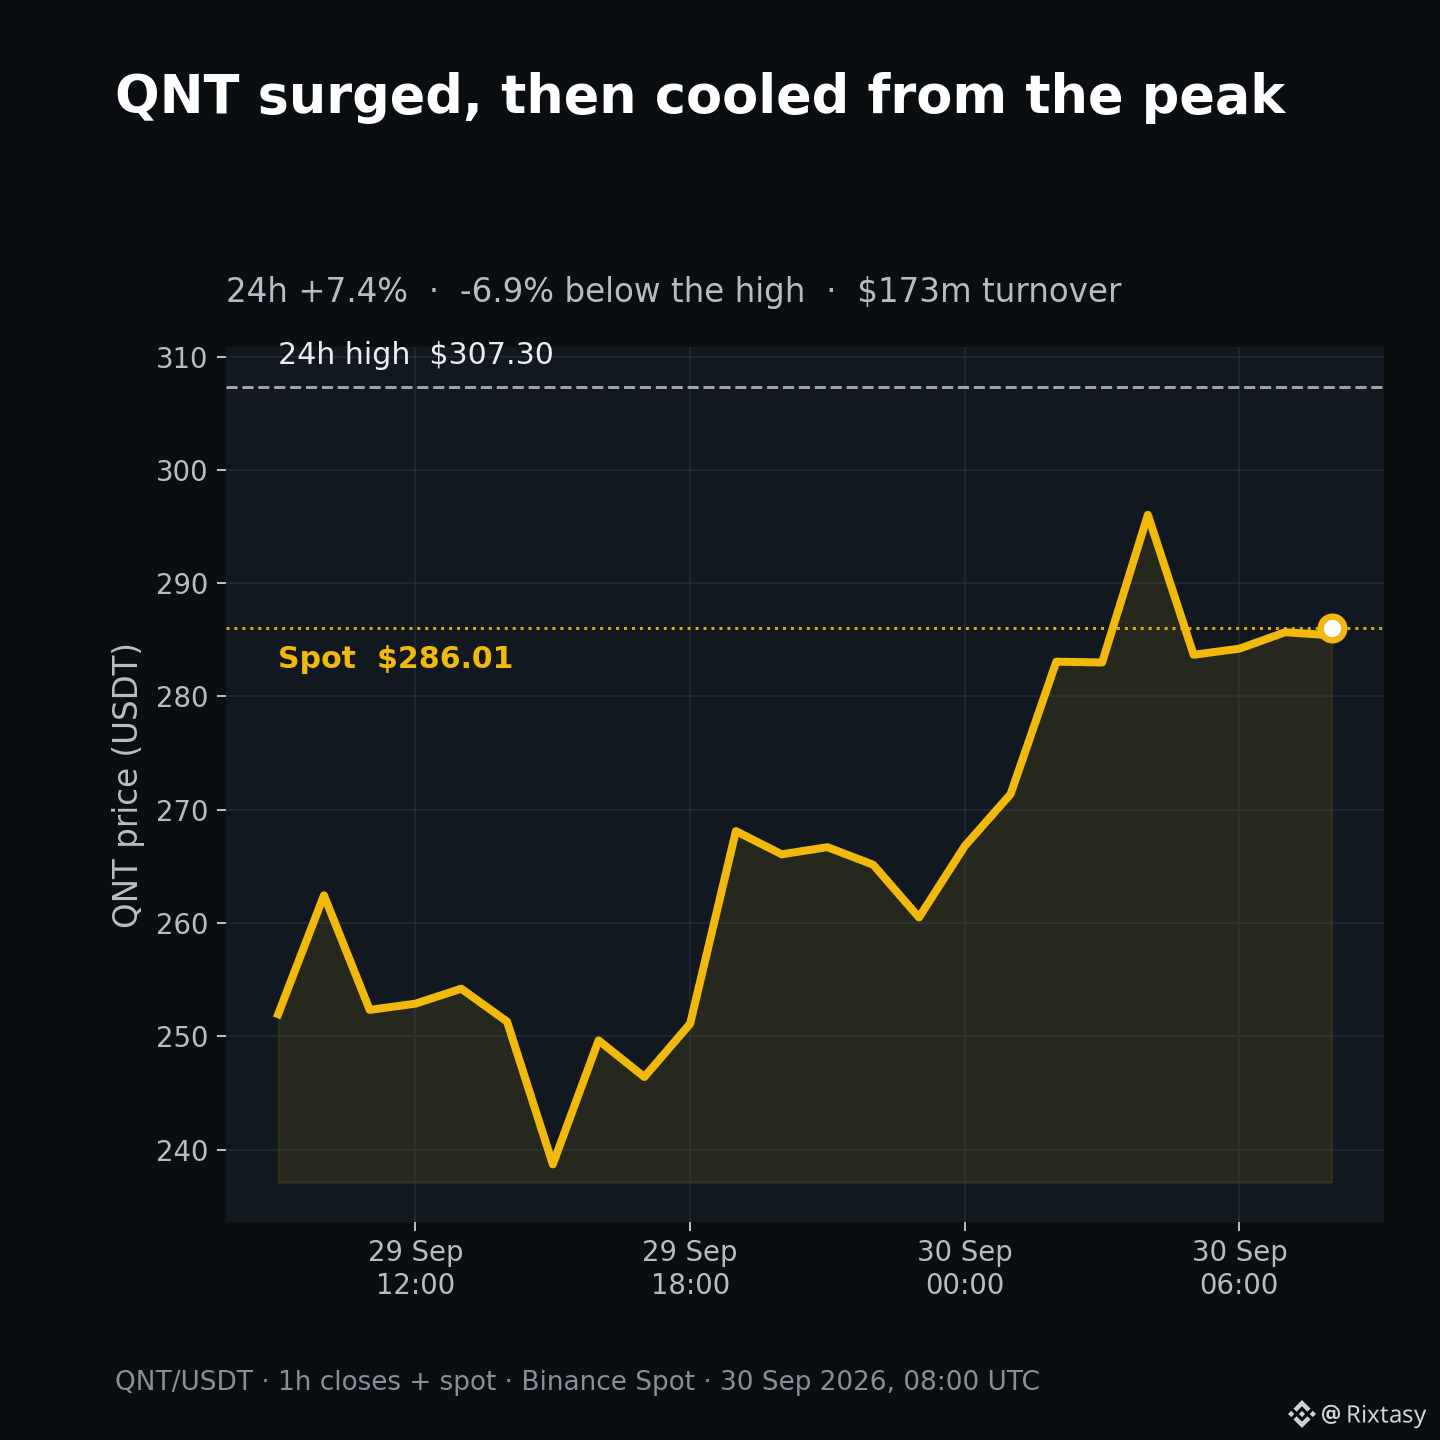
$QNT is one of Binance's clearest high-volume movers today—but the pullback from its peak matters as much as the headline gain.
At 11:00 Beirut time, QNT/USDT traded near $286, up 7.4% over 24 hours on roughly $173 million of spot turnover. It had touched $307.30 before retreating about 6.9%, so momentum is strong but buyers are no longer chasing a clean vertical move.
What sits behind the project: Quant's Overledger is designed to connect different ledgers and legacy systems. Its current Quant Flow platform adds programmable payments, bank-account automation, and support for stablecoins and tokenised deposits. Quant describes QNT as a utility token used for its products and services.
That product story explains the narrative—not today's price spike. No official announcement reviewed establishes a catalyst for this move. The practical read is simple: $307.30 is the strength benchmark; failure to reclaim it keeps this a volatile pullback, not a confirmed continuation.
Market data: Binance Spot, 30 Sep 2026. Project facts: Quant official site.
#QNT #CryptoAnalysis
$QNT is one of Binance's clearest high-volume movers today—but the pullback from its peak matters as much as the headline gain.
At 11:00 Beirut time, QNT/USDT traded near $286, up 7.4% over 24 hours on roughly $173 million of spot turnover. It had touched $307.30 before retreating about 6.9%, so momentum is strong but buyers are no longer chasing a clean vertical move.
What sits behind the project: Quant's Overledger is designed to connect different ledgers and legacy systems. Its current Quant Flow platform adds programmable payments, bank-account automation, and support for stablecoins and tokenised deposits. Quant describes QNT as a utility token used for its products and services.
That product story explains the narrative—not today's price spike. No official announcement reviewed establishes a catalyst for this move. The practical read is simple: $307.30 is the strength benchmark; failure to reclaim it keeps this a volatile pullback, not a confirmed continuation.
Market data: Binance Spot, 30 Sep 2026. Project facts: Quant official site.
#QNT #CryptoAnalysis
At 11:00 Beirut time, QNT/USDT traded near $286, up 7.4% over 24 hours on roughly $173 million of spot turnover. It had touched $307.30 before retreating about 6.9%, so momentum is strong but buyers are no longer chasing a clean vertical move.
What sits behind the project: Quant's Overledger is designed to connect different ledgers and legacy systems. Its current Quant Flow platform adds programmable payments, bank-account automation, and support for stablecoins and tokenised deposits. Quant describes QNT as a utility token used for its products and services.
That product story explains the narrative—not today's price spike. No official announcement reviewed establishes a catalyst for this move. The practical read is simple: $307.30 is the strength benchmark; failure to reclaim it keeps this a volatile pullback, not a confirmed continuation.
Market data: Binance Spot, 30 Sep 2026. Project facts: Quant official site.
#QNT #CryptoAnalysis
233
·
--
$BNB quietly led the overnight session—even after measuring it against BTC and ETH.
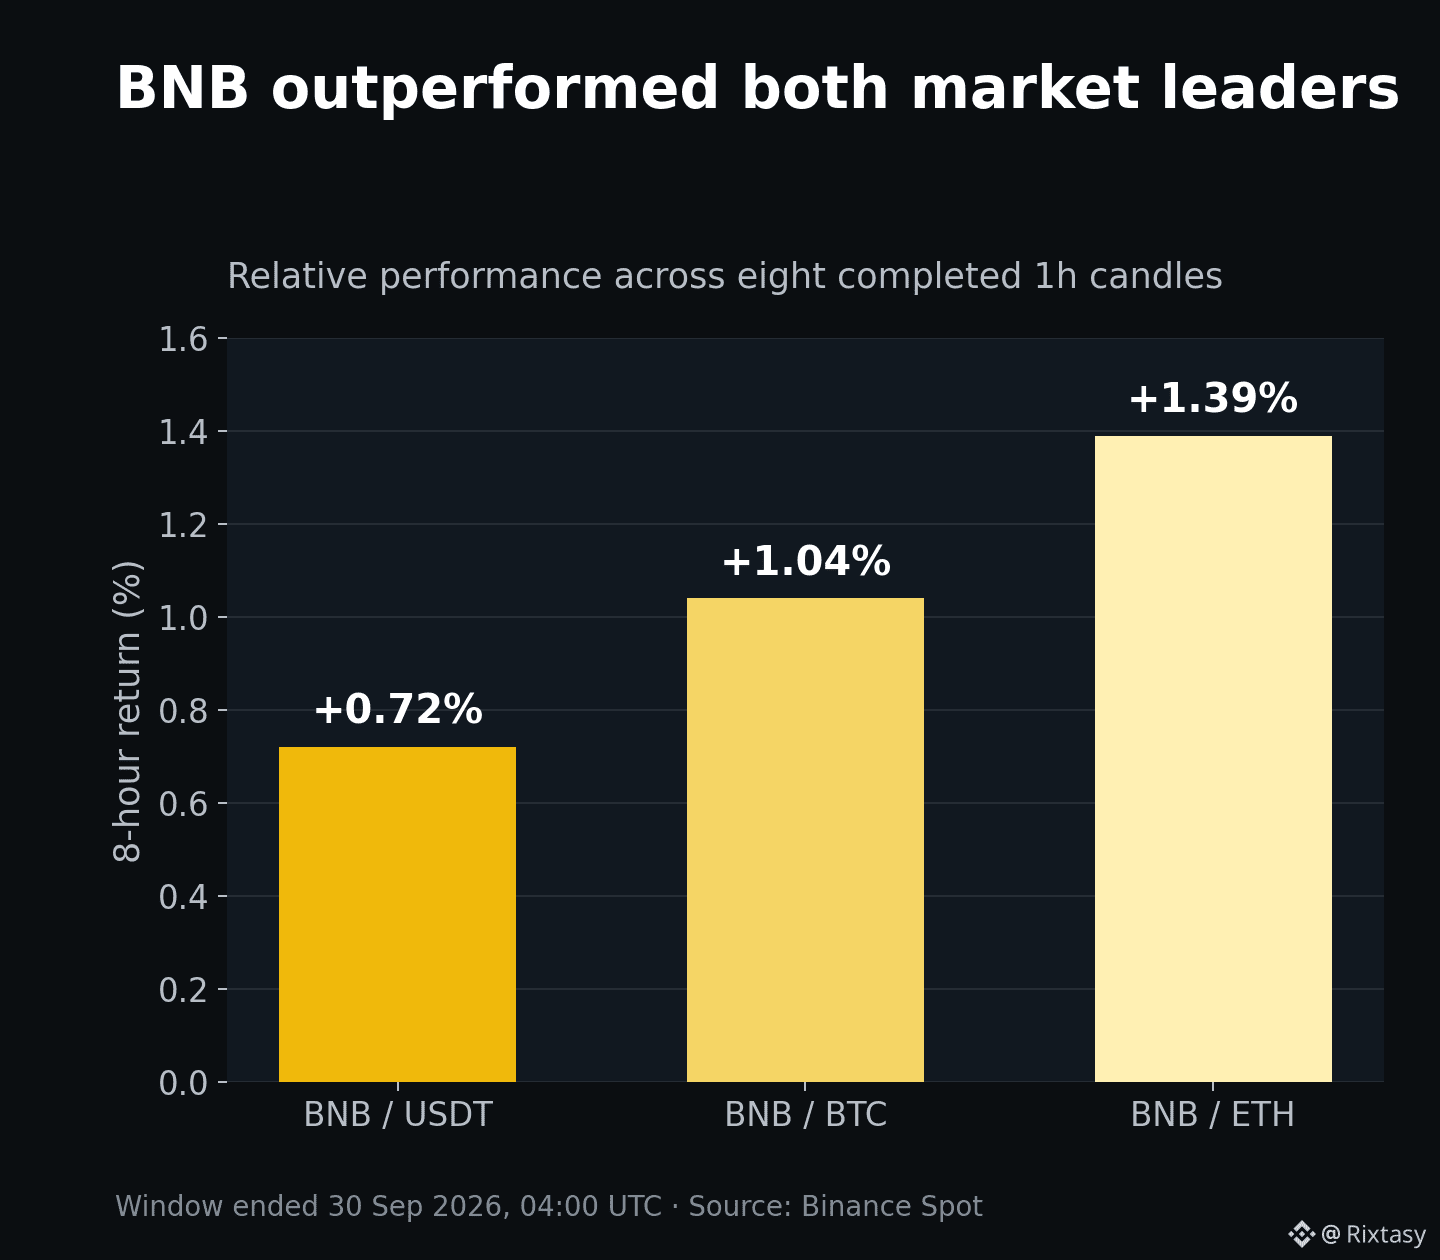
Across the last eight completed hourly candles on Binance Spot, BNB gained 0.72% against USDT. More telling: BNB/BTC rose 1.04% and BNB/ETH rose 1.39% over the same window.
That cross-pair confirmation matters. A token can rise in dollars simply because the whole market is moving; gains against both market leaders point to asset-specific relative strength.
BNB traded between $754.66 and $763.35 during the window and finished the last completed candle near $760.74. Holding above the lower half of that range would preserve the morning advantage. A break below $754.66 would erase it; a clean move through $763.35 would confirm fresh expansion.
Data: Binance Spot, eight completed 1h candles through 30 Sep 2026, 04:00 UTC.
#BNB #MarketAnalysis
$BNB quietly led the overnight session—even after measuring it against BTC and ETH.
Across the last eight completed hourly candles on Binance Spot, BNB gained 0.72% against USDT. More telling: BNB/BTC rose 1.04% and BNB/ETH rose 1.39% over the same window.
That cross-pair confirmation matters. A token can rise in dollars simply because the whole market is moving; gains against both market leaders point to asset-specific relative strength.
BNB traded between $754.66 and $763.35 during the window and finished the last completed candle near $760.74. Holding above the lower half of that range would preserve the morning advantage. A break below $754.66 would erase it; a clean move through $763.35 would confirm fresh expansion.
Data: Binance Spot, eight completed 1h candles through 30 Sep 2026, 04:00 UTC.
#BNB #MarketAnalysis
Across the last eight completed hourly candles on Binance Spot, BNB gained 0.72% against USDT. More telling: BNB/BTC rose 1.04% and BNB/ETH rose 1.39% over the same window.
That cross-pair confirmation matters. A token can rise in dollars simply because the whole market is moving; gains against both market leaders point to asset-specific relative strength.
BNB traded between $754.66 and $763.35 during the window and finished the last completed candle near $760.74. Holding above the lower half of that range would preserve the morning advantage. A break below $754.66 would erase it; a clean move through $763.35 would confirm fresh expansion.
Data: Binance Spot, eight completed 1h candles through 30 Sep 2026, 04:00 UTC.
#BNB #MarketAnalysis
80
Log in to explore more content
Join global crypto users on Binance Square
⚡️ Get latest and useful information about crypto.
💬 Trusted by the world’s largest crypto exchange.
👍 Discover real insights from verified creators.
Email / Phone number
Trending Topics
Nikkei225Jumps2.5%ToThreeMonthHigh
13,795 views
300 Discussing
#Nikkei225Jumps2.5%ToThreeMonthHigh
🚀 Nikkei 225 Jumps 2.45% to Reach a 3-Month High!
Japan’s benchmark Nikkei 225 surged impressively on Monday, closing at 69,946.86 after briefly breaking above the milestone 70,000 level for the first time in three months.
💡 What’s Driving the Surge?
AI & Semiconductor Boom: Major tech leaders like Advantest and Tokyo Electron led the charge with robust gains.
Wall Street Momentum: Positive spillover from U.S. markets boosted overall investor confidence.
Macro Shifts: Cooler-than-expected U.S. jobs data eased fears, reducing expectations of an aggressive October Fed rate hike.
📊 Market Takeaway:
This powerful rally signals a strong resurgence of investor appetite for technology and AI-driven assets. However, traders should keep a close eye on elevated bond yields as an ongoing risk factor.
Do you think the Nikkei can successfully hold above 70,000 and power toward brand-new highs? Let us know your thoughts!
#JapanStocks #StockMarket" #AIStocks #Semiconductors #Investing #Nikkei225
$EWJ
Nurul Hasnat Samir
·0 Likes
·248 views
DriftHackVictimsBeginClaims
89,611 views
986 Discussing
SolanaTokenizedStockVolumeTops$4.4BInSeptember
8,619 views
98 Discussing